Article

Emission Characteristics of Air Pollutants and CO2 from 11 Cities with Different Economic Development around the Bohai Sea in China from 2008–2017

1
College of Environmental Science and Engineering, Qingdao University, Qingdao 266000, China
2
College of Biology and the Environment, Nanjing Forestry University, Nanjing 210037, China
*
Author to whom correspondence should be addressed.
Toxics 2022, 10(9), 547; https://doi.org/10.3390/toxics10090547
Submission received: 26 August 2022 / Revised: 15 September 2022 / Accepted: 16 September 2022 / Published: 19 September 2022

Abstract

:
Cities around the Bohai Sea are one of the main population cluster areas in China, which are characterized by high levels of sustainability performance and human capital, as well as resource-intensive industries. In this study, levels of economic development metrics and emissions of air pollutants (BC, CO, NH3, NOx, OC, PM2.5, PM10, and SO2) and CO2 across eleven cities around the Bohai Sea from 2008 to 2017 were compared to illustrate the potential relationships between air pollutants/carbon emissions and socioeconomic developments. Meanwhile, the associations between the levels of economic development metrics (GDP per capita), emissions, and energy use per GDP have also been examined. Large differences across these 11 cities presenting different economic development levels and energy consumption characteristics have been observed. Cities with development dependable on the consumption of fossil fuels and the development of resource-intensive industries have emitted large amounts of air pollutants and CO2. Furthermore, the emissions and energy use per GDP for all the cities follow environmental Kuznets curves. The comparison results suggested that the developing cities dependable on resource-intensive industries around the Bohai Sea would obtain greater socioeconomic benefits owing to the interregional cooperation policies under top-down socioeconomic development plans and bottom-up technology development, accompanied by reduced emissions of air pollutants and CO2.

1. Introduction

Sustainable development of society faces steep challenges regarding climate change and atmospheric pollution with several pollutants accounting for both issues [1,2,3]. Climate change resulting from the emission of greenhouse gases (e.g., CO2, CH4, N2O, O3) could reduce food production and pose health burdens to residents through extreme heat and weather events (i.e., floods and droughts) in vulnerable areas where countries are located [1,2,4]. Meanwhile, Low- and Middle-Income Countries (LMICs) pursue economic development with high dependence on the consumption of natural sources (e.g., forests, minerals) and fossil fuels (e.g., coal and crude oil) [5]. A study estimated that LMICs countries were projected to consume primary energy (i.e., fossil fuel) as much as double by 2040 from 2016, while the demand for primary energy in high-income countries may decrease by 8% from 2016 to 2040 [5,6]. High-income countries contributed to high fractions (50–70%) of global greenhouse gas emissions in the atmosphere [3]. Since CO2 emissions per capita are found to be correlated with socioeconomic development, large amounts of air pollutants (e.g., PM2.5, black carbon (BC), SO2, NOx) and CO2 are projected to be emitted with the development of LMICs countries, which could change regional weather patterns and increase health risks due to exposure to air pollution.
Nearly 95% of cities in LMICs did not achieve the air quality guideline of 10 μg m−3 for yearly average PM2.5 in 2016, whereas half of the cities in high-income countries met the guideline [7,8,9]. Cities experiencing environmental degradation and climate change have limited capacities to manage and adapt to these risks because of the challenges associated with developments [10].
Prior studies have documented the long-term relationships between GDP per capita and CO2 emissions per capita in cities of representative countries worldwide [3,11]. This relationship follows the environmental Kuznets curves (EKC), where emissions first increase, then decrease with income growth [12,13]. Liu et al. [3] demonstrated that CO2 emissions per capita were highly associated with GDP per capita and the human development index (HDI) in 184 countries worldwide. Awan et al. [11] examined the validity of the EKC hypothesis using CO2 per capita and economic developments in five countries, including China, France, the Russian Federation, the UK, and the USA from 1993 to 2017. A study by Ru et al. [14] indicated that long-term associations between income growth and emissions of SO2 and CO2 were dependent on energy sectors globally using the country-level emission inventory. However, the emission of BC did not follow the EKC pattern. The emissions of CO2 from the industrial and residential sectors, as well as the emissions of SO2 from the power and industrial sectors, obeyed the EKC curve, while emissions of SO2 and CO2 from other sectors did not.
The United Nations 2030 Agenda appeals for the 17 sustainable development goals (SDG) of cities (e.g., no poverty, good health and well-being, affordable and clean energy, economic growth, climate action) in the inclusive, safe, resilient, and sustainable pathway [15,16,17]. Many countries including China pledge sustainable development by incorporating the 2030 Sustainable Development Goal (SDG) agenda into their national development plan [16]. It was estimated that China may have been responsible for ~30% of global CO2 emissions in 2019 [18]. The Chinese central government is committed to reducing the CO2 emissions per GDP by 13.5% in 2025 relative to that in 2020, as well as 65% in 2030 compared to 2005, to fulfill the responsibility for the support of global sustainability [18]. In addition, northern citizens in China have been choked with severe air pollution with PM2.5 higher than 75 μg m−3 over the last few decades [9,19,20]. To achieve the 2030 SDG goals, a top-down scheme of macro-level governance for the priority regions accounting for air pollution and CO2 in China is essential and should be recognized for effective local governance and regional coherence of national SDG implementation [17].
The Bohai Sea is the largest inland sea in northern China, and its continental shelf is a mining area for natural gas, crude oil, and coal [21,22,23]. The littoral zone of the Bohai Sea is an economically developed region with a high population density in China [24,25]. The socioeconomic development of some cities in this region relies on the large consumption of specific energy resources originating from fossil fuels [26]. Large-scale industries including iron and steel smelting are densely distributed in this region [27,28,29]. For instance, Tangshan in Hebei Province along the littoral zone of the Bohai Sea is the largest producer of iron and steel among cities in the world [30]. It produced approximately 80 million tons of iron and steel in 2012, which is almost equal to the national steel production in the United States [31,32]. Therefore, high-intensity emissions of greenhouse gases and air pollutants from the combustion of fossil fuels have been observed in this region [18,33]. Several field studies have documented extreme air pollution and severe haze events over the coastal region of the Bohai Sea where large-scale industries exist [33,34,35].
Aiming to contribute to co-benefit strategies for city-level sustainable development as well as reductions in emissions of air pollution and CO2 in the littoral zone of the Bohai Sea, our study is performed by assessing the relationships between emissions of air pollution/CO2 and GDP in 11 representative cities with different development levels and capital structures. The metrics of air pollution include BC, CO, NH3, NOx, OC, PM2.5, PM10, and SO2 from different sectors (industrial, power, residential, agriculture, and transportation), as well as GDP from the primary sector (agriculture), the secondary sector (mining and manufacturing), and tertiary sector from 2008 to 2017, are adopted in the comprehensive analysis. This study can provide policy guidance for the potential of diverse sustainable development pathways in the context of air pollution and climate mitigation in the short term in those respective cities.

2. Methods

2.1. Description of Studied Cities

In this study, 11 cities, namely, Beijing, Tianjin, Dalian, Yingkou, Panjin, Jinzhou, Qinhuangdao, Tangshan, Dongying, Weifang, and Yantai, located along the littoral zone of the Bohai Sea were selected to evaluate the impact of greenhouse gas emissions and air pollution on socioeconomic development from 2008 to 2017 (Table 1). As illustrated in Figure S1, four cities, Dalian, Yingkou, Panjin, and Jinzhou, are in Liaoning Province and are distributed in the northeast of the Bohai Sea. The cities of Qinhuangdao and Tangshan are located in the north of the Bohai Sea and are subordinated to Heibei Province. Beijing and Tianjin are municipalities directly under the Chinese government and are situated in the central location of the Bohai Sea. Three cities, Dongying, Weifang, and Yantai, are affiliated with Shandong Province and are located south of the Bohai Sea.

2.2. Emission Dataset

The Multi-resolution Emission Inventory for China (MEIC) provides gridded total emissions and emissions by sector of greenhouse gases (CO2) and air pollutants (i.e., BC, CO, NH3, NOx, organic carbon (OC), PM2.5, PM10, and SO2) at 0.5° × 0.5°over land by combining the bottom-up technical method with the latest emission inventories in China, respectively [36,37]. The emission inventories in the MEIC include unit-based emission inventories for power plants and cement plants, a high-resolution country-level vehicle emission inventory, a residential combustion emission inventory based on national survey data, and an explicit profile-based non-methanevolatile organic compound (NMVOC) speciation framework [38,39]. The data area available from 2008 to 2017 at http://www.meicmodel.org (accessed on 1 November 2021). We selected the MEIC model because it provides sufficiently high spatial–temporal resolution outputs compared with other alternative models [36]. Furthermore, the accuracies of the results from the MEIC model are proven to be consistent with several outputs estimated from other alternative models (e.g., Transport and Chemical Evolution over the Pacific, TRACE-P; Intercontinental Chemical Transport Experiment-Phase, INTEX-B; Model Inter-Comparison Study for Asia, Hemispheric Transport of Air Pollution, HTAP) [40,41,42,43].
The monthly total emissions and emissions by sector of greenhouse gas (i.e., CO2) and air pollutants (i.e., BC, CO, NH3, NOx, OC, PM2.5, PM10, and SO2) for the 11 studied cities from 2008 to 2017 were estimated based on the sum of emissions of all the gridded cells (0.5° × 0.5°) over the city. The dataset of greenhouse gas and air pollutants for Jinzhou City during the periods from 2014 to 2017 was absent. The annual emissions of each city are the sum of monthly emissions in one year. It is speculated that city-level estimates are accurate within 20% using gridded emissions, whereas comparisons across cities tend to be more accurate (<10% error) (Table 2).

2.3. Socioeconomic Data

Economic predictors include GDP, GDP of the primary sector (agriculture), GDP of the secondary sector (industry), and GDP of the tertiary sector (excluding agriculture and industry) and are summarized from the China City Statistical Yearbook.
Population data from 2008 to 2017 for 11 cities were obtained from the China Statistical Yearbook and are used to estimate the GDP per capita and GDP per capita of the industry sector using Equations (1) and (2), respectively.
GDP per capita = city-level GDP/city-level population
GDP per capita of the industry sector = GDP of the industry sector/city-level population
The energy use for each city in the form of standard coal consumption was collected from the City Statistical Yearbook and were used to calculate the energy use per GDP with Equation (3). In addition, air pollutants and CO2 per GDP in each city were estimated using Equations (4) and (5).
Energy use per GDP = city-level energy use/GDP
Air pollutants per GDP = city-level air pollutant/GDP
CO2 per GDP = city-level CO2/GDP

2.4. Statistics Analysis

We assessed the correlation between energy use per GDP and air pollutants (BC, CO, CO2, NH3, NOx, OC, PM2.5, PM10, and SO2) per GDP as well as CO2 per GDP using the Pearson correlation. Moreover, the correlation between economic development metrics including GDP, GDP per capita, GDP of the industry sector, and GDP per capita of the industry sector with air pollution as well as CO2 emissions were performed with the Pearson correlation. The statistical analysis was conducted using the Statistical Package for the Social Sciences (IBM SPSS Version 20.0, Armonk, NY, United States).

3. Results

3.1. Monthly Trends in Emissions

The monthly trends in emissions of BC, CO, OC, PM2.5 PM10, and SO2 in the eleven cities from 2008 to 2017 presented clear cycles with greater emissions in cold seasons (November, December, and January) and lower emissions in warm seasons (June, July, and August). In contrast, higher emissions of NH3 were observed in warm seasons (June, July, and August) relative to those of cold seasons (November, December, and January) in all the cities from 2008 to 2017 (Figures S2–S12). The emissions of CO2 and NOx from 2008 to 2017 had relatively constant levels with no significant monthly trends (Figures S2–S12).
These cities presented large differences in the orders of magnitude in emissions of air pollutants (i.e., BC, CO, NH3, NOx, OC, PM2.5, PM10, and SO2) and CO2. For BC, the monthly levels were comparable within the same orders of magnitude, with the highest level in Tianjin (0.8–1.8 metric kilotonnes) and the lowest (0.15–0.25 metric kilotonnes) in Panjin (Table 3). The monthly emissions of NH3 and OC were within the orders of magnitude across 11 cities, which varied from 0.8–6.0 metric kilotonnes and 0.2–2.8 metric kilotonnes, respectively. The highest monthly emission of CO2 was found in Tangshan (12–19 metric million tonnes), followed by Beijing (8.0–16 metric million tonnes), Tianjin (6.0–16 metric million tonnes), Dongying (2.5–6.0 metric million tonnes), Yantai (4.5–5.6 metric million tonnes), Dalian (4.2–5.5 metric million tonnes), Weifang (3.0–5.0 metric million tonnes), Yingkou (1.4–4.2 metric million tonnes), Jingzhou (1.8–3.0 metric million tonnes), Jinzhou(1.8–3.0 metric million tonnes), and Panjin (0.6–1.0 metric million tonnes). For CO, some cities (Beijing, Tianjin, Dalian, Tangshan, Dongying, Weifang, Yantai, Qinhuangdao) had monthly CO emissions in the range of 50–340 metric kilotonnes, which were higher than more than two times those of other cities, including Jinzhou (20–25 metric kilotonnes), Panjing (2.2–3.1 metric kilotonnes), and Yinkou (15–22 metric kilotonnes).
Tangshan had the highest monthly emissions of NOx (20–35 metric million tonnes), PM2.5 (6.0–10.0 metric million tonnes), PM10 (7.0–11.0 metric million tonnes), and SO2 (15.0–30.0 metric million tonnes) than those of other cities. For the other 10 cities, the emissions of NOx, PM2.5, PM10,and SO2 were from high to low in the orders of Tianjin, Beijing, Yantai, Weifang, Dalian, Dongying, Jianzhou, Qinhuangdao, and Panjin (Table 3).

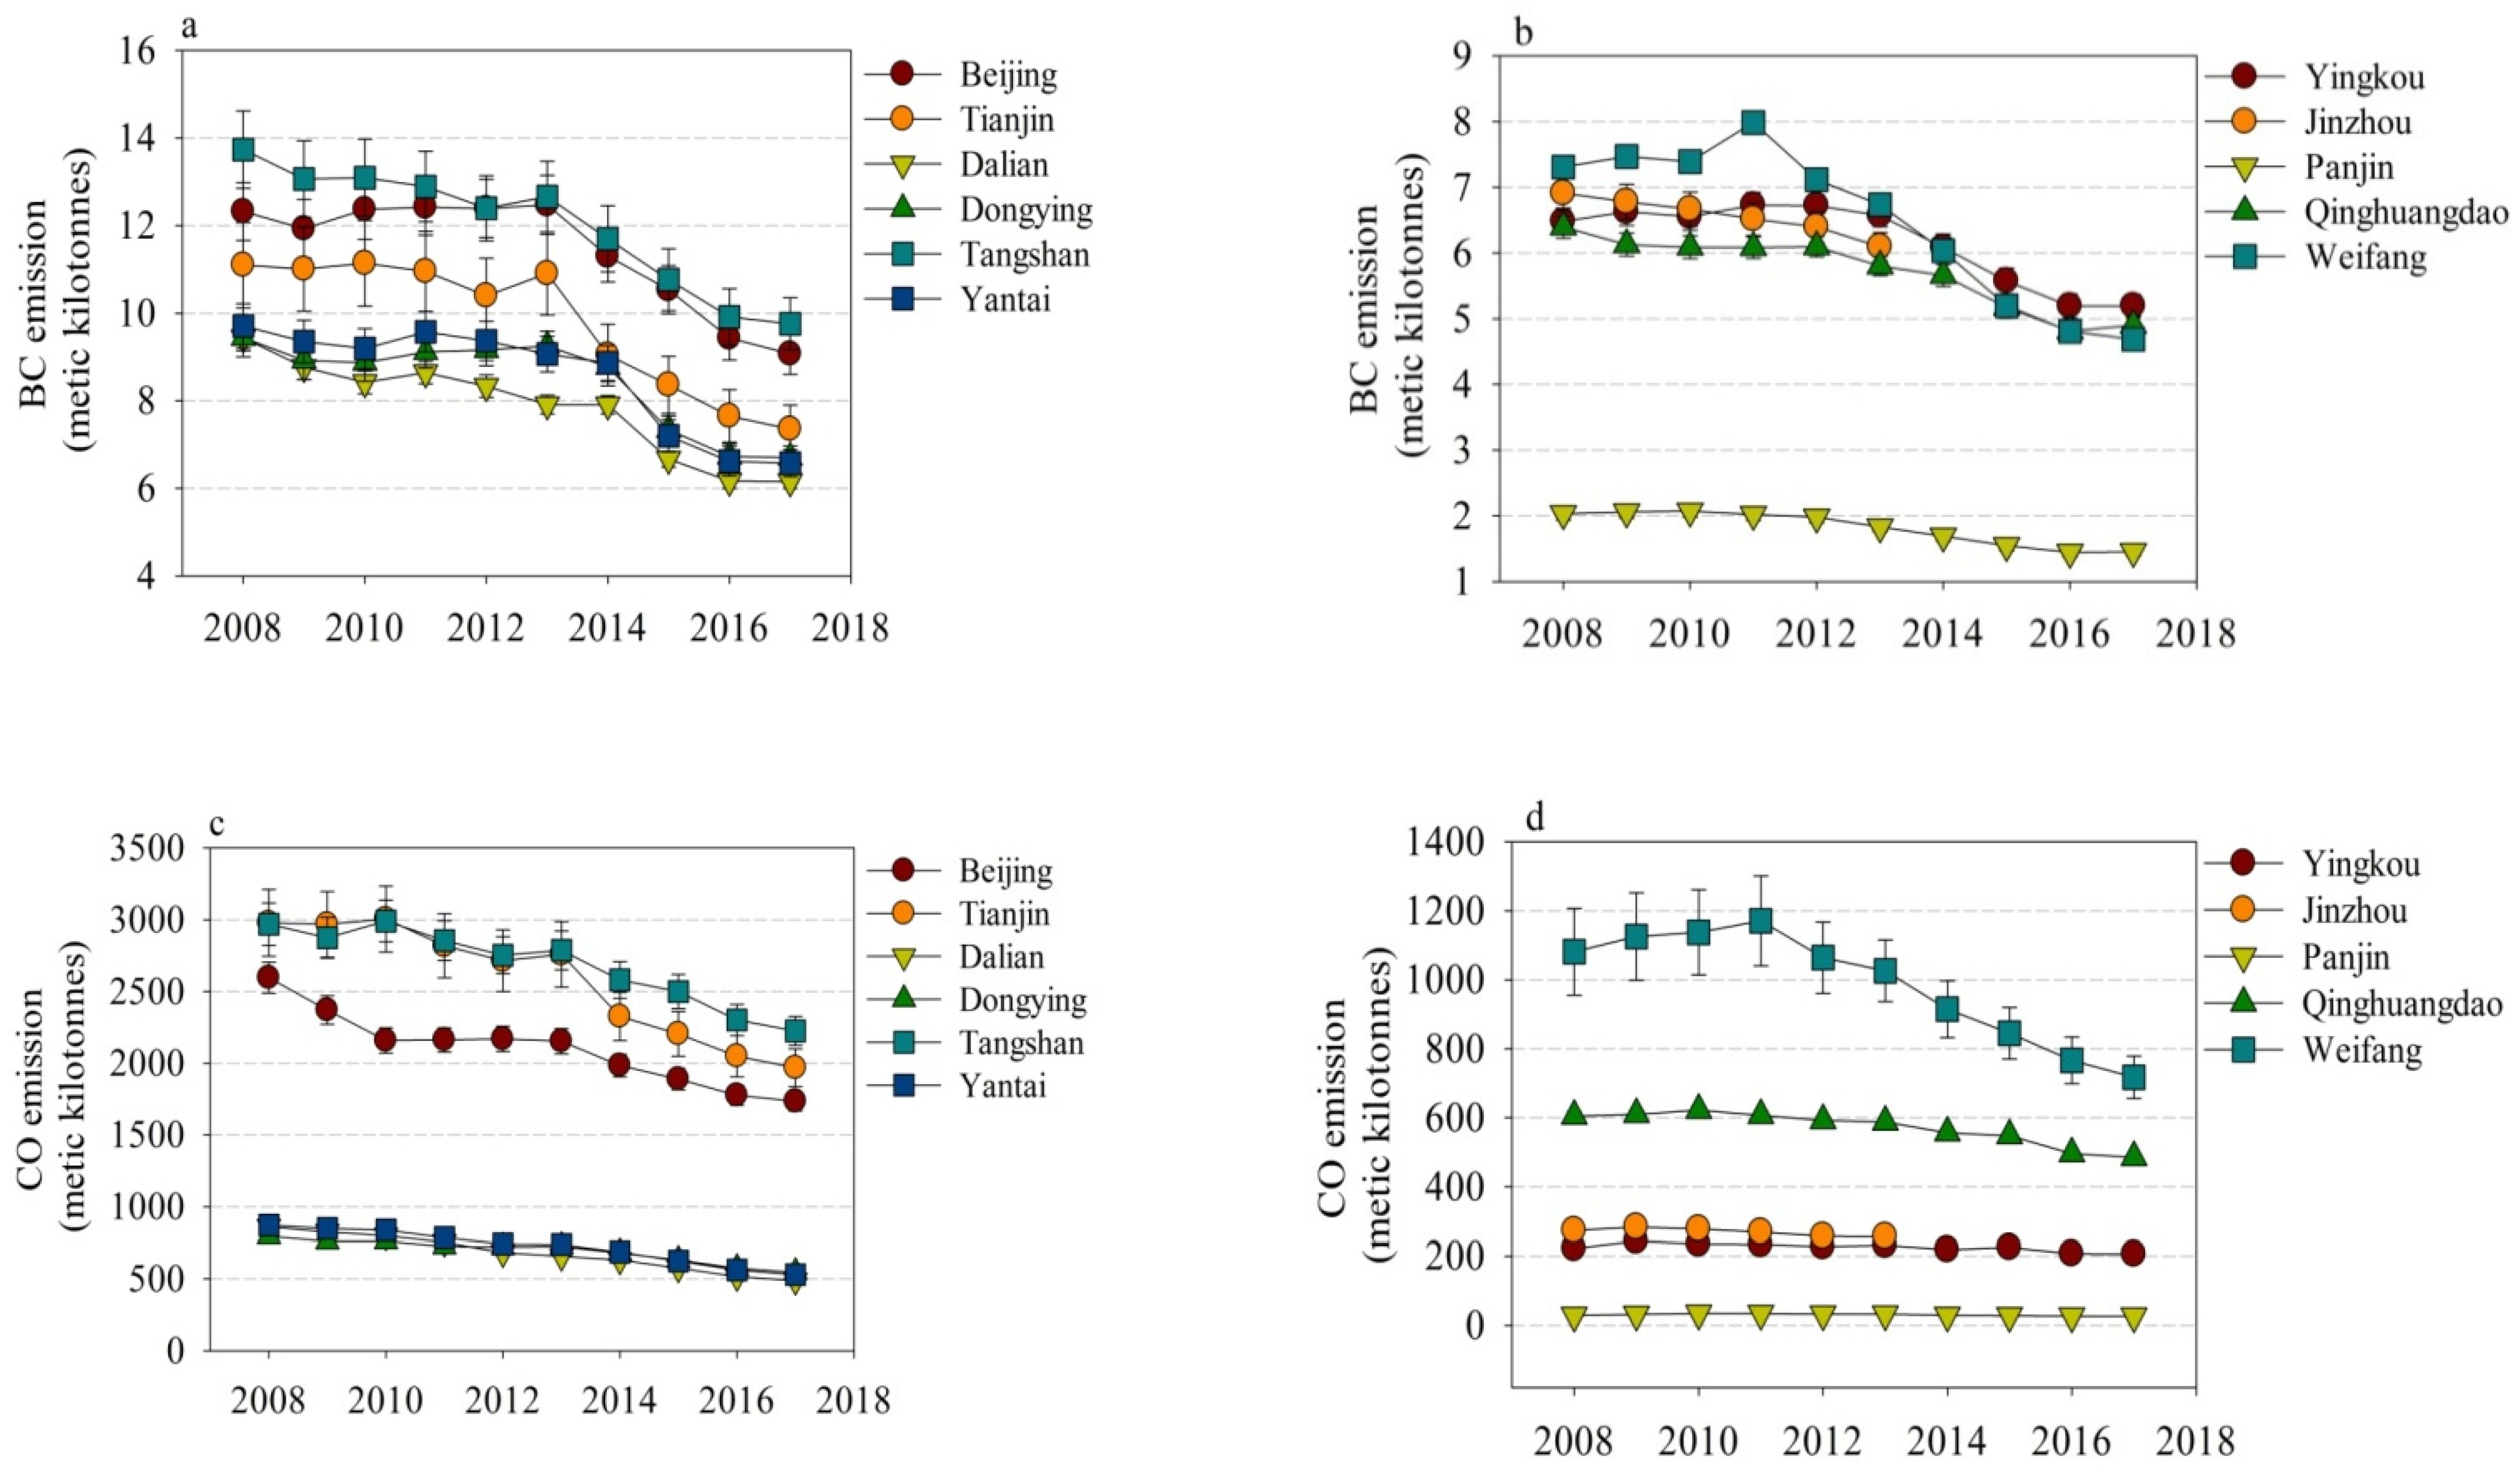
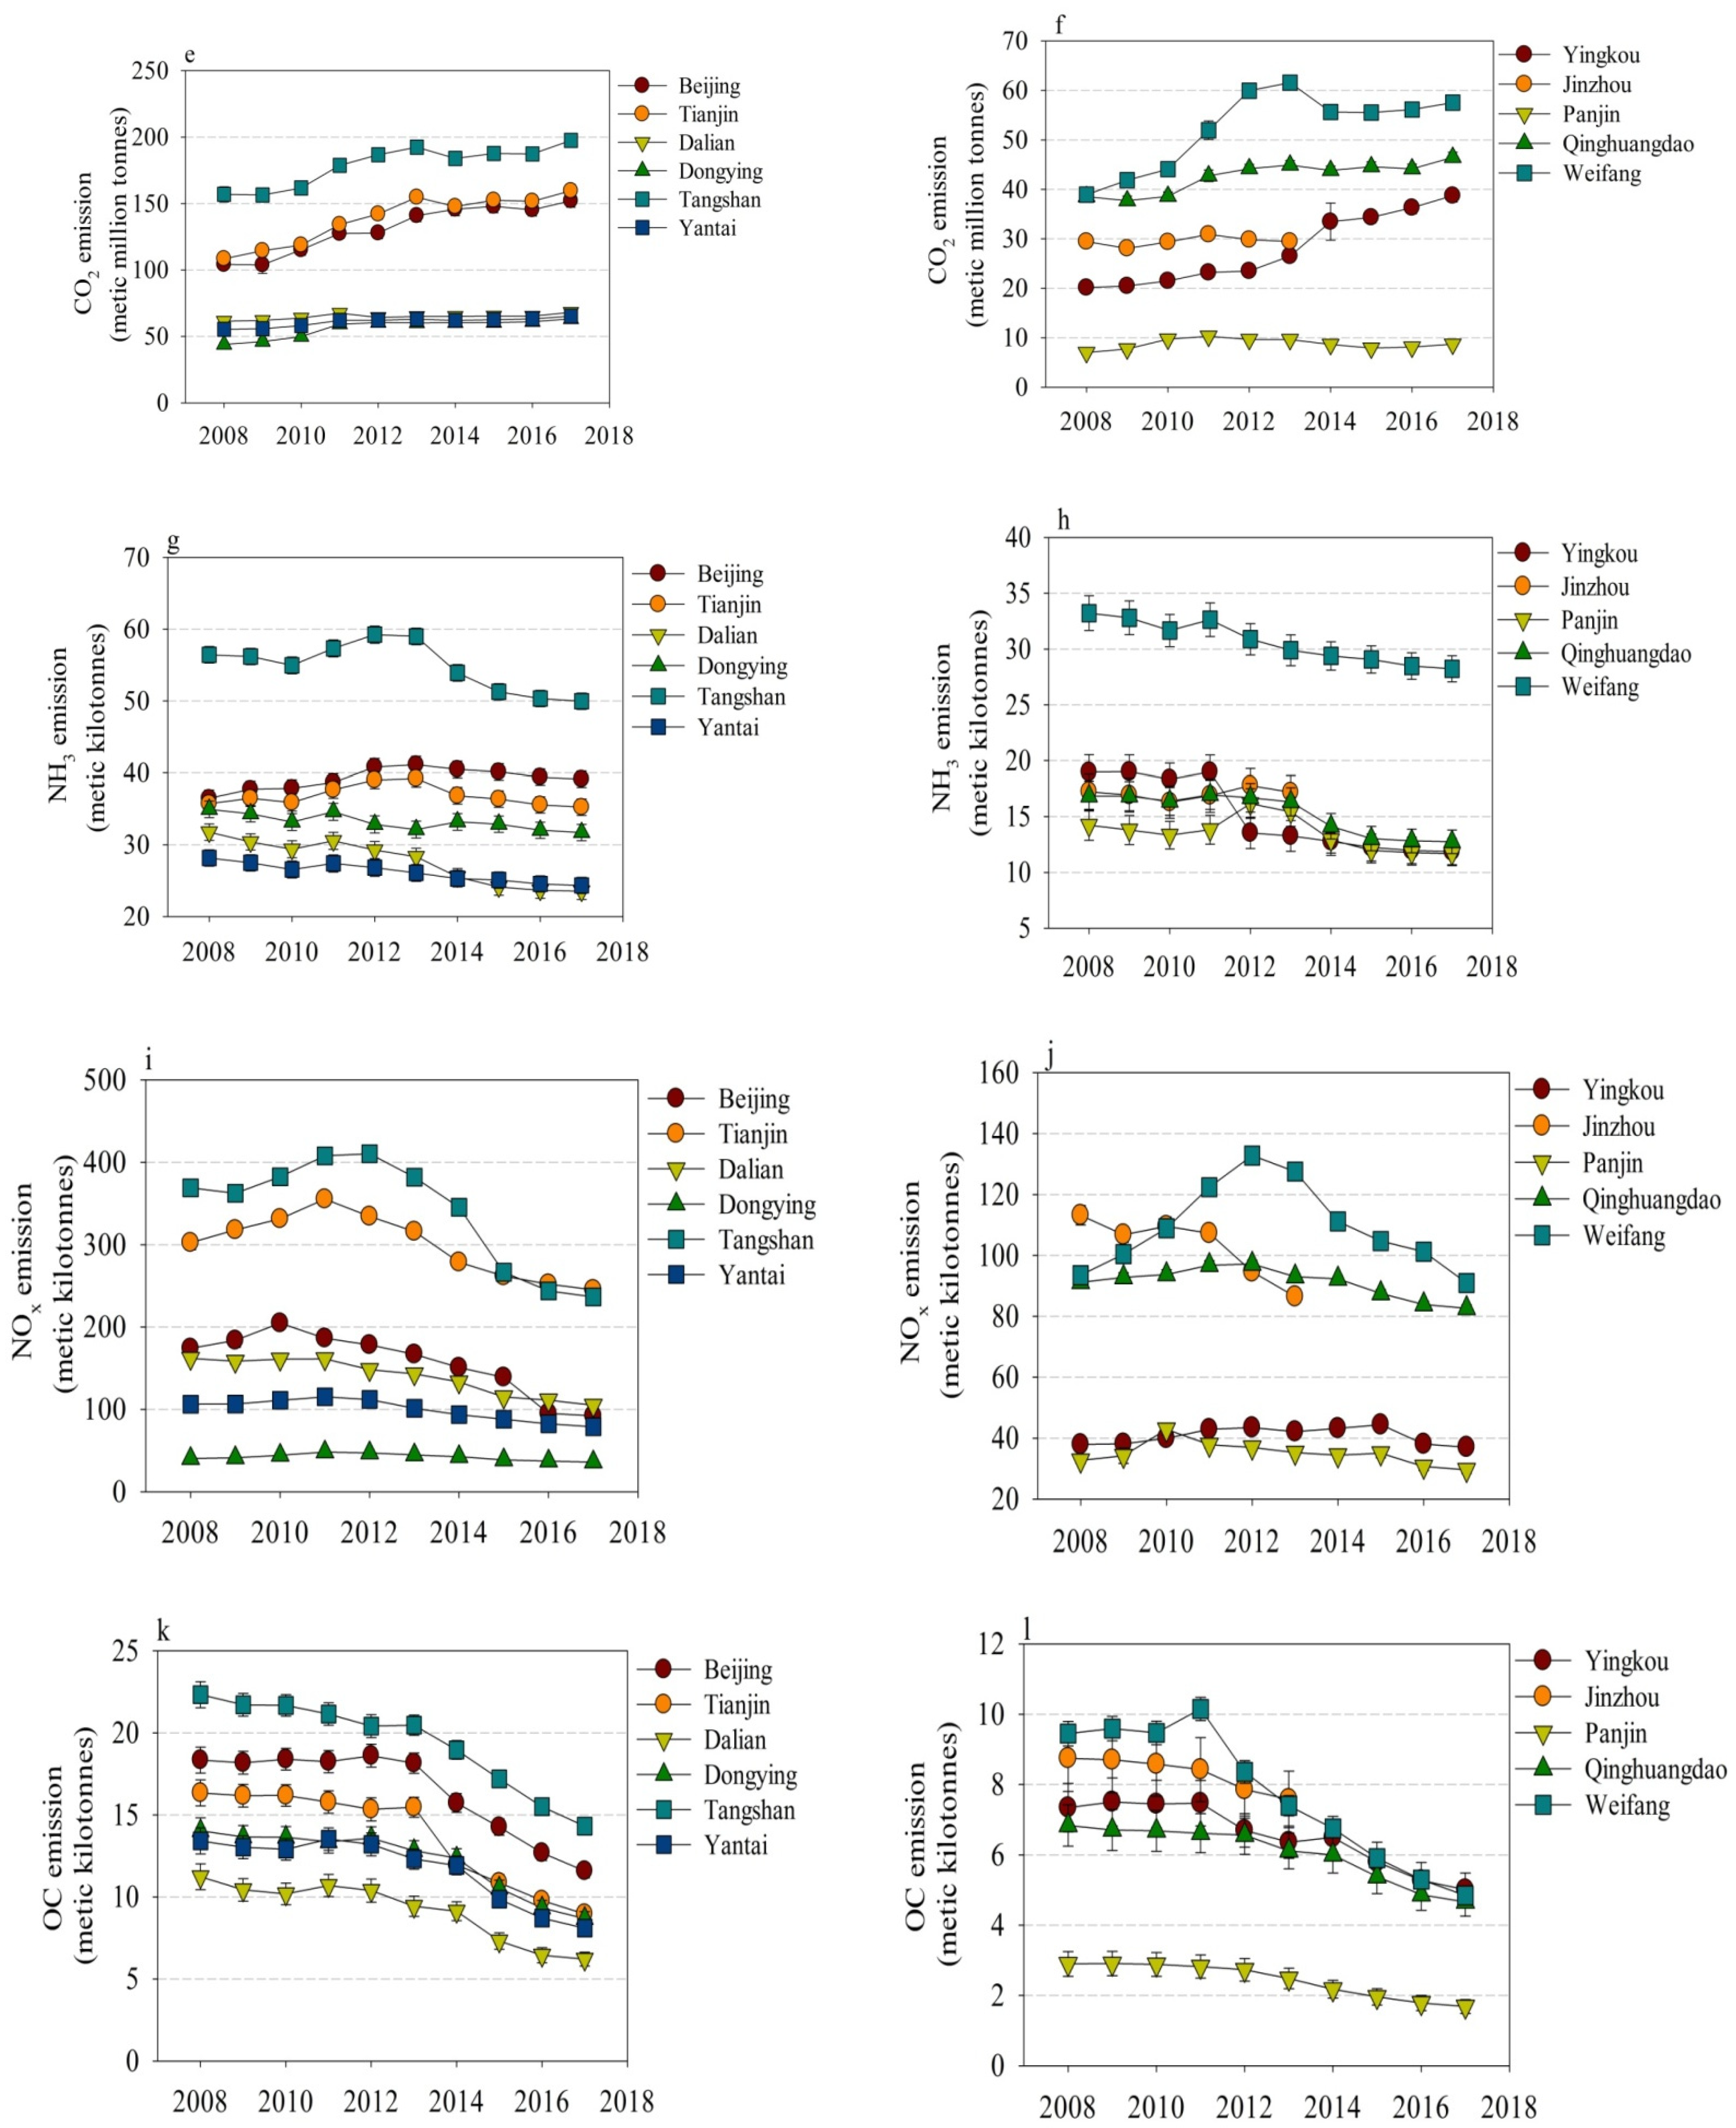
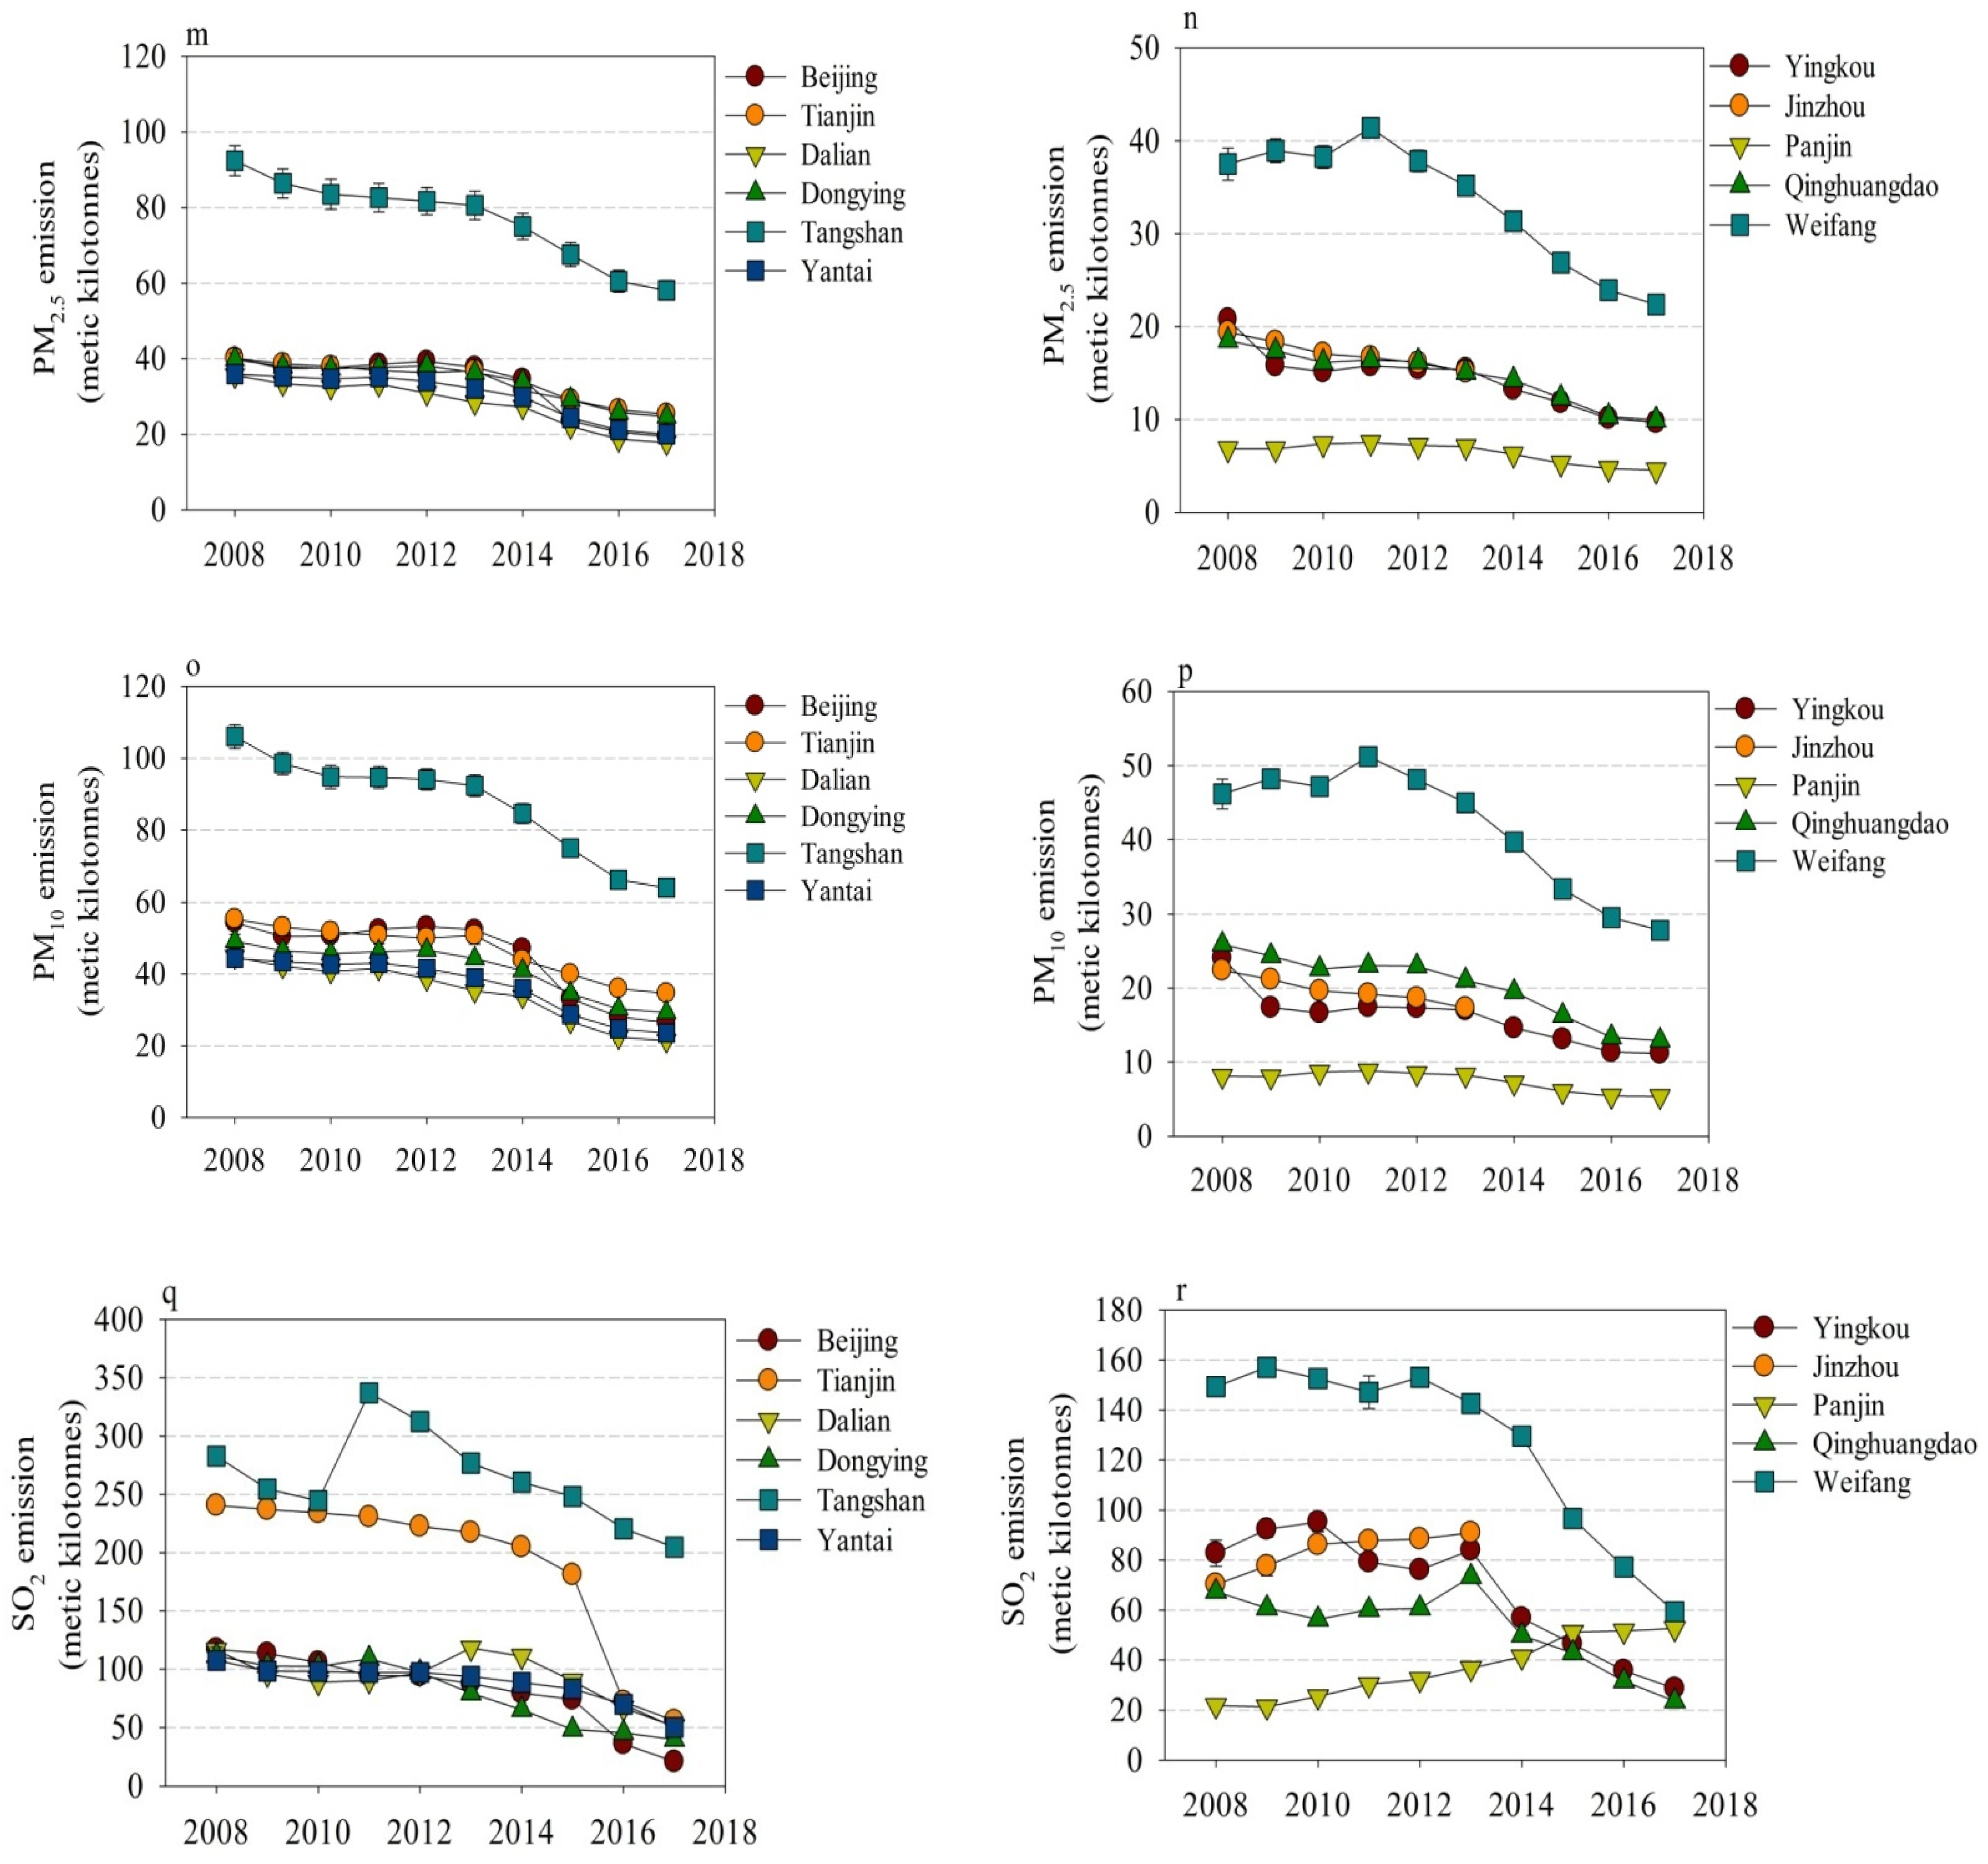
3.2. Annual Trends in Emissions

The annual levels of air pollutants, including BC, CO, NOx, OC, PM2.5, and PM10,for the eleven cities decreased gradually from 2008 to 2017, though some peak emissions occurred at the periods of 2011 and 2013 for some cities (Figure 1). The annual levels of BC for the 11 cities varied from 2 to 14 metric kilotonnes (Figure 1a,b). The large differences in annual CO emissions were seen across the eleven cities from 2008 to 2017. The levels of annual CO in three cities (Beijing, Tianjin, and Tangshan) ranged from 2000 to 3000 metric kilotonnes, and the levels of annual CO in four cities (Dalian, Dongying, Yantai, and Weifang) were in the range of 200–1500 metric kilotonnes. In comparison, three cities (Panjin, Jinzhou, and Yinkou) emitted an annual CO lower than 200 metric kilotonnes (Figure 1c,d). The levels of NOx in two cities (Tangshan and Tianjin) were higher than 250 metric kilotonnes from 2008 to 2017, and the annual NOx emissions in the range of 80–200 metric kilotonnes were Beijing, Dalian, Yantai, Jinzhou, Qinhuangdao, and Weifang. The annual emissions of NOx in Dongying, Yingkou, and Panjing were in the range of 20–60 metric kilotonnes from 2008 to 2017. Higher annual OC emissions in ten cities (6–25 metric kilotonnes) were seen relative to that (1–3 metric kilotonnes) of Panjin from 2008 to 2017 (Figure 1k,l). Very high annual emissions (60–100 metric kilotonnes) of PM2.5 and PM10 were observed in Tangshan from 2008 to 2017. The annual emissions of PM10 and PM2.5 were within the range of 20–60 metric kilotonnes in the other nine cities, while the annual emissions of PM10 and PM2.5 in Panjin were lower than 10 metric kilotonnes (Figure 1m–p).
The trends in annual emissions of NH3 and SO2 from 2008 to 2017 showed slight differences across cities. The slight increases in annual emissions of NH3 from 35 to 39 metric kilotonnes were seen from 2008 to 2017 in Beijing and Tianjin. The emissions of NH3 in Dongying were constant at ~35 metric kilotonnes from 2008 to 2017. The decreasing trend in annual emissions of NH3 was seen in Yantai, Dalian, Weifang, Yingkou, Jinzhou, Panjin, and Qinhuangdao from 2008 to 2017. Yet, the annual emission of NH3 in Tangshan increased from 55 to 60 metric kilotonnes from 2008 to 2013 and decreased to 50 metric kilotonnes from 2014 to 2017 (Figure 1g,h). With regards to annual SO2 emission, the levels in eight cities (Beijing, Dalian, Dongying, Yantai, Jingzhou, Yingkou, Qinhuangdao, and Weifang) decreased steadily from 2008 to 2017. The large variations of annual SO2 emissions were seen in Tangshan and Tianjin. Peak annual emissions of SO2 were seen at ~350 metric kilotonnes in Tangshan in 2011, while large decreases in annual SO2 emissions from 200 to 50 metric kilotonnes were observed in Tianjin from 2015 to 2017. The annual emissions of SO2 exhibited an increasing trend from 20 to 40 metric kilotonnes during the periods of 2008 to 2017.
The levels of annual CO2 emissions observed were found to increase from 2008 to 2013, while the levels of annual CO2 emissions kept at the peak level of 2013 from 2014 to 2017 for all eleven cities. The greatest annual emissions of CO2 were seen in Tangshan, followed by Beijing, Tianjin, Dongying, Yantai, Dalian, Weifang, Qinhuangdao, Yingkou, Jinzhou, and Panjin. The largest discrepancies in annual CO2 emissions were observed in Tangshan (150–200 metric million tonnes) and Yingkou (5–10 metric million tonnes).
The contributions of the industry sector accounted for about 20–40% of annual emissions of air pollutants (BC, CO, NH3, NOx, OC, PM2.5, PM10, and SO2) as well as CO2 for all the eleven cities (Figure S13). The trends in annual emissions of air pollutants (BC, CO, NH3, NOx, OC, PM2.5, PM10, and SO2), and CO2 from 2008 to 2017 were similar to those in total emissions for the eleven cities. Similar trends as those of total annual emissions were also observed in per capita air pollutants and CO2, as well as per capita air pollutants and CO2 of the industry sector across the eleven cities (Tables S1–S3).

3.3. Economic Metrics

Beijing is the capital of China, which had the highest GDP value (1180–2990 billion RMB) during the period of 2008 to 2017 among the eleven cities. Tianjin is a municipality directly under the central government, which has the second-highest GDP value (520–1250 billion RMB) during the period of 2008 to 2017 among the eleven cities. Five cities (Dalian, Tangshan, Dongying, Weifang, and Yantai) had GDP values in the range of 200–700 billion RMB during the period of 2008 to 2017, while four cities (Yingkou, Panjin, Jinzhou, and Qinhuangdao) had the GDP values in the range of 60–150 billion RMB (Table 1). The industry sector contributed about ~20% of the total GDP, which was found to be 300–600 billion RMB during the period of 2008 to 2017. The contributions of the industry sector were responsible for 40–60% of GDP for the other ten cities. Tianjin had the GDP of the industry sector in the range of 300–700 billion RMB, which was higher than those of nine cities, including Dongying (100–300 billion RMB), Yantai (100–300 billion RMB), Dalian (100–300 billion RMB), Tangshan (100–300 billion RMB), Weifang (100–300 billion RMB), Qinhuangdao (50–100 billion RMB), Yingkou (50–100 billion RMB), Jinzhou (50–100 billion RMB), and Panjin (50–100 billion RMB) (Figure S14). The highest GDP per capita during the period of 2008 to 2017 among the eleven cities was Dongying, followed by Beijing, Dalian, Yantai, Tianjin, Panjin, Tangshan, Weifang, Yingkou, Qinhuangdao, and Jinzhou (Table 1). The ranking of GDP of the industry sector per capita for these eleven cities was consistent with that of GDP per capita.

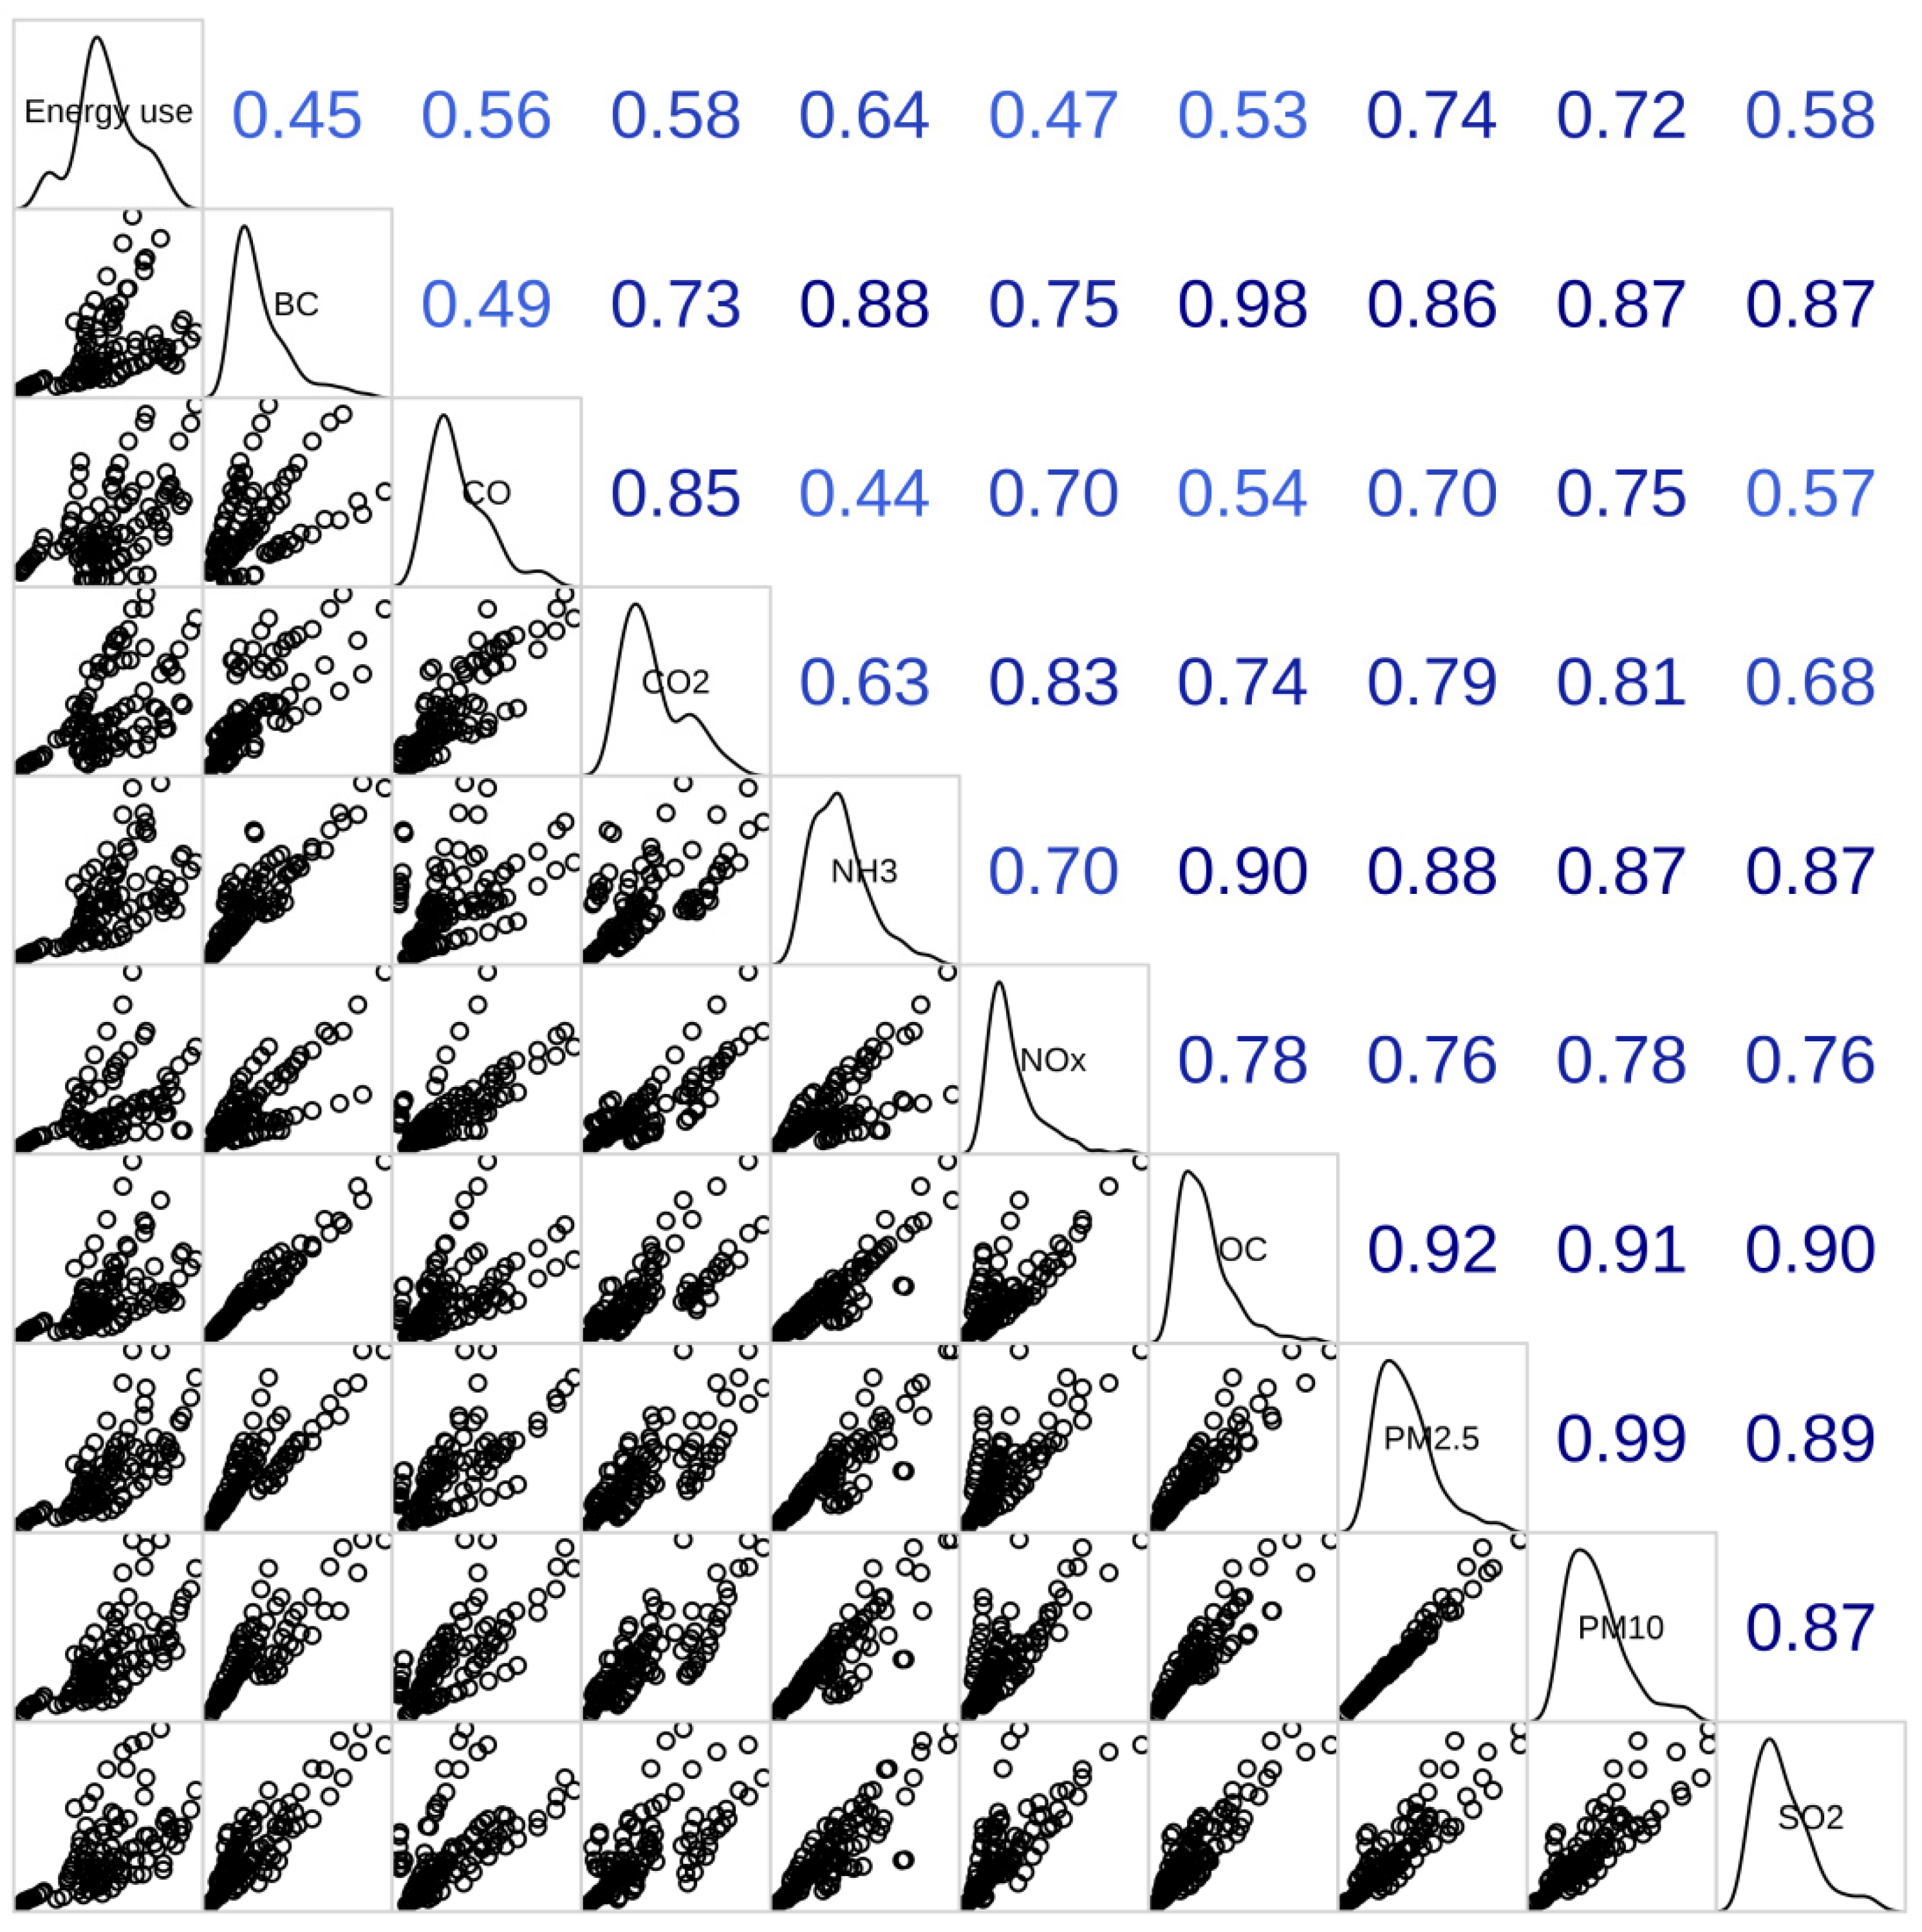
3.4. Associations between Economic Metrics and Emissions of Ambient Species

We evaluated the associations between annual economic development metrics including GDP, GDP per capita, GDP of the industry sector, GDP per capita of the industry sector, and annual emissions of ambient species (BC, CO, NH3, NOx, OC, PM2.5, PM10, and SO2) in 11 cities. GDP was observed to be correlated well with annual emissions of ambient species (BC, CO, NH3, NOx, OC, PM2.5, PM10, and SO2) (Pearson’s r range, 0.22–0.87, p < 0.01). GDP per capita correlated with annual emissions of ambient species (BC, CO, NH3, OC, PM2.5, PM10, and SO2) (Pearson’s r range, 0.33–0.51, p < 0.05), while GDP per capita was not associated with NOx per capita (p > 0.05). Annual emissions of ambient species (BC, CO, NOx, OC, PM2.5, PM10, and SO2) exhibited a correlation with GDP of the industry sector, as well as GDP per capita of the industry sector (Pearson’s r range, 0.22–0.86, p < 0.05) (Table S4). As shown in Figure 2, the energy use per GDP was significantly associated with air pollutants (BC, CO, CO2, NH3, NOx, OC, PM2.5, PM10 and SO2) per GDP, as well as CO2 per GDP with the Pearson r in the range of 0.45–0.90.

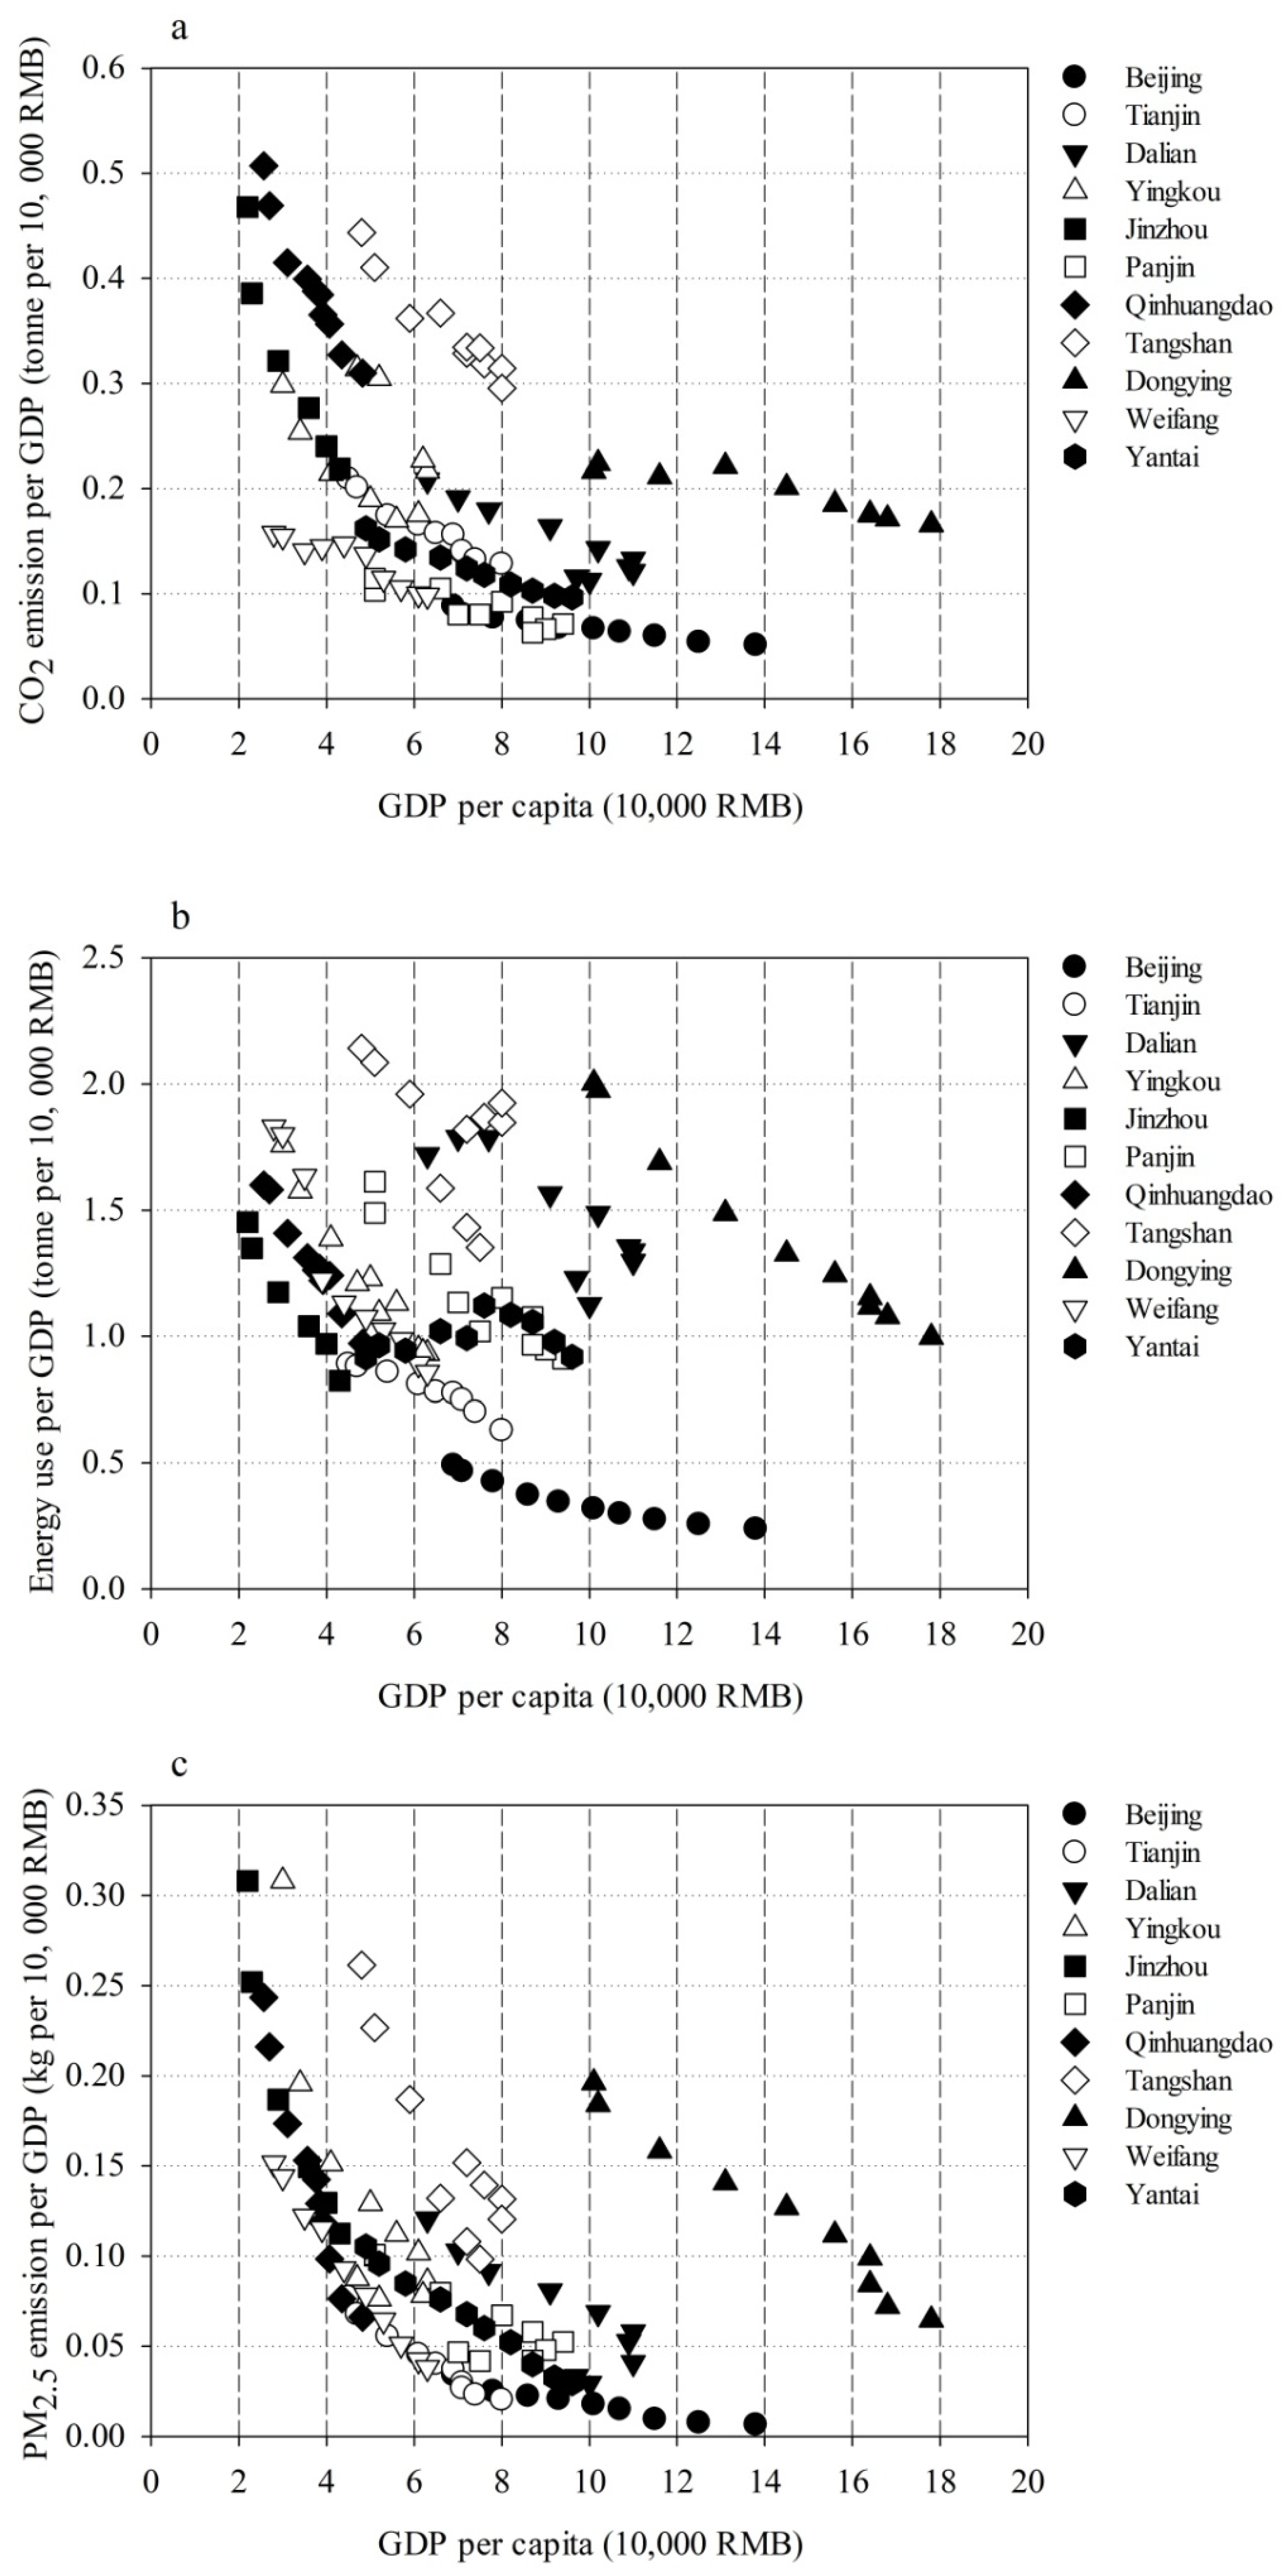
3.5. Energy Use and Emission per GDP for Cities with Different Development Levels

As shown in Figure 3, CO2 emissions per GDP versus cities with different development levels, the energy use per GDP versus cities with different development levels, and PM2.5 emissions per GDP versus cities with different development levels are presented. Since the three metrics, including CO2 emissions per GDP, energy use per GDP, and PM2.5 emissions per GDP versus cities, were highly correlated with each other, the trends of the three metrics against cities with different development levels were found to be comparable. For most cities, including Beijing, Tianjin, Dalian, Jinzhou, Panjin, Qinhuangfao, Dongying, Weifang, and Yantai, the emission and energy use per GDP decreased with the enhancements of economic growth, following the environmental Kuznets curves. The emission and energy use per GDP in Tangshan and Dongying also obeyed the environmental Kuznets curves, but levels of emission and energy use per GDP were found to be higher than those of other cities.

4. Discussion

4.1. Disparities in Emissions and Economic Development across Cities

During the periods from 2008 to 2017, GDP per capita in China increased steadily from ~25,000 RMB (~3700 US dollars) to ~65,000 RMB (~9500 US dollars) with an average annual growth of ~7%, which reached an average level in middle-income countries [44] (Figure S15a). However, large differences in GDP per capita across the studied 11 cities were observed. Eight cities (Beijing, Tianjin, Dalian, Panjin, Tangshan, Jinzhou, Donging, Weifang, and Tianjin) had GDP per capita higher than the national mean level in China, while the values of GDP per capita in three cities (Yingkou, Jinzhou, and Qinhuangdao) were lower than the national mean level in China (Figure S15b). Since emissions of air pollution and CO2 per capita were highly associated with GDP per capita at the initial stage of economic development following the EKC hypothesis [13,45], the large different emissions across the 11 cities were ascribed to the regional disparities in economic development. Our result is consistent with several studies that emissions of air pollution and CO2 per capita comply with the EKC hypothesis in cities in Asian countries [7,13,14]. The sum of emissions of air pollution and CO2 accounted for 10–30% of total emissions in China. Since city-level emissions of air pollution and CO2 across the world are rarely limited, the level comparisons in the emissions of air pollution and CO2 across cities around the world could provide a comprehensive evaluation of emissions of air pollution and CO2 at a city level in the future. In general, CO2 emissions per GDP and emissions of air pollutants per GDP in each city decreased by 30–50% from 2008 to 2017, which illustrated the replacement of old technology with advanced technology driven by economic development could lessen the emissions of CO2 and air pollutants [3,46,47].
These 11 cities belonging to five regions (Beijing, Tianjin, Liaoning Province, Hebei Province, and Shandong Province) can be simply divided into different city types by characteristics of economic developments, industrial structures, as well as emission levels of air pollutants and CO2 [26,36]. Cheng et al. [26] classified 210 cities in China into seven groups based on their sustainability performance in 2016. Beijing is characterized by a high human capital structure with sustainable development driven by high quality and quantity of human capital. Tianjin, four cities (Dalian, Yingkou, Jinzhou, and Panjin) in Liaoning Province, and two cities (Weifang and Yantai) in Shandong Province are featured with high produced capital structure and are highly dependable on the development of the industry. Dongying in Shandong Province is an energy-producing city for crude oil (Table 4). The cities of Tangshan and Qinhuangdao were not grouped in Cheng et al. [26] due to the absences of the data. Tangshan pursues economic development based on abundant coal reserves and steel production [32], while Qinhuangdao is a produced capital city, with development driven by the manufacturing industry [48,49].
For a human capital city with high values of GDP per capita, Beijing canexpand its dependency on human capital gradually and abandon the economic development of the industry with high emissions of air pollutants and CO2. For those cities associated and reliant on the development of produced capital structure, cities can rely on the industry with low emissions of air pollutants/CO2 and improve the mitigation technology for their emission reductions. Proper strategies for reducing ambient species, including PM2.5, BC, SO2, and CO2, from specific sectors could alleviate climate change and air pollution, as well as simultaneously improve socioeconomic development [1,50]. There are several co-benefit policies for the reduction of air pollutants (e.g., PM) and CO2 when they are from the same sources. Shindell et al. [1] presented 14 measures that could reduce greenhouse gas emissions in the short term with improvements in human health and food security. Annenberg et al. [50] illustrated that a low-carbon development policy could lead to a decrease in mortality associated with exposure to air pollution and events resulting from climate change, with an increase in the gross domestic product (GDP). However, improper mitigation policies for energy use can result in trade-offs between air pollution and greenhouse gas emissions. For example, switching from coal heating to natural gas was found to reduce PM and BC emissions by 30–80% but increased CO2 emissions slightly in some cities, according to prior studies [51,52]. While in a study conducted by Wilson and Stafell, displacing coal with natural gas could lead to reducing per-capita annual emissions by 400 kg CO2 between 2015 and 2016 in the UK [53]. For those cities with development dependent on fossil fuels, including coal and crude oil, the increased dependence on the development of resource-intensive industries following ordinary development routes previously can lead to low levels of sustainable development performance. Residents should consider the low levels of sustainability performance in resource-exhausted cities and thus abandon their resource dependency gradually. These cities can pave a development pathway for industries with high-value-added products and low emissions of air pollutants and CO2. The shift to low-carbon pathways for resource-dependent cities can be achieved by increasing the capacities to attract high quality and quantity of human capital [53,54,55,56,57].

4.2. Mitigation of Air Pollution and CO2 Emission at a City Level

For the cities (Yingkou, Jinzhou, and Qinhuangdao) with GDP per capita lower than the national mean level in China, the priorities for the citizens are to seek socioeconomic development in low-carbon development pathways. For the cities (Tangshan and Dongying) with energy use and emission per GDP higher than those other cities, the priorities for the citizens are to pave the low-carbon development with developed technologies. Recent studies indicate that interregional cooperation policies could aid the city to move forward in an economically optimal pathway for carbon emissions reductions and socioeconomic advancement [58,59,60,61]. The pathway for moving to low-carbon development with developed technologies is expected to prioritize PM and GHG reductions, as well as share greater co-benefit in protecting public health. Driscoll et al. [46] found that annual estimated CO2 and PM2.5 can be reduced by 10–40% in the USA after implementing conventional energy with after-treatment technology and renewable energy in 2417 power plants, avoiding 21–33% of premature deaths associated with air pollution. A study conducted in China suggested that the reductions of 1469 million tonnes of CO2 and decreases in 15–22% of all-cause mortality associated with air pollution could be achieved in China around 2030 if low-carbon policies on conventional energy with advanced after-treatment technology were performed [47]. Key steps toward the targets for carbon emissions reductions and socioeconomic advancement in the cities with low levels of development can be supported by the city’s appropriate mitigation action under 14th China’s Five-Year Plans. These development plans can aid the citizens to expand their industrial productivity and promote economic development locally [62].

5. Conclusions

Our study presented the differences in emissions of air pollutants and CO2 across 11 cities around the Bohai Sea. Beijing, presenting high human capital structures, has emitted total amounts of CO2 in the range of 100–150 metric million tonnes and air pollutants (BC, CO, NH3, NOx, OC, PM2.5, PM10, and SO2) in the range of 1500–2500 metric kilotonnes during the period of 2008–2017. Another eightcities, including Tianjin, Dalian, Panjin, Tangshan, Jinzhou, Donging, Weifang, and Tianjin, characterized by high produced capital structures have produced total amounts of CO2 in the range of 40–200 metric million tonnes and air pollutants (BC, CO, NH3, NOx, OC, PM2.5, PM10, and SO2) in the range of 500–3000 metric kilotonnes during the period of 2008–2017. The three cities (Panjin, Jinzhou, and Qinhuangdao) with GDP per capita lower than the national mean level in China discharged total amounts of CO2 in the range of 20–50 metric million tonnes and air pollutants (BC, CO, NH3, NOx, OC, PM2.5, PM10, and SO2) in the range of 200–500 metric kilotonnes during the period of 2008–2017. The high energy use cities of Tangshan and Dongying corresponded to higher emissions of air pollutants and CO2 per GDP than other cities. Cities with high air pollutants and CO2 per GDP should pursue short-term policies to reduce air pollution and increase human development. Short-term policies should focus on technological development in carbon reductions and socioeconomic development simultaneously. Three Cities (Yingkou, Jinzhou, and Qinhuangdao) with lower GDP per capita lower than the national mean level in China are essential for promoting the development of cities in low-carbon pathways.

Supplementary Materials

The following supporting information can be downloaded at: https://www.mdpi.com/article/10.3390/toxics10090547/s1, Figure S1: The sketch map for the locations of the eleven cities. Figure S2: Monthly trends in emissions of air pollutants including BC by sector (a), CO by sector (b), NH3 by sector (d), NOx by sector (e), OC by sector (f), PM2.5 by sector (g), PM10 by sector (h), SO2 by sector (i), as well as CO2 by sector (c) in Beijing from the years of 2008–2017. Figure S3: Monthly trends in emissions of air pollutants including BC by sector (a), CO by sector (b), NH3 by sector (d), NOx by sector (e), OC by sector (f), PM2.5 by sector (g), PM10 by sector (h), SO2 by sector (i), as well as CO2 by sector (c) in Tianjin from the years of 2008–2017. Figure S4: Monthly trends in emissions of air pollutants including BC by sector (a), CO by sector (b), NH3 by sector (d), NOx by sector (e), OC by sector (f), PM2.5 by sector (g), PM10 by sector (h), SO2 by sector (i), as well as CO2 by sector (c) in Dalian from the years of 2008–2017. Figure S5: Monthly trends in emissions of air pollutants including BC by sector (a), CO by sector (b), NH3 by sector (d), NOx by sector (e), OC by sector (f), PM2.5 by sector (g), PM10 by sector (h), SO2 by sector (i), as well as CO2 by sector (c) in Yingkou from the years of 2008–2017. Figure S6: Monthly trends in emissions of air pollutants including BC by sector (a), CO by sector (b), NH3 by sector (d), NOx by sector (e), OC by sector (f), PM2.5 by sector (g), PM10 by sector (h), SO2 by sector (i), as well as CO2 by sector (c) in Panjin from the years of 2008–2017. Figure S7: Monthly trends in emissions of air pollutants including BC by sector (a), CO by sector (b), NH3 by sector (d), NOx by sector (e), OC by sector (f), PM2.5 by sector (g), PM10 by sector (h), SO2 by sector (i), as well as CO2 by sector (c) in Jinzhou from the years of 2008–2013. Figure S8: Monthly trends in emissions of air pollutants including BC by sector (a), CO by sector (b), NH3 by sector (d), NOx by sector (e), OC by sector (f), PM2.5 by sector (g), PM10 by sector (h), SO2 by sector (i), as well as CO2 by sector (c) in Qinhuangdao from the years of 2008–2017. Figure S9: Monthly trends in emissions of air pollutants including BC by sector (a), CO by sector (b), NH3 by sector (d), NOx by sector (e), OC by sector (f), PM2.5 by sector (g), PM10 by sector (h), SO2 by sector (i), as well as CO2 by sector (c) in Tangshan from the years of 2008–2017. Figure S10: Monthly trends in emissions of air pollutants including BC by sector (a), CO by sector (b), NH3 by sector (d), NOx by sector (e), OC by sector (f), PM2.5 by sector (g), PM10 by sector (h), SO2 by sector (i), as well as CO2 by sector (c) in Dongying from the years of 2008–2017. Figure S11: Monthly trends in emissions of air pollutants including BCby sector (a), COby sector (b), NH3 by sector (d), NOx by sector (e), OC by sector (f), PM2.5 by sector (g), PM10 by sector (h), SO2 by sector (i), as well as CO2 by sector (c) in Weifang from the years of 2008–2017. Figure S12: Monthly trends in emissions of air pollutants including BC by sector (a), CO by sector (b), NH3 by sector (d), NOx by sector (e), OC by sector (f), PM2.5 by sector (g), PM10 by sector (h), SO2 by sector (i), as well as CO2 by sector (c) in Yantai from the years of 2008–2017. Figure S13: Contribution of the different sectors to the yearly air pollutants including BC (a), CO (b), NH3 (d), NOx (e), OC (f), PM2.5 (g), PM10 (h), SO2 (i), as well as CO2 (c) in the eleven cities from the years of 2008–2017. Figure S14: Contributions of the primary sector (agriculture), the secondary sector (industry), and the tertiary sector (excluding agriculture and industry) to GDP from 2008 to 2017 in the11 cities. Figure S15: (a) Changes in GDP per capita from 2008 to 2017 in China. (b) Changes in ratio of GDP per capita and national mean level from 2008 to 2017 in 11 cities. Ratio of GDP per capita and national mean level was estimated using GDP per capita for each city divided GDP per capita in China. Table S1: The summary of the annual level of air pollutants (Metric kilotonnes) of the industry sector and CO2 of the industry sector. Table S2: The summary of the annual level of air pollutants (kg per capita) per capita and CO2 (tonnes per capita) per capita. Table S3: The summary of the annual concentration of air pollutants (kg per capita) of the industry sector per capita and CO2 (tonnes per capita) of the industry sector per capita. Table S4. Correlation (Pearson’s r) between economic development metrics including GDP, GDP per capita, GDP of industry sector, and GDP per capita of industry sector with air pollution, as well as CO2 emission.

Author Contributions

Z.Z., Q.L., J.L. and Y.L. designed the experiment and collected the data. Z.Z. and Q.L. wrote the draft. All authors have read and agreed to the published version of the manuscript.

Funding

The study was supported by Taishan Scholarship.

Institutional Review Board Statement

Not applicable.

Informed Consent Statement

Not applicable.

Data Availability Statement

The data and materials could be available at http://www.meicmodel.org (accessed on 1 November 2021) and also be acquired upon the request from the corresponding author.

Acknowledgments

We appreciate MEIC for providing the emission data of air pollutants and CO2.

Conflicts of Interest

There are no interest of conflict to declare.

References

  1. Shindell, D.; Borgford-Parnell, N.; Brauer, M.; Haines, A.; Kuylenstierna, J.C.I.; Leonard, S.A.; Ramanathan, V.; Ravishankara, A.; Amann, M.; Srivastava, L. A climate policy pathway for near- and long-term benefits. Science 2017, 356, 493–494. [Google Scholar] [CrossRef]
  2. Watts, N.; Adger, W.N.; Agnolucci, P.; Blackstock, J.; Byass, P.; Cai, W.; Chaytor, S.; Colbourn, T.; Collins, M.; Cooper, A.; et al. Health and climate change: Policy responses to protect public health. Lancet 2015, 386, 1861–1914. [Google Scholar] [CrossRef]
  3. Liu, Q.; Baumgartner, J.; de Foy, B.; Schauer, J.J. A global perspective on national climate mitigation priorities in the context of air pollution and sustainable development. City Environ. Interact. 2019, 1, 100003. [Google Scholar] [CrossRef]
  4. Stott, P.A.; Stone, D.A.; Allen, M.R. Human contribution to the European heatwave of 2003. Nature 2004, 432, 610–614. [Google Scholar] [CrossRef]
  5. Rocco, M.; Colombo, E.; Pavarini, C. Energy and Air Pollution World Energy Outlook Special Report—Spotlight; International Energy Agency: Paris, France, 2016. [Google Scholar]
  6. Daly, H.E.; Walton, M.A. Energy Access Outlook: From Poverty to Prosperity, World Energy Outlook-2017 Special Report; International Energy Agency: Paris, France, 2017. [Google Scholar]
  7. Anenberg, S.C.; Achakulwisut, P.; Brauer, M.; Moran, D.; Apte, J.S.; Henze, D.K. Particulate matter-attributable mortality and relationships with carbon dioxide in 250 urban areas worldwide. Sci. Rep. 2019, 9, 11552. [Google Scholar] [CrossRef]
  8. Brauer, M.; Freedman, G.; Frostad, J.; van Donkelaar, A.; Martin, R.V.; Dentener, F.; van Dingenen, R.; Estep, K.; Amini, H.; Apte, J.S.; et al. Ambient Air Pollution Exposure Estimation for the Global Burden of Disease 2013. Environ. Sci. Technol. 2016, 50, 79–88. [Google Scholar] [CrossRef]
  9. Shaddick, G.; Thomas, M.L.; Amini, H.; Broday, D.; Cohen, A.; Frostad, J.; Green, A.; Gumy, S.; Liu, Y.; Martin, R.V.; et al. Data Integration for the Assessment of Population Exposure to Ambient Air Pollution for Global Burden of Disease Assessment. Environ. Sci. Technol. 2018, 52, 9069–9078. [Google Scholar] [CrossRef]
  10. Rogelj, J.; den Elzen, M.; Höhne, N.; Fransen, T.; Fekete, H.; Winkler, H.; Schaeffer, R.; Sha, F.; Riahi, K.; Meinshausen, M. Paris Agreement climate proposals need a boost to keep warming well below 2  °C. Nature 2016, 534, 631–639. [Google Scholar] [CrossRef]
  11. Awan, A.M.; Azam, M. Evaluating the impact of GDP per capita on environmental degradation for G-20 economies: Does N-shaped environmental Kuznets curve exist? Environ. Dev. Sustain. 2022, 24, 11103–11126. [Google Scholar] [CrossRef]
  12. Zhang, X.; Davidson, E.A.; Mauzerall, D.L.; Searchinger, T.D.; Dumas, P.; Shen, Y. Managing nitrogen for sustainable development. Nature 2015, 528, 51–59. [Google Scholar] [CrossRef] [Green Version]
  13. Ota, T. Economic growth, income inequality and environment: Assessing the applicability of the Kuznets hypotheses to Asia. Palgrave Commun. 2017, 3, 17069. [Google Scholar] [CrossRef]
  14. Ru, M.; Shindell, D.T.; Seltzer, K.M.; Tao, S.; Zhong, Q. The long-term relationship between emissions and economic growth for SO2, CO2, and BC. Environ. Res. Lett. 2018, 13, 124021. [Google Scholar] [CrossRef]
  15. Soergel, B.; Kriegler, E.; Weindl, I.; Rauner, S.; Dirnaichner, A.; Ruhe, C.; Hofmann, M.; Bauer, N.; Bertram, C.; Bodirsky, B.L.; et al. A sustainable development pathway for climate action within the UN 2030 Agenda. Nat. Clim. Change 2021, 11, 656–664. [Google Scholar] [CrossRef]
  16. Schmidt-Traub, G.; Kroll, C.; Teksoz, K.; Durand-Delacre, D.; Sachs, J.D. National baselines for the Sustainable Development Goals assessed in the SDG Index and Dashboards. Nat. Geosci. 2017, 10, 547–555. [Google Scholar] [CrossRef]
  17. Franks, M.; Lessmann, K.; Jakob, M.; Steckel, J.C.; Edenhofer, O. Mobilizing domestic resources for the Agenda 2030 via carbon pricing. Nat. Sustain. 2018, 1, 350–357. [Google Scholar] [CrossRef]
  18. Liu, Z.; Deng, Z.; He, G.; Wang, H.; Zhang, X.; Lin, J.; Qi, Y.; Liang, X. Challenges and opportunities for carbon neutrality in China. Nat. Rev. Earth Environ. 2021, 3, 141–155. [Google Scholar] [CrossRef]
  19. Lovett, R.A. China’s coal burning cutting lives short by years. Nature news 2013. [Google Scholar] [CrossRef]
  20. Nansai, K.; Tohno, S.; Chatani, S.; Kanemoto, K.; Kagawa, S.; Kondo, Y.; Takayanagi, W.; Lenzen, M. Consumption in the G20 nations causes particulate air pollution resulting in two million premature deaths annually. Nat. Commun. 2021, 12, 6286. [Google Scholar] [CrossRef]
  21. Gao, Y.; Yang, Q.; Li, H.; Wang, X.; Zhan, A. Anthropogenic pollutant-driven geographical distribution of mesozooplankton communities in estuarine areas of the Bohai Sea, China. Sci. Rep. 2019, 9, 9668. [Google Scholar] [CrossRef]
  22. Liu, L.; Wang, J.; Wang, L.; Hu, Y.; Ma, X. Vertical distributions of mercury in marine sediment cores from central and southern part of Bohai Sea, China. Ecotoxicol. Environ. Saf. 2019, 170, 399–406. [Google Scholar] [CrossRef]
  23. Liu, N.; Zhao, X.; Xu, L.; Cai, Y. Temporal and spatial variation, input fluxes and risk assessment of cyclic methylsiloxanes in Rivers-Bohai Sea System. Ecotoxicol. Environ. Saf. 2022, 231, 113169. [Google Scholar] [CrossRef]
  24. Liu, J.; Diamond, J. China’s environment in a globalizing world. Nature 2005, 435, 1179–1186. [Google Scholar] [CrossRef]
  25. Lv, M.; Luan, X.; Liao, C.; Wang, D.; Liu, D.; Zhang, G.; Jiang, G.; Chen, L. Human impacts on polycyclic aromatic hydrocarbon distribution in Chinese intertidal zones. Nat. Sustain. 2020, 3, 878–884. [Google Scholar] [CrossRef]
  26. Cheng, D.; Xue, Q.; Hubacek, K.; Fan, J.; Shan, Y.; Zhou, Y.; Coffman, D.M.; Managi, S.; Zhang, X. Inclusive wealth index measuring sustainable development potentials for Chinese cities. Glob. Environ. Change 2022, 72, 102417. [Google Scholar] [CrossRef]
  27. Yang, L.; Li, S.; Wen, T.; Meng, F.; Chen, G.; Qian, X. Influence of ferrous-metal production on mercury contamination and fractionation in farmland soil around five typical iron and steel enterprises of Tangshan, China. Ecotoxicol. Environ. Saf. 2020, 188, 109774. [Google Scholar] [CrossRef]
  28. Xu, F.; Cui, F.; Xiang, N. Roadmap of green transformation for a steel-manufacturing intensive city in China driven by air pollution control. J. Clean. Prod. 2021, 283, 124643. [Google Scholar] [CrossRef]
  29. Li, Z.; Cai, Y.; Lin, G. Pathways for sustainable municipal energy systems transition: A case study of Tangshan, a resource-based city in China. J. Clean. Prod. 2022, 330, 129835. [Google Scholar] [CrossRef]
  30. Tang, L.; Xue, X.; Jia, M.; Jing, H.; Wang, T.; Zhen, R.; Huang, M.; Tian, J.; Guo, J.; Li, L.; et al. Iron and steel industry emissions and contribution to the air quality in China. Atmos. Environ. 2020, 237, 117668. [Google Scholar] [CrossRef]
  31. Guo, J.; Bao, Y.; Wang, M. Steel slag in China: Treatment, recycling, and management. Waste Manag. 2018, 78, 318–330. [Google Scholar] [CrossRef]
  32. Li, D.; Lan, G.Z.; Kraeger, P.; Wei, M. Tangshan—China’s one time industrial pioneer striving for ecological excellence. Cities 2017, 65, 1–9. [Google Scholar] [CrossRef]
  33. Liu, Q.; Baumgarnter, J.; Zhang, Y.; Liu, Y.; Sun, Y.; Zhang, M. Oxidative potential and inflammatory impacts of source apportioned ambient air pollution in Beijing. Environ. Sci. Technol. 2014, 48, 12920–12929. [Google Scholar] [CrossRef]
  34. Lu, W.; Tam, V.W.Y.; Du, L.; Chen, H. Impact of industrial agglomeration on haze pollution: New evidence from Bohai Sea Economic Region in China. J. Clean. Prod. 2021, 280, 124414. [Google Scholar] [CrossRef]
  35. Wang, T.; Du, H.; Zhao, Z.; Russo, A.; Zhang, J.; Zhou, C. The impact of potential recirculation on the air quality of Bohai Bay in China. Atmos. Pollut. Res. 2022, 13, 101268. [Google Scholar] [CrossRef]
  36. Li, M.; Liu, H.; Geng, G.; Hong, C.; Liu, F.; Song, Y.; Tong, D.; Zheng, B.; Cui, H.; Man, H.; et al. Anthropogenic emission inventories in China: A review. Natl. Sci. Rev. 2017, 4, 834–866. [Google Scholar] [CrossRef]
  37. Li, M.; Zhang, Q.; Streets, D.G.; He, K.B.; Cheng, Y.F.; Emmons, L.K.; Huo, H.; Kang, S.C.; Lu, Z.; Shao, M.; et al. Mapping Asian anthropogenic emissions of non-methane volatile organic compounds to multiple chemical mechanisms. Atmos. Chem. Phys. 2014, 14, 5617–5638. [Google Scholar] [CrossRef]
  38. Liu, F.; Zhang, Q.; Tong, D.; Zheng, B.; Li, M.; Huo, H.; He, K.B. High-resolution inventory of technologies, activities, and emissions of coal-fired power plants in China from 1990 to 2010. Atmos. Chem. Phys. 2015, 15, 13299–13317. [Google Scholar] [CrossRef]
  39. Zheng, B.; Tong, D.; Li, M.; Liu, F.; Hong, C.; Geng, G.; Li, H.; Li, X.; Peng, L.; Qi, J.; et al. Trends in China’s anthropogenic emissions since 2010 as the consequence of clean air actions. Atmos. Chem. Phys. 2018, 18, 14095–14111. [Google Scholar] [CrossRef]
  40. Zhang, Q.; Streets, D.G.; Carmichael, G.R.; He, K.B.; Huo, H.; Kannari, A.; Klimont, Z.; Park, I.S.; Reddy, S.; Fu, J.S.; et al. Asian emissions in 2006 for the NASA INTEX-B mission. Atmos. Chem. Phys. 2009, 9, 5131–5153. [Google Scholar] [CrossRef]
  41. Janssens-Maenhout, G.; Crippa, M.; Guizzardi, D.; Dentener, F.; Muntean, M.; Pouliot, G.; Keating, T.; Zhang, Q.; Kurokawa, J.; Wankmüller, R.; et al. HTAP_v2.2: A mosaic of regional and global emission grid maps for 2008 and 2010 to study hemispheric transport of air pollution. Atmos. Chem. Phys. 2015, 15, 11411–11432. [Google Scholar] [CrossRef]
  42. Li, M.; Zhang, Q.; Kurokawa, J.-I.; Woo, J.-H.; He, K.; Lu, Z.; Ohara, T.; Song, Y.; Streets, D.G.; Carmichael, G.R.; et al. MIX: A mosaic Asian anthropogenic emission inventory under the international collaboration framework of the MICS-Asia and HTAP. Atmos. Chem. Phys. 2017, 17, 935–963. [Google Scholar] [CrossRef] [Green Version]
  43. Streets, D.G.; Bond, T.C.; Carmichael, G.R.; Fernandes, S.D.; Fu, Q.; He, D.; Klimont, Z.; Nelson, S.M.; Tsai, N.Y.; Wang, M.Q.; et al. An inventory of gaseous and primary aerosol emissions in Asia in the year 2000. J. Geophys. Res. Atmos. 2003, 108, 8809. [Google Scholar] [CrossRef]
  44. Su, M.; Wang, Q.; Li, R.; Wang, L. Per capita renewable energy consumption in 116 countries: The effects of urbanization, industrialization, GDP, aging, and trade openness. Energy 2022, 254, 124289. [Google Scholar] [CrossRef]
  45. Pata, U.K.; Aydin, M. Testing the EKC hypothesis for the top six hydropower energy-consuming countries: Evidence from Fourier Bootstrap ARDL procedure. J. Clean. Prod. 2020, 264, 121699. [Google Scholar] [CrossRef]
  46. Driscoll, C.T.; Buonocore, J.J.; Levy, J.I.; Lambert, K.F.; Burtraw, D.; Reid, S.B.; Fakhraei, H.; Schwartz, J. US power plant carbon standards and clean air and health co-benefits. Nat. Clim. Chang. 2015, 5, 535–540. [Google Scholar] [CrossRef]
  47. He, K.; Lei, Y.; Pan, X.; Zhang, Y.; Zhang, Q.; Chen, D. Co-benefits from energy policies in China. Energy 2010, 35, 4265–4272. [Google Scholar] [CrossRef]
  48. Luo, Y.; Zhou, D.; Tian, Y.; Jiang, G. Spatial and temporal characteristics of different types of pollution-intensive industries in the Beijing-Tianjin-Hebei region in China by using land use data. J. Clean. Prod. 2021, 329, 129601. [Google Scholar] [CrossRef]
  49. Zhou, J.; Yin, T.; Tian, J. Research on the impact of Beijing–Tianjin–Hebei electric power and thermal power industry on haze pollution. Energy Rep. 2022, 8, 1698–1710. [Google Scholar] [CrossRef]
  50. Anenberg, S.C.; Schwartz, J.; Shindell, D.; Amann, M.; Faluvegi, G.; Klimont, Z.; Janssens-Maenhout, G.; Pozzoli, L.; Van Dingenen, R.; Vignati, E.; et al. Global Air Quality and Health Co-benefits of Mitigating Near-Term Climate Change through Methane and Black Carbon Emission Controls. Environ. Health Perspect. 2012, 120, 831–839. [Google Scholar] [CrossRef]
  51. Kennedy, C.; Steinberger, J.; Gasson, B.; Hansen, Y.; Hillman, T.; Havránek, M.; Pataki, D.; Phdungsilp, A.; Ramaswami, A.; Mendez, G.V. Greenhouse Gas Emissions from Global Cities. Environ. Sci. Technol. 2009, 43, 7297–7302. [Google Scholar] [CrossRef]
  52. Kennedy, C.; Steinberger, J.; Gasson, B.; Hansen, Y.; Hillman, T.; Havránek, M.; Pataki, D.; Phdungsilp, A.; Ramaswami, A.; Mendez, G.V. Methodology for inventorying greenhouse gas emissions from global cities. Energy Policy 2010, 38, 4828–4837. [Google Scholar] [CrossRef]
  53. Wilson, I.A.G.; Staffell, I. Rapid fuel switching from coal to natural gas through effective carbon pricing. Nat. Energy 2018, 3, 365–372. [Google Scholar] [CrossRef]
  54. Chen, H.; Yang, L.; Chen, W. Modelling national, provincial and city-level low-carbon energy transformation pathways. Energy Policy 2020, 137, 111096. [Google Scholar] [CrossRef]
  55. Moon, W.-K.; Kahlor, L.A.; Olson, H.C. Understanding public support for carbon capture and storage policy: The roles of social capital, stakeholder perceptions, and perceived risk/benefit of technology. Energy Policy 2020, 139, 111312. [Google Scholar] [CrossRef]
  56. Huang, R.; Zhang, S.; Wang, P. Key areas and pathways for carbon emissions reduction in Beijing for the “Dual Carbon” targets. Energy Policy 2022, 164, 112873. [Google Scholar] [CrossRef]
  57. Yu, S.; Yuan, X.; Yao, X.; Lei, M. Carbon leakage and low-carbon performance: Heterogeneity of responsibility perspectives. Energy Policy 2022, 165, 112958. [Google Scholar] [CrossRef]
  58. Shao, H.; Wang, Z. Spatial network structure of transportation carbon emission efficiency in China and its influencing factors. Chin. J. Popul. Resour. Environ. 2021, 19, 295–303. [Google Scholar] [CrossRef]
  59. Zhao, S.; Alexandroff, A. Current and future struggles to eliminate coal. Energy Policy 2019, 129, 511–520. [Google Scholar] [CrossRef]
  60. Cao, R.; Huang, G.H.; Chen, J.P.; Li, Y.P.; He, C.Y. A chance-constrained urban agglomeration energy model for cooperative carbon emission management. Energy 2021, 223, 119885. [Google Scholar] [CrossRef]
  61. Shao, W.; Li, F.; Cao, X.; Tang, Z.; Bai, Y.; Yang, S. Reducing export-driven CO2 and PM emissions in China’s provinces: A structural decomposition and coordinated effects analysis. J. Clean. Prod. 2020, 274, 123101. [Google Scholar] [CrossRef]
  62. Xia, Q.; Quan, M.; Li, H.; Hao, X. Is environmental regulation works on improving industrial resilience of China? Learning from a provincial perspective. Energy Rep. 2022, 8, 4695–4705. [Google Scholar] [CrossRef]
Figure 1. Annual trends in emissions of air pollutants, including BC (a,b), CO (c,d), NH3 (g,h), NOx (i,j), OC (k,l), PM2.5 (m,n), PM10 (o,p), SO2 (q,r) as well as CO2 (e,f), in the eleven cities during the years of 2018–2017.
Toxics 10 00547 g001aToxics 10 00547 g001bToxics 10 00547 g001c
Figure 2. Pearson correlation matrix between energy use per GDP and air pollutants (BC, CO, CO2, NH3, NOx, OC, PM2.5, PM10 and SO2) per GDP, as well as CO2 per GDP.
Toxics 10 00547 g002
Figure 3. (a) CO2 per GDP and GDP per capita in the eleven cities from 2008 to 2017. (b) Energy use per GDP and GDP per capita in the eleven cities from 2008 to 2017. (c) PM2.5 per GDP and GDP per capita in the eleven cities from 2008 to 2017.
Toxics 10 00547 g003
Table 1. Description of the socioeconomic status of the eleven cities.
CityProvinceArea (km2)Population a,b
(10,000 Persons)
GDP a,b
(Chinese Currency, Billion RMB)
GDP per Capita a,b
(Chinese Currency, 10,000 RMB)
Beijing/16,4101770–22001180–29906.9–13.8
Tianjin/11,9661170–1440520–12504.5–8.0
DalianLiaoning12,574613–700295–6056.3–10.0
YingkouLiaoning5427233–24367–1273.0–5.4
PanjinLiaoning4102139–14367–1255.1–7.6
JinzhouLiaoning10,301312–30563–1072.2–3.5
QinhuangdaoHebei7802295–31176–1302.7–4.8
TanshanHebei13,472746–789354–5924.8–7.5
DongyingShandong8243200–215202–38110.0–17.8
WeifangShandong16,167890–936248–5852.8–6.2
YantaiShandong13,864701–706341–6764.0–9.5
a 2008–2017. b The data areobtained from National Bureau of Statistics of China.
Table 2. Summary of air pollutants and CO2 data used in this study.
ItemPeriodUnitData SourceBrief Description
BC2008–2017Metric tonnesMulti-resolution Emission Inventory for China (MEIC)MEIC model generates a database of air pollutants and CO2 over China with regular updates using the bottom-up technical method based on a series of improved emission inventory models, which includes unit-based emission inventories for power plants and cement plants, a high-resolution county-level vehicle emission inventory, a residential combustion emission inventory based on national-wide survey data, and an explicit profile-based non-methanevolatile organic compound (NMVOC) speciationframework. The data areavailable at http://www.meicmodel.org (accessed on 1 November 2021).
CO
CO2
NH3
NOx
OC
PM2.5
PM10
SO2
Table 3. The summary of the monthly concentration of air pollutants (metric kilotonnes) and CO2 (metric million tonnes).
CityBCCOCO2NH3NOxOCPM2.5PM10SO2
Beijing0.6–1.5148–2608.0–162.0–6.05.0–181.0–2.81.8–4.22.0–5.62.0–12.3
Tianjin0.8–1.880–2006.0–162.0–5.022–320.8–2.61.2–2.23.0–5.85.0–22.0
Dalian0.8–1.080–1004.2–5.51.8–4.011–140.5–2.02.0–3.22.4–4.04.8–11.6
Yingkou0.5–0.715–221.4–4.21.0–2.42.4–4.80.5–1.10.8–1.81.0–2.23.0–8.2
Panjin0.15–0.252.2–3.10.6–1.00.8–2.02.0–3.20.2–0.480.4–0.70.5–0.91.5–7.6
Jinzhou0.5–0.720–251.8–3.01.2–2.26.4–100.5–1.41.5–1.81.6–2.02.5–14.0
Qinghuangdao0.5–0.650–652.4–4.00.8–2.03.0–8.00.5–0.91.0–1.51.5–2.22.0–7.0
Tanshan0.8–1.6200–34012–193.0–7.020–351.0–3.86.0–10.07.0–11.015.0–30.0
Dongying0.7–1.060–802.5–6.01.8–4.22.8–4.80.6–2.21.6–4.82.0–6.03.0–12.0
Weifang0.4–1.0150–2203.0–5.01.5–4.05.0–110.4–1.62.0–5.43.0–6.05.0–15.0
Yantai0.6–1.160–1204.0–5.61.2–3.89.0–110.6–2.01.8–3.82.0–4.44.0–11.0
Table 4. The classification of 11 cities according to the development types.
TypesCity aReference
Human capital-dominated developmentBeijing[26]
Produced capital-dominated developmentTianjin, Dalian, Yingkou, Jinzhou, and Panjin in Liaoning Province, as well as Weifang and Yantai in Shandong Province[26]
Energy-producing cityDongying in Shandong Province[26]
a The cities of Tangshan and Qinhuangdao were not grouped due to the absences of the data.
Publisher’s Note: MDPI stays neutral with regard to jurisdictional claims in published maps and institutional affiliations.

