Article

Gene Expression Analysis of the Stress Response to Lithium, Nickel, and Zinc in Paracentrotus lividus Embryos

Istituto per la Ricerca e l’Innovazione Biomedica, Consiglio Nazionale delle Ricerche, Via Ugo La Malfa 153, 90146 Palermo, Italy
*
Authors to whom correspondence should be addressed.
Toxics 2022, 10(6), 325; https://doi.org/10.3390/toxics10060325
Submission received: 30 March 2022 / Revised: 6 June 2022 / Accepted: 11 June 2022 / Published: 14 June 2022

Abstract

:
Many anthropogenic pollutants such as metals are discharged into the marine environment through modern sources. Among these, lithium (Li), nickel (Ni), and zinc (Zn) can interfere with biological processes in many organisms when their concentration rises. These metals are toxic to sea urchin embryos, affecting their development. Indeed, animal/vegetal and dorso/ventral embryonic axes are differently perturbed: Li is a vegetalizing agent, Ni can disrupt dorso-ventral axis, Zn can be animalizing. To address the molecular response adopted by embryos to cope with these metals or involved in the gene networks regulating embryogenesis, and to detect new biomarkers for evaluating hazards in polluted environments in a well-known in vivo model, we applied a high-throughput screening approach to sea urchin embryos. After fertilization, Paracentrotus lividus embryos were exposed to Li, Ni, and Zn for 24/48 h. At both endpoints, RNAs were analyzed by NanoString nCounter technology. By in silico analyses, we selected a panel of 127 transcripts encoding for regulatory and structural proteins, ranked in categories: Apoptosis, Defense, Immune, Nervous, Development, and Biomineralization. The data analysis highlighted the dysregulation of many genes in a metal-dependent manner. A functional annotation analysis was performed by the KEEG Orthology database. This study provides a platform for research on metals biomarkers in sea urchins.

1. Introduction

The use of metals has accompanied civilization and is closely linked to anthropogenic activities due to their chemical characteristics [1]. Metals are present in many environments at variable concentrations. Some of them are essential, for example, zinc (Zn), copper, and manganese, which play key roles in many cellular metabolic processes in living organisms, while other metals are non-essential, not having a physiological role, as for example lead, cadmium (Cd), and lithium (Li) [1,2]. Others, such as nickel (Ni), are essential elements in plants and microorganisms, while in animals their essentiality is controversial [3]. Metals can be released into the environment by different types of human activities such as mining, urban runoff, sewage discharge, and chemical compounds applied to crops for insect or disease control [2]. Regardless of their essentiality or not, when metal concentrations raise, they become chronic and toxic with harmful effects for both marine and terrestrial organisms, including humans [2]. In this regard, several metals have been included in the 2019 Substance Priority List by the Agency for Toxic Substances and Disease Registry (ATSDR) (https://www.atsdr.cdc.gov/spl/ (accessed on 30 June 2021)), because they pose the most significant potential threat to human health due to their known or suspected toxicity. The potential hazards for human exposure, and the bioavailability of some metals, such as lead, cadmium, zinc, copper, manganese, iron, mercury, arsenic, and barium, have been described in marine environments, as well as metals bioaccumulation by numerous marine organisms [4,5]. Although there are many studies on the toxic effects and accumulation of metals in different marine organisms [5], relatively little is known about their molecular effects. This is also the case with Ni, Zn, and Li. Ni and Zn are essential elements for the normal growth and development of aquatic organisms if present in trace amounts [6]. In seawater, Ni and Zn are normally present at low concentrations, 0.1–1.0 and 0.006–0.12 μg L−1, respectively [6]. However, at high concentrations or in chronic conditions, they can have adverse effects on many marine biota [3,6]. Concentrations of up to 250 μg/L of dissolved Ni can be detected in coastal areas, and up to 2 mg/L can be found in industrially contaminated water [3]. Ni toxicity has been studied in different marine species that showed diverse sensitivity to different Ni concentrations [3,7]; Ni EC10s values ranged from 2.9 μg/L for the embryos of the tropical sea urchin Diadema antillarum to 20,760 μg/L for the larvae of the sheepshead minnow Cyprinodon variegatus [7]. Zn level depends on the geological regions and pollution sources (air, soil, and rivers), with seawater salinity and pH affecting the relative proportion of different inorganic complexes with uncomplexed Zn2+, which is the most bioavailable form of Zn at the pH of seawater [6]. For example, among the marine organisms (crabs, prawns, and six different varieties of fish species) collected in an anthropic impacted area near Mumbai city (India), the highest concentration of Zn (31.2 mg/kg) was found in crabs [8]. Although from a geochemical point of view Li is a rare metal, nowadays many electronic devices in daily use require lithium-ion batteries, thus Li will increasingly be a key resource in the future [9]. Some studies recorded the highest levels of Li in natural waters in Chile and Bolivia [9] and rivers in China [10], evaluating its effects on the relative impacted population. Biochemical and molecular effects of Li on signal transduction cascades, hormonal and neural regulation, ion transport, and gene expression were already known [11]. Moreover, Li is one of the most effective drugs used in medicine to cure mental illnesses [12]. Minor attention has been given to Li as a pollutant agent in seawater. Very recently, a large-scale survey of Li concentrations was conducted in 33 species of bivalves, cephalopods, crustaceans, and fishes (whole organisms and different organs) from three distinct geographic areas [13]. The study showed that Li is homogeneously distributed in the ocean (at 0.18 μg/mL), while its concentrations in soft tissues vary greatly (from 0.01 to 1.20 μg/g dry weight) [13].
The sea urchin embryo is one of the best-studied model organisms since the birth of experimental embryology. It was classically used in experiments on blastomere isolation and recombination [14]. More recently, the sea urchin embryo was used to study the mechanisms of gene regulation in early development [15] and to describe the sequential regulatory changes that specify and diversify the embryonic cells [16]. In this respect, Li, Ni, and Zn have been useful to study the gene regulatory networks (GRNs) in sea urchin embryos, i.e., they have been considered models to describe the specification of the endo-mesoderm and the ectoderm [17,18,19], exploiting their effects on the animal/vegetal (A/V) and dorso-ventral (D/V) axes establishment. Li is reported to be a vegetalizing agent, inducing presumptive ectoderm to differentiate as endo-mesoderm, sometimes producing exogastrulae with an everted gut [20]. Ni disrupts the D/V axis, forming radialized embryos, mainly affecting ectodermal differentiation and pattern formation of mesenchyme cells, overexpressing ventral genes at the expense of the dorsal ones [21]. Sub-lethal concentrations of Zn induce animalization, i.e., increase the specification of the ectoderm cells at the animal pole and reduce the specification of endo-mesoderm territories [19].
The sea urchin embryo has also been used successfully as a model to analyze the molecular defense systems adopted to cope with a variety of pollutants, including metals [22]. Furthermore, high-throughput screening approaches are increasingly used to analyze the molecular response to chemicals in marine invertebrates. For instance, transcriptomic analysis was applied to evaluate crude oil effects on the oyster Crassostrea virginica [23]. Different approaches have been used to identify differentially expressed genes in Strongylocentrotus nudus embryos exposed to triclosan, i.e., cDNA microarray [24], and to characterize the response of Paracentrotus lividus embryos to UV radiation, cadmium, and their combination, i.e., NanoString nCounter technology [25].
The aim of this study was to obtain an overview of the genes modulated in P. Lividus sea urchin embryos to cope with acute doses of LiCl, NiCl2, and ZnSO4 after 24 and 48 h of treatments, by the multiplex analysis of NanoString nCounter technology. In total, we selected 127 genes organized into six categories, i.e., Apoptosis (Ap), Defense (Def), Immune (Imm), Nervous (Ner), Development (Dev), and Biomineralization (Bm), and took into consideration the territorial expression and functions of the analyzed genes. In addition, we tried to identify the potential biomarker genes particularly sensitive to the three metals, i.e., Li, Ni, and Zn, respectively, and greatly affected by them.

2. Materials and Methods

2.1. Embryo Culture

Gametes were collected from gonads of the P. lividus sea urchin harvested along the northwestern coast of Sicily. Eggs were fertilized and embryos were reared at 18 °C in Millipore (Billerica, MA, USA) filtered seawater (MFSW) containing antibiotics (50 mg/L streptomycin sulfate and 30 mg/L penicillin).

2.2. Metals Treatment of P. lividus Embryos

Caution: LiCl, NiCl2 and ZnSO4 are hazardous chemicals and should be handled carefully.
To study the embryonic response induced by Li, Ni, and Zn in P. lividus sea urchin embryos, we took advantage of a previous study [26]. Briefly, embryos were continuously cultured in the presence of 30 mM LiCl (Li) (Sigma-Aldrich, St. Louis, MO, USA), 0.5 mM NiCl2 (Ni) (Sigma-Aldrich, St. Louis, MO, USA) and 0.1 mM ZnSO4 (Zn) (Sigma-Aldrich, St. Louis, MO, USA), henceforth defined as Li-embryos, Ni-embryos, and Zn-embryos, respectively. Metals were added to embryo cultures 30 min. after fertilization. To collect embryos for subsequent analyses, we chose the endpoints corresponding to 24 and 48 h post-fertilization (hpf), when controls (unexposed embryos) reached gastrula and pluteus stages, respectively. Embryo morphologies were monitored using a microscope Axioscop 2 plus (Zeiss, Jena, Germany) both on live and fixed embryos with 0.1% formaldehyde in seawater. Images were recorded by an Axiocam camera (Model 412–312, Zeiss, Jena, Germany).

2.3. Indirect Immunofluorescence (IF)

IF experiments on whole-mount embryos were performed as described previously [27] with some modifications. Briefly, paraformaldehyde (PFA, Sigma-Aldrich, St. Louis, MO, USA)-fixed embryos were incubated with TBST [10 mM Tris-HCl (pH 8), 150 mM NaCl, 0.1% Tween 20] containing 4% donkey serum (DS), and 0.5% BSA (DS/BSA-TBST) for 1 h.
The ciliary band was specifically labeled with a monoclonal antibody 295 (kindly provided by Prof. McClay, Department of Biology, Duke University, 124 Science Drive, Box 90338, Durham, NC 27708, USA) diluted 1:5 in TBST. Rabbit polyclonal anti-Sox2 (Sigma-Aldrich, St. Louis, MO, USA) was used at a dilution of 1:25 in 0.25% DS-TBST. Both primary antibodies were incubated overnight at 4 °C with specimens and, after washing in TBST, the fluorescent-labeled secondary and appropriate antibodies (Alexa Fluor 488-conjugated goat anti-mouse or Alexa Fluor 555-conjugated donkey anti-rabbit) (Invitrogen Molecular Probes, Carlsbad, CA, USA) were diluted 1:200 in TBST and incubated for 1 h at room temperature.
For double-labeling of 295 and Sox2, embryos were incubated in blocking buffer DS/BSA-TBST for 1 h and incubated with both primary antibodies (diluted 1:5 for 295 and 1:25 for Sox2) in 0.25% DS-TBST overnight at 4 °C. Secondary antibodies were used as described in the single immunostaining.
All embryos were observed under a Leica DM4000 microscope (Leica Microsystems, Wetzlar, Germany), equipped for epifluorescence, and images were recorded using a digital camera system. Images were edited using Adobe Photoshop CS2 software. Negative controls were performed for every set of experiments by omitting the primary antibodies.

2.4. nCounter NanoString Gene Expression Assay

Embryos from the samples treated with Li, Ni, and Zn, respectively, were processed following the manufacturer’s instructions of the RNeasy mini-Kit (Qiagen, Germantown, MD, USA) to extract total RNA, then quantified using the D30 bio-photometer (Eppendorf, Hamburg, Germany). 100 ng of total RNA was used to apply nCounter NanoString technology (https://www.nanostring.com/company/about-us (accessed on 1 January 2018)) provided by Diatech Labline SRL (Jesi, Italy), in order to analyze the expression of a panel of 127 P. lividus transcripts, selected and retrieved from the National Centre for Biotechnology Information (NCBI) nucleotide database (http://NCBI.nlm.nih.gov (accessed on 1 January 2018)). Briefly, unique custom-made probes developed for the selected P. lividus sequences were hybridized with total RNA samples. Then, each hybridized barcoded transcript was detected and counted by a digital analyzer for image acquisition and data recording. The expression level was measured after normalization of the resulting digital counts of each transcript with those of the Pl-Z12-1 reference gene (Accession Number: LT900344) [28]. Then, the normalized counts of each transcript were compared between control and treated embryos to obtain the fold-change values.
We organized the analyzed genes into six arbitrary categories, in alphabetical order: Apoptosis (Ap), Biomineralization (Bm), Defense (Def), Development (Dev), Immune (Imm), and Nervous (Ner). The heat map was generated by applying the conditional formatting in Microsoft Excel, setting as rule three range of fold values, <−2 (violet), >+2 (green), and between −2 and +2 (yellow) corresponding to the colors indicated in brackets.

2.5. Real-Time Quantitative PCR (qPCR)

Total RNA from P. lividus control and treated embryos, the same utilized for the nCounter Nanostring analysis, was reverse transcribed to obtain the corresponding cDNA as described in Russo et al. [26]. In order to quantify gene expression, the cDNAs were amplified by using SYBR Green technology, based on a Comparative Threshold Cycle Method [29], according to the manufacturer’s instructions (Applied Biosystems StepOnePlus instrument, Grand Island, NY, USA) and as previously described [26]. Pl-Z12-1 mRNA was used as a reference gene. The primer sequences of the genes utilized for qPCR were previously reported: 14-3-3 [30], metallothionein (mt) [31], jun [32], alx1, carbonic anhydrase (can), galectin-8 (gal-8) [25]. The primer specificity and accuracy were confirmed by the “melting curve”, carried out during the real-time PCR.

2.6. KEGG Enrichment Analysis

Enrichment analysis was performed for all the genes modulated by each metal and those modulated by all the three metals, using the integrated KEGG Orthology (KO) database (in particular, KEGG pathway map and BRITE hierarchy databases; https://www.genome.jp/kegg/ko.html (accessed on 1 June 2022)), selecting S. purpuratus as an organism (entry code: spu; genome number: T01019). The KO database includes molecular functions that are represented in terms of functional orthologs. Each gene is given a KO identifier, which represents a functional ortholog defined on the basis of the similarity of its sequence with orthology genes from other organisms, to generate organism-specific versions of KEGG pathways (database, path) and BRITE hierarchies (database, br), to deduce high-level functions of the organism.

2.7. Statistical Analysis

QPCR values are reported as the mean of three independent qPCR analyses ± SD, using cDNAs obtained by the same experiment of P. lividus embryos exposed to Li, Ni, and Zn used for the nCounter NanoString analysis. QPCR decimal values were transformed into negative values to compare them to NanoString values. Results were compared using OneWay analysis of variance, ANOVA followed by Tukey’s HSD test, used as a post-hoc test for mean comparison. All the analyses were performed using the OriginPro 8.1 statistical program (OriginLab Corp), and the level of significance was set to p ≤ 0.05.

3. Results

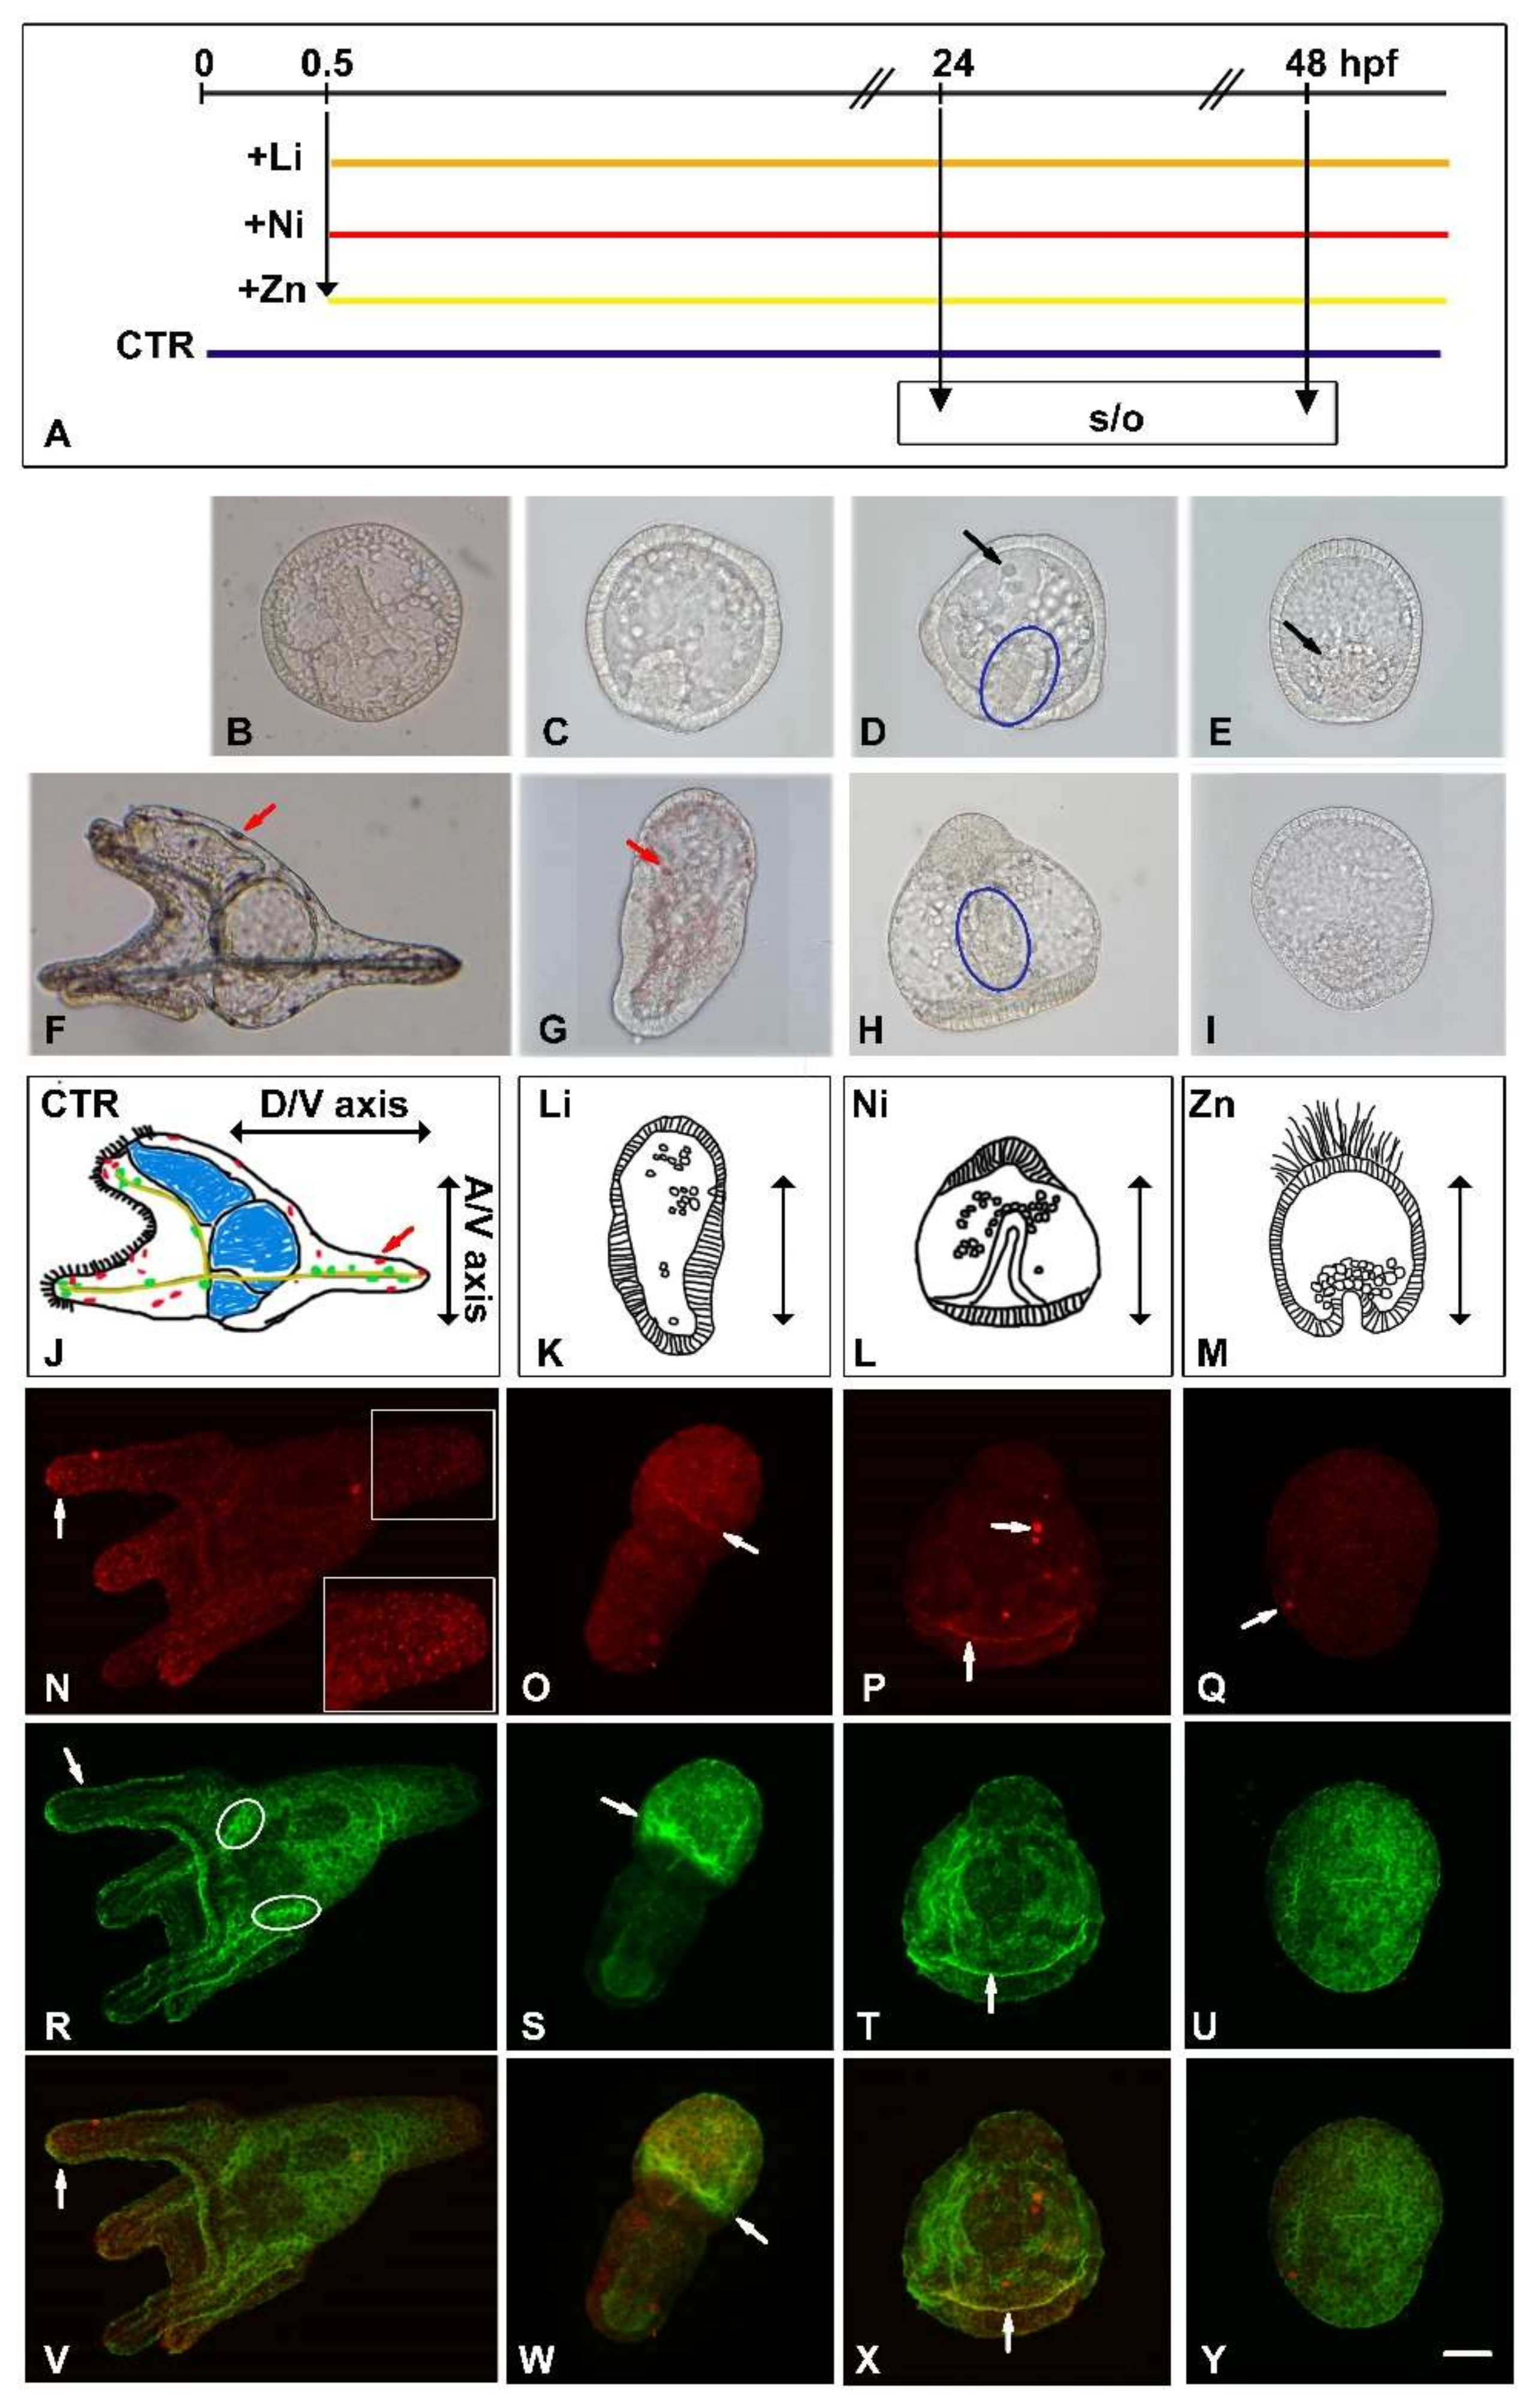
3.1. Developmental Effects of Li, Ni and Zn on Sea Urchin Embryos

It is known that metals such as Li, Ni, and Zn perturb territorial differentiation during the development of diverse sea urchin species. We have previously shown that the sublethal doses of 30 mM LiCl, 0.5 mM NiCl2, and 0.1 mM ZnSO4 produced homogeneous populations of abnormal P. lividus embryos, each with a characteristic morphology [26,33]. Here, we selected the same doses to continuously treat the embryos for 24 and 48 hpf for subsequent molecular analyses.
Figure 1A shows the experimental design and Figure 1B–I confirms the previously observed morphologies and therefore the reproducibility of the experiment. In particular, at 24 hpf, the untreated normal embryos were at the gastrula stage with an elongated archenteron and two triradiate spicules (corresponding to the initial formation of the skeleton) (Figure 1B). The vegetalized Li-embryo (reduced ectoderm and increased endomesoderm, see Ghiglione et al. [20]) had an early gastrula shape with a very short invaginated archenteron and many cells spread inside the blastocoelic cavity (Figure 1C). The radialized Ni-embryo also had a short archenteron (indicated by a blue ellipse in Figure 1D) with cells grouped inside the blastocoelic cavity, some of which were above the equatorial plane (black arrow in Figure 1D). The animalized Zn-embryo looked like a blastula with a group of cells arranged as a presumptive invaginating archenteron (black arrow in Figure 1E). At 48 hpf, untreated embryos reached the pluteus stage (Figure 1F, lateral view), with a tripartite gut, elongated and patterned spicules, and pigment cells (red arrow), see also the drawing in Figure 1J. At this stage, all treatments greatly affected embryos development, as shown by images (Figure 1G–I) and drawings (Figure 1K–M) reporting the different embryonic morphologies and the direction of the developmental axes, i.e., animal-vegetal (A/V) and dorso-ventral (D/V). Li-embryos had a typical endoderm-derived everted gut and a sphere with many pigment cells (red arrow) (Figure 1G,K). Ni-embryos had a straight gut, a thickened animal cap that provided a typical bell shape, and some cells grouped near the archenteron (blue ellipse in Figure 1H,L). Zn-embryos maintained a blastula-like shape (Figure 1I,M). To highlight the morphological diversities, we performed an indirect immunofluorescence (IF) analysis using the anti-Sox2 antibody (Figure 1N–Q), a marker of the nervous system [34], and 295 monoclonal antibody (Ab-295), which recognizes the epithelium of ciliated cells of the embryonic arms, surrounding the mouth, called ciliary band associated to the embryonic nervous system (Figure 1R–U) [35]. The anti-Sox2 is a commercial antibody against a synthetic peptide corresponding to residues 32–47 of human Sox2, homologous to the Strongylocentrotus purpuratus SoxB1. In normal embryos, anti-Sox2 labeled the ciliary band (see white arrow in Figure 1N) and some cells in the pluteus apex (see 1.4× magnification within the white frame). In metals-treated embryos, anti-Sox2 labeled a belt of cells in Li and Ni embryos, and very few cells in the Zn-embryos (see white arrows in Figure 1O–Q). In normal embryos, in addition to recognizing the ciliary band (Figure 1R, white arrow), the Ab-295 also labeled two small central ganglionic structures, indicated by white ellipses in Figure 1R. In Li-embryos, the Ab-295 clearly labeled the animal ectoderm separated from vegetal endomesoderm (Figure 1S). In Ni-embryos, the Ab-295 labeled the ciliary band delimited from the vegetal region (Figure 1T, white arrow), while in Zn-embryos, it labeled the embryo uniformly (Figure 1U). In the merged images (Figure 1V–Y), the yellow color highlights the co-localization of anti-Sox2 and Ab-295 in some cells of the ciliary band in normal embryos (Figure 1V, arrow) as well as in Li- and Ni-embryos (see arrows in Figure 1W and 1X, respectively).

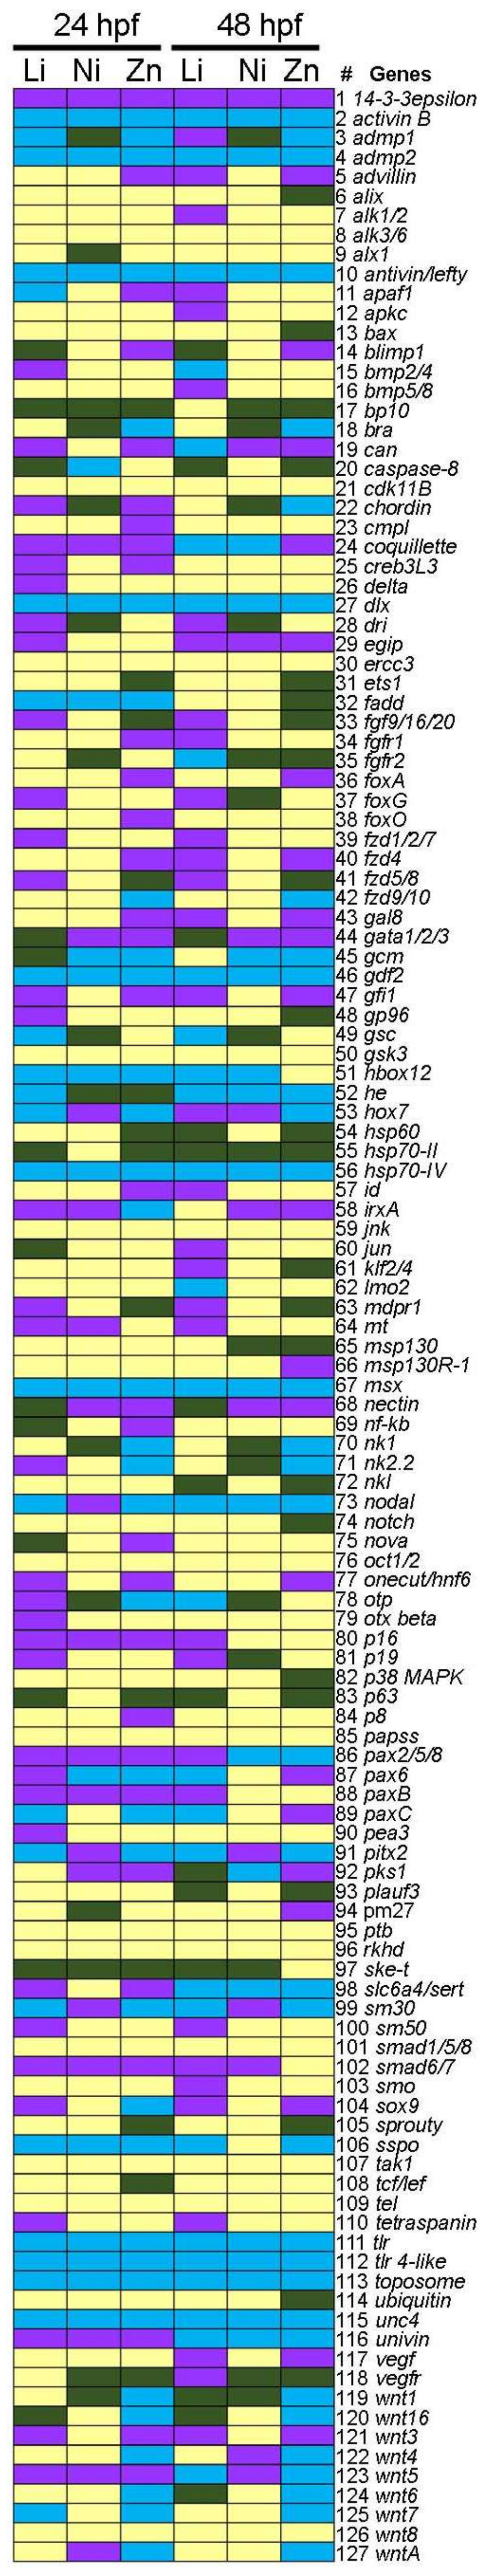
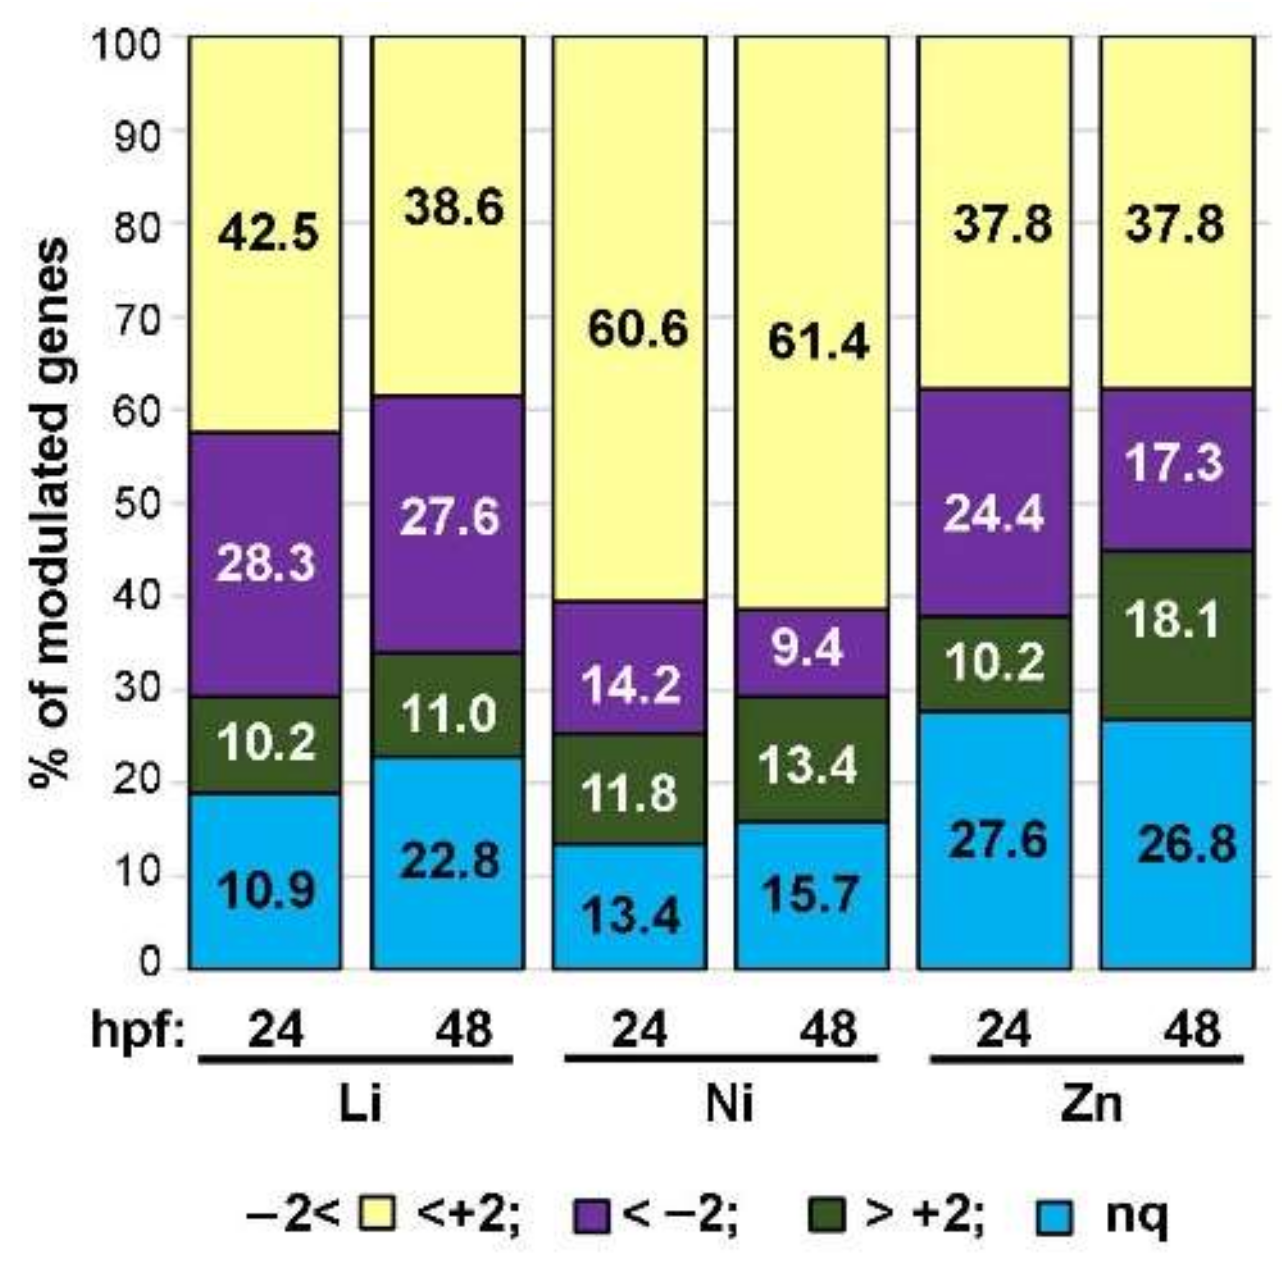
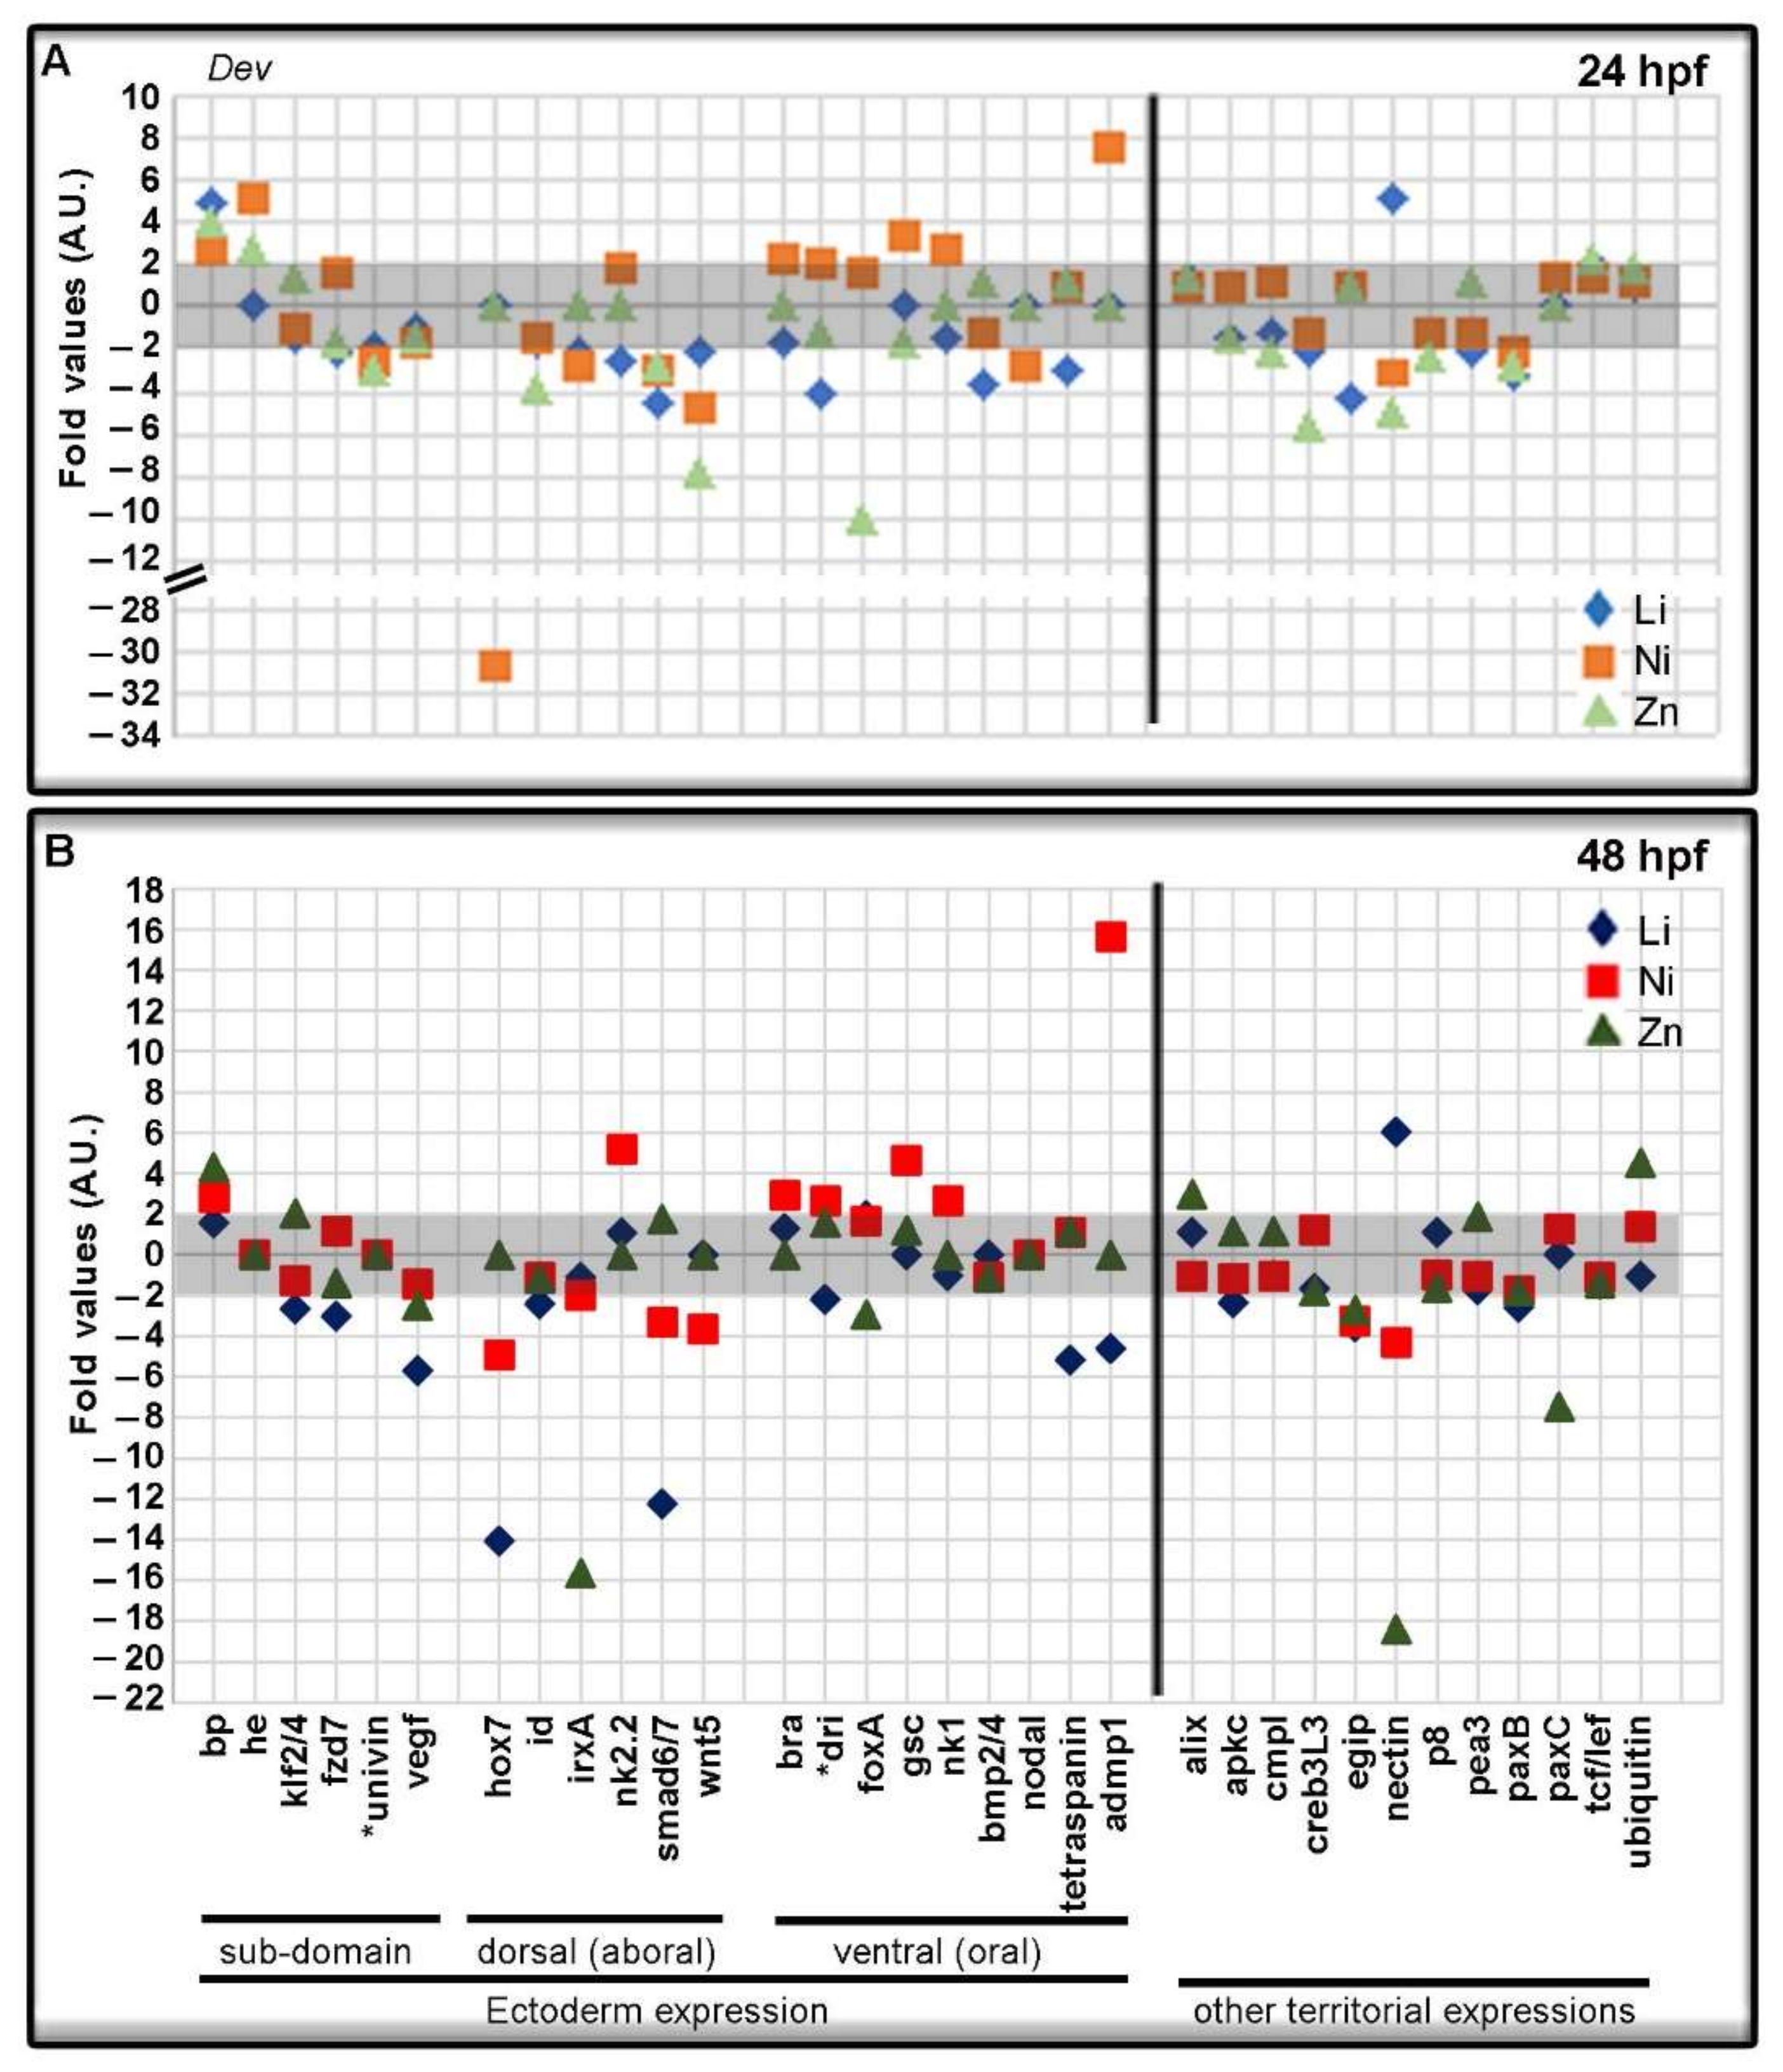
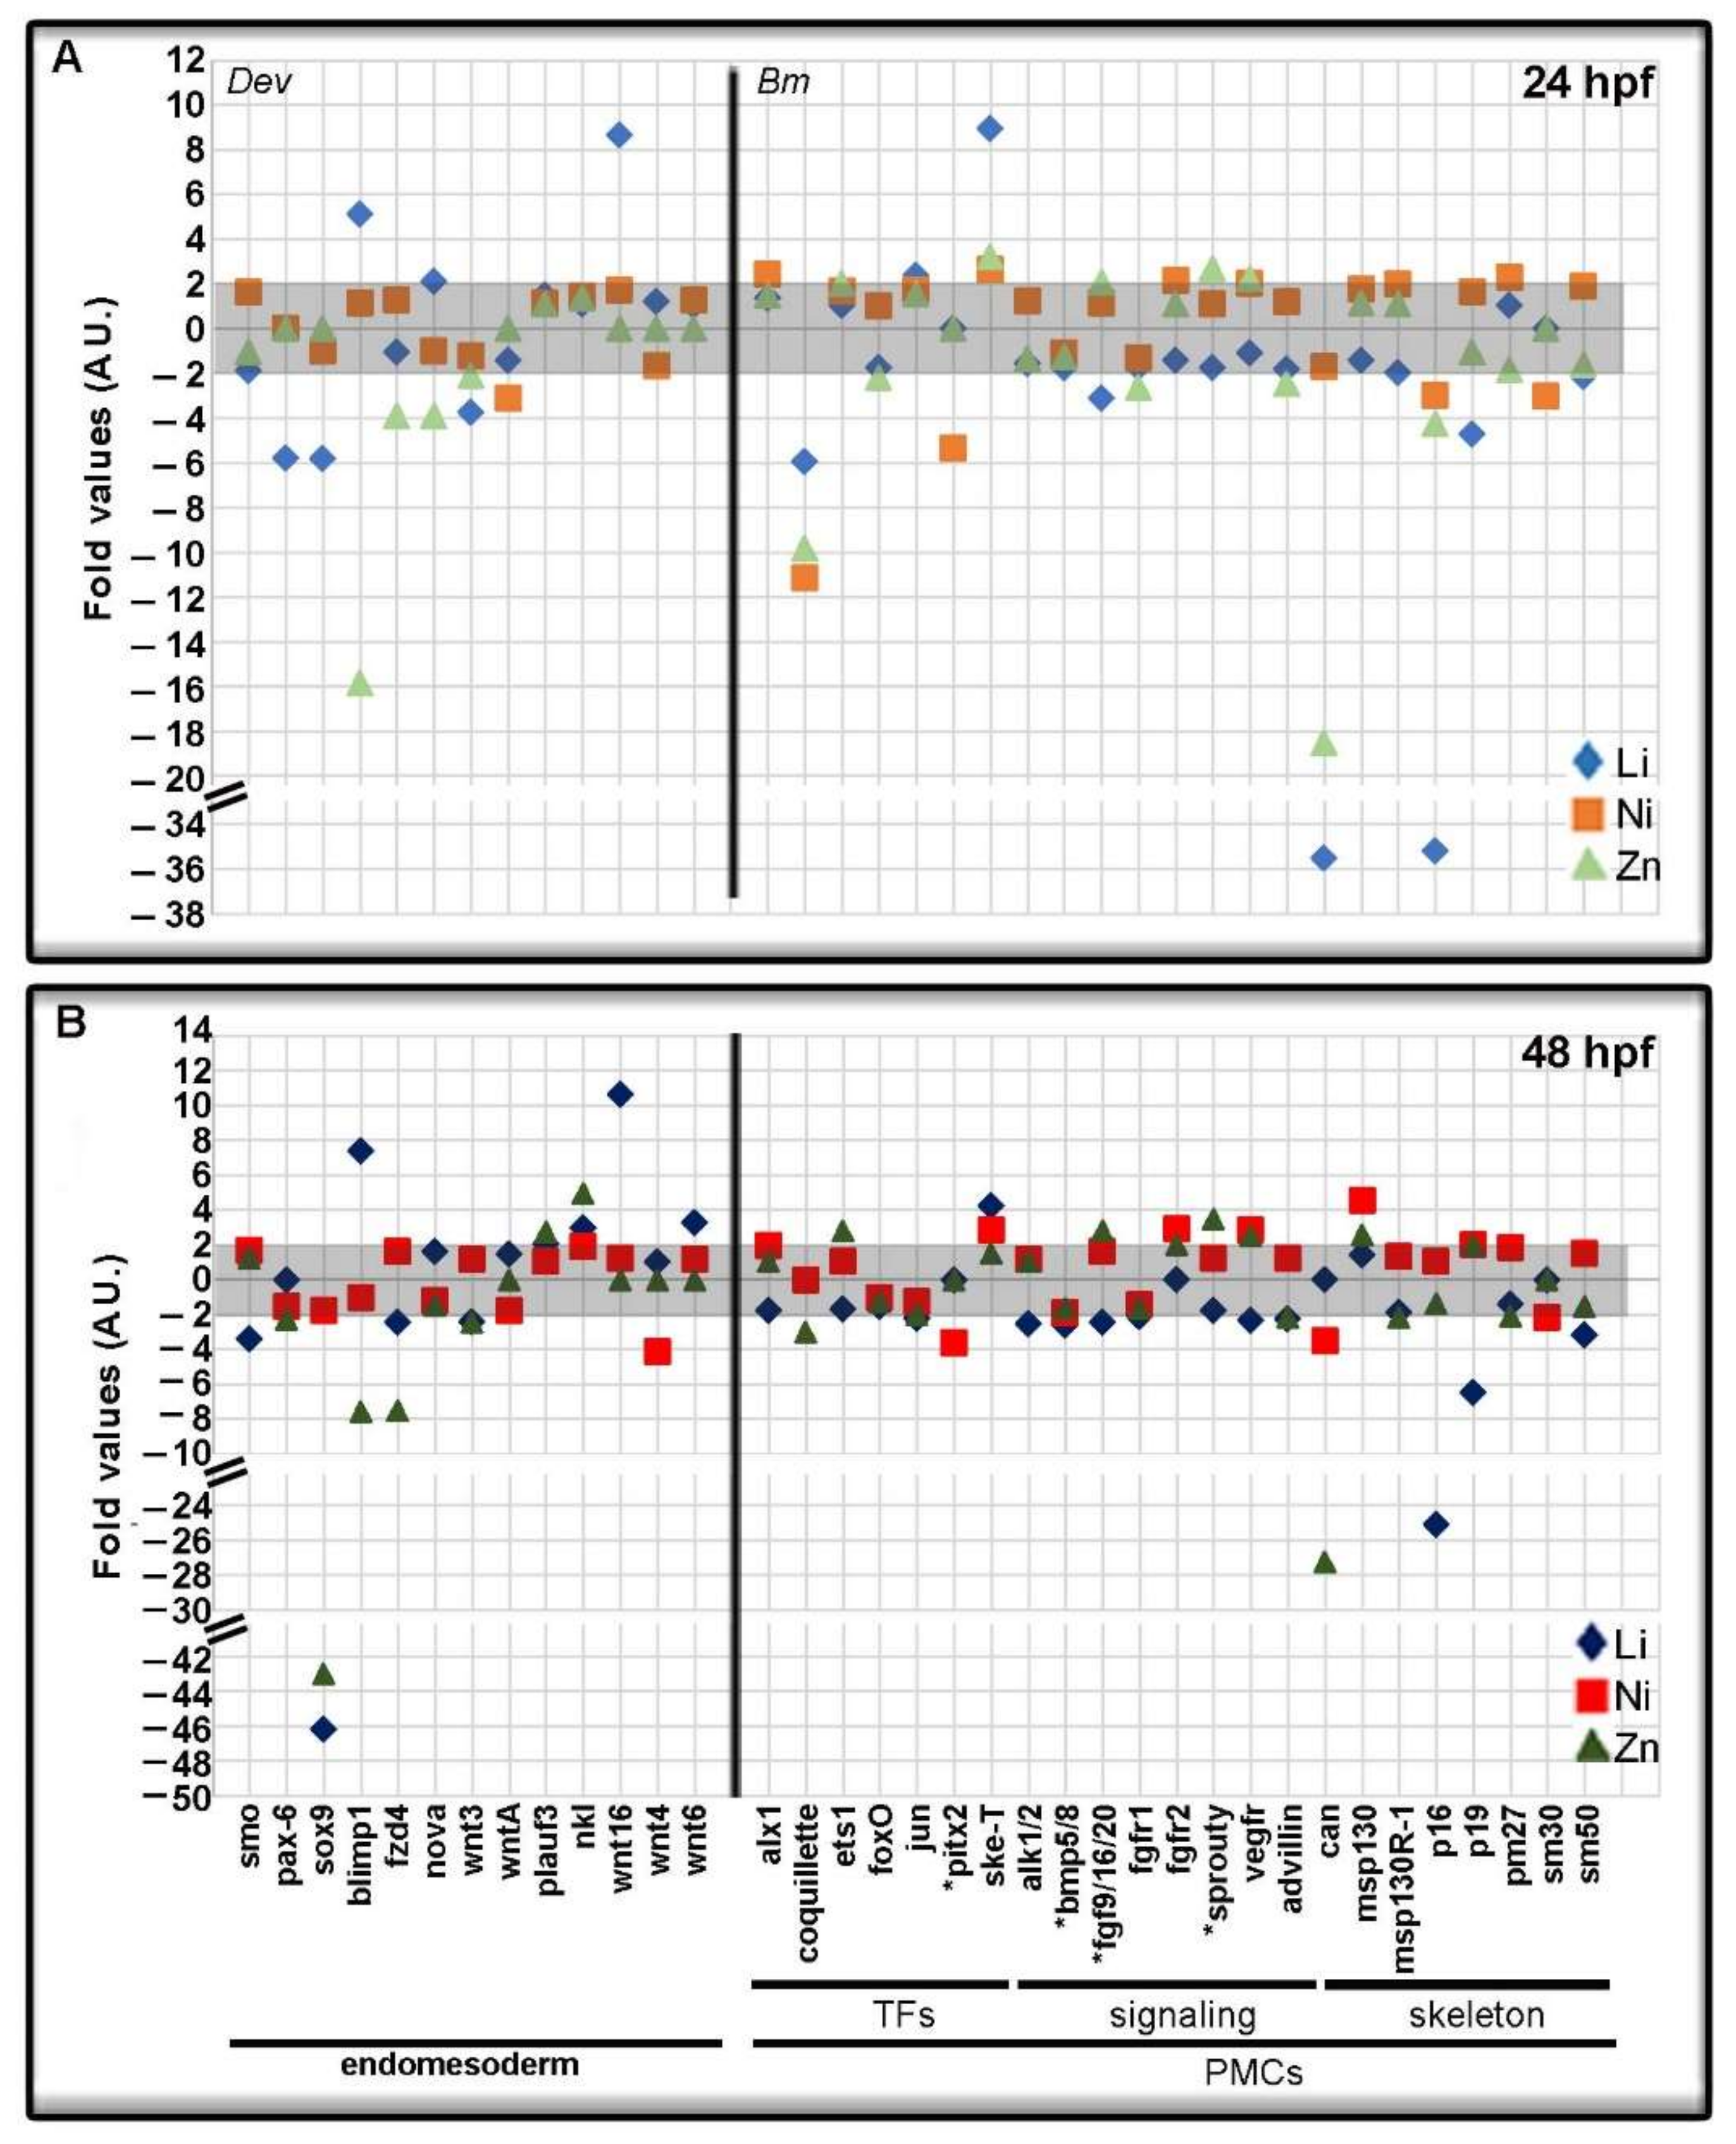
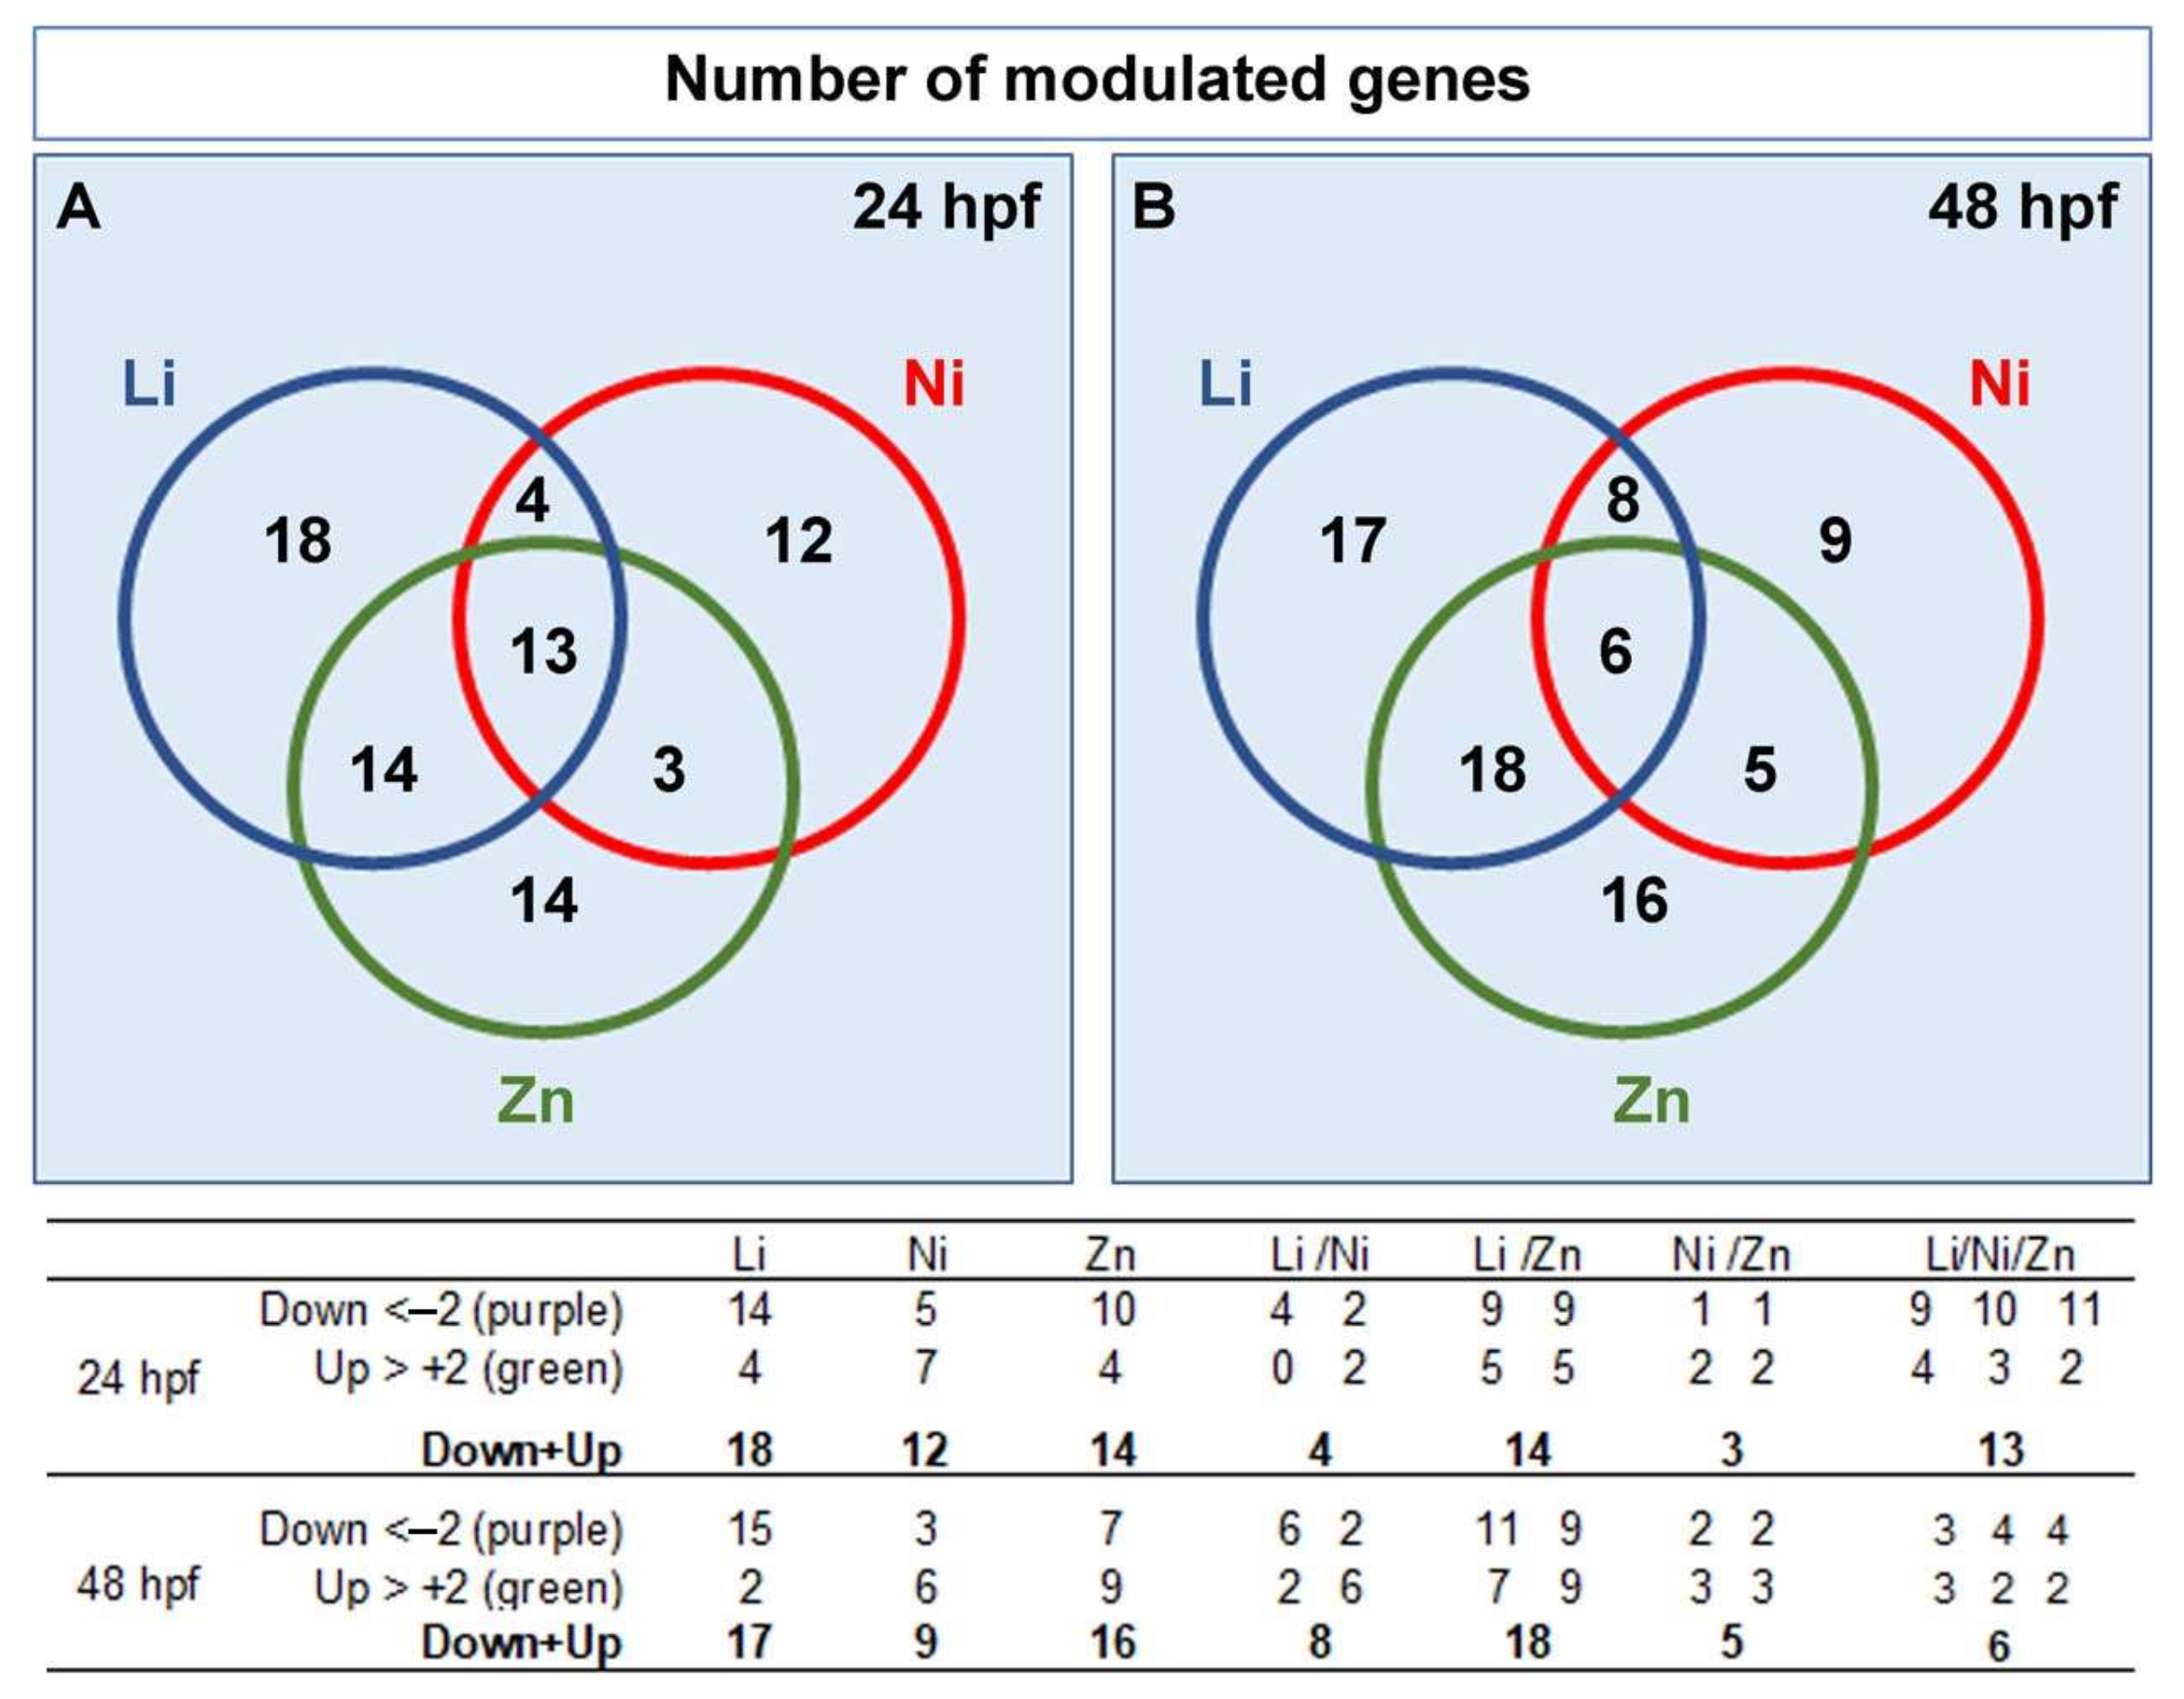
3.2. Profiling Transcriptional Outputs in Li, Ni, Zn Treated Embryos

We applied a high-throughput molecular approach to analyze the gene expression profile of sea urchin embryos exposed to acute doses of Li, Ni, and Zn, with the aim of focusing on those genes differentially expressed to cope with these agents singly applied. 127 transcripts of the sea urchin P. lividus were specifically selected after a careful study from the NCBI database and used to perform the multiplex RNA analysis by nCounter NanoString technology in embryos at 24 and 48 hpf.
We chose to organize the selected genes into six categories described in Section 2. For some of them, we also reported some subcategories and their territorial expression, taking into consideration their functions (see Table S1).
In Figure 2, the heat map shows an overview of the genes modulated by the treatments with the three different metals, where fold-change values higher or lower than +2 and −2 (compared to controls) were considered as significant increase/decrease, as suggested by the NanoString technique. The fold-change expression values of the 127 genes, calculated on previously normalized data (see M and M), are reported in Table S1. The cell fill color identifies the responsive genes, i.e., those upregulated in green (>+2), downregulated ones in violet (<−2), and not responsive ones in light yellow. The light blue identifies the no-quantifiable genes (digital counts lower than 50), assuming that they were very poorly expressed in the control and/or in the samples and thus to be excluded according to the manufacturer’s instructions.
Figure 3 summarizes the percentages of genes modulated or not by the metals at 24 and 48 hpf using the color code previously established for the heat map. In general, most of the genes were not affected (values between −2 and +2, light yellow in Figure 3) by metal treatments at both endpoints analyzed or were not quantified (light blue in Figure 3). Notably, the highest percentages of unaffected genes (60.6% and 61.4% at 24 and 48 hpf, respectively) were observed in Ni-embryos. As for the affected genes, although the three metals modulated the analyzed genes differently, these modulations did not substantially vary at the two endpoints of 24 and 48 hpf for each metal. In particular, Li triggered the modulation of 38.6% of the genes (49 in total) at both 24 and 48 hpf, with higher values for the downregulated genes (28.3% and 27.6%) than for the upregulated ones (10.2% and 11%) at both endpoints. As already highlighted, Ni treatment modulated a low percentage of genes, i.e., 26% (33 out 127 genes) at 24 hpf and 22.8% (29 out 127 genes) at 48 hpf, with similar percentages between downregulated (14.2% and 9.4%) and upregulated (11.8% and 13.4%) genes at both endpoints. Even in Zn-embryos, similar percentages of modulated genes were observed at both endpoints, i.e., 34.6% (44 genes) at 24 hpf and 35% (45 genes) at 48 hpf, with noteworthy differences between up- (24.4% vs. 17.3%) and downregulated (10.2% vs. 18.1%) genes (Figure 3).
We further summarized nCounter NanoString data in the scatter plots of Figure 4, Figure 5 and Figure 6, to analyze in detail the various genes divided into categories and sub-categories.
In Figure 4, the data for the genes belonging to Ap, Def, Imm, and Ner categories at 24 hpf (Figure 4A) and 48 hpf (Figure 4B) are reported. Focusing on the Ap category, Ni did not affect genes at both endpoints analyzed, differently from Li and Zn which modulated the expression of these genes. In particular, apaf1 was downregulated by Zn at 24 hpf (−3.16-fold) and Li at 48 hpf (−2.94-fold), while bax was only upregulated by Zn at 48 hpf (2,68-fold). Li upregulated caspase-8 (3.20 and 2.70-fold) at both times, while Zn upregulated it at 48 hpf (2.51-fold). p63 gene was upregulated at both 24 and 48 hpf by Li (2.89 and 2.44-fold) and Zn (2.52 and 6.36-fold). Among Def genes at both analyzed endpoints, 14-3-3epsilon gene was downregulated by Li, Ni, and Zn with the greatest effect due to Zn treatment at 48 hpf (−9.16-fold).
Ni affected few Def genes as mt (−2.54-fold) at 24 hpf and hsp70-II (2.09-fold) at 48 hpf. At 24 hpf, Li induced the downregulation of gp96 (−2.52-fold), mt (−4.37-fold), and mdrp1 (−2.42-fold) genes and the upregulation of hsp70-II (2.38-fold). At 48 hpf, Li affected the same genes modulated at 24 hpf with the exclusion of gp96, which was unaffected, and hsp60, which was upregulated (2.77-fold). Opposite to Li and Ni, Zn caused a general upregulation with high fold values for hsp60 (4.58) and hsp70-II (16.44) at 24 and 48 hpf, while it had no effects on the mt gene. In addition, Zn upregulated gp96 (2.54-fold) and faintly p38MAPk (2.05-fold) genes. It should be noted that the hsp70-II gene was significantly upregulated at 48 hpf by both Li and Zn (9.66 and 16.44-fold, respectively).
In the Imm category (Figure 4), Li mainly upregulated the analyzed genes, as opposed to Zn which mainly downregulated them, while Ni affected only a few of them. The gal-8 gene was the only gene downregulated by Li, in this category, at 48 hpf (−2.59-fold), while it was downregulated at both times (−4.78 and −6.68-fold, respectively) by Zn. Gata1/2/3 gene was upregulated by Li (3.12 and 4.67-fold) and downregulated by Ni (−2.94 and −2.33-fold) and Zn (−2.94 and −3.43-fold) at both 24 and 48 hpf. The gcm gene was upregulated by Li at 24 hpf (2.13-fold), as well as nfkb (2.51-fold). The pks1 gene was greatly downregulated by Ni at 24 hpf (−30.28 fold) and by Zn at both endpoints (−59.40 and −7.64-fold).
In the Ner category, Li mainly caused the downregulation of nearly all the analyzed genes, with wnt1 being the only upregulated one (4.17-fold) at 48 hpf. Ni upregulated chordin (2.15 and 5.83-fold), otp (2.39 and 3.71-fold), and wnt1 (2.19 and 2.73) genes at both times, while it downregulated paxpax2/5/8 (−2.65-fold) only at 24 hpf. Zn downregulated chordin (−3.84-fold), pax2/5/8 (−2.97-fold), slc6a4/sert (−2.01) at 24 hpf, and onecut/hnf6 (−3.97 and −2.03-fold) and gfi1 (−4.99 and −2.95-fold) at both endpoints. The upregulated genes by Zn were notch (3.97-fold) at 48 hpf and fzd5/8 (2.62 and 6.35-fold) at both endpoints (Figure 4).
For greater clarity in the presentation of the data, the genes of the Dev category have been divided into sub-categories, taking into account their spatial expression, where known, and are shown in Figure 5 and Figure 6. Figure 5 shows genes of the Dev category with ectodermic expression, which were modulated by the metal exposures at 24 hpf (Figure 5A) and 48 hpf (Figure 5B), respectively. Some genes, normally expressed in the specific sub-domain of the ectoderm were downregulated as fzd7 by Li at both times (−2.03 and −3.01-fold), univin by the tree metals at 24 hpf (−2.00, −2.56, −2.99-fold) and vegf by Li and Zn at 48 hpf (−5.69 and −2.51-fold).
Many of the genes with dorsal ectoderm expression were downregulated, for example hox7 in Ni-embryos at both times (−30.67 and −4.91-fold) and in Li-embryos at 48 hpf (−14.07-fold), smad6/7 in all treated embryos at 24 and 48 hpf, except in Zn-embryos at 48 hpf, and wnt5 in all treated embryos at 24 and 48 hpf, except in Li- and Zn-embryos at 48 hpf in which it was not quantifiable. The only upregulated dorsal ectoderm gene was nk2.2 (5.19-fold) by Ni at 48 hpf. Looking at the genes with ventral expression, some of these were downregulated by Li as bmp2/4 gene, (−3.75-fold at 24hpf), dri (−4.11 and −2.19-fold), and tetraspanin (−2.96 and −5.18 fold) at 24 and 48 hpf. Ni upregulated brachyury (bra, 2.31 and 2.93-fold), deadringer (dri, 2.07 and 2.63-fold), goosecoid (gsc, 3.44 and 4.63-fold), and nk1 (2.65 and 2.66-fold) at both endpoints, with the exclusion of nodal that was downregulated (−2.85 fold at 24 hpf). At both endpoints, the only affected ventral ectodermic gene by Zn treatment was foxA (−10.07 and −2.91 fold). Among the other genes of the Dev category, those mainly affected were admp1, upregulated by Ni at both endpoints (7.59 and 15.66-fold) and downregulated by Li at 48 hpf (−4.59 fold); nectin, upregulated by Li (5.18 and 6.04 fold) and downregulated by Ni (-3.11 and 4.34 fold) and Zn (−4.92 and −18.41 fold) at both endpoints; paxB, downregulated by the tree agents at 24 hpf and only by Li at 48 hpf (−2.58 fold) and paxC, only downregulated by Zn at 48 hpf (−7.48 fold).
In Figure 6, genes belonging to the Dev and Bm categories, having endomesoderm and mesoderm expression respectively, are reported, at 24 (Figure 6A) and 48 hpf (Figure 6B). Within the Dev category, the transcripts expressed in mesodermic cells were downregulated, such as smoothened (smo, −3.39-fold by Li at 48 hpf), pax-6 (−5.81-fold in Li-embryos at 24 hpf; −2.28-fold in Zn-embryos at 48 hpf) and sox9 (−5.39 and −46.17-fold by Li at both endpoints; −42.99-fold by Zn at 48 hpf).
Looking at the genes expressed in the endoderm, the transcription factor (TF) blimp1 was upregulated by Li (5.11 and 7.37-fold) and downregulated by Zn treatment (−15.85 and −7.58-fold) at both endpoints.
Li also upregulated nova (2.10-fold) at 24 hpf, wnt16 (8.65 and 10.62-fold) at both endpoints, and wnt6 (3.26-fold) at 48 hpf. Zn downregulated nova (−3.93-fold) at 24 hpf, fzd4 (−3.92 and −7.49-fold), and wnt3 (−2.11 and −2.45-fold) at both endpoints, the latter being the only wnt gene downregulated by Li at both 24 and 48 hpf. Ni only downregulated wntA (−3.13-fold) at 24 hpf and wnt4 (−4.15-fold) at 48 hpf.
Among the Bm genes, we considered a group of TFs expressed in the skeletogenic cells, the primary mesenchyme cells (PMCs). At 24 hpf, the most affected TFs were coquillette and ske-t, which were down- and upregulated by the three metal treatments, respectively (Figure 6A), while at 48 hpf coquillette was downregulated by Zn (−2.98) and ske-t was upregulated by Li and Ni (4.26 and 2.84-fold) (Figure 6B).
Ni downregulated pitx2 at both endpoints (−5.38 and −3.60-fold). Li had opposite effects on the jun gene that was upregulated at 24 hpf (2.38-fold) and downregulated at 48 hpf (−2.23-fold). Looking at the genes coding for signaling proteins expressed by PMCs, they were moderately affected by Li and Ni treatments at 24 hpf. Indeed, at both endpoints, Li downregulated (−3.09 and −2.47-fold) and Zn upregulated (2.07 and 2.79-fold) fgf9/16/20, while Ni upregulated fgfr2 (2.19 and 2.90-fold), and vegfr (2.04 and 2.88-fold), the latter also upregulated by Zn (2.28 and 2.05-fold) (Figure 6A). Zn affected fgfr1 (−2.61-fold) at 24 hpf and sprouty (2.69 and 3.45-fold) at both endpoints. At 48 hpf, Li affected other signaling genes, downregulating alk1/2 (−2.54-fold), bmp5/8 (−2.61-fold), fgfr1 (−2.11-fold), and vegfr (−2.32-fold) (Figure 6B).
Most of the genes whose products were directly involved in the biomineralization process were mainly downregulated by the three metals (Figure 6). Carbonic anhydrase (can), coding for an enzyme involved in the skeleton deposition and development, was greatly downregulated by Li (−32.52-fold) at 24 hpf, by Ni (−3.52-fold) at 48 hpf and by Zn (−18.49 and −27.24-fold) at both endpoints. In addition, Li downregulated three genes coding for structural proteins of the skeleton, as p16 (−32.50 and −25.08-fold), p19 (−4.72 and −6.49-fold) and sm50 (−2.15 and −3.19-fold), at both endpoints. Ni downregulated p16 (−2.95-fold) at 24 hpf and sm30 (−3.01 and −2.17-fold) at both endpoints. The msp130 gene, coding for a glycoprotein localized only on skeletogenic cell membranes, was upregulated by Zn (2.60-fold) and Ni (4.57-fold) at 48 hpf. A family member, msp130R-1, was downregulated only by Zn at 48 hpf (−2.16-fold). Ni, at 24 hpf, and Zn, at 48 hpf, affected pm27, coding for a structural protein, with opposite effects (2.31 and -2.08-fold, respectively).
Among the 127 genes analyzed by nCounter NanoString methodology, we selected six target genes, representing the categories that most interested us, namely Pl-alx1 (TF within Bm), Pl-can (skeleton within Bm), Pl-gal-8 (Imm), Pl-jun (TF within Bm), Pl-mt (Def), Pl-sox9 (Dev), and performed comparative qPCR analyses to compare the results obtained with NanoString analysis (Figure 7).
QPCR is an alternative sensible technology to measure changes in mRNA expression levels and, also in this case, we considered significant values of fold change those higher or lower than ±2, compared to controls. In this range, the qPCR data are in agreement with those of nCounter NanoString analysis, except for a slight difference at 48 hpf in the trend of the genes Pl-alx1 and Pl-mt in Zn-embryos, Pl-gal-8 in Ni-embryos, although such variations are to be considered not significant as they remain within the threshold ±2 (Figure 7B). As for the other samples, the trend of fold changes was in good agreement between the two analyses, although the magnitude of values was sometimes quite different, as the great difference observed for Pl-sox9 in Li- and Zn-embryos at 48 hpf. However, these differences are probably due to the diverse technologies used for the analysis, in agreement with what was reported by Prokopec et al. [36].

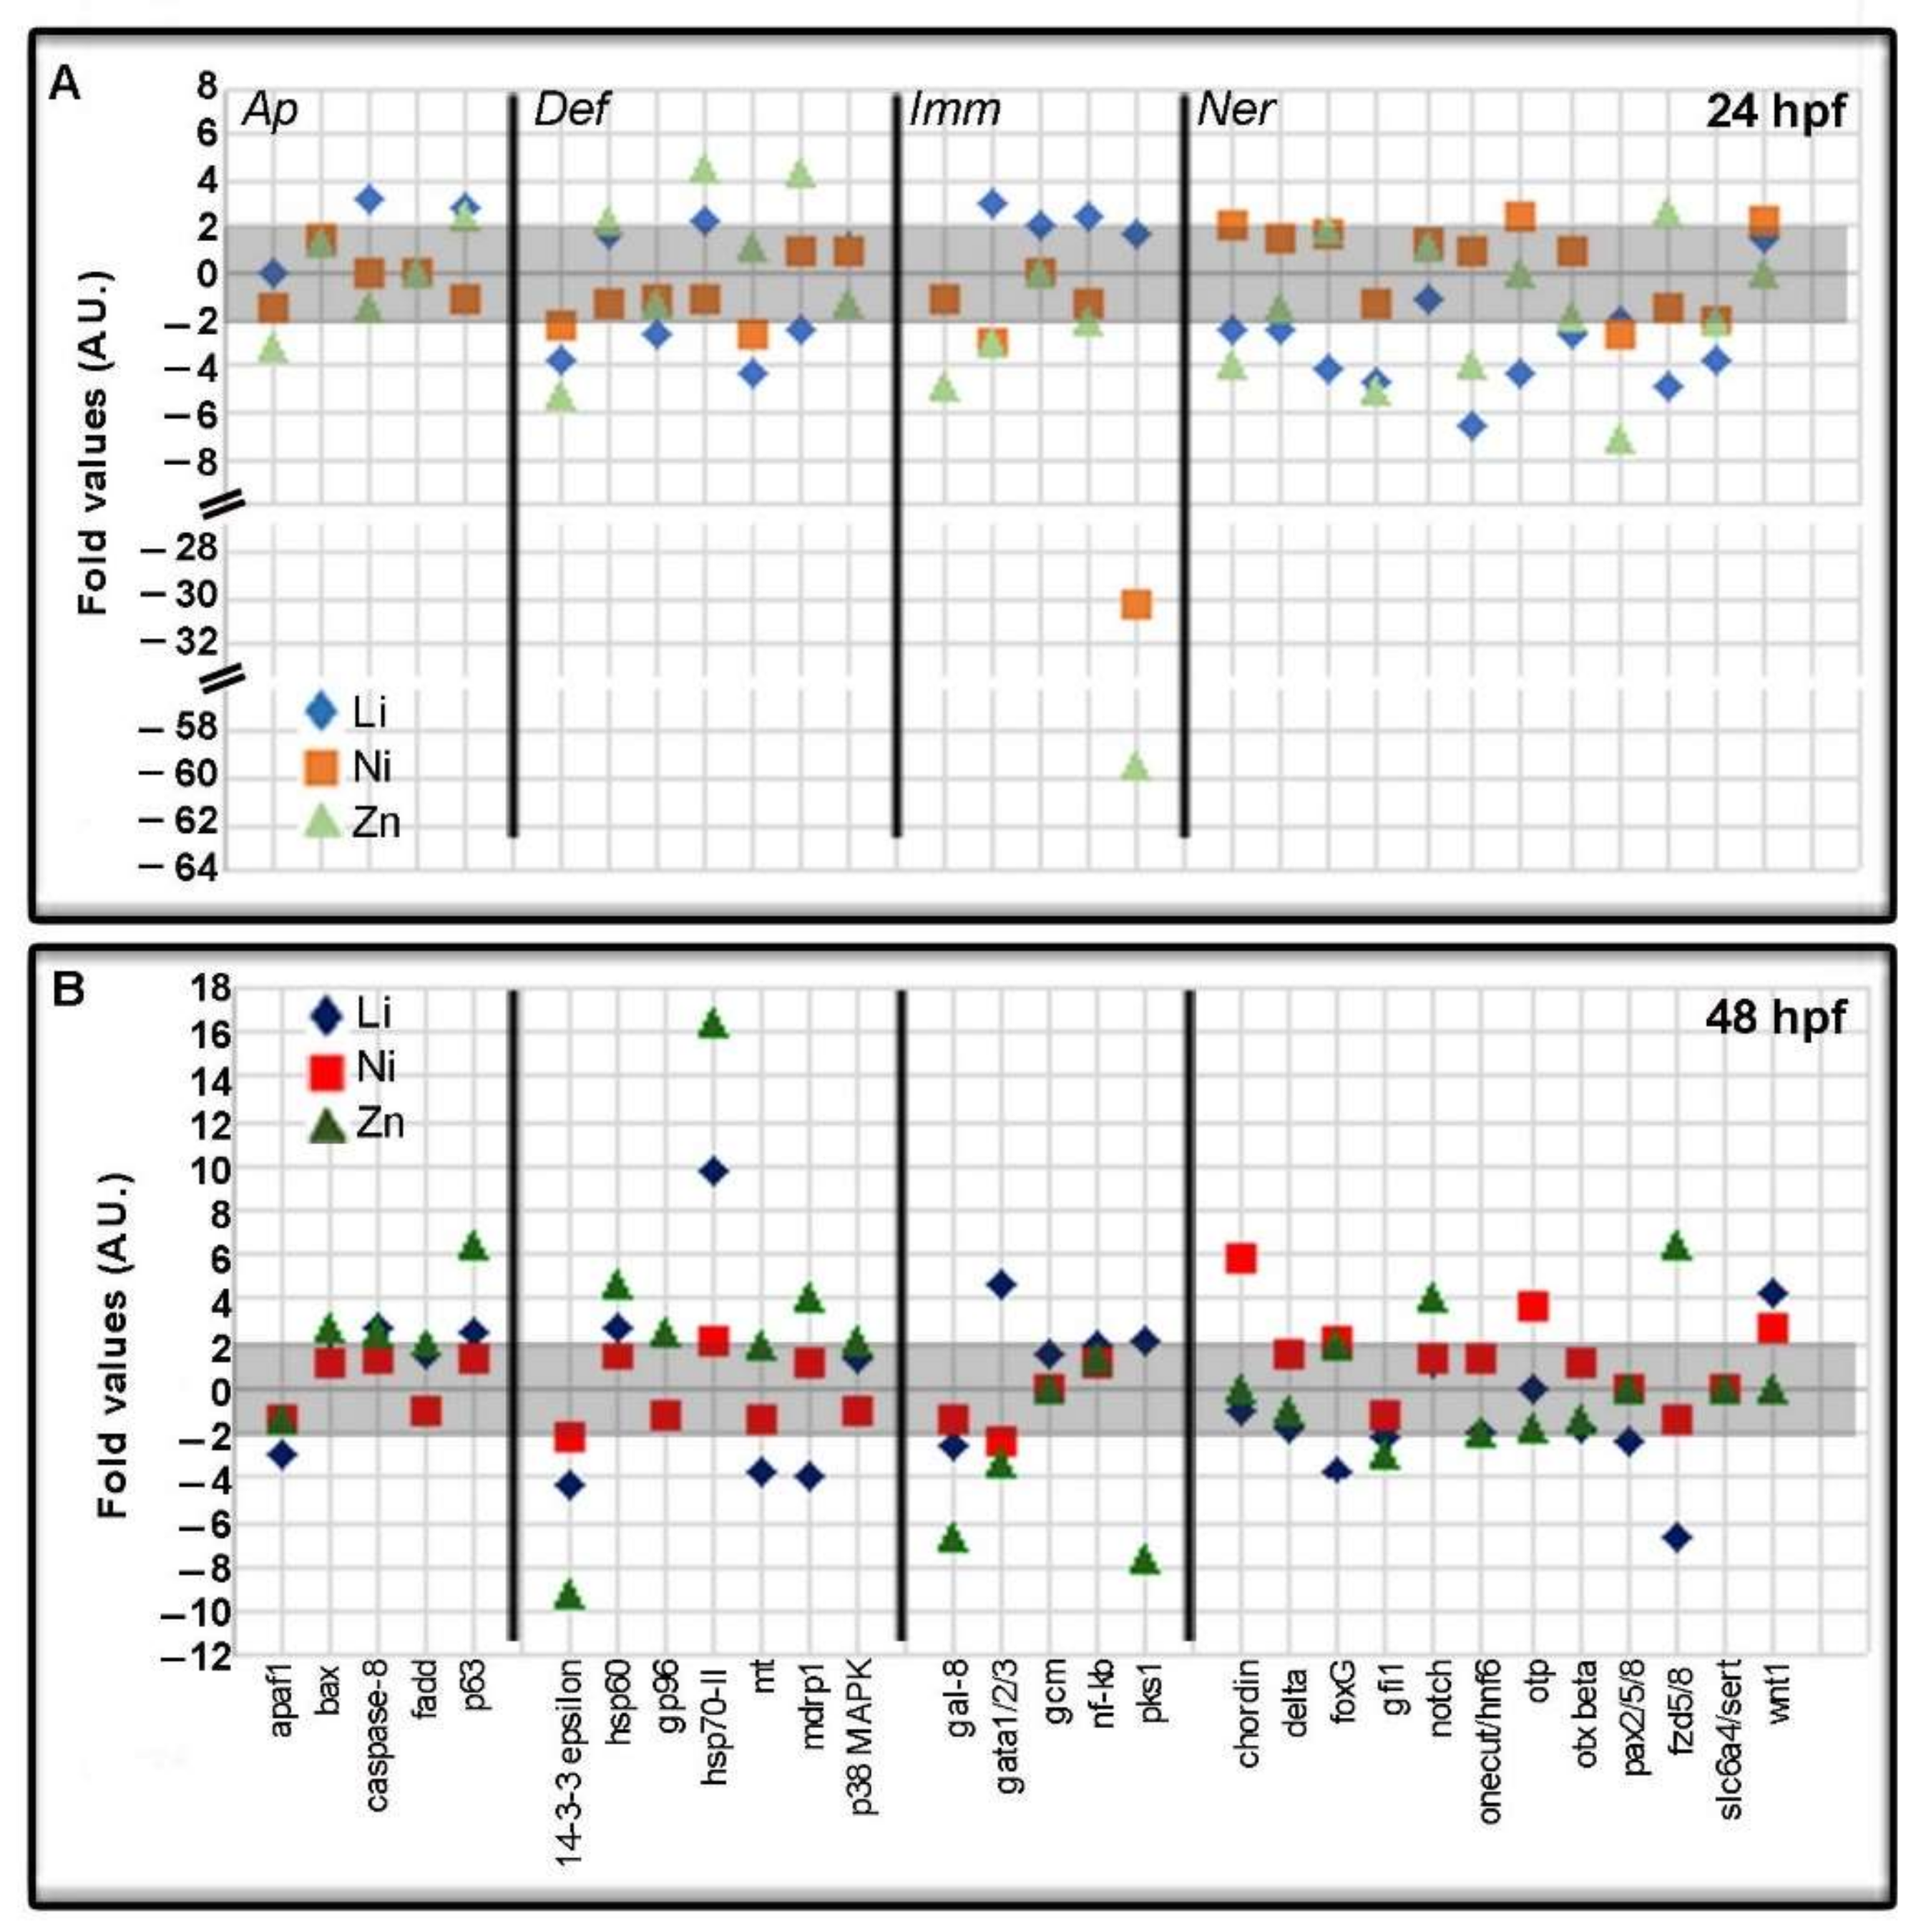
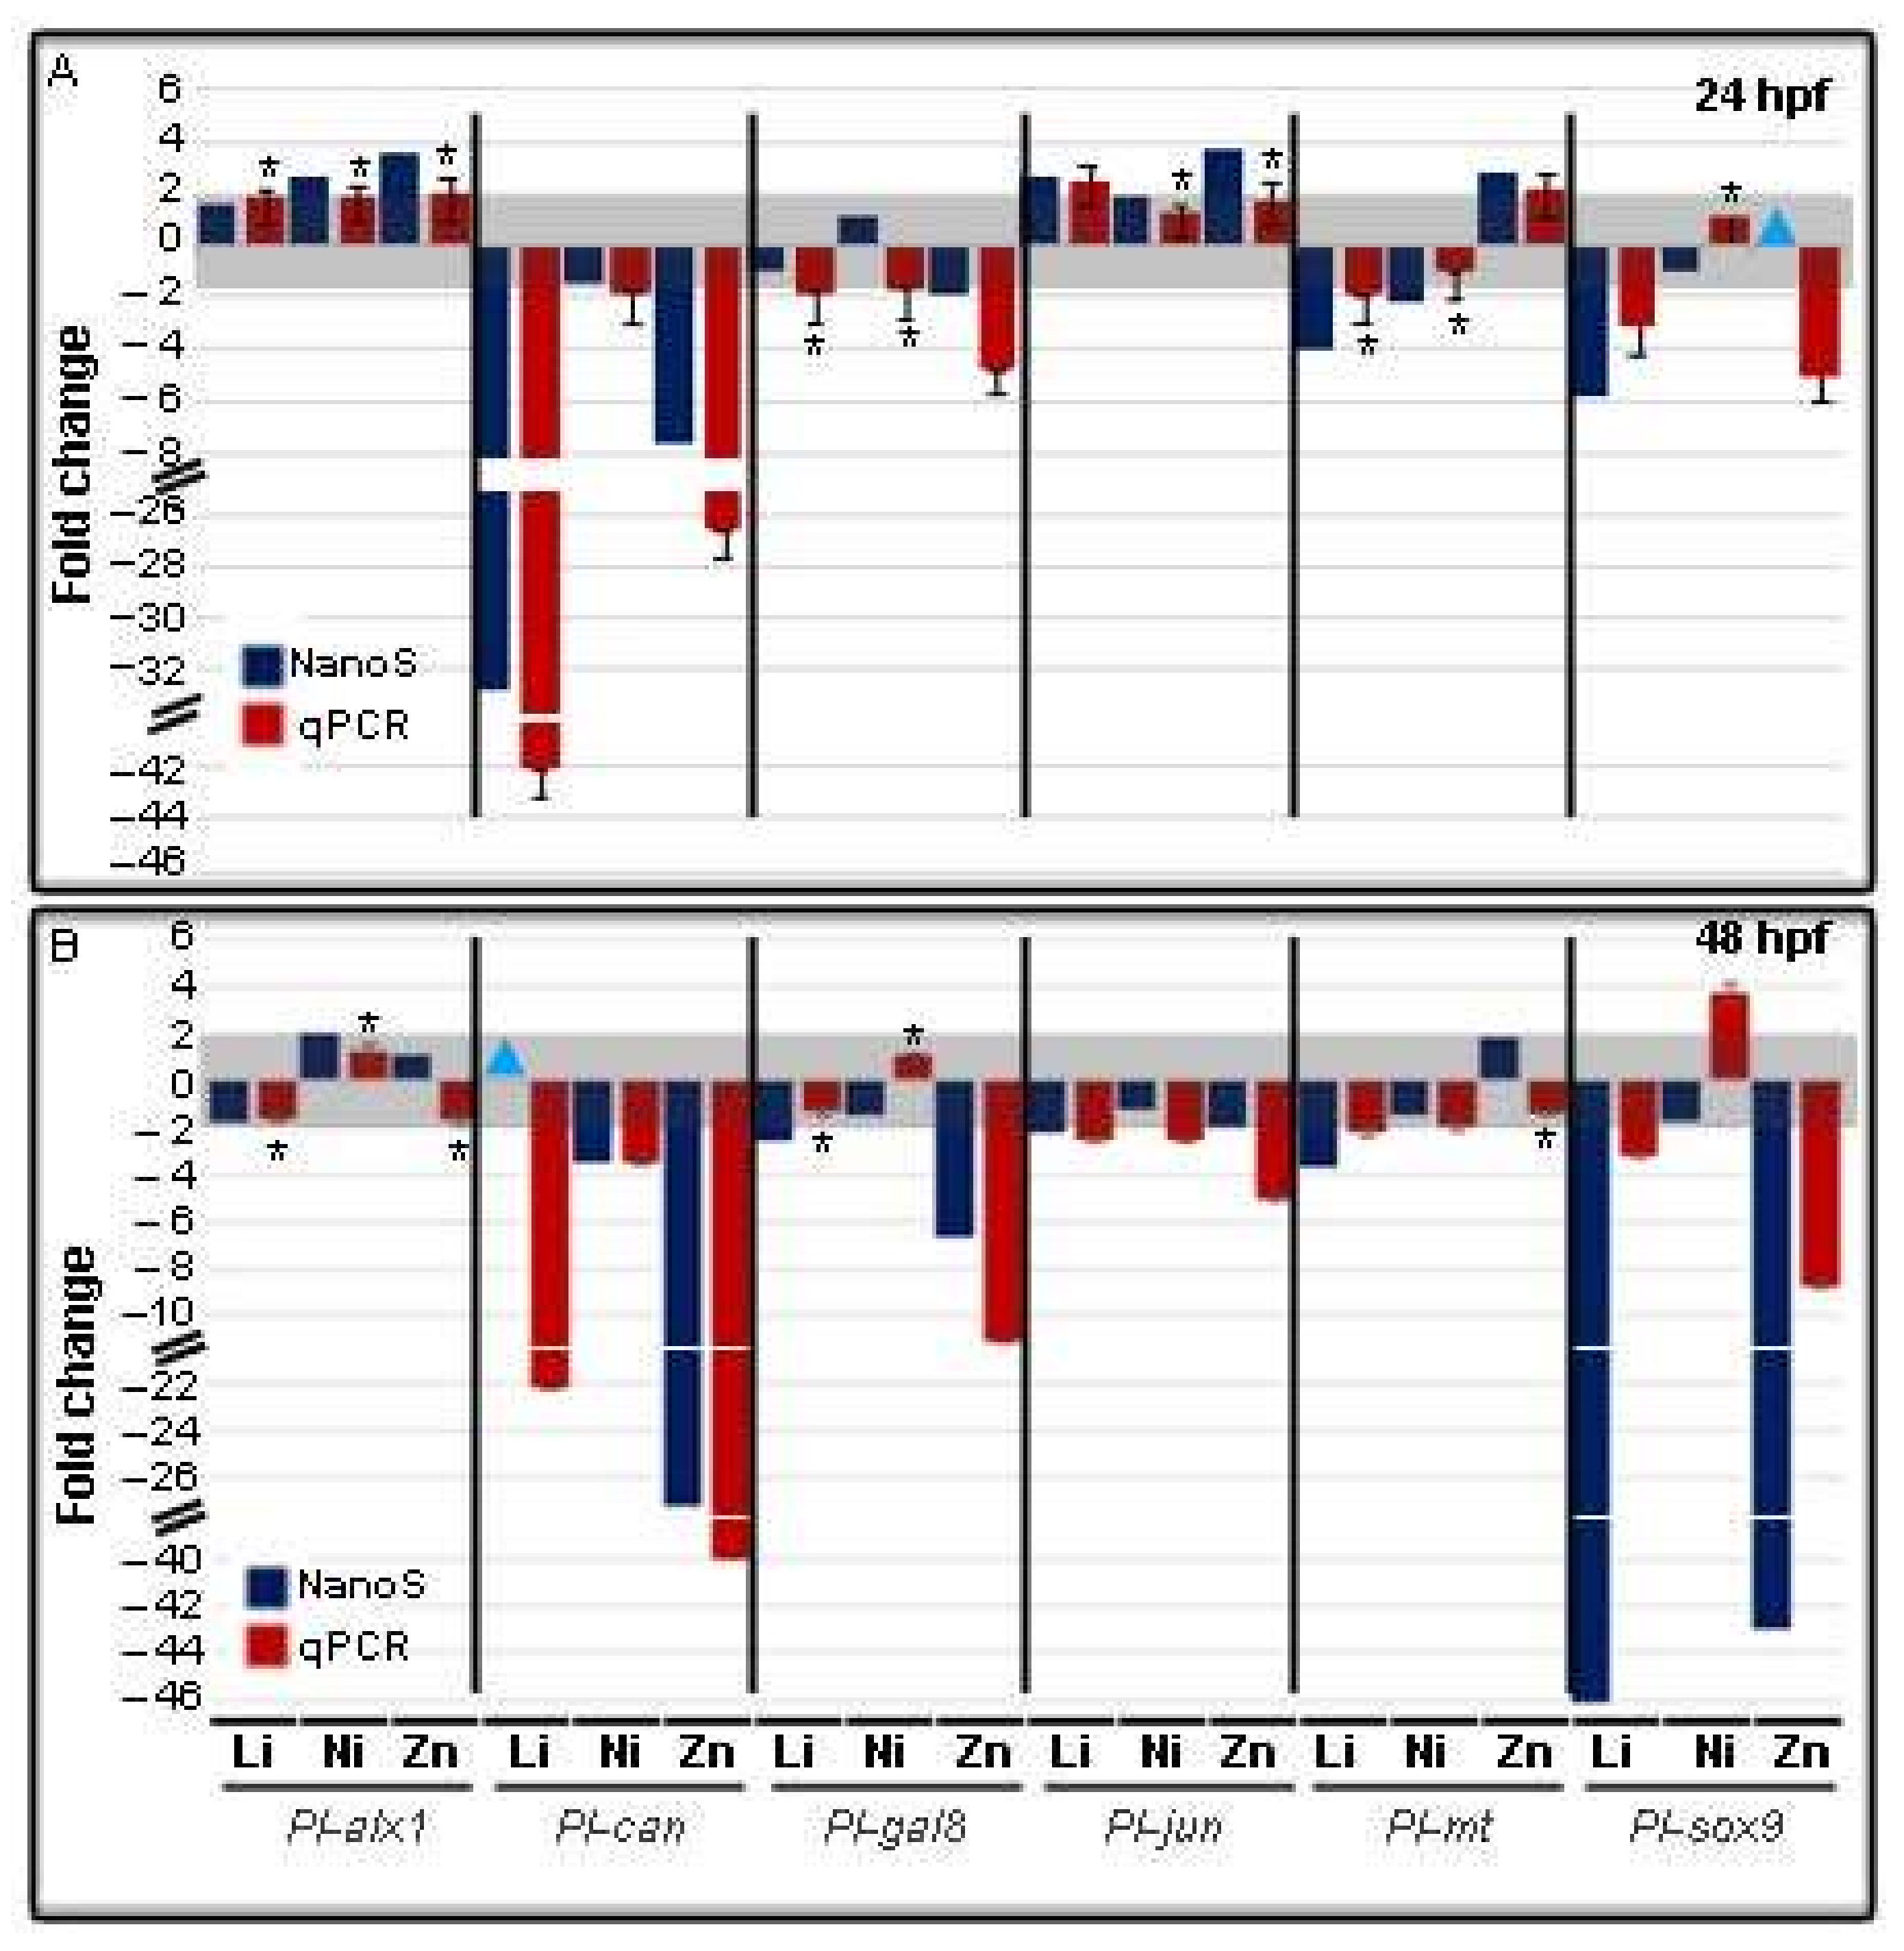
3.3. Metal-Dependent Sensitive Genes as Potential Biomarkers

Through our deep analysis, we might identify specific responsive genes for each metal, grouping those genes that are particularly sensitive to only one of the three metals analyzed, or sensitive to more than one of the metals, to be used as analytical tools for future environmental toxicity studies. The Venn diagram, and the relative table below the diagram (Figure 8), allowed to represent the amount of overlapping modulated genes and those not shared by the three metals, the latter being 18 and 17 for Li, 12 and 9 for Ni, 14 and 16 for Zn, at 24, and 48 hpf, respectively. In the Supplementary Table S2, we reported the lists of these genes, i.e., those specifically modulated by each of the three metals, those in common between Li and Ni (Li/Ni), Li and Zn (Li/Zn) or Ni and Zn (Ni/Zn) and those in common among all the three metals (Li/Ni/Zn), at 24 and 48 hpf.
In Li-embryos at least one gene for each category was sensitive to it at 24 hpf, and many were highly modulated (8 out 18 decreased/increased more than 3-fold). Therefore, in addition to apaf1 (Ap), mt (Def), and pax2/5/8 (Ner), it would be possible to choose among apkc, fzd1/2/7, id, paxB, smo, tetraspanin, wnt16 and wnt6 of the Dev category and alk1/2, bmp5/8, fgfr1, jun, p16 and sm50 of the Bm category, all genes that were not modulated by the other two metals. A similar approach could be followed to identify Zn and Ni responsive genes. In particular, genes belonging to five out six categories were specifically modulated by Zn (5 out 14 and 4 out 16 decreased/increased more than 3-fold at 24 and 48 hpf, respectively), whereas Ni modulated mainly genes belonging to Ner, Dev, and Bm categories (6 out 12 and 6 out 9 decreased/increased more than 3-fold at 24 and 48 hpf, respectively).
With the aim of selecting new biomarkers, we chose to consider those genes that appeared modulated by all the three metals, particularly 13 in embryos at 24 hpf and 6 in embryos at 48 hpf (Table S2). Only three genes were modulated by all the three metals at both 24 and 48 hpf, i.e., 14-3-3 epsilon, gata1/2/3, and nectin. Others were downregulated (pax2/5/8, paxB, smad6/7, univin, wnt5, p16, and coquillette) or upregulated (bp10 and ske-t) by all three metals only at 24 hpf or only at 48 hpf, i.e., hsp70-II, egip precursor and vegfr.

3.4. Metal-Dependent Sensitive Genes and Functional Enrichment

Metal-related impacts on gene expression were seen in all the treatments with some overlapping in the enrichment of various KEGG Orthology (KO) pathways. Table S3 lists the S. purpuratus-specific versions of KEGG pathways and/or BRITE hierarchies found for the three metals.
The KO analysis showed that most of the genes modulated by Li were related to signal transduction pathways [09132], in particular, Wnt signaling pathway [PATH:spu04310], TGF-beta signaling pathway [PATH:spu04350], notch signaling pathway [PATH:spu04330], foxO signaling pathway [PATH:spu04068], and to transcription factors [BR:spu03000], in addition to endocytosis [PATH:spu04144], G protein-coupled receptors [BR:spu04030] and peptidases and inhibitors [BR:spu01002], at both endpoints (Table S3). Zn modulated genes related to Wnt signaling pathway [PATH:spu04310], notch signaling pathway [PATH:spu04330] and foxO signaling pathway [PATH:spu04068], in addition to protein processing in endoplasmic reticulum [PATH:spu04141], ubiquitin-mediated proteolysis [PATH:spu04120], membrane trafficking [BR:spu04131], cytoskeleton proteins [BR:spu04812] and transcription factors [BR:spu03000], mainly at 48 hpf (Table S3). At 24 hpf, Ni modulated genes related to TGF-beta signaling pathway [PATH:spu04350] and transcription factors [BR:spu03000], whereas only genes related to Wnt signaling pathway [PATH:spu04310] were modulated at 48 hpf (Table S3). Enrichment of DNA repair and recombinant proteins [BR:spu03400] was found for all three metals.

4. Discussion

In this study, we report an in-depth characterization of the response at the molecular level to Li, Ni, and Zn of the P. lividus sea urchin embryo, through a high-throughput screening approach using the nCounter NanoString technology. We have analyzed 127 genes selected from the NCBI database and arbitrarily organized them into six different functional categories based on an in-depth study of the data in the literature. As a whole, the modulation of the expression of the various genes represents a synthesis of the molecular defense systems adopted by P. lividus embryos to counteract Li, Ni, and Zn effects, respectively. The activation of the defense systems involves an energetic cost for the embryos, which results in developmental alterations and the formation of alternative morphotypes. Furthermore, we need to take into consideration the dual role of some of the defensive genes and proteins, i.e., in the regulation of developmental processes and in the protection against environmental risks, so that their recruitment into protective mechanisms might affect embryonic development.
We focused our study on a short period of time, i.e., 0−48 h of sea urchin embryo development, to evaluate the effects of Li, Ni, and Zn treatments at sublethal concentrations, not environmentally relevant, but capable of producing homogeneous populations of abnormal embryos, each with its own characteristic morphology. Indeed, various morphological malformations have been already described in different sea urchin species treated with Li, Ni, and Zn [20,21,37,38], including our recent study on P. lividus [26]. The most striking morphological effects of Li, Zn, and Ni treatments are on the axes: the animal/vegetal (A/V) one in vegetalized Li-embryos, which have less ectoderm and more endomesoderm than animalized Zn-embryos that, on the contrary, have more ectoderm and less endomesoderm, while Ni treatment affects the establishment of dorso/ventral (D/V), also called oral/aboral (O/A), axis. While the A/V axis is already present in the egg and it is rigidly fixed, the D/V axis is established after fertilization through complex molecular events, recently reviewed by Molina and Lepage [39], and is well known to be easily disturbed by many physical or chemical treatments and agents.
In addition to perturbing the axes patterning, the embryonic nervous system appeared to be affected mainly by Zn, but also somewhat by Li and Ni, on the basis of the embryonic localization of two neural markers, Sox2, and ciliary band. Firstly, a slight difference in the localization of Sox2 in P. lividus compared to S. purpuratus embryos has to be highlighted. In particular, the soxB2 gene, homolog to the human sox2, is expressed in the animal pole domain (which contains neurogenic ectoderm) of early S. purpuratus gastrula at 30 hpf and in the oral ectoderm around the ciliary band in pluteus at 72 hpf, while no signal was detected in the aboral ectoderm of pluteus [40]. Partially in agreement, the anti-Sox2 antibody labeled mainly the ciliary band in P. lividus pluteus at 48 hpf, but the protein was also present in some cells of the aboral ectoderm of the pluteus apex, which can therefore be neurogenic cells too. The sox2-expressing cells were lost in nearly all metal-treated embryos, in addition to the two small central ganglionic structures labeled by Ab-295. These results reveal that Li, Ni, and Zn might alter the embryonic nervous system, in agreement with data obtained from the Nanostring analysis as discussed in the following.

4.1. Looking for Potential Biomarkers

The morphological abnormalities of P. lividus embryos treated with metals are obviously associated with changes in gene expression and, consequently, in signaling pathways. Indeed, several genes appeared modulated by Li, Ni, and Zn at 24 (49, 33, and 44 out of 127, respectively) and 48 hpf (49, 29, and 45 out of 127, respectively), of which 13 and 6 were the same for the three treatments (shown in the Venn diagram of Figure 8). In Table 1, we listed the genes affected by Li, Ni, and Zn that can be used as potential biomarkers for all of them. In the following, we will provide some information on each of these genes, when available, to highlight the molecular mechanism of the stress response of sea urchins exposed to Li, Ni, and Zn.
Three genes were affected by all three metals at both endpoints, 24 and 48 hpf, i.e., 14-3-3epsilon, gata1/2/3, and nectin. The 14-3-3epsilon belongs to a highly conserved family of eukaryotic adaptor proteins found in diverse organisms and involved in many cellular processes. For example, 14-3-3 proteins interact with bax preventing its translocation into mitochondria and playing an anti-apoptotic role [41]. In sea urchin embryos, increased Pl-14-3-3epsilon mRNA levels were found following UVB irradiation [30], suggesting its implication in the regulative cascade activated in the stress response.
The gata1/2/3 gene codes for a DNA binding zinc finger TF that is involved in vertebrate hematopoiesis. Regarding its sea urchin homologs, Spgatac regulates immune cell specification in embryos and larvae [42], while Spgatae might be a useful biomarker for assessing the sea urchin hypoxic response, as suggested by its downregulation in the adult immune cells of S. nudus maintained in hypoxic condition [43].
Nectin is one of the proteins constituting the extracellular matrix (ECM) of the sea urchin embryo, known to be involved in the ecto-mesoderm signaling regulating skeleton development [44]. The changes in nectin gene expression are in good agreement with the defects in the development of the skeleton observed in all metals-treated embryos, so much so that it can be taken into account among the potential biomarkers.
Among the genes affected by the three metals only at 24 hpf, chordin and pax2/5/8 [45] belong to the Ner category, interesting for new studies of the nervous responses to the toxic action of pollutants. A recent review well described the embryonic neurogenesis in echinoderms, which proved to be a very complex process, and the molecular toolkit involved [35], which can therefore be considered in the search for new biomarkers of the stress response.
In the Dev category, six genes were modulated by the three metals at 24 hpf. Although little is known about the blastula protease (bp) 10 gene [46] and its ectoderm expression, we consider it rather interesting as bp10 expression was modulated also by Cd treatment [25], in addition to Li, Ni, and Zn.
The paxB gene belongs to the PAX family of transcription factors, which have been characterized in sea urchin embryos and are reported to be involved in visual system development in a variety of species [47].
Four genes constitute the sea urchin repertoire of smad genes that are a family of TFs activated downstream the TGF-beta signaling [48] and, among these, smad6 is known to be expressed by the presumptive dorsal ectoderm [49].
Univin is a growth factor of the TGF-beta superfamily involved in sea urchin skeleton morphogenesis [50]. It could be an interesting biomarker of different pollutants, for example, its downregulation was observed in P. lividus embryos exposed to gadolinium (20 μM) for 48 h [51].
Wnt5 acts with a short-range signal that activates a narrow band of ectodermal cells from the endoderm, integrating different types of positional information to correctly locate the production site of signals needed to guide skeletogenesis [52].
Certainly, the biomineralization genes would be interesting molecular markers, to put beside the morphological observation of the absence of the skeleton in embryos exposed to the three metals. In this respect, p16, coding for an acidic phosphoprotein of the skeleton [28], as well as ske-t and coquillette, two TFs belonging to the T-box family, should thus be taken into consideration. Ske-T is expressed early in the S. purpuratus embryos [53]. Coquillette, a member of the Tbx2 subfamily, is expressed late in the S. purpuratus embryo, restricted to the PMCs of gastrula embryos, involved in the skeleton formation [54].
Only six were the genes affected by all three metals at 48 hpf. Within the Def category, in addition to the 14-3-3epsilon gene previously described, members of the Hsp family, such as hsp70-II, were expected to be modulated. The upregulation of hsp genes is a typical stress response, well known in many organisms, which can have an anti-apoptotic effect [55], as also suggested for sea urchins [56].
The exogastrula-inducing peptides (egip) gene codes for small epidermal growth factor-related peptides, which probably are secreted and then associated with the ECM, although their role is not yet known [57].
Vegfr is involved in the VEGF signaling that guides skeleton morphogenesis from the ectoderm [58] and it is one of the genes grouped in the Bm category. Most of these genes are involved in embryonic skeleton development and are mainly expressed by the PMCs, clearly recognizable in Li, Ni, and Zn embryos, even if not properly organized [26]. Together with other genes of the Bm category, this gene seems an interesting potential molecular biomarker, since its modulation could be associated with morphological observations on the skeleton development.
Beyond the potential biomarkers proposed in Table S2, some other genes could be considered potential biomarkers, both because they are greatly affected by one or more of these metals and because they can have interesting functions in the sea urchin. In particular, we could suggest can, hox7, foxA, pks1, irxa, sox9, and wnt16.
Can codes for a carbonic anhydrase metalloenzyme, which has a key role in the biomineralization process in many metazoans, also including sea urchins [59]. Interestingly, its expression is often affected by negative external stimuli, such as it is strongly downregulated by Cd and Cd in combination with UVB radiation in P. lividus embryos [25].
Within the Imm category, the pks1 gene, found in many organisms, is greatly affected by Ni and Zn in agreement with studies reporting its reduced expression by Ni in L. variegatus [60] and in P. lividus embryos [33]. In sea urchins, the PKS enzyme is involved in the synthesis of the red pigment echinochrome A and is expressed by pigment cells, a type of embryonic immune cell [61]. The modulation of pks1 can be associated with the morphological observation, checking the presence/absence of pigment in exposed embryos. For example, the absence of pigment cells was observed in P. lividus Ni- and Zn-embryos (this study; [26]) and in L. variegatus Ni-embryos [21]. Growing evidence supports the importance and role of metal ions in the immune system, both regulating the innate immunity and host defense functions, in what is now called “metal-controlled immunity” [62]. In this regard, the studies on the immune response induced by metals in a simple model organism such as the sea urchin might be of great support.
Sox9 belongs to the Dev category and, more in detail, to the gene subgroup having endo-mesoderm territorial localization. Interestingly, other agents, such as UVB and Cd, caused its downregulation in P. lividus embryos [25]. Sox9 gene, also known as Sp-soxE in the S. purpuratus genome (www.echinobase.org (accessed on 1 January 2019)) [63], belongs to a family of minor groove DNA binders, widely expressed during sea urchin embryo development, and is one of the regulatory genes expressed during embryonic myogenesis [64].
Irxa and hox7 are two dorsal genes [49] grouped in the Dev category, together with many genes involved in axes specification and patterning, including A/V and D/V, which were differently altered by the three metals, as described above.
The foxa gene, a forkhead transcription factor, is an integral component of the endoderm specification subcircuit of the endomesoderm gene regulatory network, as characterized in the S. purpuratus embryo [65]. The Authors showed that blocking foxa expression, by the injection of morpholino antisense oligonucleotides at high concentrations, caused the failure of gut formation, a process that involves the regulation of structural genes and cell adhesion molecules [65]. The foxa gene, and the morphology of the embryonic gut, could be interesting to consider as pollutant biomarkers.
Most of the Wnt and their receptor frizzled (fzd) genes have expression domains associated with archenteron development, thus it was not surprising that wnt16 was greatly upregulated by Li. Specifically, at the late gastrula stages, different populations of endodermal cells expressed wnt16. At later stages, prism and early pluteus, the expression of wnt16, as many other Wnt genes, becomes even more restricted in a full ring around the anus [66].
Altogether these results provide a general framework for the possible responses at the molecular level of sea urchin embryos to different metals, from which to extrapolate useful information on possible new markers to be taken into account in ecotoxicological studies. Indeed, the reorganization of the embryonic territories induced by the different metals, clearly distinguishable at the morphological level, i.e., animalization (Li), vegetalization (Zn), and radialization (Ni), could now be associated with some genes modulated exclusively by each of the three metals. Nevertheless, among the various aspects that must be considered in the evaluation of metals toxicity, i.e., their concentration, the different sensitivities of the embryonic stages, and of the various species of sea urchins, it would be worthwhile to identify a panel of modulated genes for each metal.

4.2. Analysis of Pathways Affected by Metals

The data obtained by the analysis of pathways enrichment can provide further information on the molecular responses of sea urchin embryos exposed to Li, Ni, and Zn, useful for future exploitations in ecotoxicological studies.
Only 39 of the 82 genes modulated by each metal and those modulated by all the three metals were found in 13 pathways by KEGG Orthology (KO, https://www.genome.jp/kegg/ko.html (accessed on 1 June 2022)) analysis (Table S3). The pathway of TFs was the most enriched, followed by the signaling pathways of Wnt, TGF-beta, FoxO, and notch, as well as the pathways of protein processing in the endoplasmic reticulum, endocytosis, membrane trafficking, cytoskeleton proteins, G protein-coupled receptors, DNA repair and recombinant proteins, peptidases and inhibitors, and ubiquitin-mediated proteolysis. All the three metals impacted the TFs pathway, modulating 11 genes involved in numerous and different cellular processes.
It seems evident that the main enriched pathways found by the KO analysis were the signaling ones, which control all aspects of embryo development. In particular, all the metal treatments here analyzed impacted the Wnt signaling pathway, up or downregulating some of the related genes (fzd1/2/7, fzd4, wnt16, wnt6, wnt4, wnt5, tcf/lef). The Wnt signaling pathway is highly evolutionarily conserved in organisms, as it is involved in body axis patterning, cell proliferation and migration, and cell fate specification. In sea urchins, this signaling pathway has been extensively studied and is known to be a crucial regulator of embryo development [67], including the A/V axis formation. Furthermore, it is known to be involved in neurogenesis, restricting neuroectoderm to the anterior pole of the embryo with precise spatio-temporal control, involving also JNK signaling, in addition to wnt1 and wnt8 [68]. The main receptors for Wnts are Frizzled receptors that are involved in the formation and function of the neuronal circuits in mammalian central nervous system [69].
The third most enriched pathway for all metals was the TGF-beta signaling (bmp2/4, nodal, pitx2, chordin, smad6/7), involved in a wide range of cellular processes and highly conserved all over the animal world. In addition to ligands and receptors, the TGF-beta signaling pathway requires the involvement of receptor-regulated proteins (the intracellular mediators Smads) and various TFs to regulate the expression of target genes. Among the genes belonging to this KO pathway, chordin was included in our Ner category, as it is one of the marker genes for apical and neural territories, in addition to gfi1 [49], onecut/hnf6 [70], pax6, sox9, and pax2/5/8.
Under Li and Zn treatments, but not Ni, some pathways were enriched, for example FoxO signaling pathway (Li, Zn), notch signaling pathway (Li, Zn), endocytosis (Li, Zn), G protein-coupled receptors (Li), peptidases and inhibitors (Li), membrane trafficking (Zn), cytoskeleton proteins (Zn), and ubiquitin-mediated proteolysis (Zn).
Most interesting for our study, are the three genes (foxG, foxO, p38MAPK) that enriched the FoxO signaling pathway. The Forkhead (Fox) family includes TFs regulating target genes involved in diverse biological processes, proliferation, differentiation, longevity, metabolism, and apoptosis. In the sea urchin, at least 22 genes belonging to the FOX family have been annotated [71], although many of them have not yet been characterized. The two fox genes analyzed are differently expressed in late sea urchin embryos, i.e., foxO is expressed in PMCs, suggesting its involvement in biomineralization, whereas foxG expression is restricted to the ciliated band, suggesting an involvement in nervous processes [71]. By our KO analysis, p38MAPK gene enriched the FoxO signaling pathway, even though this gene is known to have a dual role in sea urchin, i.e., an essential regulator of embryonic development, involved in D/V axis specification and skeletogenesis [72], and a stress marker [73].
Interestingly, the functional categories of protein processing in the endoplasmic reticulum and DNA repair and recombinant proteins were impacted by the three metals, i.e., the genes bax, hsp70-II, and 14-3-3epsilon that indeed are stress marker genes.
We believe that this study not only can greatly facilitate the identification of metal-specific biomarkers but can also be useful for the identification of functional developmental pathways altered by pollutants in P. lividus embryos. This is obviously a preliminary study, considering that the metals were administered individually, while in nature the effects are due to the combined action of several toxic agents.

5. Conclusions

As many industrial activities release metals that can be harmful to human health as well as to the environment, it is extremely important to develop new tools that can detect these pollutants quickly and easily, but at the same time with high levels of sensitivity. In this direction, our study contributes both to expanding the knowledge of the molecular biomarkers that could be used in the environmental monitoring, and to facilitating the identification of panels of modulated genes to be used in the evaluation of metals toxicity.
The sea urchin embryo is a well-known model used in ecotoxicological studies to detect a wide range of chemical, physical and natural agents, such as metals, radiations, ocean acidifications, and sediments as well as to study the effects of combined agents. In addition, a huge amount of data is now available concerning the defensive, nervous, and immune systems and the related GRN sub-circuits governing them in sea urchin embryos, which provides new attractive objects of study, such as the immune and nervous responses to the toxic action of pollutants.
All of this can be of great help to provide new approaches to address ecotoxicological studies, encouraging new possible monitoring and intervention strategies.

Supplementary Materials

The following supporting information can be downloaded at: https://www.mdpi.com/article/10.3390/toxics10060325/s1, Table S1: Fold-change values of the analyzed genes. Table S2: Modulated genes. Table S3: KEGG pathways and/or BRITE hierarchies.

Author Contributions

Conceptualization, R.B. and R.R.; methodology, C.C. and R.R.; software, R.B.; validation, R.R.; formal analysis, R.B., R.R. and F.Z.; investigation, I.D.; resources, C.C. and R.R.; data curation, R.B.; writing—original draft preparation, R.B. and R.R.; writing—review and editing, F.Z.; visualization, C.C. All authors have read and agreed to the published version of the manuscript.

Funding

This research received no external funding.

Institutional Review Board Statement

All applicable international, national, and/or institutional guidelines for the care and use of invertebrate animals were followed.

Data Availability Statement

Not applicable.

Acknowledgments

We thank the projet DeCroMed “Pescato Mediterraneo: certificazione di qualità e valorizzazione dei crostacei decongelati” Linea di Intervento 4.1.1.1, GURS 28 October 2011, year 65, N 45 CUP: G93F12000190004. supported by the PO-FESR 2007/2013 SICILIA.The authors thank Valeria Matranga, who spent herself to begin this study, and who is no longer with us.

Conflicts of Interest

The authors declare no conflict of interest.

References

  1. Caito, S.; Aschner, M. Neurotoxicity of Metals. Handb. Clin. Neurol. 2015, 131, 169–189. [Google Scholar] [PubMed]
  2. Jaishankar, M.; Tseten, T.; Anbalagan, N.; Mathew, B.B.; Beeregowda, K.N. Toxicity, mechanism and health effects of some heavy metals. Interdiscip. Toxicol. 2014, 7, 60–72. [Google Scholar] [CrossRef] [PubMed] [Green Version]
  3. Blewett, T.A.; Leonard, E.M. Mechanisms of nickel toxicity to fish and invertebrates in marine and estuarine waters. Environ. Pollut. 2017, 223, 311–322. [Google Scholar] [CrossRef] [PubMed]
  4. Ansari, T.M.; Marr, I.L.; Tariq, N. Heavy Metals in Marine Pollution Perspective—A Mini Review. J. Appl. Sci. 2003, 4, 1–20. [Google Scholar] [CrossRef] [Green Version]
  5. Thompson, E.D.; Hogstrand, C.; Glover, C.N. From sea squirts to squirrelfish: Facultative trace element hyperaccumulation in animals. Metallomics 2018, 10, 777–793. [Google Scholar] [CrossRef] [PubMed] [Green Version]
  6. Yllmaz, A.B.; Yanar, A.; Alkan, E.N. Review of heavy metal accumulation on aquatic environment in Northern East Mediterrenean Sea part I: Some essential metals. Rev. Environ. Health 2017, 32, 119–163. [Google Scholar] [CrossRef]
  7. Deforest, D.K.; Schlekat, C.E. Species Sensitivity Distribution Evaluation for Chronic Nickel Toxicity to Marine Organisms. Integr. Environ. Assess. Manag. 2013, 9, 580–589. [Google Scholar] [CrossRef]
  8. Police, S.; Maity, S.; Chaudhary, D.K.; Dusane, C.K.; Sahu, S.K.; Kumar, A.V. Estimation of trace and toxic metals in marine biota and associated health risk assessment in Thane Creek, Mumbai, India. Environ. Chem. Ecotoxicol. 2021, 3, 234–240. [Google Scholar] [CrossRef]
  9. Kavanagh, L.; Keohane, J.; Cleary, J.; Cabellos, G.G.; Lloyd, A. Lithium in the natural waters of the south east of Ireland. Int. J. Environ. Res. Public Health 2017, 14, 561. [Google Scholar] [CrossRef]
  10. Shen, J.; Li, X.; Shi, X.; Wang, W.; Zhou, H.; Wu, J.; Wang, X.; Li, J. The toxicity of lithium to human cardiomyocytes. Environ. Sci. Eur. 2020, 32, 59. [Google Scholar] [CrossRef]
  11. Pandey, G.N.; Davis, J.M. Biology of the Lithium Ion. In Lithium Effects on Granulopoiesis and Immune Function; Rossof, A.H., Robinson, W.A., Eds.; Springer: Boston, MA, USA, 1980; pp. 15–59. ISBN 978-1-4757-0259-0. [Google Scholar]
  12. Manji, H.K.; Lenox, R.H. Signaling: Cellular insights into the pathophysiology of bipolar disorder. Biol. Psychiatry 2000, 48, 518–530. [Google Scholar] [CrossRef]
  13. Thibon, F.; Weppe, L.; Vigier, N.; Churlaud, C.; Lacoue-Labarthe, T.; Metian, M.; Cherel, Y.; Bustamante, P. Large-scale survey of lithium concentrations in marine organisms. Sci. Total Environ. 2021, 751, 141453. [Google Scholar] [CrossRef] [PubMed]
  14. Horstadius, S. Vegetalization of the sea-urchin egg by dinitrophenol and animalization by trypsin and ficin. J. Embryol. Exp. Morph. 1953, 1, 327–348. [Google Scholar] [CrossRef]
  15. Davidson, E.H.; Cameron, R.A.; Ransick, A. Specification of cell fate in the sea urchin embryo: Summary and some proposed mechanisms. Development 1998, 125, 3269–3290. [Google Scholar] [CrossRef]
  16. Martik, M.L.; Mcclay, D.R. Deployment of a retinal determination gene network drives directed cell migration in the sea urchin embryo. eLife 2015, 4, e08827. [Google Scholar] [CrossRef]
  17. Davidson, E.H.; Rast, J.P.; Oliveri, P.; Ransick, A.; Calestani, C.; Yuh, C.H.; Minokawa, T.; Amore, G.; Hinman, V.; Arenas-Mena, C.; et al. A provisional regulatory gene network for specification of endomesoderm in the sea urchin embryo. Dev. Biol. 2002, 246, 162–190. [Google Scholar] [CrossRef] [Green Version]
  18. McClay, D.R.; Martik, M.L.; Lyons, D.C. Developmental gene regulatory networks in sea urchins and what we can learn from them. F1000Research 2016, 5, 203. [Google Scholar]
  19. Poustka, A.J.; Kühn, A.; Groth, D.; Weise, V.; Yaguchi, S.; Burke, R.D.; Herwig, R.; Lehrach, H.; Panopoulou, G. A global view of gene expression in lithium and zinc treated sea urchin embryos: New components of gene regulatory networks. Genome Biol. 2007, 8, R85. [Google Scholar] [CrossRef] [Green Version]
  20. Ghiglione, C.; Lhomond, G.; Lepage, T.; Gache, C. Cell-autonomous expression and position-dependent repression by Li+ of two zygotic genes during sea urchin early development. EMBO J. 1993, 12, 87–96. [Google Scholar] [CrossRef]
  21. Hardin, J.; Coffman, J.A.; Black, S.D.; MCClay, D.R. Commitment along the Dorsoventral Axis of the Sea-Urchin Embryo Is Altered in Response To NiCl2. Development 1992, 116, 671–685. [Google Scholar] [CrossRef]
  22. Goldstone, J.V.; Hamdoun, A.; Cole, B.J.; Howard-Ashby, M.; Nebert, D.W.; Scally, M.; Dean, M.; Epel, D.; Hahn, M.E.; Stegeman, J.J. The chemical defensome: Environmental sensing and response genes in the Strongylocentrotus purpuratus genome. Dev. Biol. 2006, 300, 366–384. [Google Scholar] [CrossRef] [PubMed] [Green Version]
  23. López-Landavery, E.A.; Amador-Cano, G.; Alejandri, N.; Ramirez-Álvarez, N.; Montelongo, I.; Díaz, F.; Galindo-Sánchez, C.E. Transcriptomic response and hydrocarbon accumulation in the eastern oyster (Crassostrea virginica) exposed to crude oil. Comp. Biochem. Physiol. Part C Toxicol. Pharmacol. 2019, 225, 108571. [Google Scholar] [CrossRef] [PubMed]
  24. Hwang, J.; Suh, S.S.; Park, M.; Park, S.Y.; Lee, S.; Lee, T.K. Differential gene expression patterns during embryonic development of sea urchin exposed to triclosan. Environ. Toxicol. 2017, 32, 426–433. [Google Scholar] [CrossRef] [PubMed]
  25. Bonaventura, R.; Zito, F.; Russo, R.; Costa, C. A preliminary gene expression analysis on Paracentrotus lividus embryos exposed to UVB, Cadmium and their combination. Aquat. Toxicol. 2021, 232, 105770. [Google Scholar] [CrossRef]
  26. Russo, R.; Bonaventura, R.; Chiaramonte, M.; Costa, C.; Matranga, V.; Zito, F. Response to metals treatment of Fra1, a member of the AP-1 transcription factor family, in P. lividus sea urchin embryos. Mar. Environ. Res. 2018, 139, 99–112. [Google Scholar] [CrossRef]
  27. Zito, F.; Burke, R.D.; Matranga, V. Pl-nectin, a discoidin family member, is a ligand for beta C integrins in the sea urchin embryo. Matrix Biol. 2010, 29, 341–345. [Google Scholar] [CrossRef]
  28. Costa, C.; Karakostis, K.; Zito, F.; Matranga, V. Phylogenetic analysis and expression patterns of p16 and p19 in Paracentrotus lividus embryos. Dev. Genes Evol. 2012, 222, 245–251. [Google Scholar] [CrossRef]
  29. Livak, K.J.; Schmittgen, T.D. Analysis of relative gene expression data using real-time quantitative PCR and the 2−ΔΔCT Method. Methods 2001, 25, 402–408. [Google Scholar] [CrossRef]
  30. Russo, R.; Zito, F.; Costa, C.; Bonaventura, R.; Matranga, V. Transcriptional increase and misexpression of 14-3-3 epsilon in sea urchin embryos exposed to UV-B. Cell Stress Chaperones 2010, 15, 993–1001. [Google Scholar] [CrossRef] [Green Version]
  31. Russo, R.; Bonaventura, R.; Matranga, V. Time- and dose-dependent gene expression in sea urchin embryos exposed to UVB. Mar. Environ. Res. 2014, 93, 85–92. [Google Scholar] [CrossRef]
  32. Russo, R.; Pinsino, A.; Costa, C.; Bonaventura, R.; Matranga, V.; Zito, F. The newly characterized Pl-jun is specifically expressed in skeletogenic cells of the Paracentrotus lividus sea urchin embryo. FEBS J. 2014, 281, 3828–3843. [Google Scholar] [CrossRef] [PubMed]
  33. Bonaventura, R.; Zito, F.; Chiaramonte, M.; Costa, C.; Russo, R. Nickel toxicity in P. lividus embryos: Dose dependent effects and gene expression analysis. Mar. Environ. Res. 2018, 139, 113–121. [Google Scholar] [CrossRef] [PubMed]
  34. Wakamatsu, Y.; Uchikawa, M. The many faces of Sox2 function in neural crest development. Dev. Growth Differ. 2021, 63, 93–99. [Google Scholar] [CrossRef] [PubMed]
  35. Hinman, V.F.; Burke, R.D. Embryonic neurogenesis in echinoderms. WIREs Dev. Biol. 2018, 7, e316. [Google Scholar] [CrossRef]
  36. Prokopec, S.D.; Watson, J.D.; Waggott, D.M.; Smith, A.B.; Wu, A.H.; Okey, A.B.; Pohjanvirta, R.; Boutros, P.C. Systematic evaluation of medium-throughput mRNA abundance platforms. RNA 2013, 19, 51–62. [Google Scholar] [CrossRef] [Green Version]
  37. Nemer, M. An altered series of ectodermal gene expressions accompanying the reversible suspension of differentiation in the zinc-animalized sea urchin embryo. Dev. Biol. 1986, 114, 214–224. [Google Scholar] [CrossRef]
  38. Ryu, T.K.; Lee, G.; Rhee, Y.; Park, H.S.; Chang, M.; Lee, S.; Lee, J.; Lee, T.K. Identification of nickel response genes in abnormal early developments of sea urchin by differential display polymerase chain reaction. Ecotoxicol. Environ. Saf. 2012, 84, 18–24. [Google Scholar] [CrossRef]
  39. Molina, M.D.; Lepage, T. Maternal factors regulating symmetry breaking and dorsal–ventral axis formation in the sea urchin embryo. In Current Topics in Developmental Biology; Marlow, F.L., Ed.; Academic Press Inc. Elsevier Science: San Diego CA, USA, 2020; Volume 140, pp. 283–316. ISBN 9780128152201. [Google Scholar]
  40. Anishchenko, E.; Arnone, M.I.; D’Aniello, S. SoxB2 in sea urchin development: Implications in neurogenesis, ciliogenesis and skeletal patterning. EvoDevo 2018, 9, 5. [Google Scholar] [CrossRef]
  41. Shimada, T.; Fournier, A.E.; Yamagata, K. Neuroprotective function of 14-3-3 proteins in neurodegeneration. BioMed Res. Int. 2013, 2013, 564534. [Google Scholar] [CrossRef]
  42. Solek, C.M.; Oliveri, P.; Loza-Coll, M.; Schrankel, C.S.; Ho, E.C.H.; Wang, G.; Rast, J.P. An ancient role for Gata-1/2/3 and Scl transcription factor homologs in the development of immunocytes. Dev. Biol. 2013, 382, 280–292. [Google Scholar] [CrossRef] [Green Version]
  43. Suh, S.S.; Hwang, J.; Park, M.; Park, S.Y.; Ryu, T.K.; Lee, S.; Lee, T.K. Hypoxia-modulated gene expression profiling in sea urchin (Strongylocentrotus nudus) immune cells. Ecotoxicol. Environ. Saf. 2014, 109, 63–69. [Google Scholar] [CrossRef] [PubMed]
  44. Zito, F.; Tesoro, V.; McClay, D.R.; Nakano, E.; Matranga, V. Ectoderm cell-ECM interaction is essential for sea urchin embryo skeletogenesis. Dev. Biol. 1998, 196, 184–192. [Google Scholar] [CrossRef] [PubMed] [Green Version]
  45. Barsi, J.C.; Tu, Q.; Calestani, C.; Davidson, E.H. Genome-wide assessment of differential effector gene use in embryogenesis. Development 2015, 142, 3892–3901. [Google Scholar] [CrossRef] [PubMed] [Green Version]
  46. Da Silva, G.F.Z.; Reuille, R.L.; Ming, L.J.; Livingston, B.T. Overexpression and mechanistic characterization of blastula protease 10, a metalloprotease involved in sea urchin embryogenesis and development. J. Biol. Chem. 2006, 281, 10737–10744. [Google Scholar] [CrossRef] [Green Version]
  47. Kozmik, Z. Pax genes in eye development and evolution. Curr. Opin. Genet. Dev. 2005, 15, 430–438. [Google Scholar] [CrossRef]
  48. Lapraz, F.; Röttinger, E.; Duboc, V.; Range, R.; Duloquin, L.; Walton, K.; Wu, S.Y.; Bradham, C.; Loza, M.A.; Hibino, T.; et al. RTK and TGF-β signaling pathways genes in the sea urchin genome. Dev. Biol. 2006, 300, 132–152. [Google Scholar] [CrossRef] [Green Version]
  49. Saudemont, A.; Haillot, E.; Mekpoh, F.; Bessodes, N.; Quirin, M.; Lapraz, F.; Duboc, V.; Röttinger, E.; Range, R.; Oisel, A.; et al. Ancestral regulatory circuits governing ectoderm patterning downstream of nodal and BMP2/4 revealed by gene regulatory network analysis in an echinoderm. PLoS Genet. 2010, 6, e1001259. [Google Scholar] [CrossRef] [Green Version]
  50. Zito, F.; Costa, C.; Sciarrino, S.; Poma, V.; Russo, R.; Angerer, L.M.; Matranga, V. Expression of univin, a TGF-β growth factor, requires ectoderm–ECM interaction and promotes skeletal growth in the sea urchin embryo. Dev. Biol. 2003, 264, 217–227. [Google Scholar] [CrossRef] [Green Version]
  51. Martino, C.; Costa, C.; Roccheri, M.C.; Koop, D.; Scudiero, R.; Byrne, M. Gadolinium perturbs expression of skeletogenic genes, calcium uptake and larval development in phylogenetically distant sea urchin species. Aquat. Toxicol. 2018, 194, 57–66. [Google Scholar] [CrossRef]
  52. Mcintyre, D.C.; Seay, N.W.; Croce, J.C.; McClay, D.R. Short-range Wnt5 signaling initiates specification of sea urchin posterior ectoderm. Development 2013, 140, 4881–4889. [Google Scholar] [CrossRef] [Green Version]
  53. Croce, J.; Lhomond, G.; Lozano, J.C.; Gache, C. ske-T, a T-box gene expressed in the skeletogenic mesenchyme lineage of the sea urchin embryo. Mech. Dev. 2001, 107, 159–162. [Google Scholar] [CrossRef]
  54. Croce, J.; Lhomond, G.; Gache, C. Coquillette, a sea urchin T-box gene of the Tbx2 subfamily, is expressed asymmetrically along the oral-aboral axis of the embryo and is involved in skeletogenesis. Mech. Dev. 2003, 120, 561–572. [Google Scholar] [CrossRef]
  55. Beere, H.M. Death versus survival: Functional interaction between the apoptotic and stress-inducible heat shock protein pathways. J. Clin. Investig. 2005, 115, 2633–2639. [Google Scholar] [CrossRef] [PubMed] [Green Version]
  56. Bonaventura, R.; Zito, F.; Costa, C.; Giarrusso, S.; Celi, F.; Matranga, V. Stress response gene activation protects sea urchin embryos exposed to X-rays. Cell Stress Chaperones 2011, 16, 681–687. [Google Scholar] [CrossRef] [PubMed] [Green Version]
  57. Fujita, Y.; Hirate, Y.; Hiyama, T.; Yamasu, K.; Suyemitsu, T.; Ishihara, K. Purification of EGIP-D-Binding Protein from the Embryos of the Sea Urchin Anthocidaris crassispina. Zool. Sci. 1997, 14, 931–934. [Google Scholar] [CrossRef] [PubMed]
  58. Duloquin, L.; Lhomond, G.; Gache, C. Localized VEGF signaling from ectoderm to mesenchyme cells controls morphogenesis of the sea urchin embryo skeleton. Development 2007, 134, 2293–2302. [Google Scholar] [CrossRef] [Green Version]
  59. Karakostis, K.; Costa, C.; Zito, F.; Brümmer, F.; Matranga, V. Characterization of an Alpha Type Carbonic Anhydrase from Paracentrotus lividus Sea Urchin Embryos. Mar. Biotechnol. 2016, 18, 384–395. [Google Scholar] [CrossRef]
  60. Piacentino, M.L.; Zuch, D.T.; Fishman, J.; Rose, S.; Speranza, E.E.; Li, C.; Yu, J.; Chung, O.; Ramachandran, J.; Ferrell, P.; et al. RNA-Seq identifies SPGs as a ventral skeletal patterning cue in sea urchins. Development 2016, 142, 4217–4229. [Google Scholar] [CrossRef] [Green Version]
  61. Ho, E.C.H.; Buckley, K.M.; Schrankel, C.S.; Schuh, N.W.; Hibino, T.; Solek, C.M.; Bae, K.; Wang, G.; Rast, J.P. Perturbation of gut bacteria induces a coordinated cellular immune response in the purple sea urchin larva. Immunol. Cell Biol. 2016, 94, 861–874. [Google Scholar] [CrossRef]
  62. Wang, C.; Zhang, R.; Wei, X.; Lv, M.; Jiang, Z. Metalloimmunology: The metal ion-controlled immunity. Adv. Immunol. 2020, 145, 187–241. [Google Scholar] [CrossRef]
  63. Arshinoff, B.I.; Cary, G.A.; Karimi, K.; Foley, S.; Agalakov, S.; Delgado, F.; Lotay, V.S.; Ku, C.J.; Pells, T.J.; Beatman, T.R.; et al. Echinobase: Leveraging an extant model organism database to build a knowledgebase supporting research on the genomics and biology of echinoderms. Nucleic Acids Res. 2022, 50, D970–D979. [Google Scholar] [CrossRef] [PubMed]
  64. Andrikou, C.; Iovene, E.; Rizzo, F.; Oliveri, P.; Arnone, M.I. Myogenesis in the Sea Urchin Embryo: The Molecular Fingerprint of the Myoblast Precursors. EvoDevo 2013, 4, 33. [Google Scholar] [CrossRef] [PubMed] [Green Version]
  65. Oliveri, P.; Walton, K.D.; Davidson, E.H.; McClay, D.R. Repression of mesodermal fate by foxa, a key endoderm regulator of the sea urchin embryo. Development 2006, 133, 4173–4181. [Google Scholar] [CrossRef] [PubMed] [Green Version]
  66. Robert, N.; Lhomond, G.; Schubert, M.; Croce, J.C. A comprehensive survey of wnt and frizzled expression in the sea urchin Paracentrotus lividus. Genesis 2014, 52, 235–250. [Google Scholar] [CrossRef]
  67. Cui, M.; Siriwon, N.; Li, E.; Davidson, E.H.; Peter, I.S. Specific functions of the Wnt signaling system in gene regulatory networks throughout the early sea urchin embryo. Proc. Natl. Acad. Sci. USA 2014, 111, E5029–E5038. [Google Scholar] [CrossRef] [Green Version]
  68. Range, R.C.; Angerer, R.C.; Angerer, L.M. Integration of Canonical and Noncanonical Wnt Signaling Pathways Patterns the Neuroectoderm along the Anterior-Posterior Axis of Sea Urchin Embryos. PLoS Biol. 2013, 11, e1001467. [Google Scholar] [CrossRef] [Green Version]
  69. Pascual-Vargas, P.; Salinas, P.C. A Role for Frizzled and Their Post-Translational Modifications in the Mammalian Central Nervous System. Front. Cell Dev. Biol. 2021, 9, 692888. [Google Scholar] [CrossRef]
  70. Poustka, A.J.; Kü, A.; Radosavljevic, V.; Wellenreuther, R.; Lehrach, H.; Panopoulou, G. On the origin of the chordate central nervous system: Expression of onecut in the sea urchin embryo. Evol. Dev. 2004, 6, 227–236. [Google Scholar] [CrossRef]
  71. Tu, Q.; Brown, C.T.; Davidson, E.H.; Oliveri, P. Sea urchin Forkhead gene family: Phylogeny and embryonic expression. Dev. Biol. 2006, 300, 49–62. [Google Scholar] [CrossRef] [Green Version]
  72. Molina, M.D.; de Crozé, N.; Haillot, E.; Lepage, T. Nodal: Master and commander of the dorsal-ventral and left-right axes in the sea urchin embryo. Curr. Opin. Genet. Dev. 2013, 23, 445–453. [Google Scholar] [CrossRef]
  73. Bonaventura, R.; Russo, R.; Zito, F.; Matranga, V. Combined effects of cadmium and UVB radiation on sea urchin embryos: Skeleton impairment parallels p38 MAPK activation and stress genes overexpression. Chem. Res. Toxicol. 2015, 28, 1060–1069. [Google Scholar] [CrossRef] [PubMed]
Figure 1. Morphologies of P. lividus embryos treated with Li, Ni, and Zn. (A) Schematic drawing of Li, Ni and Zn treatment experiments. Black line, hpf, in the upper part; the first vertical arrow indicates addition of 30 mM LiCl (Li), 0.5mM NiCl2 (Ni), 0.1mM ZnSO4 (Zn) at 0.5 hpf. Periods of treatment with Li, orange line; Ni, red line; Zn, yellow line. Untreated embryos (CTR), blue line. s/o indicates sampling (s) for NanoString nCounter gene expression assay and qPCR analyses and (o) microscopic observation. Embryos were observed at 24 (BE) and 48 (FI) hours post-fertilization (hpf). Untreated embryos: (B) control gastrula; (F) control pluteus. (C,G) Li-embryos; (D,H) Ni-embryos; (E,I) Zn-embryos. Blue ellipses in (D,H) indicate short archenteron. Black arrows in (D,E) indicate cells grouped inside the blastocoelic cavity. Red arrows in (F,G) indicate pigment cells. Schemes of embryos at 48 hpf: control pluteus, CTR (J); Li-embryo, Li (K); Ni-embryo, Ni (L); Zn-embryo, Zn (M). Animal/Vegetal (A/V), Dorso/Ventral (D/V) axes are indicated in the scheme of pluteus embryo. (NQ) Anti-Sox2 antibody (red); (RU) Ab-295 (green); (VY) Merged images (yellow) of the relative Anti-Sox2 (NQ) and Ab-295 (RU) images, respectively. The image in the white frame in (N) indicates 1.4× magnification of the pluteus apex, where brightness and contrast have been increased. White arrows in (NQ) indicate Sox2-positive cells. White ellipses in (R) indicate small central ganglionic structures. White arrows in (RT) and (VX) indicate ciliary band. Bar 20 μm for (BI) and (NY).
Toxics 10 00325 g001
Figure 2. Heat map of the 127 genes analyzed following metal treatments. The heat map was generated using conditional formatting on Microsoft Excel. Genes are reported in alphabetical order. Violet, green, and light yellow indicate fold values <−2, >+2 and between −2 and +2, respectively; light blue indicates not quantifiable genes. Li, embryos treated with 30 mM LiCl; Ni, embryos treated with 0.5 mM NiCl2; Zn, embryos treated with 0.1 mM ZnSO4. Hpf, hours post-fertilization.
Toxics 10 00325 g002
Figure 3. Percentages of genes modulated by metal treatments. Percentages of genes modulated by Li (30 mM LiCl), Ni (0.5 mM NiCl2) and Zn (0.1 mM ZnSO4) treatments at 24 and 48 hpf (hours post-fertilization). The fill colors indicate the upregulated genes in green (>+2), downregulated genes in violet (<−2), not responsive in light yellow (between −2 and +2), and not quantifiable (nq) in light blue.
Toxics 10 00325 g003
Figure 4. Apoptosis, Defense, Immune, and Nervous genes are modulated by Li, Ni, and Zn treatments. The grey boxes indicate the threshold for insignificant changes following Li, Ni, and Zn treatments, i.e., fold values between −2 and + 2 at 24 (A) and 48 (B) hours post-fertilization (hpf). Symbols in the plot at 24 hpf (A): light blue rhombus, Li-embryos; orange square, Ni-embryos; light green triangle, Zn-embryos. Symbols in the plot at 48 hpf (B): blue rhombus, Li-embryos; red square Ni-embryos; green triangle, Zn-embryos. Ap, Apoptosis genes; Def, Defense genes; Imm, Immune genes; Ner, Nervous genes.
Toxics 10 00325 g004
Figure 5. Development genes modulated by Li, Ni, and Zn treatments. The grey boxes indicate the threshold for insignificant changes following Li, Ni, and Zn treatments, i.e., fold values between −2 and + 2 at 24 (A) and 48 (B) hours post-fertilization (hpf). Symbols in the plot at 24 hpf (A): light blue rhombus, Li-embryos; orange square, Ni-embryos; light green triangle, Zn-embryos. Symbols in the plot at 48 hpf (B): blue rhombus, Li-embryos; red square Ni-embryos; green triangle, Zn-embryos. Some Development genes were organized considering their dorsal and ventral ectoderm expression. Asterisks (*) indicate genes also expressed in other territories.
Toxics 10 00325 g005
Figure 6. Development and Biomineralization genes with endomesoderm and mesoderm (primary mesenchyme cells, PMCs) expression modulated by Li, Ni, and Zn treatments. The grey boxes indicate the threshold for insignificant changes following Li, Ni, and Zn treatments, i.e., fold values between −2 and + 2, at 24 (A) and 48 (B) hours post-fertilization (hpf). Symbols in the plot at 24 hpf (A): light blue rhombus, Li-embryos; orange square, Ni-embryos; light green triangle, Zn-embryos. Symbols in the plot at 48 hpf (B): blue rhombus, Li-embryos; red square Ni-embryos; green triangle, Zn-embryos. The Development genes here considered have endomesoderm expression. Biomineralization genes, mainly expressed by the PMCs, were organized taking into consideration their functions, i.e., transcription factors (TFs), signaling molecules (signaling), and skeleton structures (skeleton). Asterisks (*) indicate genes also expressed in other territories.
Toxics 10 00325 g006
Figure 7. Comparison of qPCR data of gene transcription levels in Li-, Ni-, and Zn-embryos with NanoString data. Pl-alx1, Pl-can, Pl-gal8, Pl-jun, Pl-mt, and Pl-sox9 mRNA levels were analyzed compared to control embryos using the endogenous gene Pl-Z12-1 for normalization. The gray boxes indicate the threshold for insignificant changes following Li, Ni, and Zn treatments, i.e., fold values between −2 and + 2, at 24 (A) and 48 (B) hours post-fertilization (hpf). Symbols: NanoS, NanoString data, blue bars; qPCR data, red bars; Li, Li-embryos; Ni, Ni-embryos, Zn, Zn-embryos. The light blue triangles indicate not quantifiable values. Each bar of qPCR data represents the mean of three independent experiments of qPCR ± SD. QPCR mean values were significantly different according to the one-way ANOVA (p < 0.05), followed by the Tukey’s test. The asterisks (*) indicate statistically not significant variations to the relative control.
Toxics 10 00325 g007
Figure 8. Venn diagrams reporting the numbers of modulated genes in different subgroups, i.e., in Li, Ni, Zn, Li/Ni, Li/Zn, Ni/Zn, and Li/Ni/Zn. Modulated genes at 24 (A) and 48 (B) hours post-fertilization (hpf). The table below reports the numbers of down- and up-regulated genes in each group.
Toxics 10 00325 g008
Table 1. List of sensitive genes common to Li, Ni and Zn as potential biomarkers of impact.
EndpointGeneAccession NumberCategory Function
24 hpf14-3-3epsilonAJ493680.2Defense protein adaptor
gata1/2/3GQ377404.1ImmuneTF
chordinFJ976182.1Nervousextracellular modulator
pax2/5/8AF016884.1NervousTF
bp10X56224.1DevelopmentEnzyme
nectinAJ578435.2Developmentextracellular matrix protein
paxBAF016885.1DevelopmentTF
smad6/7HM449802.1DevelopmentTF
univinDQ536195.1DevelopmentTGF-β ligand
wnt5HM449806.1Developmentsecreted glycoprotein
p16FR693763.1Biomineralizationspicule matrix protein
coquilletteAJ508929.1BiomineralizationTF
ske-tAJ309216.1BiomineralizationTF
48 hpf14-3-3epsilonAJ493680.2Defense protein adaptor
hsp70-IIX16544.1Defensehsp family
gata1/2/3GQ377404.1ImmuneTF
egip precursorHM449819.1DevelopmentPolypeptide
nectinAJ578435.2Developmentextracellular matrix protein
vegfrAM419057.1BiomineralizationVEGF receptor
Publisher’s Note: MDPI stays neutral with regard to jurisdictional claims in published maps and institutional affiliations.

