Article

A Data-Driven Framework for Agri-Food Supply Chains: A Case Study on Inventory Optimization in Colombian Potatoes Management

by
Daniel Muñoz Rojas
1,2,
Jairo R. Montoya-Torres
1,3,* and
Diana M. Ayala Valderrama
2
1
Grupo de Investigación en Sistemas Logísticos, Universidad de La Sabana, Km 7 Autopista Norte Bogotá D.C. Chía, Chía 250001, Colombia
2
Grupo de Investigación GISPA—Gestión Integral de los Servicios y Productividad Agroindustrial, Universidad Santo Tomás Seccional Tunja, Boyacá 150001, Colombia
3
Département de Génie des Systèmes, École de Technologie Supérieure, 1100 rue Notre-Dame Ouest, Montreal, QC H3C 1K3, Canada
*
Author to whom correspondence should be addressed.
Logistics 2025, 9(4), 164; https://doi.org/10.3390/logistics9040164
Submission received: 13 August 2025 / Revised: 22 September 2025 / Accepted: 20 October 2025 / Published: 21 November 2025
(This article belongs to the Section Artificial Intelligence, Logistics Analytics, and Automation)

Abstract

Background: Mitigating the negative impacts of climate change and ensuring food security are critical challenges for sustainable development. Potato crops play a key role in global food security, and optimizing their supply chains can improve yields, reduce waste, and stabilize farmer incomes. This study focuses on the potato supply chain in Boyacá, Colombia, aiming to maximize profitability for smallholder farmers through a data-driven approach. Methods: We developed a hybrid framework combining the newsvendor model, Monte Carlo simulation, and machine learning to optimize inventory decisions under uncertain demand and price conditions. Historical data on potato demand and prices were analyzed to fit probability distributions, and simulation scenarios were run for three main potato varieties. Results: The results show that integrating these methods improves inventory decision-making, with the Criolla Colombia variety yielding positive profitability, while the Diacol Capiro and Pastusa Suprema varieties incur losses under current market conditions. The machine learning model enhances predictive accuracy and supports dynamic planning. Conclusions: The findings demonstrate the potential of advanced analytics to reduce waste, support sustainable practices, and inform agricultural policy. The proposed methodology offers a practical decision-support tool for stakeholders and can be adapted to other crops and regions facing similar operational challenges.

1. Introduction

Modern logistics practices in supply chains have existed for no more than six decades. As outlined in the literature, generally speaking, supply chain management (SCM) involves the management of the flow of goods and services, including all processes that transform raw materials into final products, and the active streamlining of a business’s supply-side activities to maximize customer value and gain a competitive advantage in the marketplace [1]. Its purpose is to improve the long-term performance of individual companies and the supply chain as a whole [2]. One point of view of efficiency in agri-food supply chains relates to the use of mathematical models for decision-making. The use of mathematical models in agri-food supply chains makes it possible to improve the use of production factors, reduce costs, increase profits, and improve decision-making processes, among others. All of this generates positive impacts by reducing greenhouse gas emissions (GHGs) and ensuring food security.
The new dynamics of supply chains, driven by technological evolution or disruptions, have increased the complexity of the application of operational research techniques and management practices in logistics: concepts like responsiveness [3], resilience [4], and sustainability [5,6] have emerged to explain and analyze the behavior of actors in the supply chain and the consequences of decision-making in hostile and/or uncertain environments. The key question is about how to design, plan, and operate a sustainable supply chain in an environment of uncertainty. A sustainable supply chain is a complex network of systems involving various entities that manage the movement of products from suppliers to customers and their associated response, taking into account social, environmental, and economic impacts.
In addition, mitigating the negative impacts of climate change and providing global food security are two of the greatest challenges in sustainability in regard to human development and ecological wellbeing. Both climate change and food security are transversally linked with all the Sustainable Development Goals (SDGs) adopted by the United Nations in 2015, especially zero hunger and climate action. One of the reasons for climate change is the mineralization of organic matter because of land use, exploitation of fossil resources, deforestation, and use of soils for agricultural production [7]. Climate change has a significant influence on global food production because agriculture is closely related to climate change in two ways: first, it is significantly affected by variable climatic conditions that influence crop development; second, it contributes to climate change through emissions of methane and nitrous oxides [8]. In fact, agriculture contributes 24% of GHGs [9].
Food demand is associated with world population growth, demographic changes, eating habits, rising incomes, technological advances, and policies of international trade [10]. According to the Food and Agriculture Organization of the United Nations [11], unfortunately, nearly 690 million people in the world were hungry in 2022, representing 8.9% of the world population. If no significant action is taken, this is projected to increase by 10 million people by the end of 2023 and by nearly 60 million over the next five years. The crops that have contributed most to food security in the world are potatoes, wheat, rice, and corn [8]. Value added in agriculture is related to increased use of production factors. This growth in value added has implied an increase in the use of the factors of production, such as land and water. Currently, 4.8 billion hectares of land are used for agricultural practices, of which 67% is for meadows and pastures and the remaining 33% for crops, and the development of irrigation systems has allowed production to grow faster than the cultivated area. In addition, the use of pesticides and fertilizers has increased by 36% and 57%, respectively [12].
Agri-food supply chain management must consider the stochastic nature of demand and sales prices, i.e., in a more realistic way. In many agricultural supply chain markets around the world, real historical demand and price information are available to farmers and organizations. The coupling of mathematical models and analytics techniques (i.e., machine learning techniques) is a robust approach to both enhance predictive accuracy for understanding the dynamics of agri-food supply chains while also optimizing and improving the efficiency of supply chain operations [13,14].
This paper focuses on optimizing profitability in agri-food supply chains using the newsvendor model, performing a simulation process, and using machine learning to enhance the decision-making process and avoid price variations and unsatisfied demand. The newsvendor problem was selected because of its advantages in both effectively managing the uncertainties inherent in agri-food supply chains (fluctuating demand and unpredictable market prices) and determining optimal order quantities that balance overstocking and understocking costs. This model maximizes expected profit or minimizes expected costs, significantly reducing waste and improving profitability, which aligns with sustainable agricultural practices [15,16]. Thanks to its adaptability to various scenarios, this model is a versatile enough tool for addressing the dynamic nature of agri-food supply chains. A case study of the potato supply chain in the region of Boyacá, Colombia, will be taken as the application. According to the previous context and the stated objective, the research question to be addressed in this paper can be formulated as follows: How can the integration of the newsvendor model, Monte Carlo simulation, and machine learning help both optimize inventory decisions and improve profitability for smallholder potato farmers in Boyacá, Colombia, under uncertain demand and price conditions?
It is important to note that, while inventory optimization in agri-food supply chains is a well-studied topic, most works focus on perishable goods, uncertainty, and the use of mathematical models, often in a generic context or applied to crops other than potatoes [17]. Inventory optimization is indeed a recognized challenge in potato supply chains; however, most studies employ mathematical optimization or agent-based simulation (see, for example, [18,19,20]). To the best of our knowledge, there are no published studies that combine the newsvendor model, simulation, and machine learning techniques specifically for the potato supply chain.
Our case study in Boyacá, Colombia, addresses this gap in the literature by proposing a scalable approach. The combination of these techniques has not previously been explored in published academic work for this crop, especially in the context of smallholder farmers.
In this regard, this paper contributes to the literature by introducing a hybrid framework that integrates the newsvendor model, Monte Carlo simulation, and machine learning to optimize inventory decisions in agri-food supply chains. Unlike previous studies that apply these methods separately or in different contexts, our approach combines their strengths to address uncertainty in demand and price, specifically for the potato supply chain in Boyacá, Colombia. The model provides actionable insights for smallholder farmers, helping to reduce waste, improve profitability, and support sustainable agricultural practices. To the best of our knowledge, this is the first study to apply this integrated methodology to the potato sector in a Latin American context.
To achieve such a goal, this paper is organized as follows. Section 2 is devoted to the review of the relevant literature. Section 3 is devoted to describing the case study of the potato supply chain. The research methods are presented in Section 4. Numerical results are presented in Section 5, followed by the discussion in Section 6. The paper ends in Section 7 by outlining the conclusions and drawings some opportunities for future research.

2. Related Literature

The history of the newsvendor model (NVM) dates back to the work of the economist E. Y. Edgeworth [21], who laid the foundations of modern inventory management theory. After World War II, during the 1950’s, the newsvendor problem began to attract the attention of the academic community in the field of operations research. For example, Whitin [22] was one of the first to relate price theory and inventory control in various models: deterministic, bringing up Economic Order Quantity of Whitman Harris in 1923, as a stationary demand curve model, and stochastic models, as style goods models. He “established a sequential procedure for determining the optimal stocking quantity as a function of price and then the corresponding optimal price”, and Mills [23,24] complemented Whitin’s work by specifying the average demand as a function of selling price [25].
The NVM was initially introduced to optimize profit in the case of buying and distributing a quantity of newspapers per day, a setting that inspired the model’s name, given that newspapers become obsolete by the end of the day [26]. The model has three characteristics: a random amount of some resource, an amount of that resource that is selected prior to demand, and economic consequences represented in costs terms of the overage or the underage of inventory. It addresses the trade-off between excess and shortage of inventory [27]. Excess inventory incurs storage costs and lost profits, while shortages result in missed sales and reduced goodwill [22]. In this decision-making process, analysts generally must deal with random and exogenous variables as market parameters, such as demand or selling prices, and the model has a simple and elegant structure for examining how operational problems interact with marketing issues in decision-making [25].
The newsvendor model has numerous applications and extensions and has been widely used for decision-making in manufacturing and service industries and individual contexts [28]. Some extensions to the classical newsvendor model include quantity to produce or order and capacity [29], price-setting with service and loss constraints [30], and retailer’s fairness concern to improve expected win–win profits [31]. Other studies incorporate behavioral aspects such as value-at-risk as a decision criterion [32], loss aversion [33], and consumer search cost [34]. The literature has also shown some works using the newsvendor model in agri-food supply chains [35,36], dealing with mechanisms to maximize farmers’ income under random rewards or calculating the optimal number of farmers to contract in order to meet seasonal demand under yield and demand uncertainty.
In order to give context to this research, a bibliographical search was carried out for the terms “newsvendor model” and “agri-food supply chain” in the Scopus®, Web of Science®, and Google Scholar® databases. The specific fields and keywords applied are detailed in the search protocol summarized in Table 1. The search retrieved 8 documents from Scopus®, 3 from Web of Science®, and 68 from Google Scholar®. As pointed out before, very few studies were identified that apply the newsvendor model to agricultural supply chains, and no publications were found addressing its use in agriculture within Latin America or Colombia. A selection of recent contributions is presented in Table 2.
As observed, few studies in the literature explicitly address applications of the newsvendor model in agri-food supply chains. To the best of our knowledge, this review of the literature did not identify any work applying documents considering the newsvendor model to the potato agri-food supply chain. This may be because the newsvendor model is traditionally associated with managing inventory for products that can be stored. In agri-food supply chains, however, most agricultural products have a maximum shelf life of two or three weeks after harvesting, provided that good post-harvest agricultural practices are maintained [45]. After this period, products typically move directly to a distributor capable of preserving them during sale or to the end consumer; otherwise, they become losses and waste.

3. Case Study: The Potato Supply Chain

A potato is an exceptional all-round package of a food source, composed of approximately 79% water, with significant carbohydrate and protein contents as well as essential vitamins and minerals that help meet energy requirements [46]. There are 4500 named varieties of potato that trace their ancestry to the Americas, but the differences between a cultivated potato and its wild relatives are size and palatability [46]. The potato crop was domesticated between 6000 and 10,000 years ago in the southern Andes of Peru, north from Lake Titicaca [47]. Wild species of the Solanum brevicaule complex (S. bukasovii, S. canasense, and S. multissectum) are believed to have given rise to S. stenotomum, S. andigena, S. tarijense, and S. tuberosum [47].
As shown in Figure 1, the world production of potatoes was 368.8 million tons in 2019, 371.1 Mt in 2020, and 376.1 Mt in 2021, with an average yield of 20 t/ha [48]. The largest producers (contributing 52% of total production in the world) are currently China (22%), India (14%), Ukraine (6%), Russia (5%), and the United States (5%). However, the best yields in 2020 were offered by United States (50.8 t/ha), New Zealand (50.7 t/ha), Denmark (44 t/ha), Netherlands (42.7 t/ha), and France (40.5 t/ha) [49]. Improvements in potato yield and quality depend on two main factors: (i) favorable agronomic conditions such as soil conditions, adequate irrigation, nutrients management, pest control, and disease management (Table 3 and Table 4); and (ii) the adoption of best management practices (BMPs) aimed at enhancing yield, crop quality, and cost efficiency [50].
In Colombia, the potato crop contributes approximately 3.3% to the Gross Domestic Product (GDP), with an annual consumption of around of 35 kg per person. There are 2.02 million hectares suitable for potato cultivation (installed capacity), and more than 100,000 producers are engaged in potato farming, of which 80% cultivate less than one hectare. Currently, the main varieties cultivated are the Diacol Capiro variety (R12), Pastusa Suprema variety, and Criolla Colombia variety. By 2023, the projection indicated a total planted area of 112.975 hectares, a production of 2.57 million tons, and an average yield of 22.7 t/ha. The largest potato producers are in the departments of Cundinamarca (36%), Boyacá (27%), and Nariño (21%) [54]. In 2023, the potato crop sub-sector faced significant challenges due to rising production costs, shortage of certified seed, labor scarcity, and increased logistic costs, particularly transportation caused by poor road conditions [55].
The “Diacol Capiro” potato variety (ICA), belonging to Solanum tuberosum L. family, is also known as R12 and is registered as ICA PAP-68-02. This variety is widely cultivated in Colombia, preferred for processing in both flakes and sticks because of its light cream flesh color and good response to fracture ([51], p. 23). Diacol Capiro is planted in the departments of Cundinamarca, Boyacá, and Nariño in Colombia, and the crop is highly sensitive to water deficit, which is the most limiting factor in production [53]. The main characteristics of this variety are described in Table 3. The Pastusa Suprema variety is cultivated primarily in the department of Nariño. It has a tall plant habit, slightly light green foliage, moderate flowering, and high male sterility. It produces uniform tubers, with a high proportion in the first category (diameter > 7 cm). It is relatively late (165 days, 2600 masl.). Its yield potential under optimum growing conditions is over 45 t/ha, with a 2-month resting period (15 °C and 75% R.H.), and it is susceptible to PYVV. This variety has replaced in high proportion the main traditional variety in Colombia (potato variety “Parda Pastusa”) [56]. The potato variety “Criolla Colombia” is a highly accepted variety in the country; it is grown in different regions and in different soil conditions, and its yield potential under optimum growing conditions is between 15 and 25 t/ha [51]. The nutritional value of this potato is higher than that of R12 [52].
This paper focuses on the Department of Boyacá, located in the Andes region of Colombia. Known for its robust agricultural production, particularly in terms of tubers, bananas, coffee, and other crops; the region’s favorable climatic conditions make it ideal for potato cultivation. The annual production is about 950,000 tons over 50,000 hectares [57]. Due to the variability in prices and market demand for potatoes in Boyacá, the simulation process carried out in this paper was run using reliable historical data provided by the Colombian Federation of Potato Producers (named FEDEPAPA in Spanish) from 2012 to 2024. A total of 29,868 data points regarding demand and 43,055 data points regarding prices were obtained from all the municipalities of Boyacá, being the large distribution center of the country. The results of this work provide recommendations for the 80 potato-producing municipalities in Boyacá, suggesting improved monthly inventory levels throughout the year to maximize income by effectively meeting demand.

4. Materials and Methods

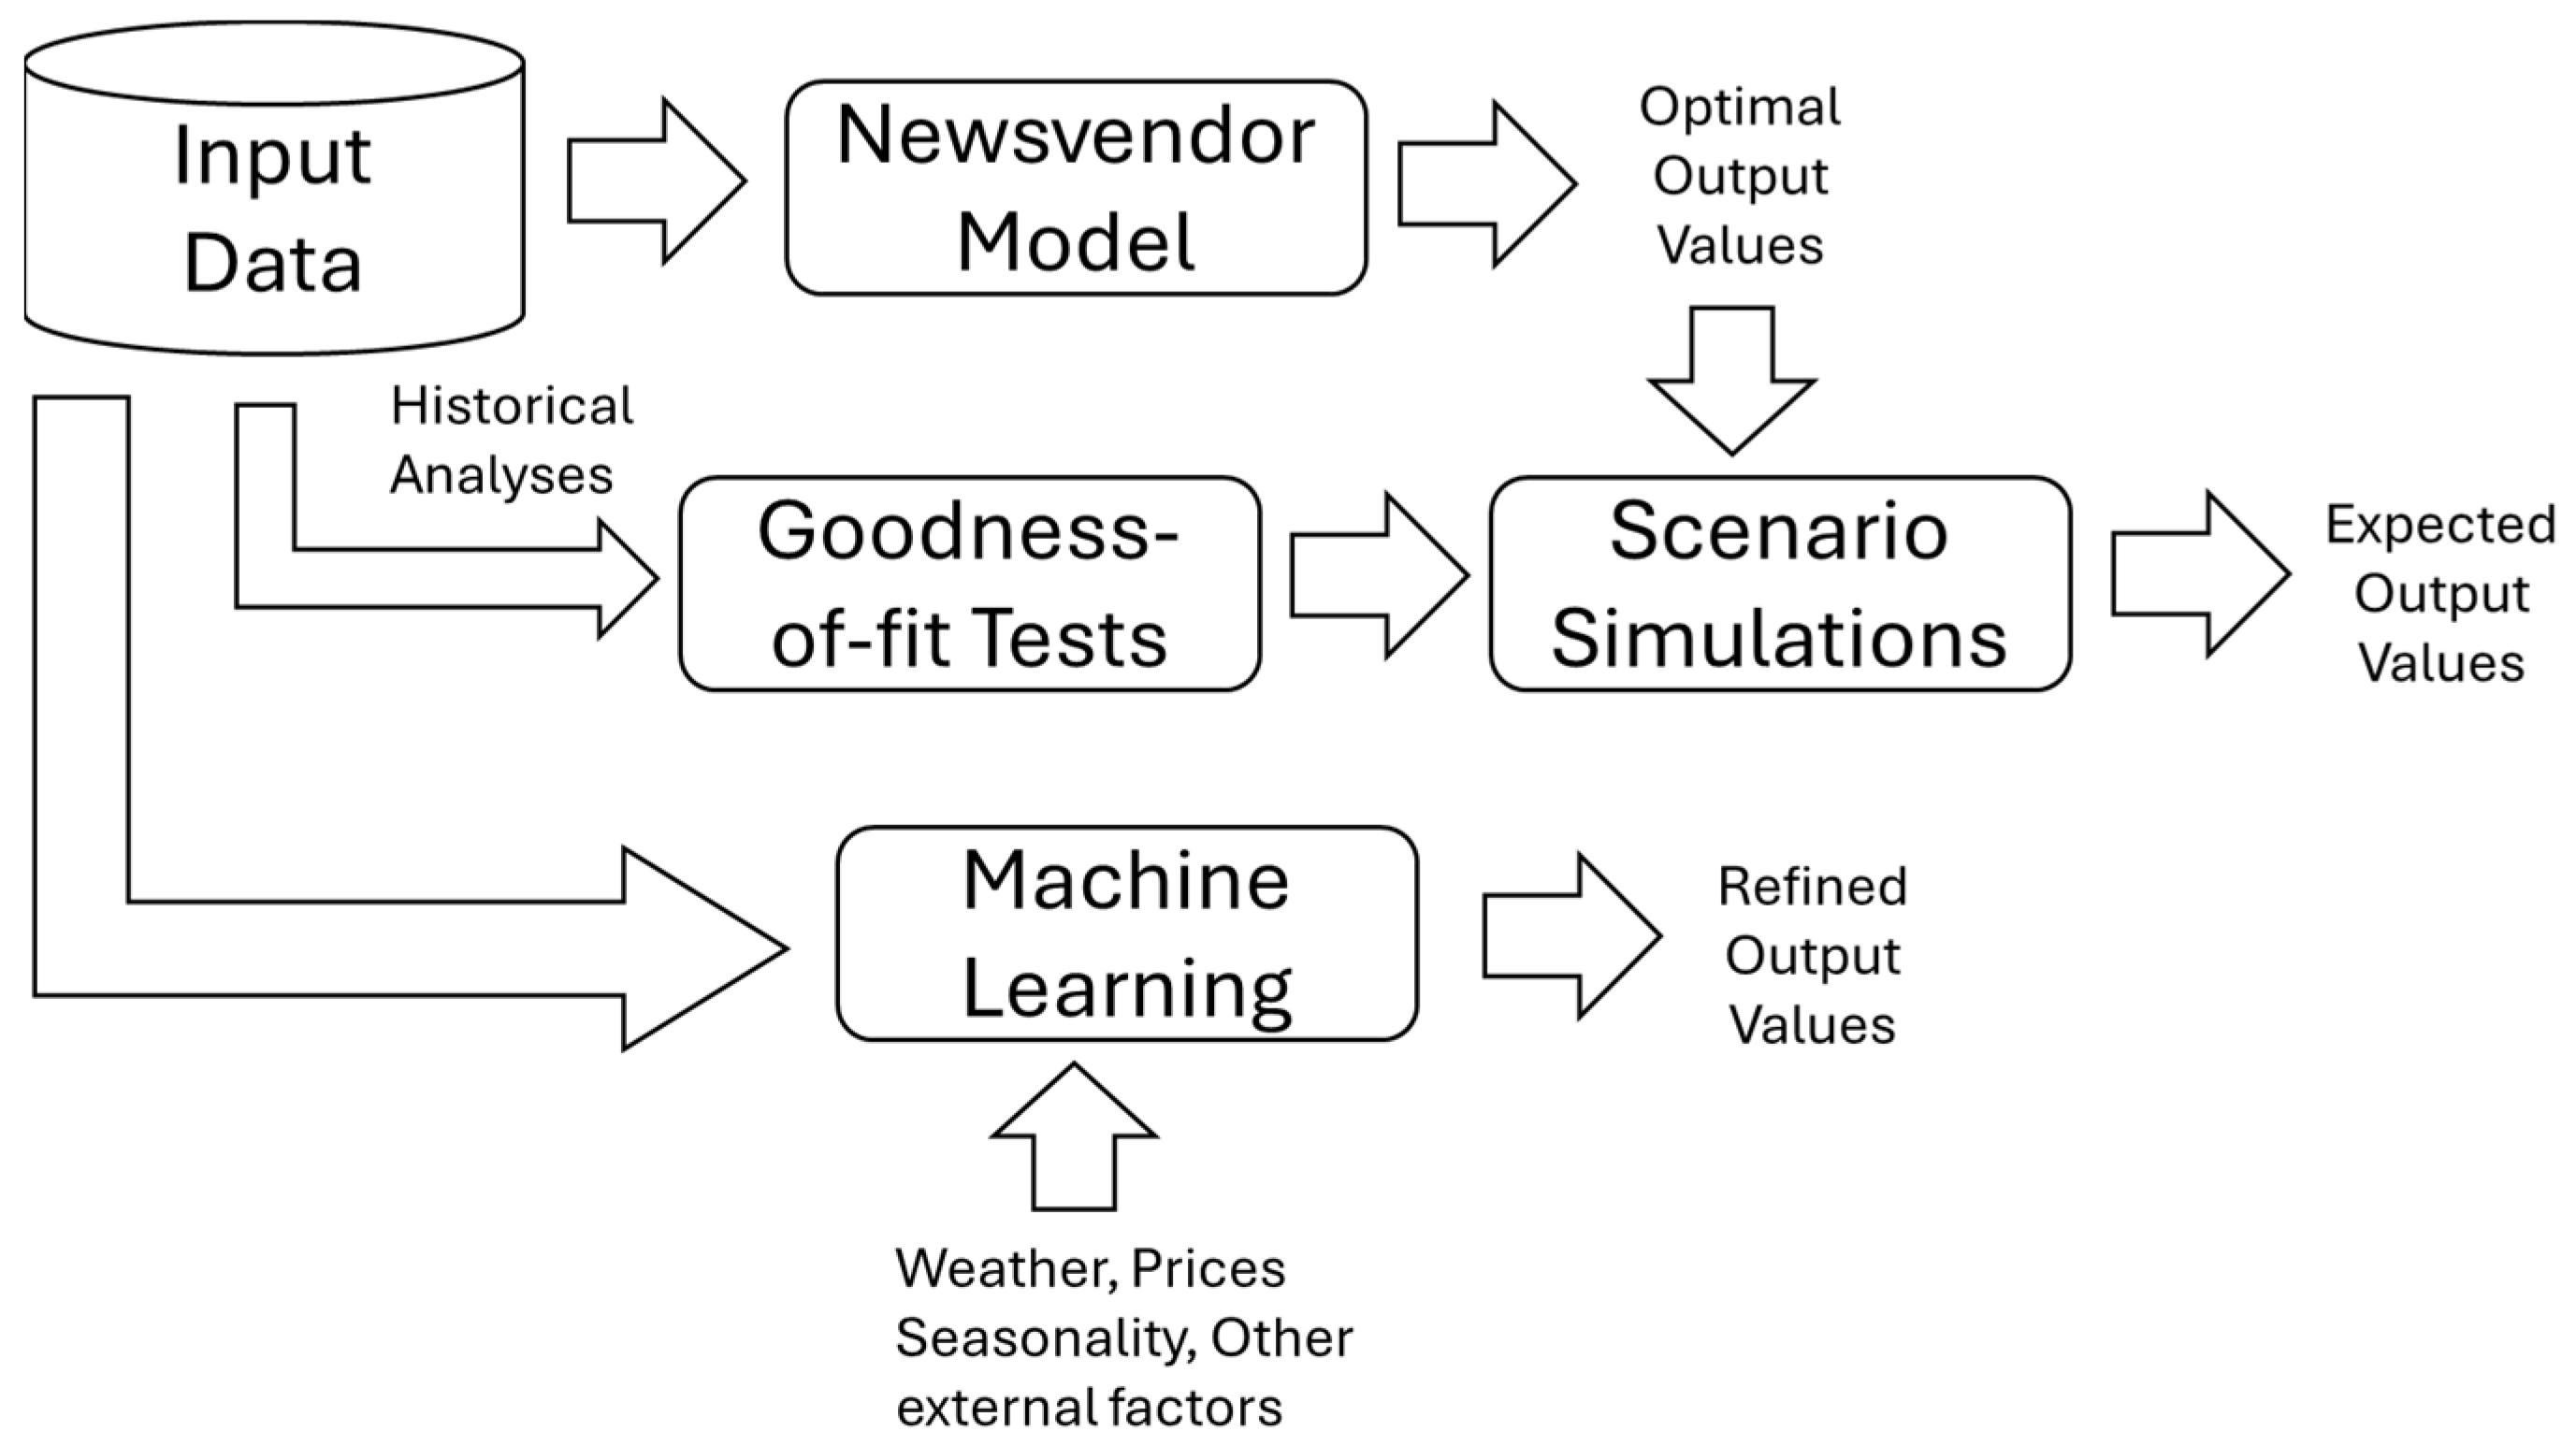
The proposed resolution method integrates the newsvendor model, Monte Carlo simulation, and machine learning techniques (see Figure 2) to optimize inventory management in the potato agri-food supply chain. The newsvendor model, described next, provides a mathematical framework for determining the optimal order quantity that balances the costs of overstocking and understocking. This model incorporates stochastic elements such as fluctuating market prices and variable demand levels, which are derived from historical data. The combination of these three methods was selected to address the complex and uncertain nature of inventory management in the potato supply chain. The newsvendor model provides a robust mathematical framework for determining optimal inventory levels under uncertain demand and price conditions. Monte Carlo simulation allows us to explore a wide range of possible scenarios by generating random samples based on fitted probability distributions, helping to capture real-world variability. Machine learning enhances the approach by improving predictive accuracy and enabling dynamic decision-making. It is particularly useful in further extensions of this work when considering external factors such as weather, seasonality, and market trends that influence demand. Since no previous work in the literature combines these three methods (as noted in the previous section), the goal of this study is to analyze the benefit of using this integrated approach, rather than designing extensions that may be difficult for practitioners to implement. By integrating these methods, the study leverages the strengths of each: analytical rigor, scenario flexibility, and data-driven adaptability, resulting in a comprehensive solution that goes beyond traditional inventory models.
Demand for products in real-world settings is inherently random and uncertain, particularly in agri-food supply chains due to the impact of unpredictable and disruptive events, such as global warming, climate change, environmental factors, crop pests and diseases, and competitive markets challenges, among others. The newsvendor, or newsboy, problem “concerns a stock that should be replenished once to respond to a random demand. Initially, this stock is empty, and the goal is to define the quantity I to introduce in the stock to reach the greatest profit” [26]. In its classical formulation, the selling price is assumed to be greater than the production cost, which, in turn, is greater than the salvage value (see Equation (1)). The probability distribution function of demand is obtained from historical data through goodness-of-fit tests, while the crop yield, cultivated area, production cost, and salvage value are treated as deterministic. Holding cost, setup cost, and initial inventory are not considered in this specific case. Table 5 presents the definition of the variables in the mathematical model.
p > c > v > 0
Probability:
f : p r o b a b i l i t y   d i s t r i b u t i o n   f u n c t i o n   o f   t h e   d e m a n d .
F : p r o b a b i l i t y   d e n s i t y   f u n c t i o n   o f   t h e   d e m a n d .
Maximize the expected value of profit Q ( I ) :
E Q I = S e l l i n g   r e v e n u e + S a l v a g e   r e v e n u e P r o d u c t i o n   c o s t
E Q I = E p   min I , D + E v   max 0 , I D c I
Relation (2) can be rewritten as:
E Q I = p 0 I x f x d x + p I x = I + f x d x + v x = 0 I I x f x d x c l
The function E [ Q I ] is convex regarding I; thus, to maximize, we write that its derivative is equal to 0:
d E Q I d I = p 1 F I + v F I c = 0
Finally:
I = F 1 p c p v
According to Equation (1):
0 < p c p v < 1
This is a necessary condition to compute Equation (3).
Monte Carlo simulation was employed to generate random samples of demand and price based on their fitted probability distributions. This simulation process enables the exploration of various scenarios, including optimistic, conservative, and pessimistic yield and price conditions. By simulating these scenarios, the model estimates the expected monthly profit and identifies the optimal inventory levels that maximize profitability, as described in Section 5.2.
The machine learning model, detailed in Section 5.3, was applied to further refine the decision-making process. The machine learning model uses historical data to predict future demand and incorporates overproduction and shortage costs to optimize output. By simulating the variables affecting potato demand, such as weather, prices, seasonality, and other external factors, the model provides a dynamic and accurate decision-support framework. The integration of these techniques ensures that the potato supply chain is both efficient and resilient, capable of adapting to changing conditions and maximizing profitability.
The proposed framework is based on several assumptions frequently found in the newsvendor model. First, a single-period horizon is considered, reflecting the short post-harvest shelf life of potatoes and the monthly planning cycles typically used by smallholder farmers in Boyacá, Colombia. Second, the model assumes independence between demand and price, supported by historical data analysis showing weak correlation between these variables in the region. Finally, the perishability of products (i.e., potatoes) is considered by incorporating a salvage value for unsold inventory, representing the reduced price at which surplus potatoes can be sold before spoilage. These assumptions simplify the complexity of real-world dynamics but remain consistent with the operational context of the case study. In addition, these assumptions of the newsvendor model also allow for tractable decision-support. Extensions of the model, such as multiple periods or more detailed perishability modeling, can be explored in future research, as discussed in the final section of this paper.

5. Results

5.1. Data Fit

For fitting price and demand parameters, historical data on potato sales prices in Colombian pesos (COP) per kilogram and by variety from 2012 to 2023 were utilized, comprising a dataset of 43,055 observations nationwide. For the department of Boyacá, 4944 records of potato sales prices per kilogram across the Diacol Capiro, Criolla Colombia, and Pastusa Suprema varieties were analyzed. Price data were examined using information from the last two years, applying an average rate of 1 USD = 4270 COP. To determine the demand parameter, Colombian data on potato supply by variety from 2019 to 2024 were analyzed. This dataset included 71,796 observations nationwide and 29,868 specific to the department of Boyacá. All data were sourced from [54]. Historical price and demand data were fitted to specific probability distributions using the Expert fit tool in the FlexSim® software version 24.1 and the Input Analyzer of Arena® simulation software version 16.1. The behavior of prices and demands, goodness-of-fit tests, and histograms are presented in Figure 3 and Figure 4, while a statistical summary of these analyses is shown in Table 6 and Table 7.
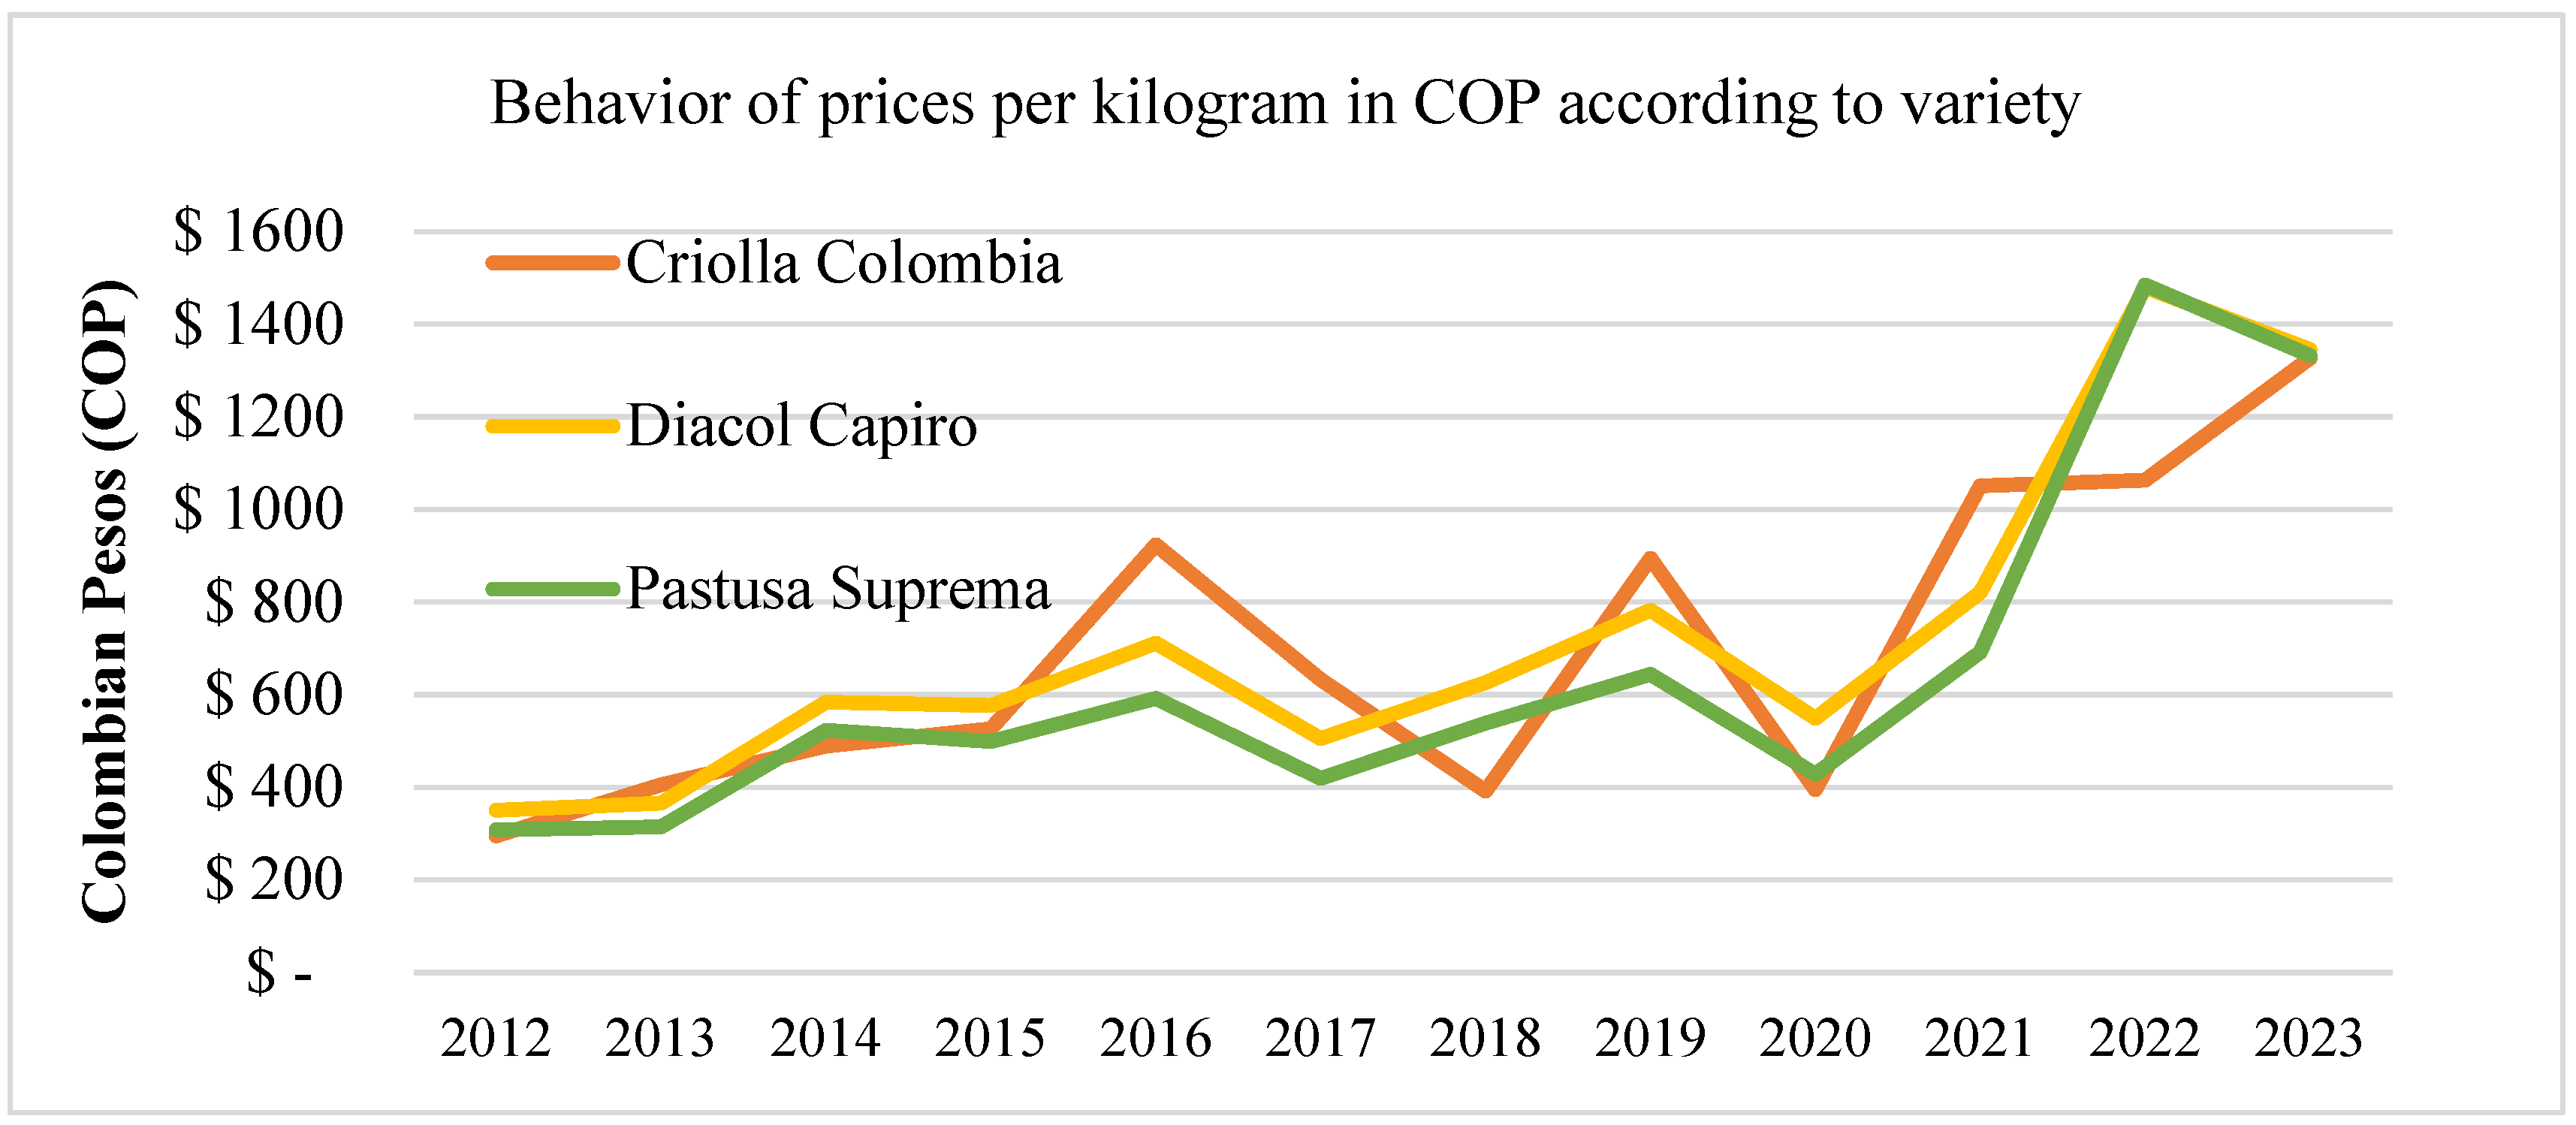
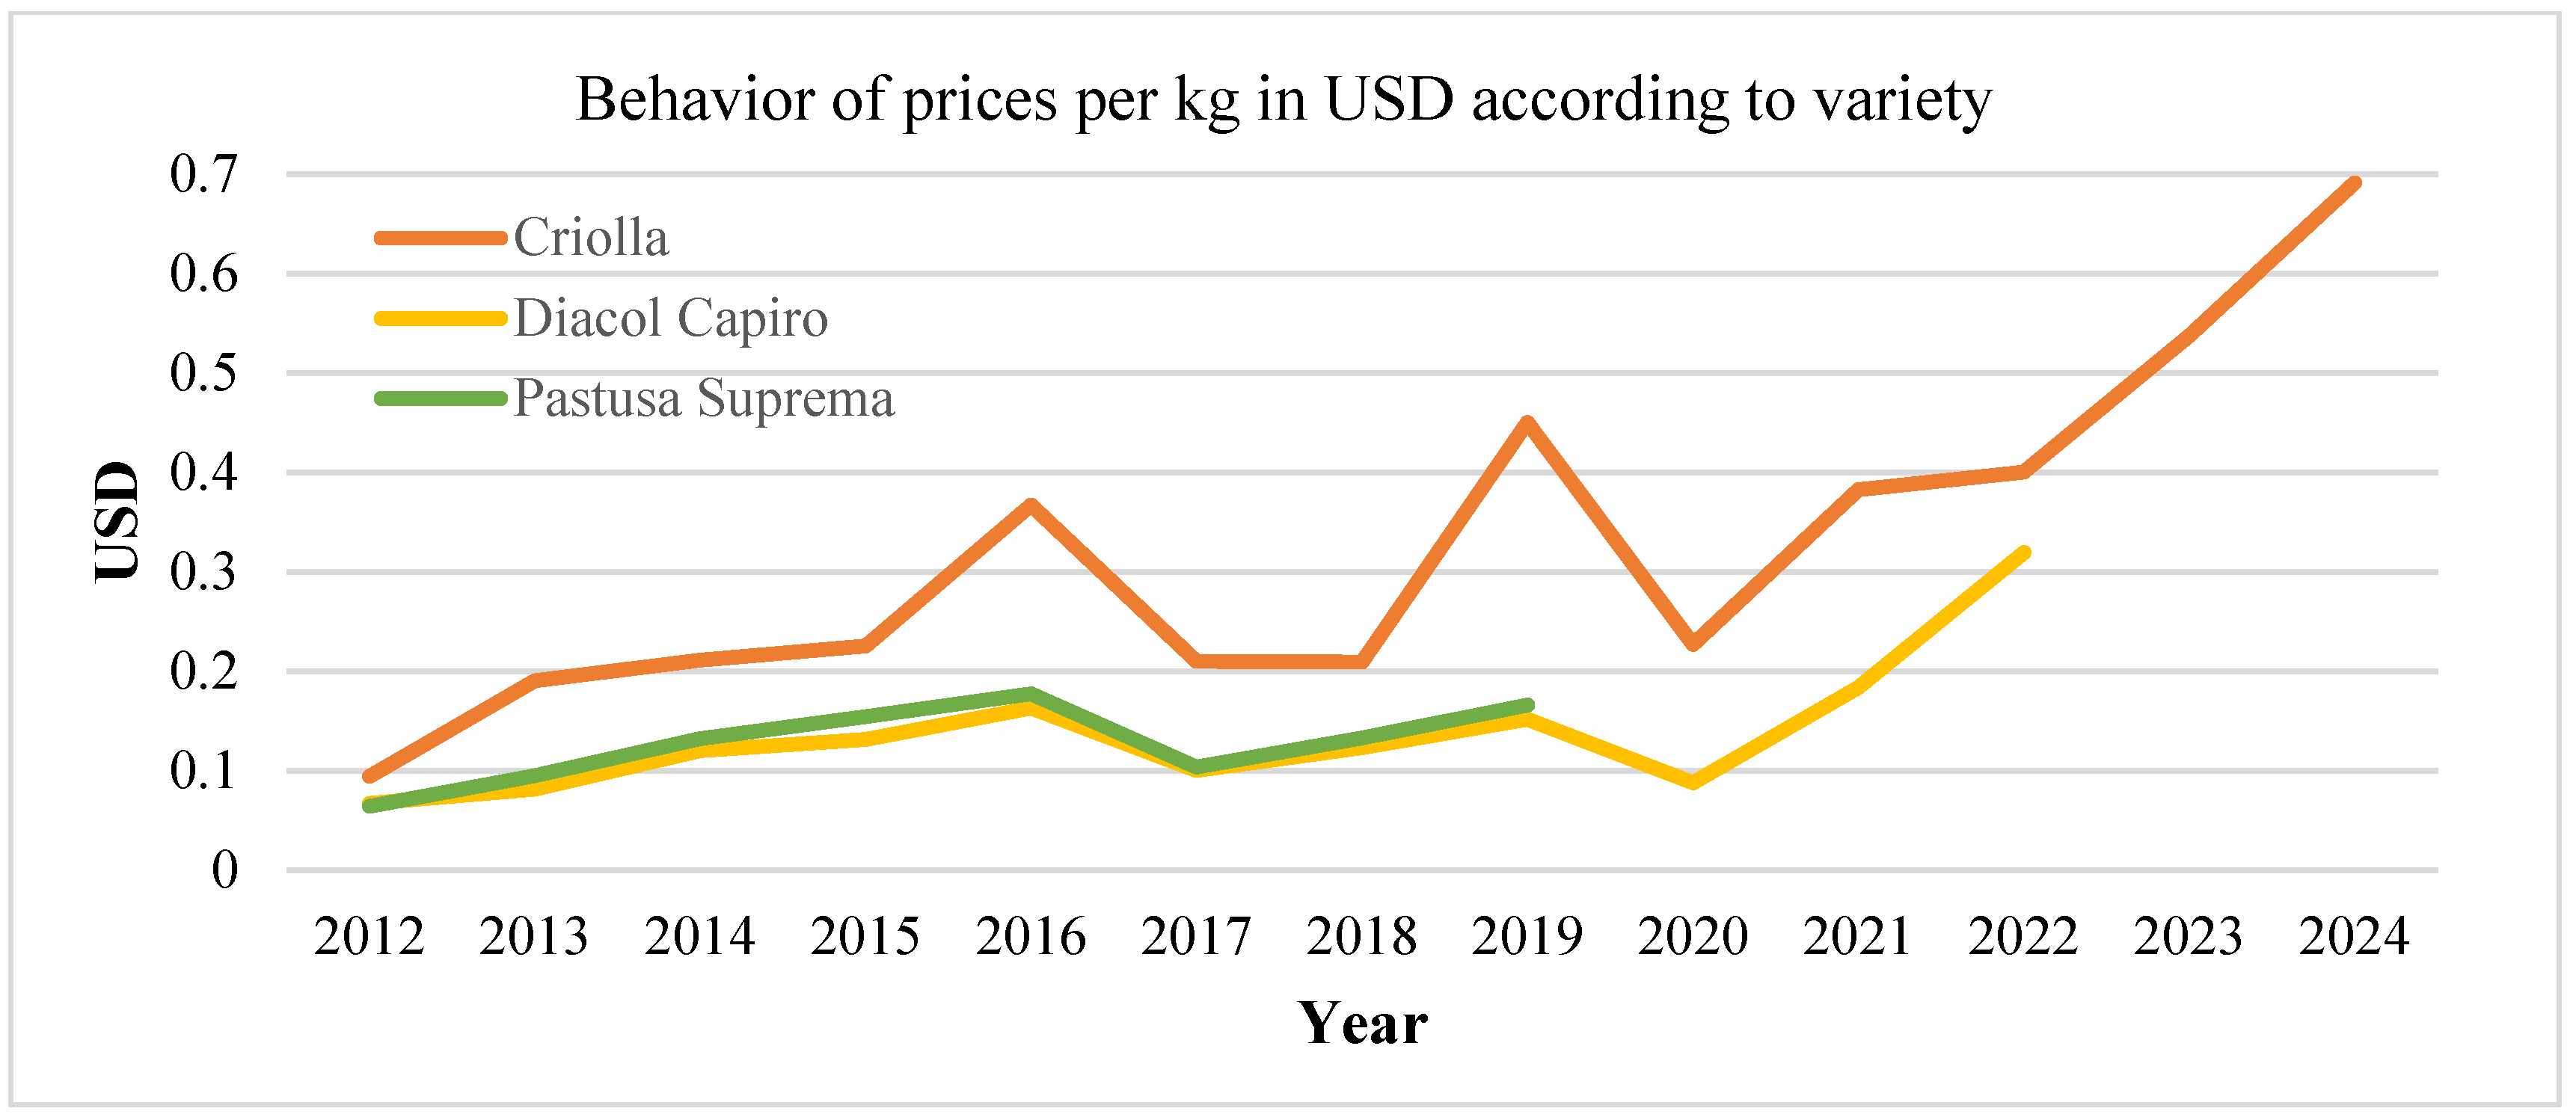
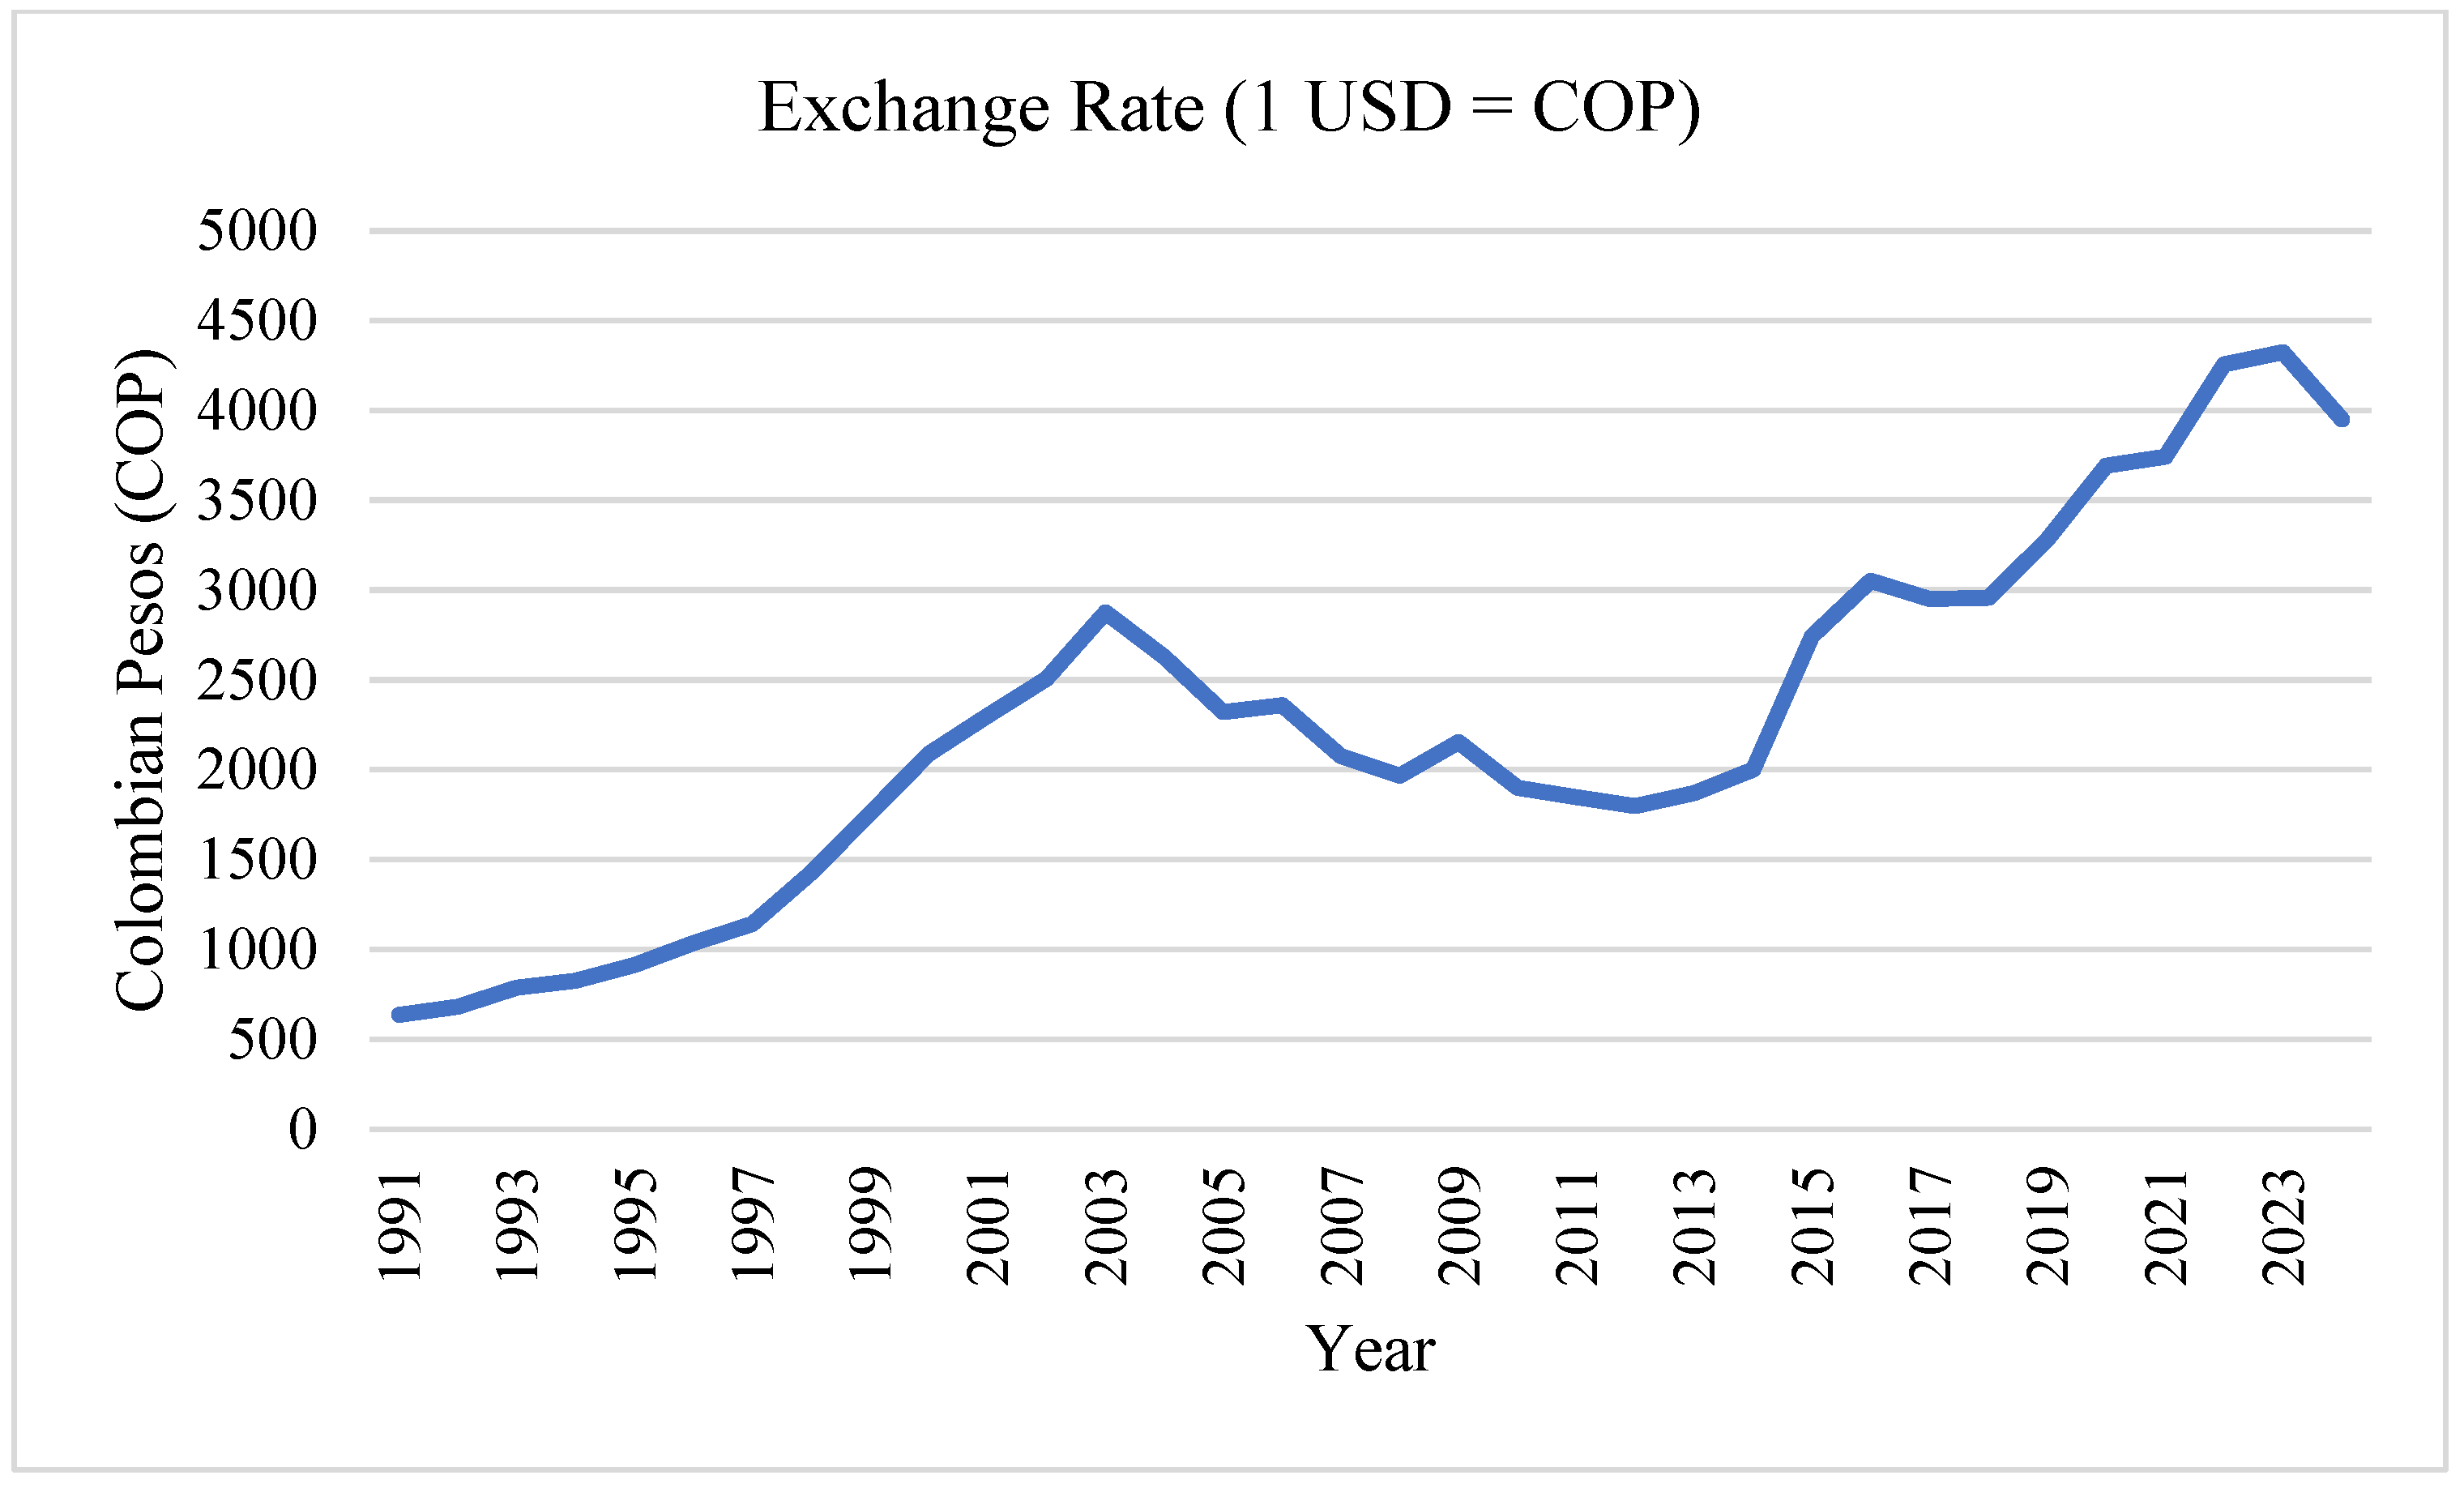
Additionally, Figure A1, Figure A2 and Figure A3 in Appendix A provide further context for the price data used in the analysis. Figure A1 illustrates the historical prices per kilogram in Colombian pesos (COP) for the three potato varieties, highlighting trends and variability over time. Figure A2 presents the same price data converted to U.S. dollars (USD), enabling international comparison and showing the impact of exchange rate fluctuations on profitability. Figure A3 displays the annual COP/USD exchange rate, which was applied to convert local prices into USD for consistency in the simulation and profitability analysis.

5.2. Numerical Analysis and Monte Carlo Simulation Process

Three scenarios were established for each potato variety: optimistic (O), conservative (C), and pessimistic (P). The production cost (c) remained fixed according to yield levels, while the selling price (p) was considered both fixed and variable, depending on the variety and scenario. A total of 18 scenarios were analyzed in the case study, as shown in Table 8. The production cost c, expressed in USD per ton, is a constant value representing the average from the last two years’ data and is linked to an expected yield in tons per hectare (t/ha): higher yields result in lower production costs, thereby indicating more favorable scenarios.
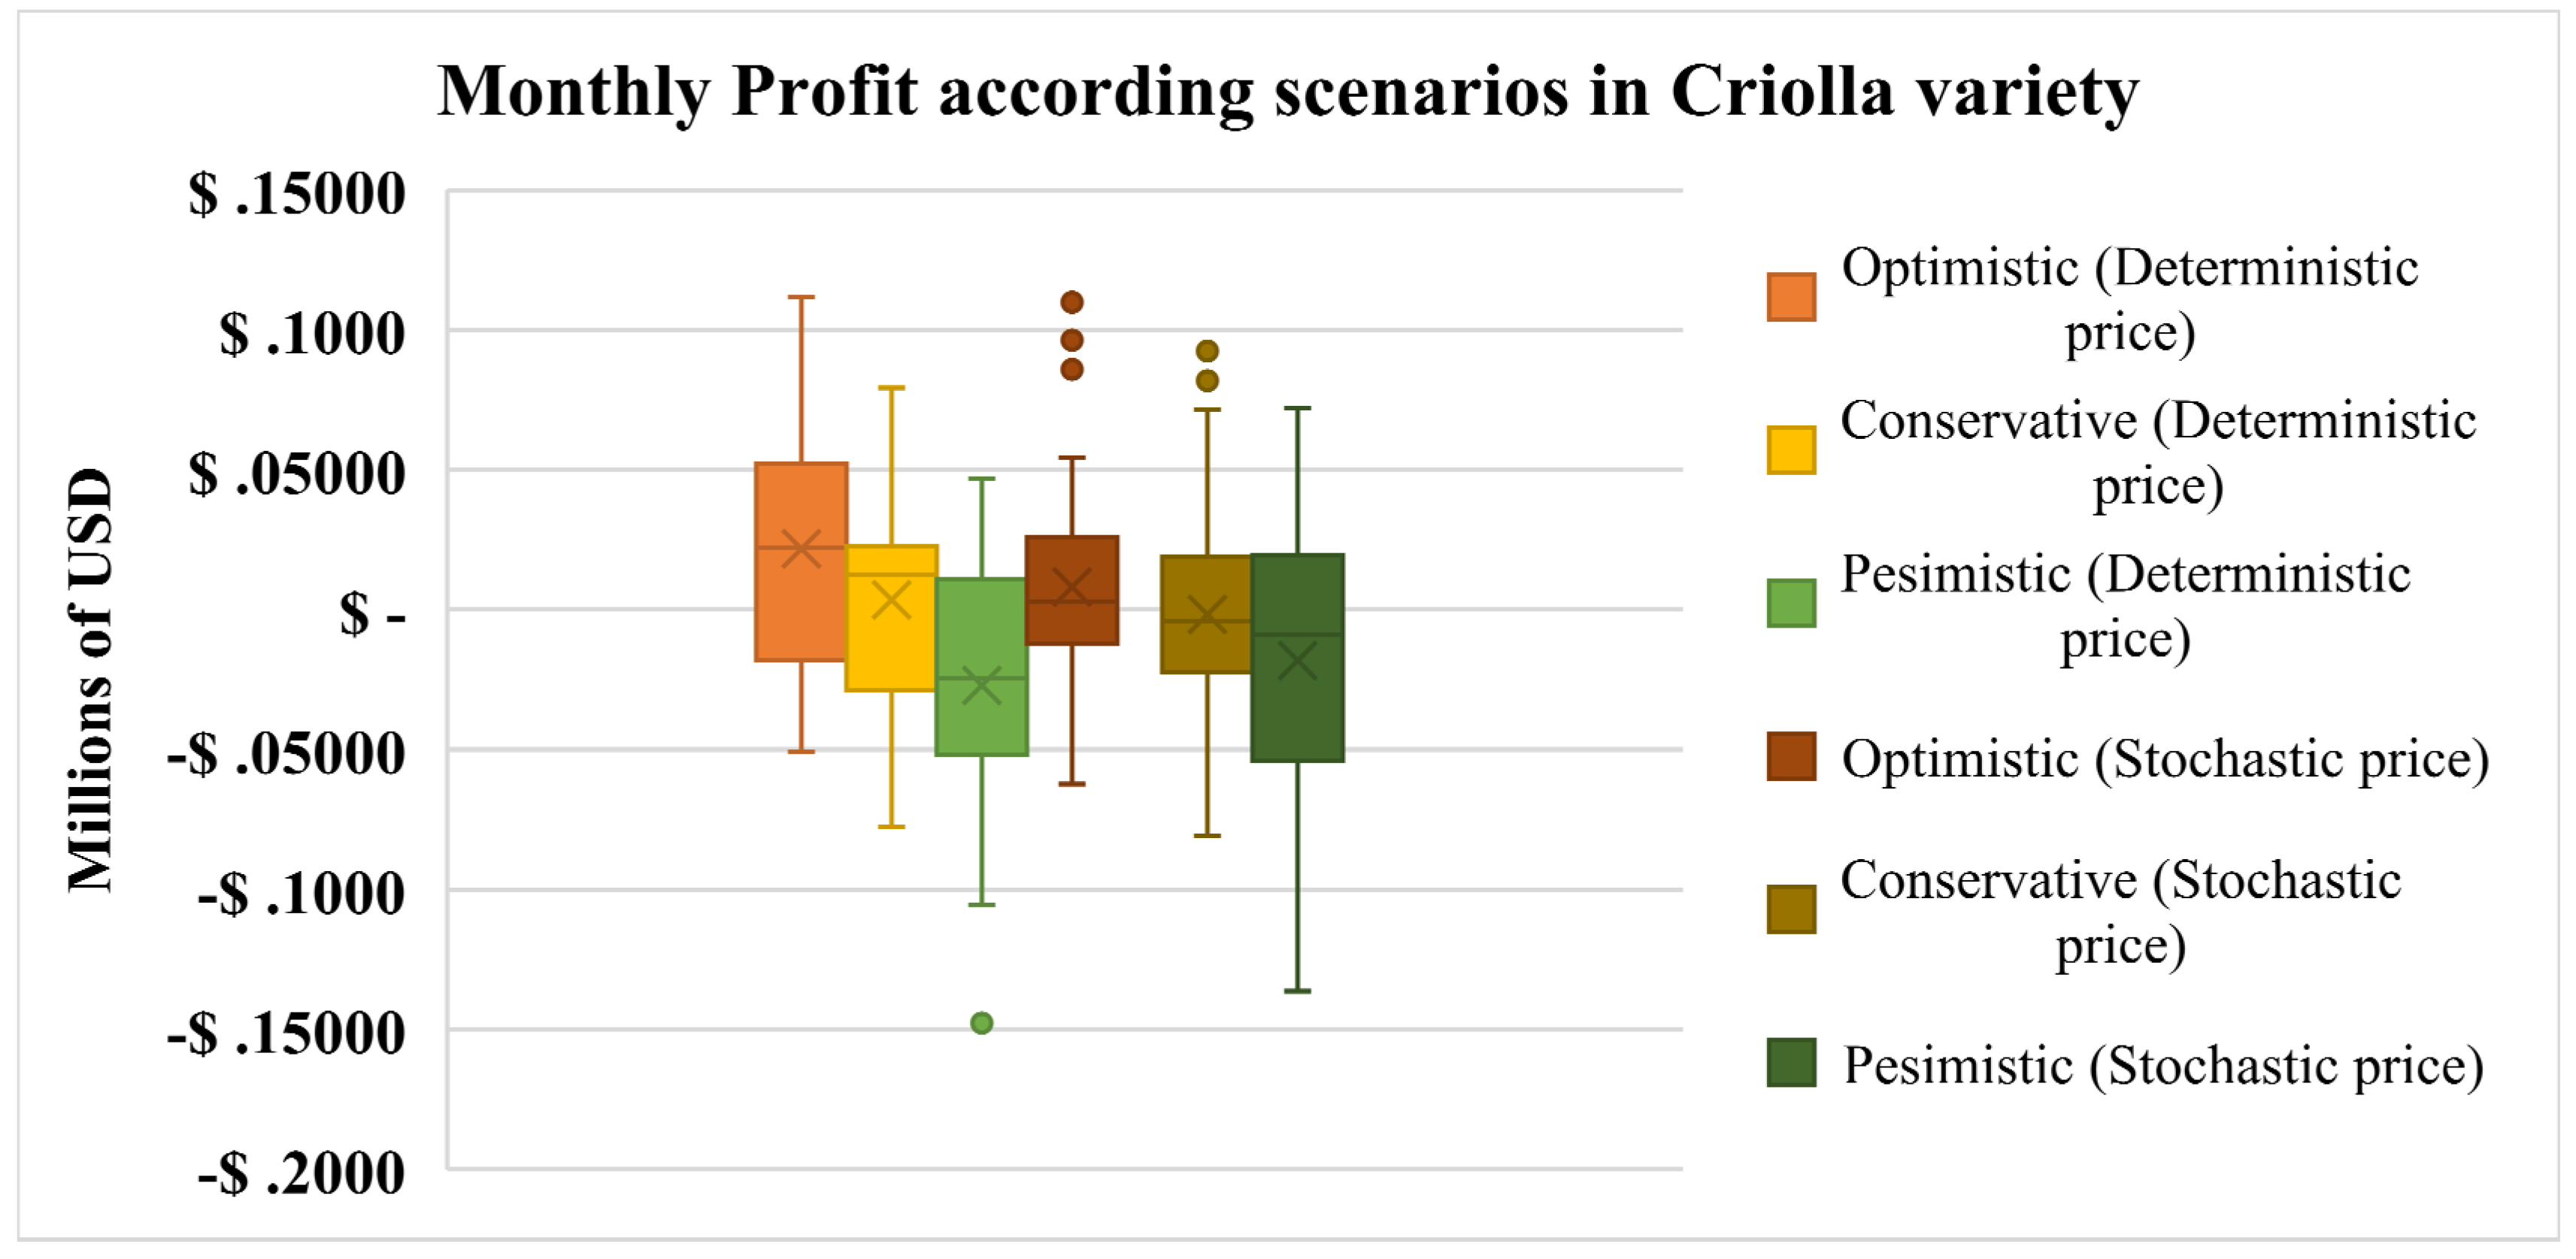
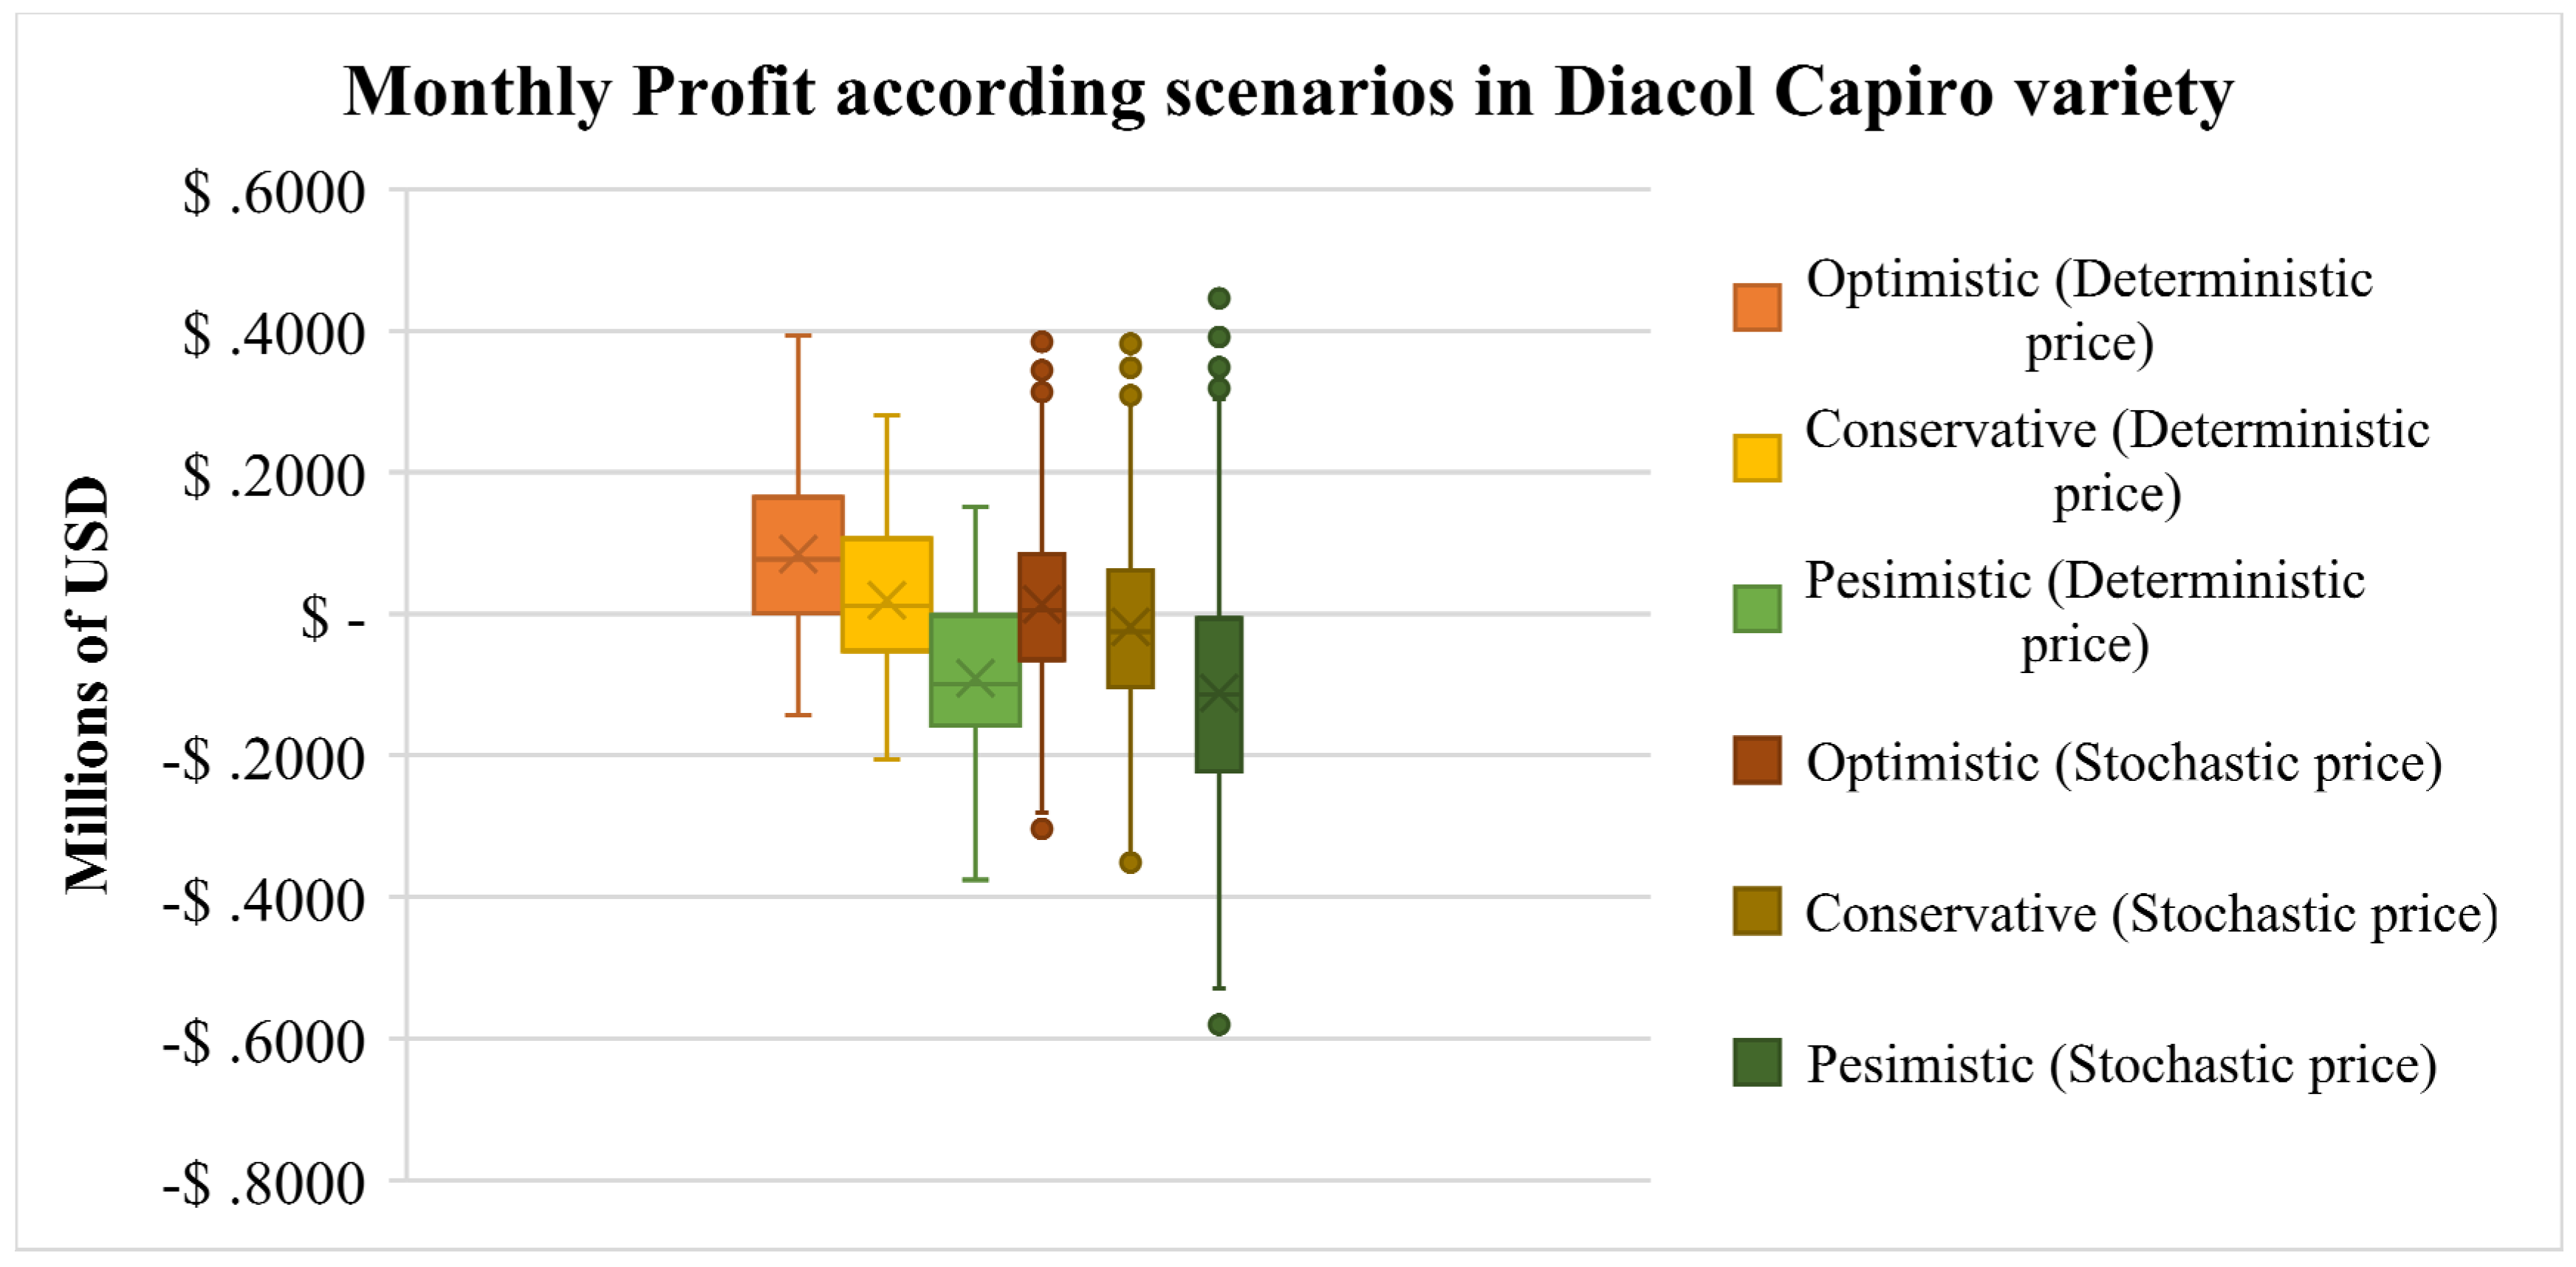
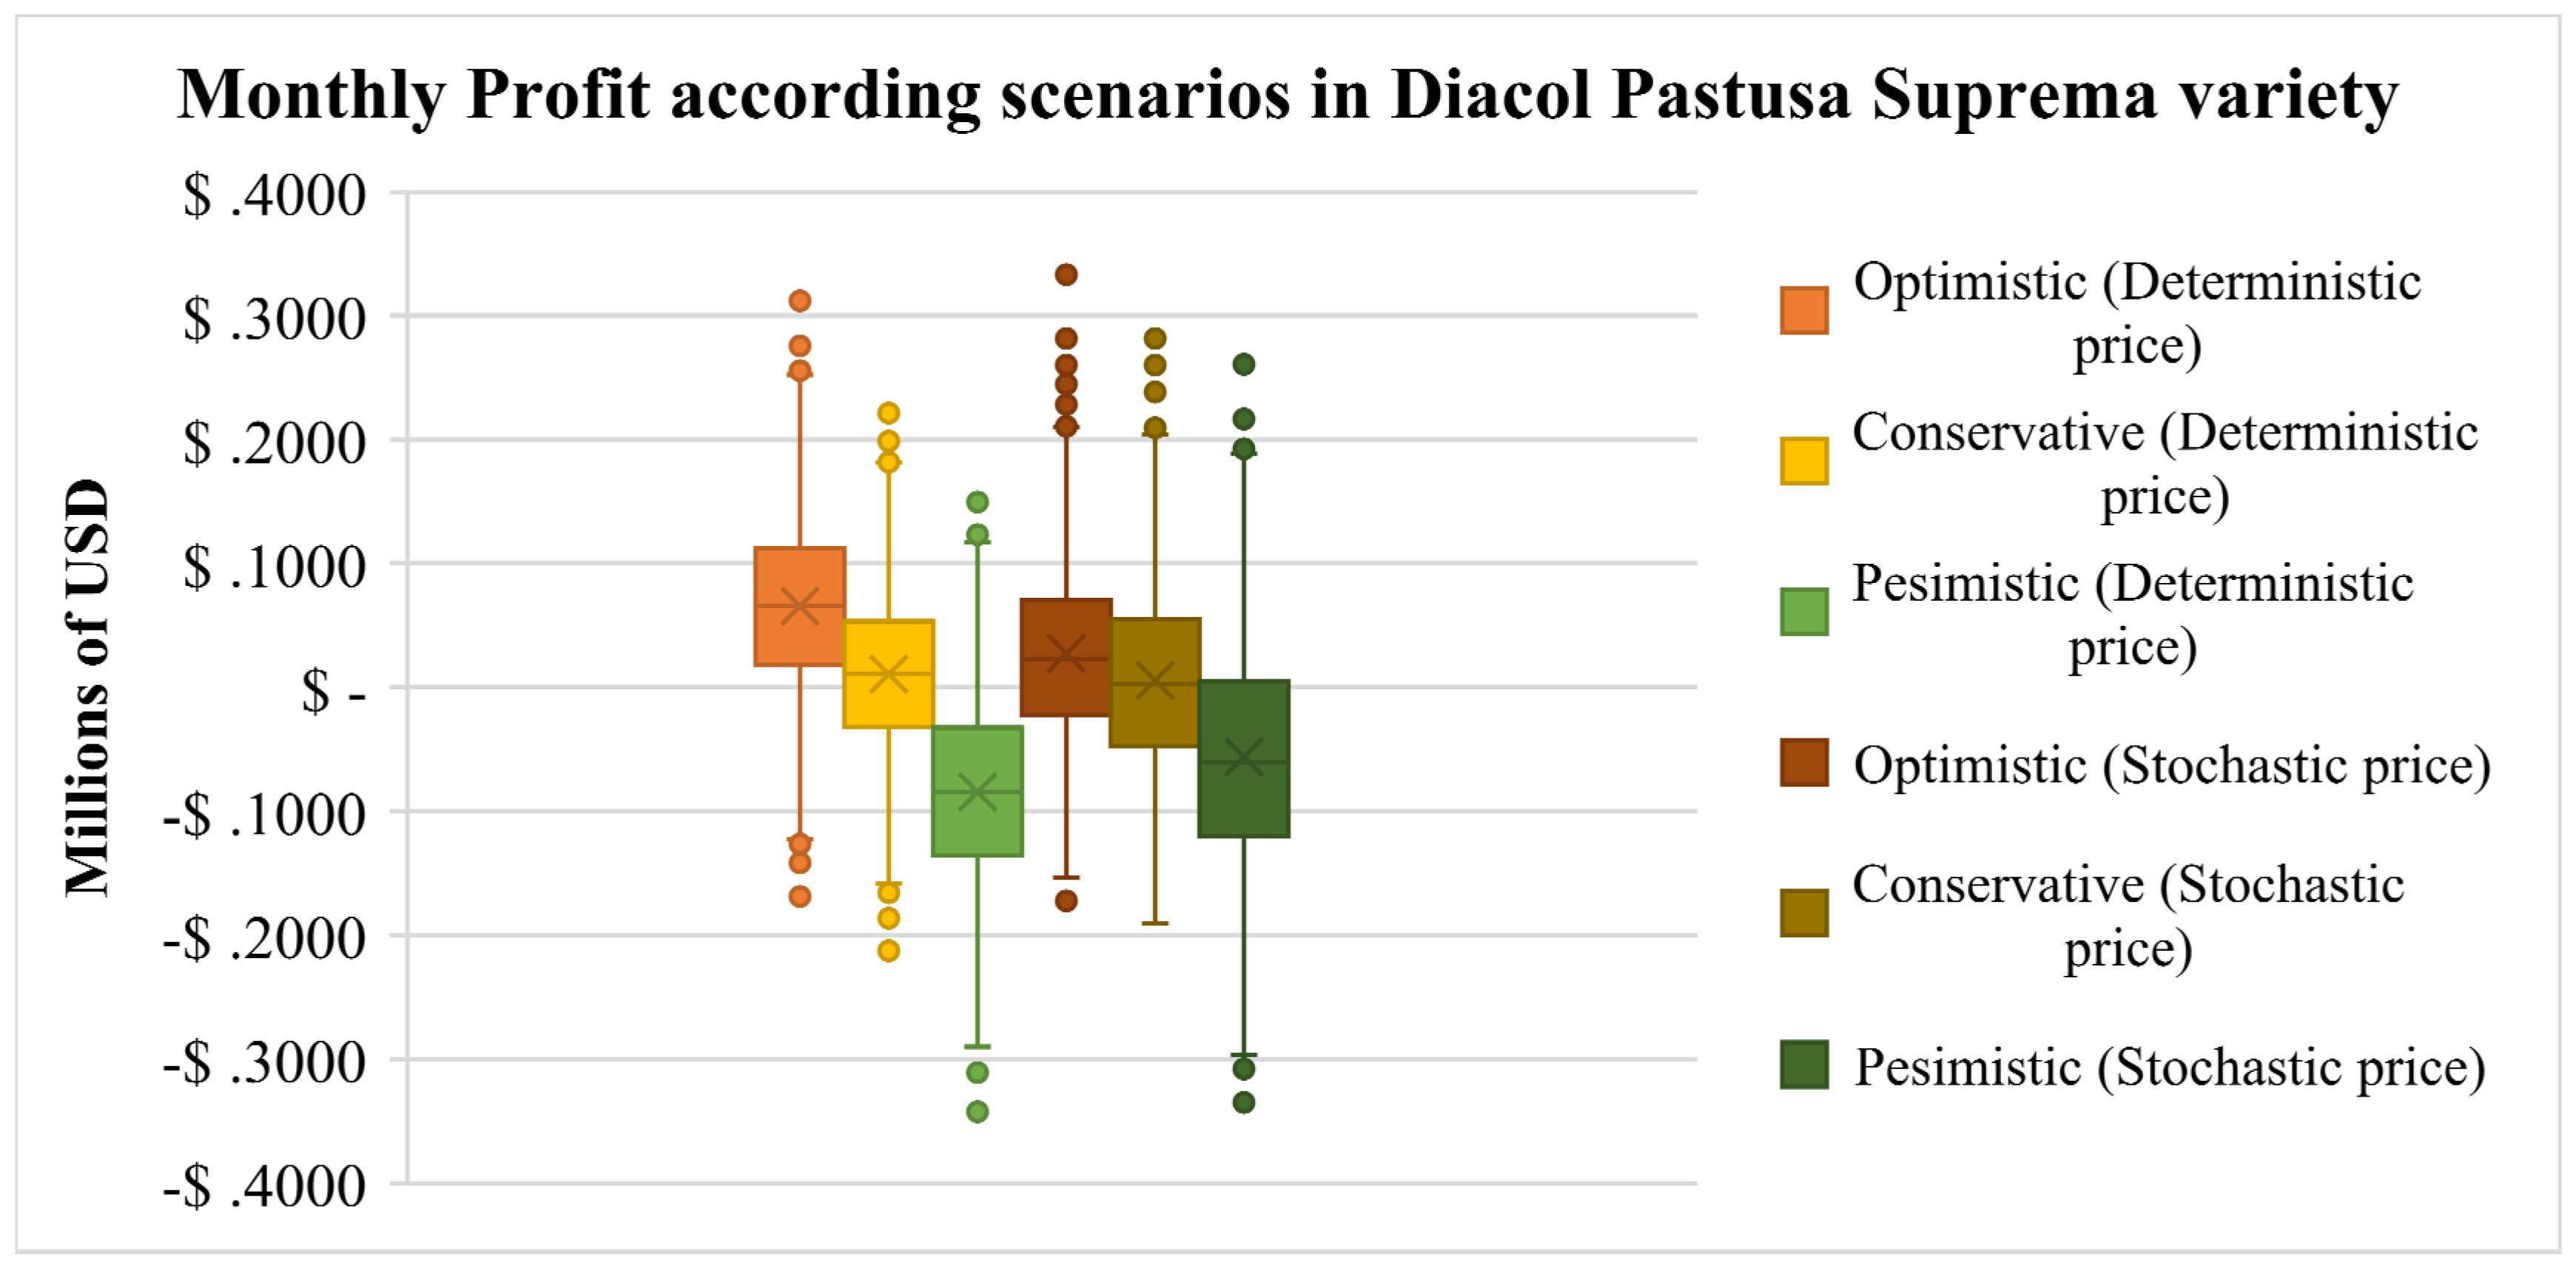
The simulation process was conducted using Monte Carlo simulation [58], and the inverse transform method was applied to generate random variables [59]. Box plots of expected monthly profit in millions of USD are presented in Figure 5, Figure 6 and Figure 7, corresponding to the inventory level that theoretically maximizes profitability I = F 1 p c p v , across different scenarios and potato varieties. Statistical tests were performed to verify normality, homogeneity of variances, and independence of the simulated data. ANOVA (analysis of variance) was subsequently conducted, yielding a p-value of 5.7 × 10 231 , indicating statistically significant differences between the groups. The box plots for the three varieties show that, in most scenarios, the median and interquartile range (50% of the data) are close to zero. Expected profitability is observed only in optimistic scenarios where the price conditions are favorable. The Diacol Capiro and Pastusa Suprema varieties exhibit greater variability in profitability across scenarios, reflecting higher price deviations compared to the Criolla variety. Additionally, these varieties generally yield more tons per hectare. However, they are also more susceptible to diseases and climatic variations that can negatively affect the crop.

5.3. Machine Learning Model

A machine learning model was developed in Python 2 using the open-source Jupyter Notebook® 7.1 environment to calculate the optimal monthly inventory level in the newsvendor model (NVM). This model determines the optimal tons of potato variety to be produced monthly in Boyacá, with the goal of maximizing profitability. The model incorporates overproduction and shortage costs to optimize output. Variables affecting potato demand, such as weather, prices, seasonality, and other external factors, were simulated by generating 1000 random samples. Demand, modeled as a normal distribution based on the goodness-of-fit test results previously presented, combines these variables with added noise to reflect real-world variability. Data is split with 80% for training and 20% for testing using the train_test_split function from the scikit-learn library, an open-source Python library often used for machine learning [60]. The machine learning component was implemented using a linear regression algorithm, selected for its interpretability and suitability for modeling continuous variables (i.e., demand). This choice aligns with the goal of providing a transparent and explainable decision-support tool for agricultural stakeholders. While more complex algorithms could be considered, the use of linear regression ensures that the model remains accessible and avoids the opacity often associated with black-box approaches. Profitability calculations incorporate revenue, production costs, and additional overproduction or shortage costs, allowing for monthly net profit estimates in millions of dollars. Finally, a five-year simulation is conducted to estimate the expected cumulative profit over 60 months, with a 95% confidence interval for the monthly inventory level that maximizes profit. The model was executed100 times through a simulation loop, generating new random data at each run. Forecasting accuracy was evaluated by comparing predicted demand against historical data distributions, and the results showed low variance and stable performance across runs. This approach captures the variability in the system and provides a more accurate view of the optimal expected quantities and benefits over the five years.
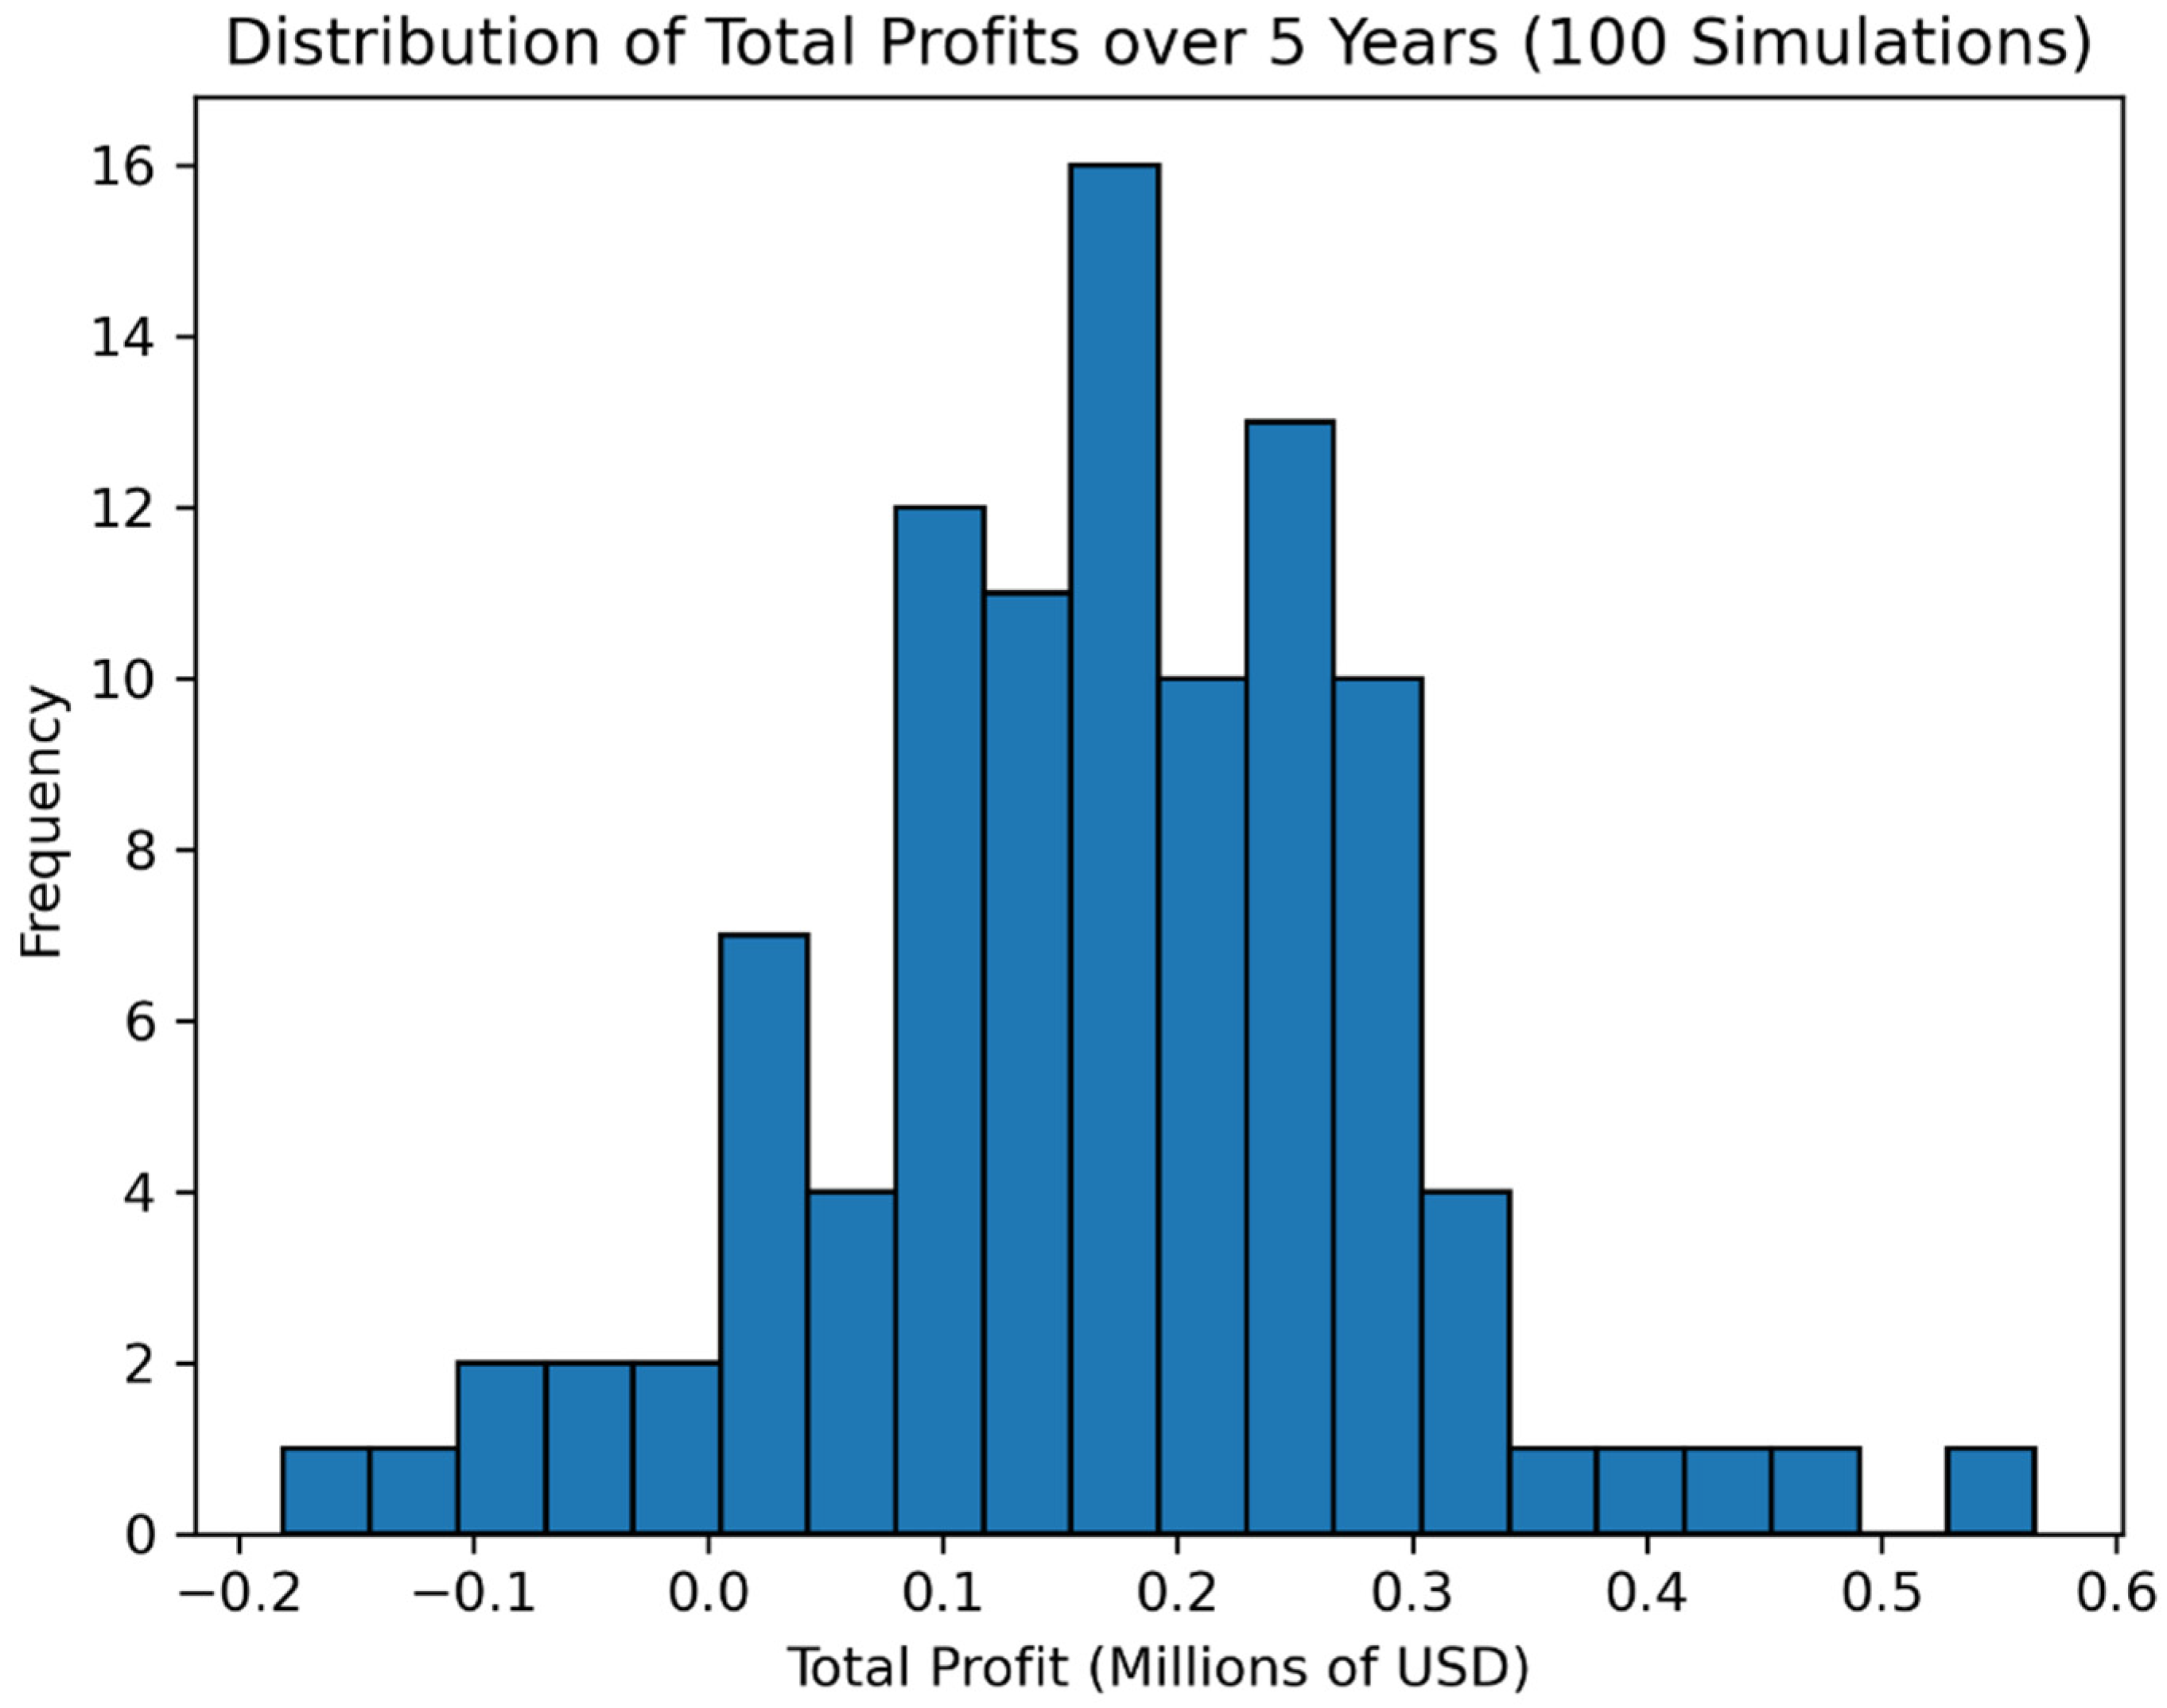
The key results from the machine learning model are presented in Table 9. Total profit (or loss), in million USD, over the five-year period is reported, along with the optimal monthly inventory quantity (in tons) and a 95% confidence interval for optimal monthly inventory (in tons). From the three varieties under study in this paper, the Diacol Capiro variety and Pastusa Suprema variety obtained an average loss of, respectively, USD 1.05 million and USD 1.55 million, while the Criolla variety achieved an average total profit of USD 0.17 million over the 5 years (based on 100 simulations), with an average optimal inventory quantity of 49.56 tons. A 95% confidence interval was also computed for the optimal monthly inventory quantity, ranging between 49.1 and 50.1 tons. The profit histogram in Figure 8 shows that the model exhibits low variability, indicating consistent result predictions.

5.4. Validation and Reliability

To ensure the validity and reliability of the results, several statistical tests were conducted, as previously noted. In particular, in the Monte Carlo simulation process (Section 5.2), normality, homogeneity of variances, and independence of the simulated data were verified, followed by an ANOVA test that confirmed statistically significant differences between scenarios ( 5.7 × 10 231 ). For the machine learning model (Section 5.3), an 80/20 train–test split was applied to validate predictive performance, and the model was executed 100 times through a simulation loop to capture variability. A 95% confidence interval was computed for the optimal monthly inventory quantity, and the resulting profit histogram exhibited low dispersion, indicating consistent and robust predictions. These procedures confirm the reliability of the proposed framework and reinforce the credibility of the findings.

6. Discussion and Insights on Policy-Making

This study proposed an approach to address how the integration of the newsvendor model, Monte Carlo simulation, and machine learning can optimize inventory decisions and improve profitability for smallholder potato farmers under uncertain demand and price conditions, with a particular focus on the department of Boyacá, Colombia. The results demonstrate that this hybrid approach enables more accurate inventory planning, reduces waste, and supports sustainable practices. The implementation of the newsvendor model in Boyacá’s potato supply chain provided a concrete method for managing uncertainty in prices and demand (a common challenge for local producers in the region). Unlike traditional methods, the integration of Monte Carlo simulation and machine learning offers flexibility to adjust decisions on a monthly basis, considering climate events and market fluctuations observed in recent years. For instance, during the years 2022 and 2023, the prices for the Criolla Colombia potato variety showed peaks that cannot be explained solely by seasonality but rather by logistics and supply issues. The ability of the proposed model to anticipate these changes, based on historical data and simulations, does represent a significant improvement over empirical management practice. Recent works in the literature (see, for example, [61]) support the need for analytical tools tailored to local contexts. Our results also suggest that adopting digital technologies, such as traceability platforms, could complement decision-making and strengthen sectoral resilience [62].
The proposed hybrid approach combines three complementary methods to address uncertainty in inventory decisions. Specifically, the newsvendor model provides a mathematical basis for identifying optimal inventory levels, Monte Carlo simulation captures variability in demand and price through probabilistic scenarios, and machine learning refines predictions by learning from historical data patterns. These elements work together to produce results that are both analytically sound and practically relevant. The discussion that follows connects these findings to the research objectives and explores their implications for supply chain decision-making.
As illustrated by the figures that follow, potatoes play a vital role in the global food system, not only in Colombia. Indeed, in the United States, the potato industry is a major economic driver, contributing over USD 100 billion and supporting hundreds of thousands of jobs, as reported by the National Potato Council [63], while in Europe in 2023, the potato sector contributed approximately EUR 19.4 billion to the EU’s agricultural output, representing 3.8% of the total value [64,65]. In Colombia, potato production reached about 2.57 million tons last year, making it a cornerstone crop, especially in the Andean region where it supports both small-scale and commercial farmers [66]. These figures highlight why improving supply chain management is essential, not only to boost profits but also to ensure long-term sustainability for growers.
In addition, the economic significance of the potato sector underscores the need for targeted policies that support its sustainability and growth. The substantial contributions of the potato industry to national economies, as highlighted by various reports, indicate the potential for impactful policy interventions. For example, policies aimed at improving supply chain flexibility and responsiveness can help mitigate the adverse effects of market disruptions [67]. Furthermore, policies that encourage collaboration between farmers, distributors, and technology providers can facilitate the adoption of innovative practices, thereby enhancing the overall efficiency of the supply chain. These measures can ensure that the potato sector remains robust and capable of contributing to food security and economic stability [68].
The findings from this research offer practical guidance for policy-makers wanting to improve the resilience and efficiency of the potato supply chain. The use of the newsvendor model provided a better understanding about how unpredictable demand and price can affect producers. The use of advanced inventory management tools and machine learning techniques could support both farmers and distributors to make better decisions, cut down on waste, and improve profitability [67]. In parallel, the incentives from the government for the use of digital technologies to track supply chain data can build trust and transparency among the different actors of the supply chain [68].
In addition, the economic importance of the potato sector puts in evidence that targeted policies are needed to support its long-term sustainability and growth. Reports from different regions show how much the industry contributes to national economies, suggesting that well-designed policies could have a real impact. For example, policies that make the supply chain more flexible and responsive can help mitigate sudden market changes [67]. It is also important to encourage collaboration between farmers, distributors, and technology providers, as this can speed up the adoption of new practices to improve supply chain efficiency [69]. On another point, while the model identifies profitability differences among potato varieties, the recommendations must be considered alongside practical constraints faced by smallholder farmers, not only for the case study in Boyacá, Colombia but also with a more general view when scalable to other countries or regions. The academic literature has witnessed these issues already (see for example [70,71,72,73]). Switching from one variety to another often involves costs related to seed acquisition, agronomic adaptation, and changes in cultivation practices, which may not be feasible for farmers with limited resources. Additionally, cultural preferences and traditional knowledge play a central role in variety selection. Studies in Boyacá have shown that native varieties, particularly the Criolla types, are deeply embedded in local food traditions and valued for their taste, cooking properties, and ritual uses. Market acceptance also varies by region, and consumer demand often favors familiar varieties over new ones, even if the latter offer higher yields or nutritional benefits. These factors can limit the immediate adoption of model-driven recommendations. Therefore, complementary support measures (e.g., training programs, financial incentives, targeted market development) are essential to facilitate transitions toward more profitable and sustainable production strategies.
It is important to note, however, that this study has also some limitations. On one hand, the analysis relies on historical data from a specific region and crop, which may limit the generalization of the findings to other contexts or agricultural products. Despite this, the approach is indeed scalable. On the other hand, the employed simulation and machine learning models do depend on the quality and completeness of available data (as is the case of any machine learning method); so, gaps in data or data inaccuracies could affect predictive performance. Finally, some factors were not explicitly modeled in this study, like policy changes, climate events, or market disruptions, and they could influence real-world outcomes. Broader datasets, additional variables, and real-time data integration should be considered in future studies to validate and extend the proposed approach.
From a policy-making perspective, our findings can offer practical guidance for agricultural planners, supply chain managers, and even governments. The proposed framework can help shape inventory strategies that account for seasonal demand changes and market volatility. This is of special interest in regions where smallholder farmers dominate production. By combining predictive analytics with simulation, decision-makers can make more informed choices about resource allocation, procurement planning, and reducing post-harvest losses. In addition, the model can support the design of targeted programs, such as seed distribution, subsidies, or investment in infrastructure (better land transportation networks, cold storage facilities, digital supply chain platforms), by identifying which crop varieties and inventory levels are most likely to deliver better economic development in terms of both financial outputs and social wellbeing.

7. Conclusions and Perspectives

This paper presented a case study of the potato supply chain in Boyacá, Colombia, aimed at addressing the challenges of inventory optimization. The goal particularly focused on supporting smallholder farmers. We developed a data-driven framework that integrates the newsvendor model, Monte Carlo simulation, and machine learning techniques to manage stochasticity and uncertainty in demand and prices. The experience gained in this study demonstrates that combining mathematical modeling approaches with simulation techniques can transform inventory management in agricultural supply chains. This approach not only aligns with sustainable agri-food practices but also emphasizes the importance of integrating digital technologies to enhance transparency and efficiency within the supply chain. The results, especially for the Criolla Colombia variety, show that it is possible to identify optimal inventory levels that minimize losses and stabilize income, even in highly volatile scenarios. It is important to note that this approach, far from being a universal solution, must be adapted to the specific characteristics of each region and crop. In the Colombian case, the availability of historical data and collaboration with organizations like the Colombian Federation of Potato Producers (FEDEPAPA) were essential for validating the model.
In this context, it is important to recall that the main contribution of this study lies the integration of three analytical techniques to address inventory optimization under uncertainty in the potato supply chain: the newsvendor model, Monte Carlo simulation, and machine learning. The combination of these methods provides a practical decision-support tool for smallholder farmers.
For future research, it would be relevant to explore the impact of additional variables, such as access to credit, logistics infrastructure, and the adoption of emerging technologies (IoT, blockchain), to support decision-making. Investigating the effects of climate change on potato production and supply chain dynamics could offer valuable insights for developing adaptive strategies. Considering the proposed hybrid approach, future studies could improve it by exploring advanced extensions of these methods, such as multi-period newsvendor models, deep learning algorithms for demand forecasting, or hybrid simulation–optimization frameworks. These extensions may lead to improvements in the scalability of inventory management solutions in agri-food supply chains. In addition, examining the socio-economic implications of adopting advanced inventory management systems in small-scale farming operations could help tailor solutions to diverse agricultural contexts. This, in turn, could foster stronger collaboration between academia, the productive sector, and government to scale these tools, to promote sustainable practices, and to support policy-making for the agricultural sector.

Author Contributions

Conceptualization, D.M.R. and J.R.M.-T.; methodology, D.M.R. and J.R.M.-T.; software, D.M.R. and D.M.A.V.; validation, J.R.M.-T. and D.M.R.; formal analysis, D.M.R., D.M.A.V., and J.R.M.-T.; investigation, D.M.R.; resources, D.M.R., J.R.M.-T., and D.M.A.V.; data curation, D.M.R. and D.M.A.V.; writing—original draft preparation, D.M.R.; writing—review and editing, J.R.M.-T.; visualization, J.R.M.-T.; supervision, J.R.M.-T.; project administration, J.R.M.-T.; funding acquisition, J.R.M.-T. All authors have read and agreed to the published version of the manuscript.

Funding

This research was funded by Universidad de La Sabana Colombia, grant number INGPHD-69-2024, and by Ecole de technologie supérieure, grant FIR-INODISC, grant number 009284. The APC was funded by Universidad Santo Tomás seccional Tunja, Boyacá.

Institutional Review Board Statement

Not applicable.

Informed Consent Statement

Not applicable.

Data Availability Statement

The original contributions presented in this study are included in the article. Further inquiries can be directed to the corresponding author.

Conflicts of Interest

The authors declare no conflicts of interest.

Appendix A

Figure A1. Historical prices per kg in COP according to variety (source: [54]).
Logistics 09 00164 g0a1
Figure A2. Historical prices per kg in USD according to variety (source: [54]).
Logistics 09 00164 g0a2
Figure A3. Exchange rate of COP/USD per year (source: www.superfinanciera.gov.co, accessed on 11 October 2024).
Logistics 09 00164 g0a3

References

  1. Larson, P.D.; Rogers, D.S. Supply Chain Management: Definition, Growth and Approaches. J. Mark. Theory Pract. 1998, 6, 1–5. [Google Scholar] [CrossRef]
  2. Gibson, B.J.; Hanna, J.B.; Defee, C.C.; Chen, H. The Definitive Guide to Integrated Supply Chain Management: Optimize the Interaction between Supply Chain Processes, Tools, and Technologies; Part of the Council of Supply Chain Management Professionals Series; Pearson FT Press: Saddle River, NJ, USA, 2013. [Google Scholar]
  3. Richey, R.G.; Roath, A.S.; Adams, F.G.; Wieland, A. A Responsiveness View of Logistics and Supply Chain Management. J. Bus. Logist. 2022, 43, 62–91. [Google Scholar] [CrossRef]
  4. Ribeiro, J.; Barbosa-Povoa, A. Supply Chain Resilience: Definitions and Quantitative Modelling Approaches—a literature review. Comput. Ind. Eng. 2018, 115, 109–122. [Google Scholar] [CrossRef]
  5. Barbosa-Póvoa, A.P.; da Silva, C.; Carvalho, A. Opportunities and challenges in sustainable supply chain: An operations research perspective. Eur. J. Oper. Res. 2018, 268, 399–431. [Google Scholar] [CrossRef]
  6. Moreno-Camacho, C.A.; Montoya-Torres, J.R.; Jaegler, A.; Gondran, N. Sustainability metrics for real case applications of the supply chain network design problem: A systematic literature review. J. Clean. Prod. 2019, 231, 600–618. [Google Scholar] [CrossRef]
  7. Niggli, U.; Schmid, H.; Fliessbach, A. Organic Farming and Climate Change. International Trade Centre (ITC), Geneva, Switzerland. 2008. Available online: https://www.intracen.org (accessed on 11 August 2025).
  8. Mijena, G.M.; Gedebo, A.; Beshir, H.M.; Haile, A. Ensuring food security of smallholder farmers through improving productivity and nutrition of potato. J. Agric. Food Res. 2022, 10, 100400. [Google Scholar] [CrossRef]
  9. EPA. Global Greenhouse Gas Emissions Data, United States Environmental Protection Agency. 2022. Available online: https://www.epa.gov/ghgemissions/global-greenhouse-gas-emissions-data (accessed on 11 August 2025).
  10. FAO. The State of Agricultural Commodity Markets 2020. Agricultural Markets and Sustainable Development: Global Value Chains, Smallholder Farmers and Digital Innovations; FAO: Rome, Italy, 2020. [Google Scholar] [CrossRef]
  11. FAO. Brief to The State of Food Security and Nutrition in the World 2020. In Transforming Food Systems for Affordable Healthy Diets; Food and Agriculture Organization of the United Nations: Rome, Italy, 2020. [Google Scholar] [CrossRef]
  12. FAO. Economic Dimensions of Agriculture. In Statistical Yearbook 2021; Food and Agriculture Organization of the United Nations, FAO Statistics: Rome, Italy, 2021; pp. 2–7. [Google Scholar]
  13. Gharye Mirzaei, M.; Gholami, S.; Rahmani, D. A mathematical model for the optimization of agricultural supply chain under uncertain environmental and financial conditions: The case study of fresh date fruit. Environ. Dev. Sustain. 2024, 26, 20807–20840. [Google Scholar] [CrossRef]
  14. Cozzolino, D. The contribution of digital and sensing technologies and big data towards sustainable food supply and value chains. Sustain. Food Technol. 2025, 3, 181–187. [Google Scholar] [CrossRef]
  15. Kazaz, B.; Webster, S. Technical Note—Price-Setting Newsvendor Problems with Uncertain Supply and Risk Aversion. Oper. Res. 2015, 63, 751–978. [Google Scholar] [CrossRef]
  16. Violi, A.; Laganá, D.; Paradiso, R. The inventory routing problem under uncertainty with perishable products: An application in the agri-food supply chain. Soft Comput. 2019, 24, 13725–13740. [Google Scholar] [CrossRef]
  17. Oroojlooy, A.; Snyder, L.; Takác, M. Applying Deep Learning to the Newsvendor Problem; COR@L Technical Report 17T-004; Department of Industrial and Systems Engineering, Lehigh University: Bethlehem, PA, USA. Available online: https://engineering.lehigh.edu/sites/engineering.lehigh.edu/files/_DEPARTMENTS/ise/pdf/tech-papers/17/17T_004_0.pdf (accessed on 11 August 2025).
  18. Allal, L.G.; Bennekrouf, M.; Bettayeb, B.; Sahnoun, M. Improving the Potato Supply Chain in Western Algeria: An Optimization Model. In Proceedings of the 2024 International Conference of the African Federation of Operational Research Societies, Université de Tlemcen, Tlemcen, Algeria, 3–5 November 2024; Available online: https://hal.science/hal-04982106/document (accessed on 11 August 2025).
  19. Allal, L.G.; Bennekrouf, M.; Bettayeb, B.; Sahnoun, M. Technologies and strategies for optimizing the potato supply chain: A systematic literature review and some ideas for application in the Algerian context. Comput. Electron. Agric. 2025, 234, 110171. [Google Scholar] [CrossRef]
  20. Kalimuthu, T.; Kalpana, P.; Kuppusamy, S.; Sreedharan, V.R. Intelligent decision-making framework for agriculture supply chain in emerging economies: Research opportunities and challenges. Comput. Electron. Agric. 2024, 219, 108766. [Google Scholar] [CrossRef]
  21. Edgeworth, F. The mathematical theory of banking. J. R. Stat. Soc. 1888, 51, 113–127. [Google Scholar]
  22. Whitin, T.M. Inventory Control and Price Theory. Manag. Sci. 1955, 2, 61–68. [Google Scholar] [CrossRef]
  23. Mills, E.S. Uncertainty and price theory. Q. J. Econ. 1959, 73, 116–130. [Google Scholar] [CrossRef]
  24. Mills, E.S. Price, Output and Inventory Policy; John Wiley: New York, NY, USA, 1962. [Google Scholar]
  25. Petruzzi, N.C.; Dada, M. Pricing and the Newsvendor Problem: A Review with Extensions. Oper. Res. 1999, 47, 183–194. [Google Scholar] [CrossRef]
  26. Dolgui, A.; Proth, J.-M. Supply Chain Engineering: Useful Methods and Techniques; Springer: Berlin/Heidelberg, Germany, 2010. [Google Scholar]
  27. Porteus, E.L. The Newsvendor Problem. In Building Intuition; Chhajed, D., Lowe, T.J., Eds.; International Series in Operations Research & Management Science; Springer: Boston, MA, USA, 2008; Volume 115. [Google Scholar]
  28. Muñoz Rojas, D.; Montoya-Torres, J.R. Multimodal logistics systems for agricultural development, a systematic review identifying the Latin American case. In Proceedings of the IISE Annual Conference and Expo 2024, Montreal, QC, Canada, 18–21 May 2024; Brown Greer, A., Contardo, C., Frayret, J.-M., Eds.; Institute of Industrial and Systems Engineers: Arlington, TX, USA, 2024; pp. 1–7. [Google Scholar] [CrossRef]
  29. Erlebacher, S.J. Optimal and heuristic solutions for the multi-item newsvendor problem with a single capacity constraint. Prod. Oper. Manag. 2000, 9, 303–318. [Google Scholar] [CrossRef]
  30. Jammernegg, W.; Kischka, P. The price-setting newsvendor with service and loss constraints. Omega 2013, 41, 326–335. [Google Scholar] [CrossRef]
  31. Wu, X.; Niederhoff, J.A. Fairness in Selling to the Newsvendor. Prod. Oper. Manag. 2014, 23, 2002–2022. [Google Scholar] [CrossRef]
  32. Chen, Y.; Xu, M.; Zhang, Z.C. Technical Note—A Risk-Averse Newsvendor Model Under the CVaR Criterion. Oper. Res. 2009, 57, 1040–1044. [Google Scholar] [CrossRef]
  33. Ma, L.; Zhao, Y.; Xue, W.; Cheng, T.C.E.; Yan, H. Loss-averse newsvendor model with two ordering opportunities and market information updating. Int. J. Prod. Econ. 2012, 140, 912–921. [Google Scholar] [CrossRef]
  34. Petruzzi, N.C.; Wee, K.E.; Dada, M. The Newsvendor Model with Consumer Search Costs. Prod. Oper. Manag. 2009, 18, 693–704. [Google Scholar] [CrossRef]
  35. Peng, L.; Lu, G.; Pang, K.; Yao, Q. Optimal farmer’s income from farm products sales on live streaming with random rewards: Case from China’s rural revitalisation strategy. Comput. Electron. Agric. 2021, 189, 106403. [Google Scholar] [CrossRef]
  36. Dutta, N.; Kaur, A. A socially responsible decision-making model for firms contracting with constrained farmers. Int. Trans. Oper. Res. 2023, 30, 2094–2121. [Google Scholar] [CrossRef]
  37. Fu, Z.; Sun, H.; Xu, C.; Yue, M. Downstream Information Sharing in Agricultural Supply Chains with Investment Spillovers. Decis. Anal. 2025, 22, 147–168. [Google Scholar] [CrossRef]
  38. Sharma, I.; Kaur, G.; Dey, B.K.; Majumder, A. Leveraging Blockchain and Consignment Contracts to Optimize Food Supply Chains Under Uncertainty. Appl. Sci. 2024, 14, 11735. [Google Scholar] [CrossRef]
  39. Pinçe, Ç.; Yücesan, E.; Bhaskara, P.G. Accurate response in agricultural supply chains. Omega 2021, 100, 102214. [Google Scholar] [CrossRef]
  40. Amaruchkul, K. Value of Image-based Yield Prediction: Multi-location Newsvendor Analysis. In Operations Research and Enterprise Systems; Parlier, G., Liberatore, F., Demange, M., Eds.; ICORES 2019; Communications in Computer and Information Science; Springer: Cham, Switzerland, 2020; Volume 1162. [Google Scholar] [CrossRef]
  41. Castañeda, J.A.; Brennan, M.; Goentzel, J. A behavioral investigation of supply chain contracts for a newsvendor problem in a developing economy. Int. J. Prod. Econ. 2019, 210, 72–83. [Google Scholar] [CrossRef]
  42. Wu, X.; Nie, L.; Xu, M.; Yan, F. A perishable food supply chain problem considering demand uncertainty and time deadline constraints: Modeling and application to a high-speed railway catering service. Transp. Res. Part E Logist. Transp. Rev. 2018, 111, 186–209. [Google Scholar] [CrossRef]
  43. Shaltayev, D.; Deniz, B.; Hasbrouck, R. Factors affecting a perishable supply chain’s transaction costs and service. Int. J. Appl. Manag. Sci. 2016, 8, 114–131. [Google Scholar] [CrossRef]
  44. Papier, F. Supply Allocation Under Sequential Advance Demand Information. Oper. Res. 2016, 64, 341–361. [Google Scholar] [CrossRef]
  45. Xu, F.; Baker, R.; Whitaker, T.; Luo, H.; Zhao, Y.; Stevenson, A.; Boesch, C.; Zhang, G. Review of good agricultural practices for smallholder maize farmers to minimise aflatoxin contamination. World Mycotoxin J. 2022, 15, 171–186. [Google Scholar] [CrossRef]
  46. Reader, J. Potato; Yale University Press: New Haven, CT, USA, 2009; ISBN 978-0300141092. [Google Scholar]
  47. Rodríguez, L.E. Origen y evolución de la papa cultivada—una revisión. Agron. Colomb. 2010, 28, 9–17. [Google Scholar]
  48. FAOSTAT. Crops and Livestock Products. Production Quantity and Yield of Potato. 2023. Available online: https://www.fao.org/faostat/en/#data/QCL (accessed on 11 August 2025).
  49. FEDEPAPA & FNFP. El Cultivo de la papa: Factores Que Influyen en la Productividad; Federación Colombiana de Productores de Papa—Fondo Nacional de Fomento de la papa: Bogotá, Colombia, 2023; Available online: https://repositorio.fedepapa.com/items/4a10c78c-4849-4aa7-a9d3-c9f9675fca69 (accessed on 11 August 2025).
  50. Ahmad, U.; Sharma, L. A review of Best Management Practices for potato crop using Precision Agricultural Technologies. Smart Agric. Technol. 2023, 4, 100220. [Google Scholar] [CrossRef]
  51. Ñústez López, C.E. Variedades Colombianas de Papa; Universidad Nacional de Colombia: Bogotá, Colombia, 2011. [Google Scholar]
  52. Bonilla Correa, C.R.; Pérez Gil, Y.M. Papa Criolla; Universidad Nacional de Colombia: Bogotá, Colombia, 2010. [Google Scholar]
  53. Guerrero-Guio, J.C.; Cabezas Gutiérrez, M.; Galvis Quintero, J.H. Efecto de dos sistemas de riego sobre la producción y uso eficiente del agua en el cultivo de papa variedad diacol capiro. Rev. De Investig. Agrar. Y Ambient. 2019, 11, 41–52. [Google Scholar] [CrossRef]
  54. FNFP. Observatorio del Consejo Nacional de la Papa. Cálculos de Sistemas de Información y Estudios Económicos Fedepapa-FNFP. 2023. Available online: https://fedepapa.com/home/wp-content/uploads/2024/09/INFORME-DE-GESTION-VIGENCIA-2023.pdf (accessed on 11 August 2025).
  55. Palacio, G. Desafíos y oportunidades para el subsector de la papa en 2023. In Proceedings of the XXIX Congreso de la Asociación Latinoamericana de la Papa, Puerto Varas, Chile, 28–31 March 2023. [Google Scholar]
  56. Ñústez López, C.E. Grupo de Investigación en papa. Universidad Nacional de Colombia. Obtenido de Facultad de Ciencias Agrarias. 2023. Available online: https://www.papaunc.com/catalogo/pastusa-suprema (accessed on 11 August 2025).
  57. FEDEPAPA. Fondo Nacional del fomento de la papa. In Boletín Regional Departamento de Boyacá: Volumen 6; Federación Colombiana de Productores de Papa: Bogotá, Colombia, 2022. [Google Scholar]
  58. Beaverstock, M.; Greenwood, A.; Nordgren, W. Applied Simulation: Modeling and Analysis Using FlexSim, 5th ed.; FlexSim Software Products, Inc.: Orem, UT, USA, 2017. [Google Scholar]
  59. Ross, S. Chapter 4—Generating Discrete Random Variables. In Simulation, 5th ed.; Ross, S., Ed.; Marquette University: Milwaukee, WI, USA, 2013; pp. 47–68. [Google Scholar] [CrossRef]
  60. Peña, A.; Alvarez, E.L.; Ayala Valderrama, D.M.; Palacio, C.; Bermudez, Y.; Paredes-Madrid, L. Usage of Machine Learning Techniques to Classify and Predict the Performance of Force Sensing Resistors. Sensors 2024, 24, 6592. [Google Scholar] [CrossRef]
  61. Devaux, A.; Goffart, J.P.; Kromann, P.; Andrade-Piedra, J.; Polar, V.; Hareau, G. The Potato of the Future: Opportunities and Challenges in Sustainable Agri-food Systems. Potato Res. 2021, 64, 681–720. [Google Scholar] [CrossRef] [PubMed]
  62. Jagtap, S.; Raut, R.; Dani, S. Advancing the digital frontier in agri-food supply chains. Int. J. Food Sci. Technol. 2024, 59, 3433–3435. [Google Scholar] [CrossRef]
  63. NPC. National Potato Council Releases Groundbreaking Report on U.S. Potato Industry’s Contribution to America’s Economy. 2023. Available online: https://www.nationalpotatocouncil.org/economic-impact-report/ (accessed on 21 March 2025).
  64. Europatat. The EU Potato Sector in 2022 & 2023. 2023. Available online: https://europatat.eu/activities/the-eu-potato-sector/ (accessed on 21 March 2025).
  65. Eurostat. The EU Potato Sector—Statistics on Production, Prices and Trade. 2024. Available online: https://ec.europa.eu/eurostat/statistics-explained/index.php?_prices_and_trade&oldid=646772 (accessed on 21 March 2025).
  66. PotatoPro. Colombia, Potato Market Statistics. 2025. Available online: https://www.potatopro.com/potato-markets/colombia (accessed on 21 March 2025).
  67. Lu, L.; Nguyen, R.; Rahman, M.M.; Winfree, J. Demand Shocks and Supply Chain Resilience: An Agent-Based Modelling Approach and Application to the Potato Supply Chain; NBER Working Paper Series Working Paper 29166; National Bureau of Economic Research: Cambridge, MA, USA, 2021; Available online: http://www.nber.org/papers/w29166 (accessed on 11 August 2025).
  68. Yakovleva, N.; Flynn, A. The Food Supply Chain and Innovation: A Case Study of Potatoes; Working Paper Series No. 15; Centre for Business Relationships, Accountability, Sustainability & Society: Cardiff, UK, 2004. [Google Scholar]
  69. Kufa, T.K. Potato Value Chain Analysis in the Case of Dugda Woreda, East shoazone, Oromia National Regional State of Ethiopia. Master’s Thesis, Addis Ababa University School of Commerce, Addis Ababa, Ethiopia, 2019. [Google Scholar]
  70. Mukami Kimathi, S.; Ingasia Ayuya, O.; Mutai, B. Adoption of climate-resilient potato varieties under partial population exposure and its determinants: Case of smallholder farmers in Meru County, Kenya. Cogent Food Agric. 2021, 7, 1860185. [Google Scholar] [CrossRef]
  71. Galvis-Tarazona, D.Y.; Ojeda-Pérez, Z.Z.; Arias-Moreno, D.M. Cultural and ethnobotanical legacy of native potatoes in Colombia. J. Ethnobiol. Ethnomed. 2022, 18, 59. [Google Scholar] [CrossRef] [PubMed]
  72. Muthoni Thuo, C.; Wambugu Maina, S. Strengthening smallholder farmers resiliency for improved sustainable productivity of Irish Potatoes in Kenya. World J. Adv. Res. Rev. 2024, 22, 512–520. [Google Scholar] [CrossRef]
  73. Bayiyana, I.; Juma Okello, J.; Lubega Mayanja, S.; Nakitto, M.; Namazzi, S.; Osaru, F.; Ojwang, S.; Mashisia Shikuku, K.; Lagerkvist, C.-J. Barriers and enablers of crop varietal replacement and adoption among smallholder farmers as influenced by gender: The case of sweetpotato in Katakwi district, Uganda. Front. Sustain. Food Syst. 2024, 8, 1333056. [Google Scholar] [CrossRef]
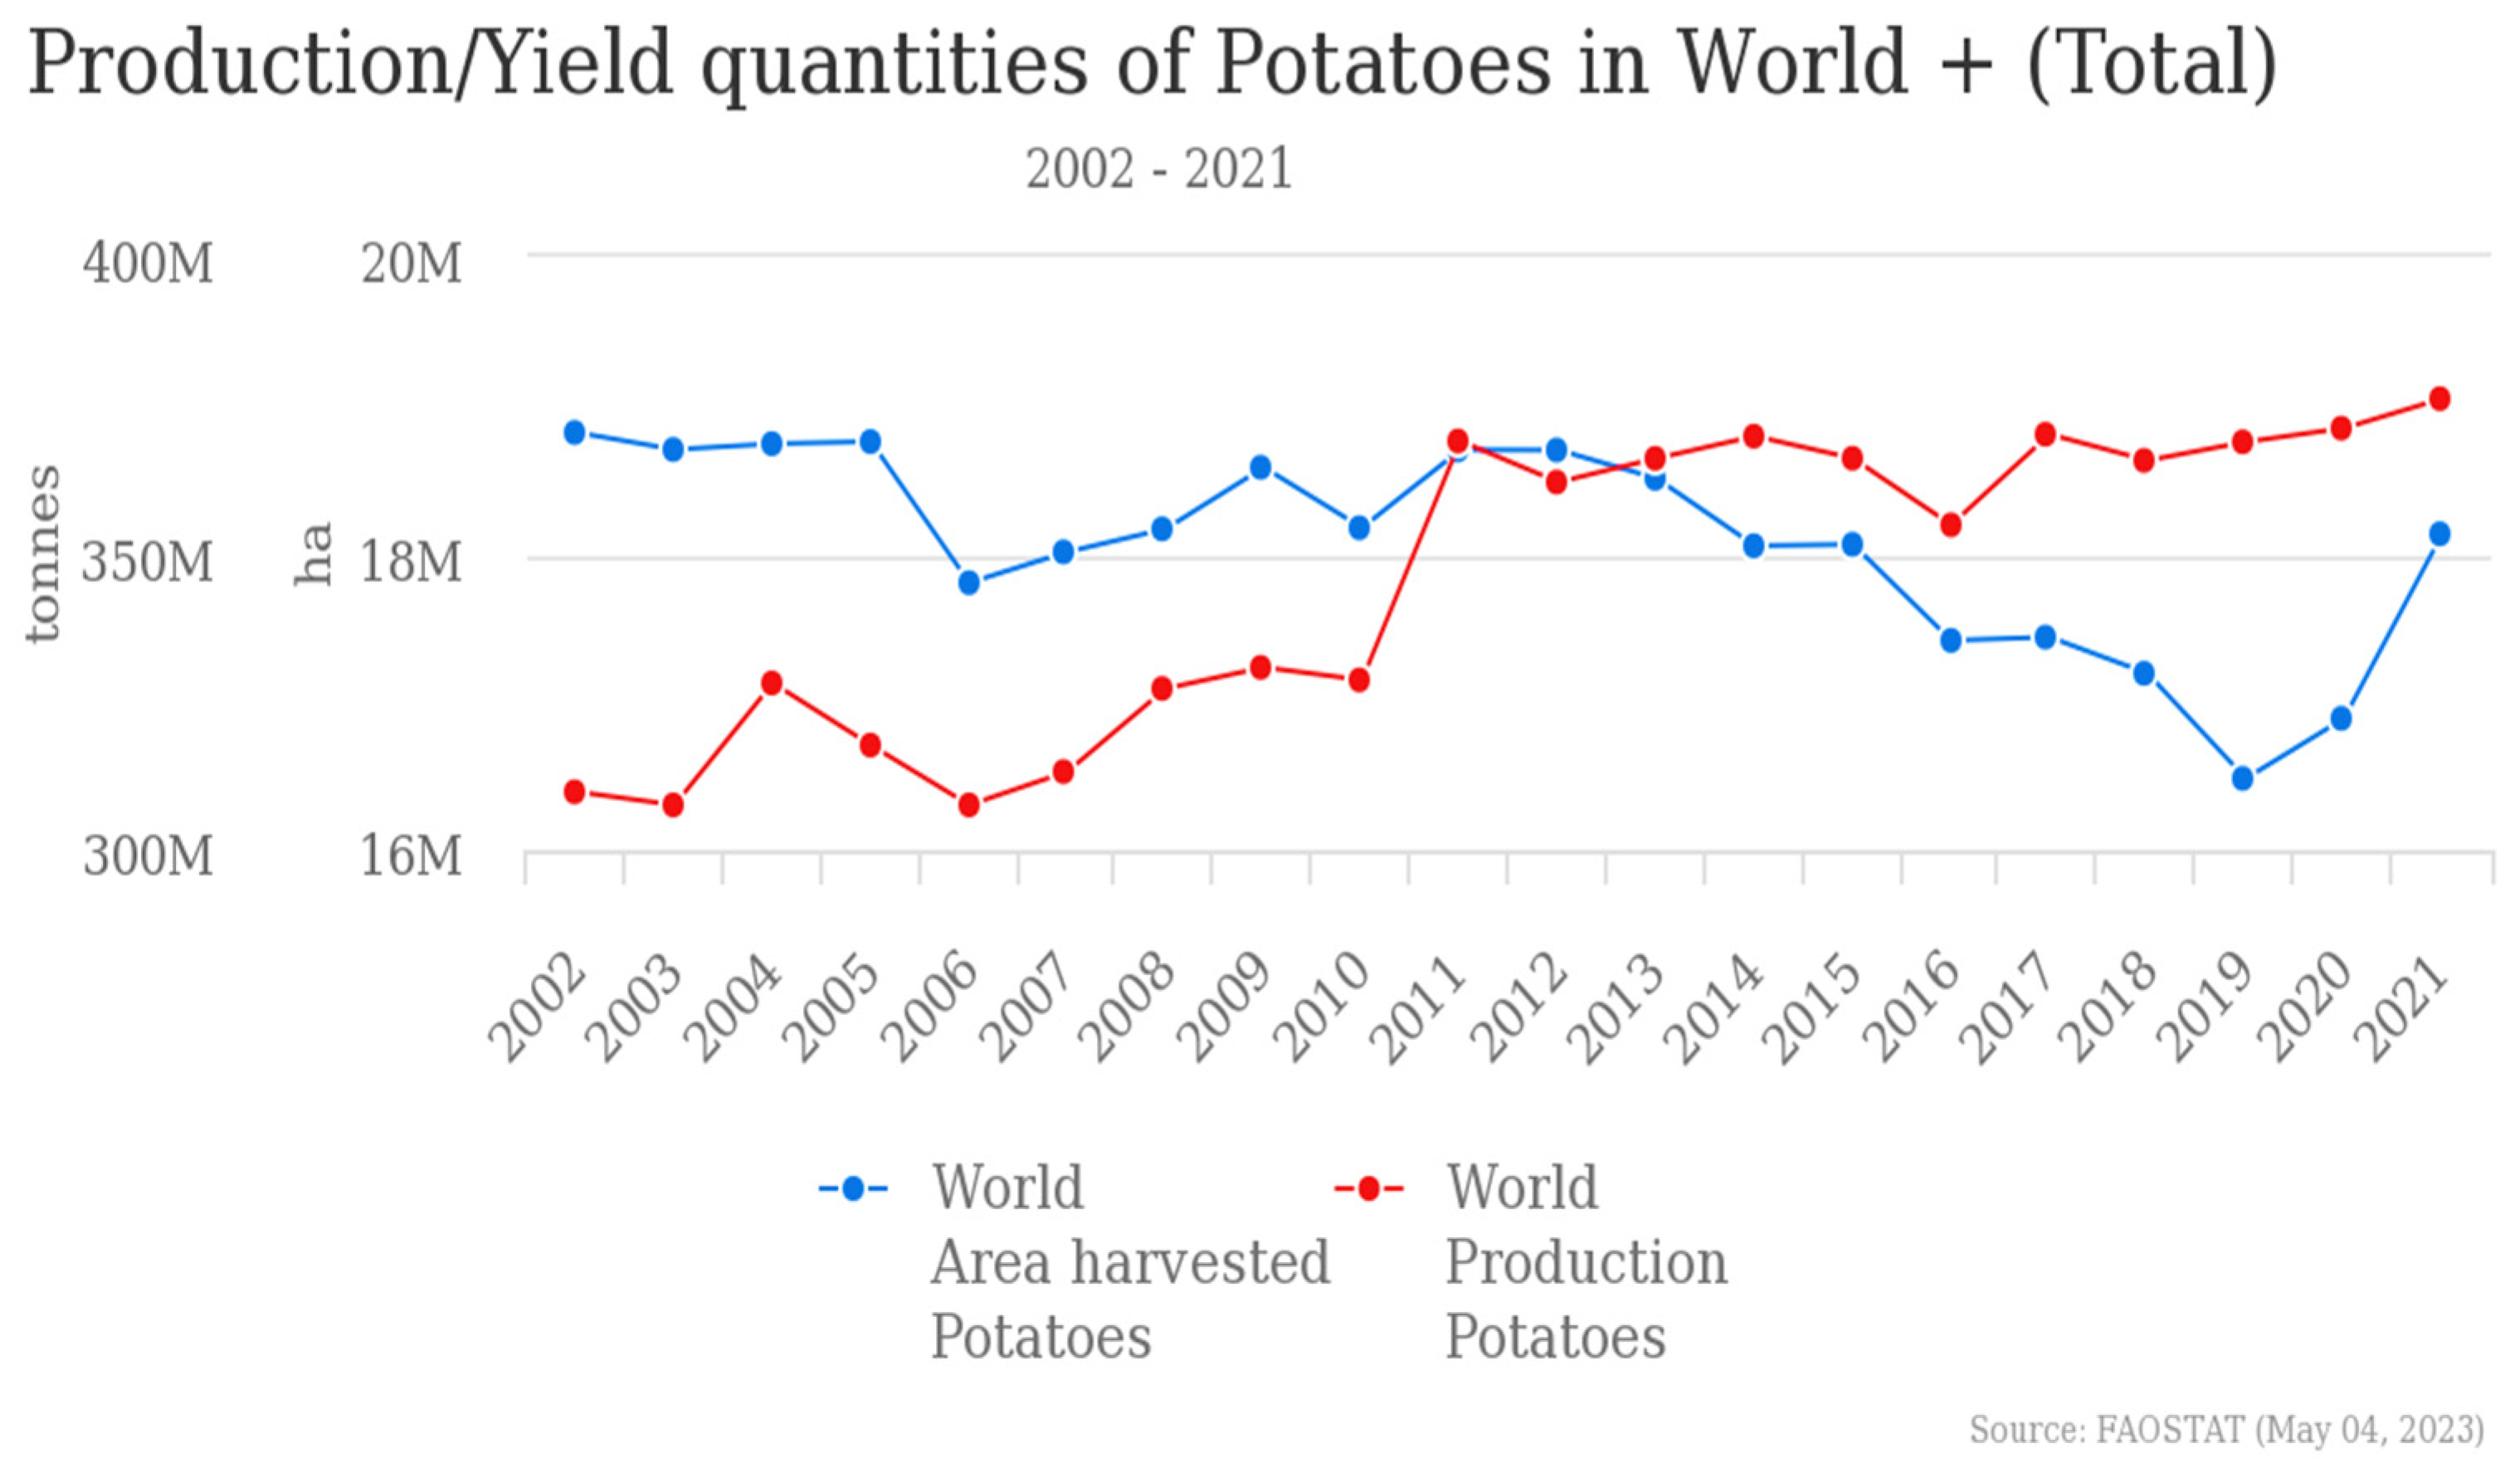
Figure 1. Historic world production and yield of potato crops (source: [48]).
Logistics 09 00164 g001
Figure 2. Overview of the solution approach.
Logistics 09 00164 g002
Figure 3. Distribution of price data by variety.
Logistics 09 00164 g003
Figure 4. Distribution of demand data by variety.
Logistics 09 00164 g004
Figure 5. Boxplot of monthly profit for Criolla variety.
Logistics 09 00164 g005
Figure 6. Boxplot of monthly profit for Diacol Capiro variety.
Logistics 09 00164 g006
Figure 7. Boxplot of monthly profit for Pastusa Suprema variety.
Logistics 09 00164 g007
Figure 8. Distribution of expected profit for 5-year period using machine learning model, Criolla Colombia variety.
Logistics 09 00164 g008
Table 1. Protocol used in this research.
ProtocolDescription
DatabaseScopus, Web-of-Science (WOS)
Search FieldTitle, Keywords, and Abstract, Especially Title
Query and resultsScopus: TITLE-ABS-KEY ((“newsvendor model” OR “newsvendor problem” OR “news-vendor model”) AND (“agrifood supply chain” OR “agri-food supply chain” OR “agricultural supply chain” OR “food supply chain” OR “perishable supply chain”)). Eight documents found from 2010 to 2025
Web-of-Science: TS = ((“newsvendor model” OR “newsvendor problem” OR “news-vendor model”) AND (“agrifood supply chain” OR “agri-food supply chain” OR “agricultural supply chain” OR “food supply chain” OR “perishable supply chain”)). Three documents found from 2016 to 2025.
Inclusion CriteriaDocument Type: Article OR Review; Language: English OR Spanish; Area of Knowledge: Engineering, Business, Management and Accounting, Decision Sciences, Agricultural and Biological Sciences
Exclusion CriteriaNot aligned with key words or research questions, written in a language distinct from English or Spanish, duplicates (the same articles found in different databases)
Table 2. Recent contributions of news vendor model in agri-food supply chains.
ReferenceMethodologyTopic Focus and Remarks
[37]Game-theoretic modeling and equilibrium analysisCoordination between distributors and farming cooperatives in agribusiness supply chain management, focusing on the incentives and mechanisms for sharing information about consumer preferences in the presence of quality improvement investment opportunities, with applications in perennial crops where demand forecasting and preference prediction are uncertain.
[38]Newsvendor-based mathematical model.Food supply chain management in perishable goods using blockchain technologies, examining the impact of blockchain implementation on the profitability of retailers and the overall food supply chain, managing uncertain demand and high perishability. The study investigates whether blockchain adoption and consignment contracts can together improve profitability and consumer trust. Applied to blockchain for traceability, reducing costs and fraud risks, guiding contract design and risk sharing between manufacturers and retailers.
[39]Multi-ordering news vendor model with Martingale Model of Forecast EvolutionAgribusiness and operations research models (newsvendor, MMFE) for production and forecasting decisions. The article explains how to exploit evolving forecasts to improve production decisions and profitability in agricultural supply chains with long lead times and high uncertainty. All for decision frameworks for seed manufacturers and broader agribusiness contexts, using MMFE-based multi-ordering strategies, clustering, and a quadrant matrix to guide production timing and resource allocation.
[40]Multi-location newsvendor model integrating machine learningAgricultural supply chain optimization, combining machine-learning-based image prediction with news vendor analysis. Quantifying the economic value of image-based yield predictions in reducing uncertainty and mismatches in agricultural supply chains. Its applications include improving yield forecasting accuracy, optimizing inventory and harvest allocation decisions, supporting farmers and cooperatives in strategic planning, and encouraging the adoption of precision agriculture technologies that leverage AI-driven remote sensing.
[41]Mixed-methods: qualitative field interviews and behavioral experiments (lab-based newsvendor tasks).This study explores behavioral operations in agricultural supply chains of developing economies, focusing on whether risk-sharing contracts (buyback, salvage) can reduce production and ordering risks under uncertainty. It shows how biases like anchoring and loss aversion shape decisions, with applications in African storage systems, guidance for NGOs and policy-makers, and extensions of behavioral contract theory to low-resource contexts.
[42]Variational inequality model that integrates a newsvendor frameworkStudy of perishable food supply chains and railway catering logistics, focusing on the optimization of meal distribution under uncertain demand, perishability, and strict delivery deadlines. Applies to high-speed rail catering operations. The authors design an Euler algorithm combined with an augmented Lagrangian dual approach, validated through sensitivity analyses.
[43]Newsvendor problem and simulation-based analysisTraditional models often overlook search and finding costs beyond basic ordering costs, despite their significant impact when supply is uncertain. The study investigates how transaction costs and service levels are affected in a perishable supply chain with multiple suppliers and retailers, managing agricultural and seafood supply chains, guiding sourcing strategies, and reducing procurement inefficiencies.
[44]Finite-horizon Markov Decision Process with a Martingale Model of Forecast Evolution (MMFE)How to allocate limited supply to sequentially opening markets under uncertainty using advance demand information (ADI) forecast updates received over time to improve allocation, reduce misallocation risks, and maximize profit. Its applications include the European seed industry, pharmaceuticals, or consumer products, showing how forecast updating can guide resource allocation and boost profitability.
[13]MILP optimization model with stochastic scenariosThe study is situated in agribusiness supply chain management and procurement planning, addressing the challenge of sourcing perishable products under uncertain supply and demand conditions. It employs a Mixed-Integer Linear Programming (MILP) model to optimize procurement decisions, incorporating stochastic demand scenarios and yield variability to capture uncertainty.
This articleNewsvendor problem using machine learning and Monte Carlo simulation-based analysisAgri-food supply chain management and sustainable agriculture, focusing on the optimization of potato inventory decisions in Boyacá, Colombia, under demand and price uncertainty. The core issue is how to reduce waste, stabilize farmer income, and improve profitability through a data-driven decision-making process. Its applications include providing decision-support for smallholder farmers and supply chain managers, identifying profitable potato varieties, and informing agricultural policy with potential scalability to other crops and regions.
Table 3. Description of study varieties: Diacol Capiro and Criolla Colombia (adapted from: (pp. 23 and 38, [51]) and (pp. 15–24, [52])).
AspectS. tuberosum L.
Diacol Capiro
Variety PAP-68-02
S. phureja Juz &Buk
Criolla Colombia
Variety PAP-05-39
S. tuberosum L.
Pastusa Suprema
Variety PAP-02-37
Morphological featuresMedium plant size, dark green foliage, medium flowering, and very little fruit formation.Diploid, medium plant size, slightly light green foliage, abundant flowering, and rare fruit formation.Large plant size, slightly light green foliage, moderate flowering, rare fruit formation, and high male sterility.
Agronomic characteristicsHighly adaptable since it is cultivated between 1800 and 3200 m above sea level (masl) and has a relatively late ripening (165 days at 2600 masl). Its yield potential under optimum growing conditions is over 40 tons per hectare (t/ha), and its resting period is 3 months at 15 °C and 75% relative humidity (RH).It is cultivated between 2400 and 3200 masl, with a cycle length of 120 days at 2600 masl, the yield potential under optimum growing conditions is between 15 and 25 t/ha, and there is no resting period.It is cultivated between 2500 and 3200 masl, with a cycle length of 165 days at 2600 masl, the yield potential under optimum growing conditions is over 45 tons per hectare (t/ha), and its resting period is 2 months at 15 °C and 75% relative humidity (RH).
QualityDry matter values between 20 and 23%, light cream flesh color and good response to fracture.Dry matter values between 21 and 23%, suitability for processing as precooked frozen and canned, excellent culinary quality for fresh consumption.Dry matter values between 21 and 23%, suitability for processing as precooked frozen and canned, excellent culinary quality for fresh consumption.
SusceptibilityPotato blight (Phytophthora infestans)
Wallroth (Spongospora subterranean)
Potato yellow vein virus (PYVV)
Potato blight (Phytophthora infestans)
Wallroth (Spongospora subterranean)
Potato yellow vein virus (PYVV)
Potato blight (Phytophthora infestans)
Wallroth (Spongospora subterranean)
Potato yellow vein virus (PYVV)
Water requirement400–700 mm [53].Average annual rainfall of 900 mm, of which 500 mm is required during the vegetative period.400–700 mm [53]
Table 4. Factors influencing potato growth and development.
FactorInfluence
PhotosynthesisMore than 90% of the dry weight accumulated by the potato plant is derived from the fixation and assimilation of CO2 and the process of photosynthesis through the canopy structure.
Leaf structureStomata are present on both sides of the leaf surface. Some varieties have low photosynthetic rates in the early stages of development; however, after tuberization, the CO2 assimilated by the leaves increases two to three times.
Light intensity and temperatureMaximum photosynthetic rates are found in the range of 15 to 25 °C, stomatal conductance peaks at 24 °C, and maximum photosynthetic values in potato are recorded between 9:00 am and 2:00 pm under Colombian conditions. Temperatures between 15 °C and 19 °C are optimal for tuber growth.
Tuber growthThe tuber functions as a dumping ground: the rate of net assimilation (photosynthesis) is controlled by the demand and the size of the tuber, having a maximum period at the flowering stage. Tuber growth is related to increases in the photosynthetic capacity of plant leaves.
Day lengthThis is one of the main factors regulating tuberization because the photoperiod influences tuber protein and starch synthesis. Andigena subspecies from the Andes of South America require short days for tuberization, while tuberosum subspecies varieties require long days.
Table 5. Definition of variables.
SymbolExplanation
News Vendor Model
Case StudyType in Case Study
yCrop yield.Crop yield in tons per hectare (t/ha).Deterministic
aCultivated area.Cultivated area in hectares (ha).Deterministic
cProduction cost (or purchasing cost) per item used to replenish the stock.Production cost in USD/ha.Deterministic
vSalvage value per item (price at which one item can be sold after a given death line).Salvage value in USD/t. This is the price at which each ton is sold when oversupplied.Deterministic
pSelling price of one item.Selling price of the grower in dollars per tons (USD/t).Stochastic
Table 6. Distribution fit and data summary of price by variety.
Distribution Fit and Data Summary of Price in COP/Kg According to Variety
VarietyDiacol CapiroCriolla ColombiaPastusa Suprema
Normal Distribution FitNormalNormalNormal
ExpressionNORM (1760, 702)NORM (2220, 906)NORM (1530, 583)
Best Distribution FitErlangErlangTriangular
Expression439 + ERLANG (439.3)421 + ERLANG (450.4)TRIA (384,952,3260)
Square Error0.0163650.0048510.002500
Number of Data Points 29494569689
Sample Mean176022201530
Sample Std Dev702906583
TestChi Square Test
Number of Intervals371822
Degrees of Freedom341520
Test Statistic373012,20050.6
Corresponding p-value<0.005<0.005<0.005
TestKolmogorov–Smirnov Test
Test Statistic0.3530.1450.0417
Corresponding p-value<0.01<0.01>0.15
Table 7. Distribution fit and data summary of demand by variety. Results from the Input Analyzer Rockwell Arena® Simulation software version 16.2.
Distribution Fit and Data Summary of Demand in Kg According to Variety
VarietyDiacol CapiroCriolla ColombiaPastusa Suprema
Best Distribution FitNormalNormalNormal
ExpressionNORM (9460, 4510)NORM (1620, 1860)NORM (8390, 3430)
Square Error0.0442580.1003650.022695
Number of Data Points 495024,04042,496
Sample Mean946016208390
Sample Std Dev451018603430
TestChi Square Test
Number of Intervals25924
Degrees of Freedom22621
Test Statistic341026501490
Corresponding p-value<0.005<0.005<0.005
Table 8. Scenarios for the simulation with price being fixed.
VariableCriolla Colombia VarietyDiacol Capiro VarietyPastusa Suprema Variety
Scenario: optimistic (O), conservative (C), or pessimistic (P)OCPOCPOCP
Yield (t/ha) 15127.5252012.5252012.5
Selling price (p) in USD/t732520308577412248495358222
Production cost in USD/t436545871332415664323404647
Table 9. Results from machine learning model.
ResultsCriolla VarietyDiacol Capiro VarietyPastusa Suprema Variety
Total profit or loss over 5 years (million USD)0.17−1.05−1.55
Optimal monthly inventory quantity (tons)49.56283.23250.68
95% confidence interval for optimal monthly inventory (tons)[49.1; 50.1][282.1; 284.4][249.8; 251.6]
Disclaimer/Publisher’s Note: The statements, opinions and data contained in all publications are solely those of the individual author(s) and contributor(s) and not of MDPI and/or the editor(s). MDPI and/or the editor(s) disclaim responsibility for any injury to people or property resulting from any ideas, methods, instructions or products referred to in the content.