1. Introduction
The exponential growth of e-commerce and increasing consumer expectations for rapid order fulfillment have placed unprecedented pressure on warehouse operations to achieve high levels of efficiency, accuracy, and throughput [
1]. In response, modern logistics facilities generally adopt one of two divergent paradigms: full automation of material handling or worker-centric augmentation. In the full automation paradigm, companies deploy autonomous systems such as forklifts, automated guided vehicles (AGVs), and automated storage and retrieval systems (AS/RSs) to handle goods without human intervention. These technologies can significantly enhance throughput and accuracy. However, they often require substantial upfront investment and extensive reorganization of warehouse infrastructure and operational processes. For small- and mid-sized facilities, the financial burden and operational rigidity of full automation are often prohibitive. Integrating autonomous equipment into existing workflows typically involves installing fixed infrastructure and reprogramming systems to accommodate layout changes [
2].
As a result, there is growing interest in more flexible, cost-effective alternatives that improve operational performance without requiring a complete overhaul. The Industry 4.0 revolution has introduced a spectrum of technologies aimed at augmenting human workers and improving efficiency without full automation. These include Internet of Things (IoT)-based asset tracking, wireless sensor networks (WSNs), and artificial intelligence (AI)-driven monitoring tools integrated into warehouse management systems [
3,
4,
5]. Many logistics operators now prefer this hybrid approach, integrating real-time digital tools with existing manual operations to achieve immediate productivity gains while preserving operational flexibility [
6].
Despite the promise of these solutions, several challenges remain. These challenges are not limited to the limitations of individual technologies but also extend to the system-level integration of these tools into existing warehouse operations. For instance, while many studies focus on developing high-accuracy object detection models for logistic environments [
7], they often lack practical guidance on how to interpret detection outputs into actionable data streams compatible with warehouse management systems. Furthermore, there is limited research on designing system architectures that can seamlessly integrate these technologies into current warehouse structures. Such requirements highlight the need for a comprehensive framework to guide the adoption and deployment of intelligent augmentation solutions.
1.1. Related Work
Within the worker-centric augmentation paradigm, several state-of-the-art solutions have emerged for real-time inventory monitoring and error reduction. One class of solutions uses radio-frequency identification (RFID) tags and real-time locating systems (RTLSs) [
4]; tagged forklifts, pallets, or bins are tracked via fixed sensors or antennas throughout the warehouse. While this approach reduces reliance on manual barcode scanning, RFID-based systems face scalability challenges; large-scale deployments demand extensive sensor infrastructure and precise calibration, which can result in substantial implementation costs [
3]. More advanced RTLS technologies, such as ultra-wideband (UWB) active tags, offer decimeter-level tracking accuracy. Nevertheless, they still require a dense network of anchors (typically spaced 10–15 m apart) and complex calibration procedures, introducing similar scalability and cost challenges [
8].
Another popular approach is the use of autonomous drones to perform stock counts. Drones equipped with scanners or cameras can fly through aisles to read pallet labels or scan inventory on racks. Academic and industry trials have shown that drones can detect misplaced or missing inventory with high accuracy, offering a safer alternative to manual cycle counts (e.g., eliminating the need for workers to climb ladders) [
9,
10]. However, drone-based inventory audits are typically carried out during downtime; for safety and regulatory reasons, drones operate during off-hours or in cordoned spaces rather than alongside workers in real time. They serve as a periodic corrective measure rather than for catching issues the moment they occur. In fact, indoor drones face strict safety constraints; confined warehouse spaces raise the risk of collisions with people or equipment, and studies have identified potential drone hazards in the case of malfunctions or crashes [
11]. A recent systematic review likewise highlights that drones in warehouses can create safety and noise concerns and even intimidate staff, underscoring the need for careful risk mitigation if deploying UAVs around human workers [
12]. These limitations, along with short battery life, mean that drones usually complement rather than fully replace manual checks.
A more continuous monitoring approach is the “scan-free” forklift tracking system, exemplified by solutions from companies like Intermodalics [
13], IdentPro [
14], Essensium [
15], BlooLoc [
16], and Logivations [
17]. These systems equip warehouse vehicles (e.g., forklifts or pallet trucks) with sensors—such as 3D LiDAR, cameras, or UWB transceivers—to automatically identify and locate pallets as they are moved, thereby eliminating manual barcode scans during every pick-up or drop-off. Most positioning systems use on-board cameras and AI on forklifts to achieve real-time pallet tracking with decimeter-level accuracy, limiting the need for external infrastructure or tags. Accuracy can be increased with additional 2D LiDAR scanners to reach ±10 cm accuracy. These platforms advertise “zero-scan” operations—once a pallet’s ID is captured at receiving, it is tracked automatically through the warehouse process, ensuring that no pallets are lost or misplaced. Such setups effectively turn the forklift into a mobile scanner that updates the inventory system whenever it transports a load. The advantage of this method is immediate, real-time error detection—if a pallet is misplaced or an order is loaded incorrectly, the system can flag it as soon as the movement occurs. Deployments have reported inventory accuracy improvements and search time reductions translating to productivity gains. Notably, research prototypes have also validated this approach: For example, one study outfitted forklifts with UWB positioning and RFID readers and demonstrated that all pallet movements in a
warehouse could be tracked and logged in real time via sensor fusion, with pallet locations automatically recorded at each unload event [
3]. These solutions also provide valuable safety features, such as speed limits in dangerous areas, congestion identification, and compliance monitoring [
18].
However, forklift-mounted tracking has intrinsic disadvantages: It only monitors assets moved by the instrumented vehicles. In environments where not all material is handled by equipped forklifts—for example, pallets moved with manual pallet jacks or conveyor belts—those movements might go untracked. The system also assumes a relatively small fleet of vehicles covering the warehouse; in a large facility with many handling methods, achieving full coverage would require installing the technology on every mover, which can be costly. In summary, forklift-centric tracking excels in warehouses where a few vehicles handle most transports, but it is less effective for diverse or manual handling scenarios.
To address the blind spots of the above solutions, recent efforts are turning to ceiling-mounted cameras with AI for holistic warehouse monitoring [
19]. Many warehouses already have a network of security cameras installed overhead, which presents an opportunity to leverage existing infrastructure for inventory management. By upgrading these cameras with computer vision capabilities, the warehouse can be observed continuously without deploying new moving hardware. Advances in deep learning for object detection make it feasible to recognize common warehouse entities—such as forklifts, pallets, boxes, and workers—in video feeds. For example, Logivations [
20] uses AI-enabled cameras to automatically identify goods and track movements in real time, essentially creating a “scan-free” environment on the fly. At the receiving dock, cameras can read incoming pallet labels and count cartons without any human scanning, instantly registering products into inventory. As goods move through the warehouse, the cameras continue to follow their locations, providing end-to-end visibility. This camera-based approach effectively generates a live digital twin of the warehouse.
1.2. Open Challenges in AI-Based Monitoring
This illustrates the promise of AI-driven overhead monitoring: It can cover large, busy areas (such as loading bays or sorting zones) and detect issues immediately as they happen, without relying on specialized tags or restricting monitoring to specific vehicles. However, vision-based AI tracking solutions present several challenges.
The first major challenge is achieving full spatial coverage in target areas for large facilities, which may require deploying dozens or even hundreds of ceiling-mounted cameras. Optimizing their placement to balance cost and coverage remains an active area of research. For warehouses that already have cameras installed, it is often difficult to evaluate coverage quantitatively or ensure that cameras do not capture sensitive areas, which can raise regulatory and workforce acceptance concerns.
The second major challenge is that such systems depend heavily on robust machine learning models and high-quality visual input. In complex warehouse environments, maintaining detection accuracy across diverse object types under varying lighting conditions and occlusions is particularly difficult [
21]. Collecting high-quality training data that reflects real-world variability can be costly and disruptive to daily operations. While synthetic images offer a cost-effective alternative, the gap between simulated and real-world data can degrade model performance.
Another key challenge is that transforming raw object detections into actionable operational intelligence, such as identifying misplaced pallets or detecting congestion at loading docks, requires interpreting spatial and temporal patterns. A system that merely detects objects is insufficient; it must also understand context and activity. Additionally, ensuring consistent object tracking across multiple camera views is difficult. As objects move between camera fields of view, the system must reliably re-identify them without relying on physical markers or unique identifiers.
Finally, deploying such systems requires adequate computing resources to run AI inference models. Designing system architectures that balance computational capacity, cost, and bandwidth constraints, especially for transferring high-resolution camera feeds, is a significant implementation challenge.
1.3. Objectives and Contributions of This Work
The technological and operational challenges outlined above represent significant barriers to implementing effective real-time warehouse monitoring systems. To address these limitations, this manuscript proposes a comprehensive framework that leverages world models and AI-driven computer vision to interpret warehouse activities using ceiling-mounted cameras. The framework also provides practical solutions to critical implementation challenges faced by warehouse operators.
The objective of this work is to design, implement, and validate a real-time warehouse monitoring system that is accurate, scalable, and compatible with existing industrial infrastructures.
The main contributions of this paper can be summarized as follows:
Development of a camera placement evaluation tool that enables coverage analysis and visualization.
Introduction of a hybrid AI training methodology that can leverage both real and synthetic data, with strategies to mitigate domain gaps.
Proposal of a world model framework for interpreting multi-view detection with respect to warehouse activities.
Design of scalable centralized and distributed system architectures tailored to different warehouse deployment contexts.
The remainder of this paper follows logical steps:
Section 2 explains the technical methodology for implementing the main contributions;
Section 3 introduces a tool to guide camera placement for achieving optimal coverage and for evaluating existing layouts.
Section 4 describes the training of AI models to reliably detect warehouse objects from camera images.
Section 5 extends this by showing how detections from multiple cameras can be correlated to capture richer, activity-level insights using world models.
Section 6 presents representative use cases, including zone monitoring and pallet-layer estimation. Finally,
Section 7 provides experimental validation, and
Section 8 concludes this manuscript.
2. Methodology
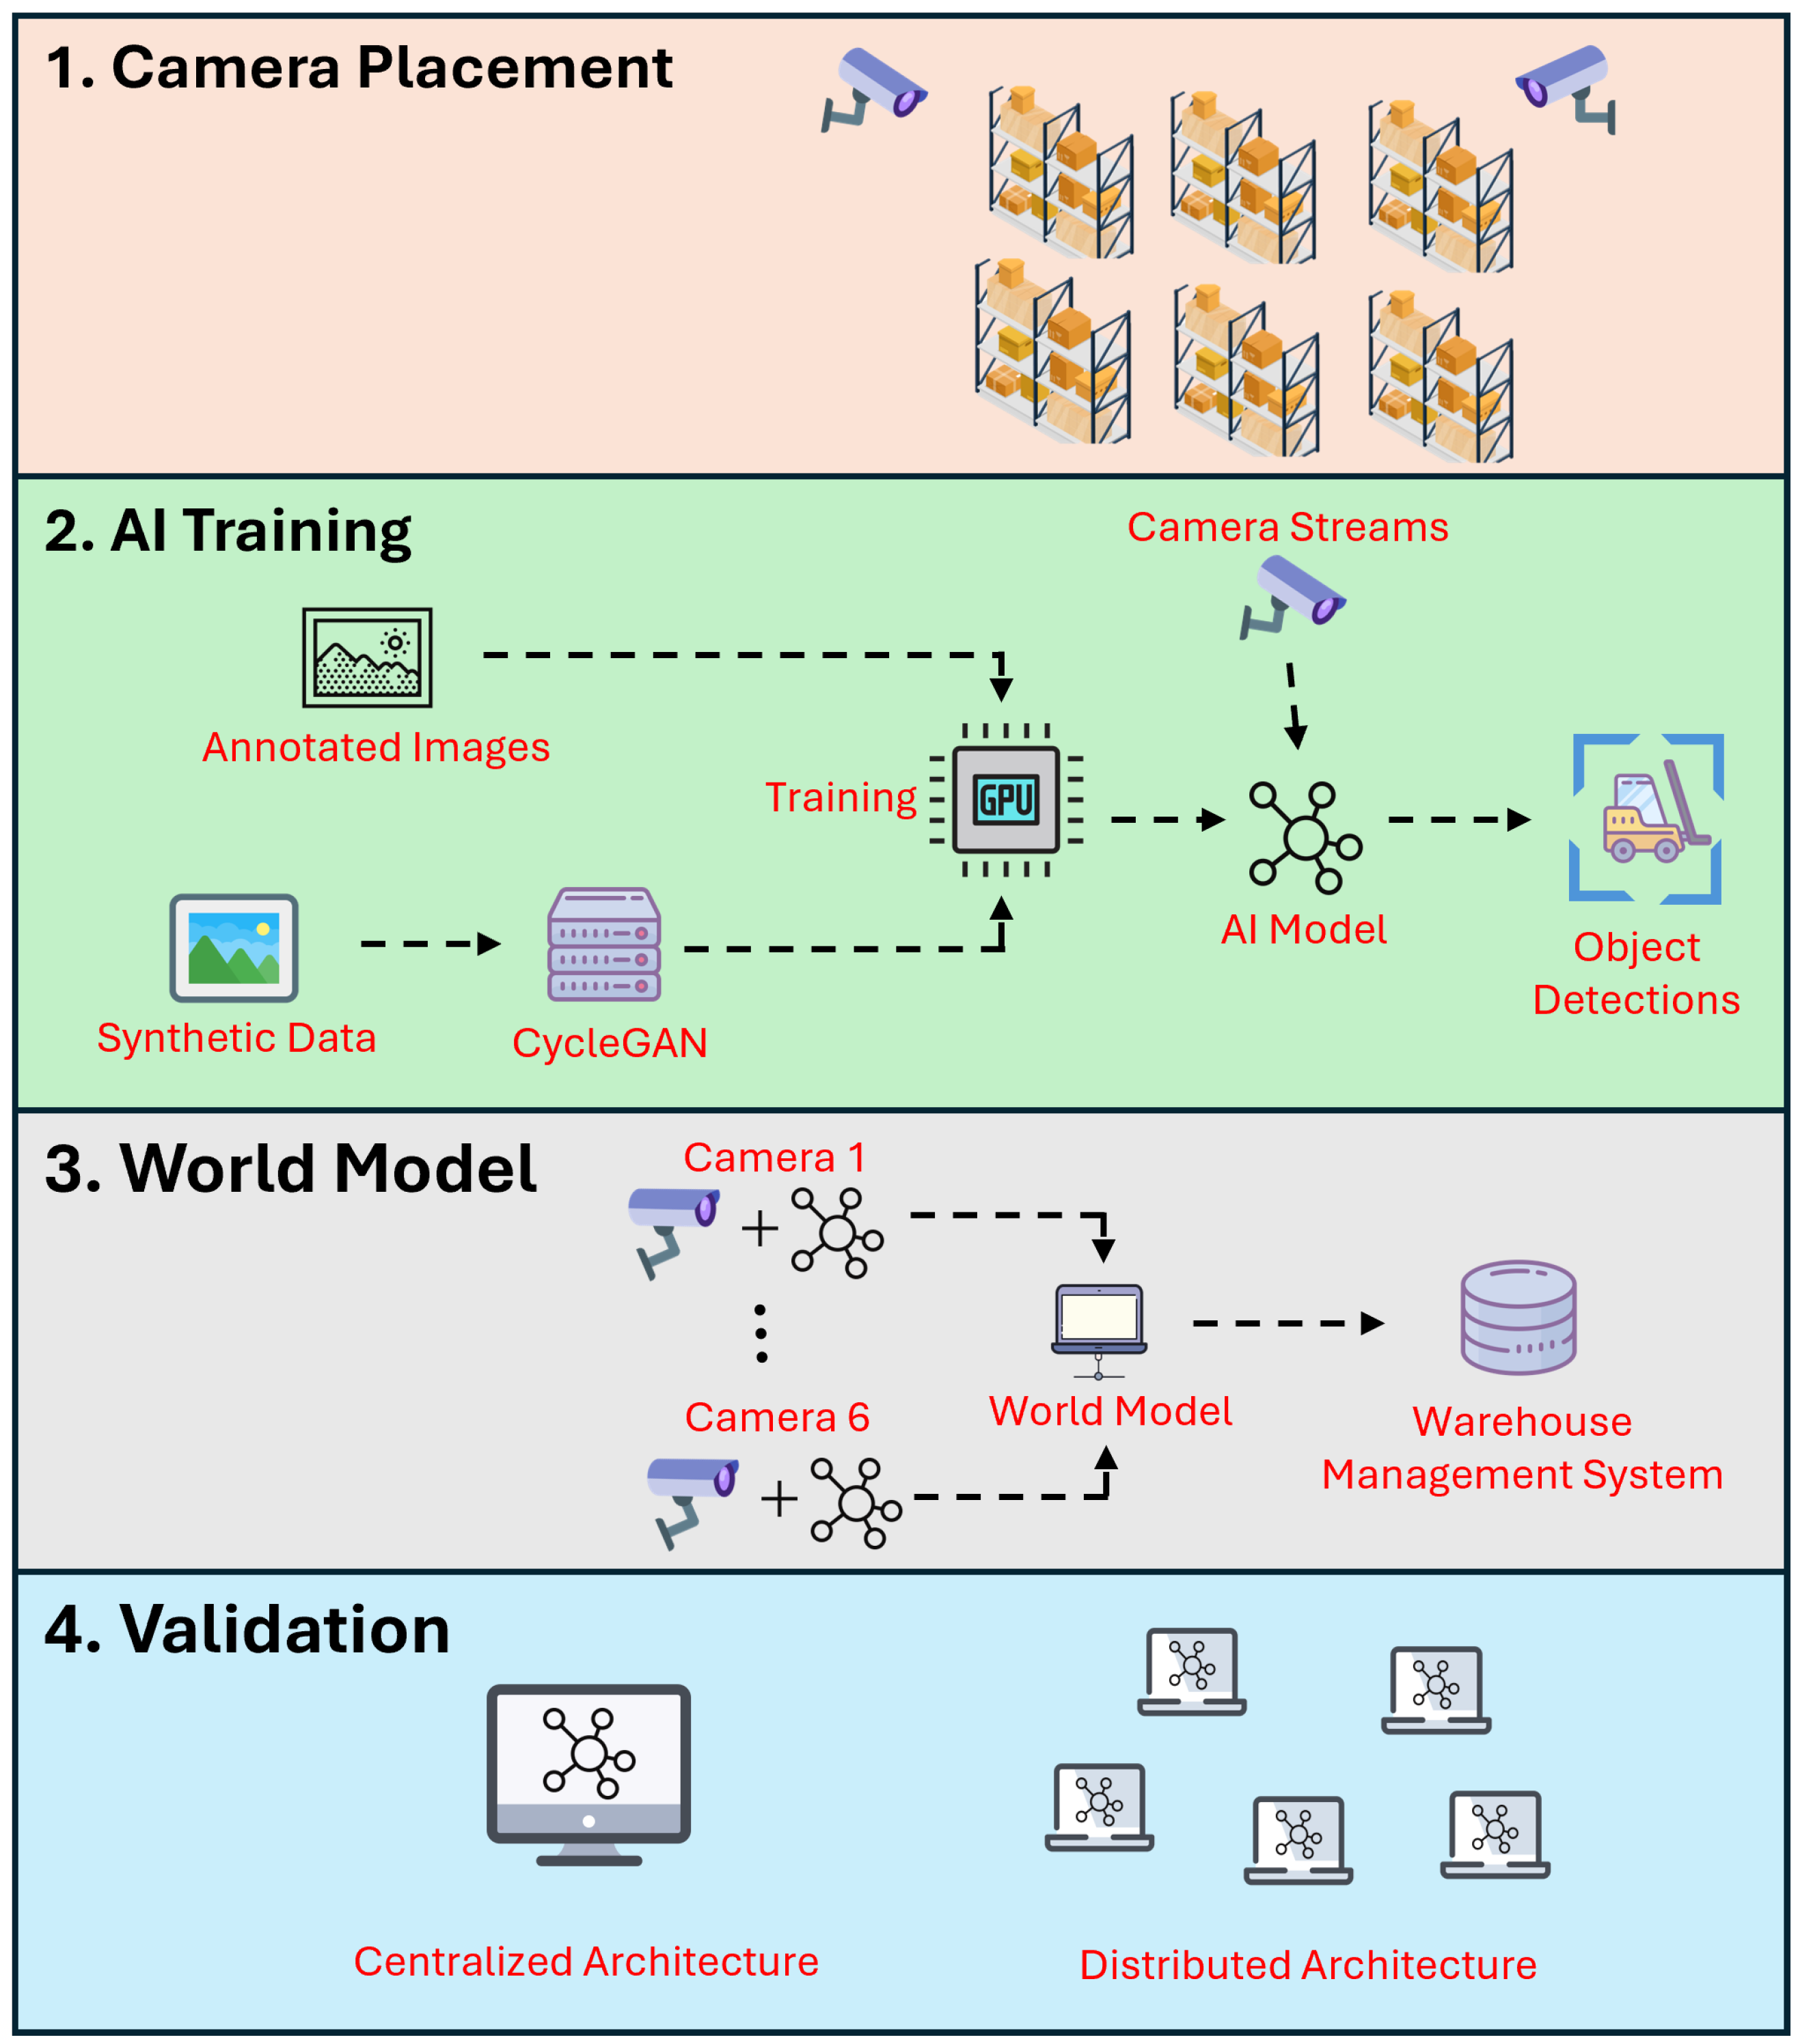
To enable real-time warehouse monitoring using ceiling-mounted cameras and digital twins, our approach integrates simulation-driven development, machine learning, and world model-based tracking. The methodology follows a design structured around four main research phases: (1)
camera placement optimization, (2)
data collection and model training, (3)
world model, and (4)
validation and analysis (
Figure 1).
2.1. Camera Placement Optimization
Optimal camera placement is determined using a mathematical coverage optimization approach. Each camera’s field of view is modeled as a geometric frustum represented by a four-sided pyramid extending from the camera’s 3D position. The frustum is defined by the camera’s horizontal and vertical field of view (FOV) angles, calculated using trigonometric projection:
For a camera positioned at coordinates
with orientation angles (roll, pitch, and yaw) and FOV parameters
, the frustum’s intersection with the ground plane (z = 0) forms a polygon with vertices determined by the following:
where
is the 3D rotation matrix incorporating the camera’s orientation, and
t is the parameter for the ray–plane intersection.
Coverage assessments are performed by rasterizing each camera’s coverage polygon onto a 2D bitmap representing the warehouse floor. The coverage ratio is computed as follows:
Overlapping fields of view are handled through pixel-level union operations, ensuring accurate aggregate coverage calculations.
2.2. Data Collection and Model Training
2.2.1. Data Collection Procedures
Data collection employs two complementary approaches to ensure dataset diversity and minimize annotation costs. The first approach is real-world data collection, where six Basler acA2440-35uc cameras (Basler AG, Ahrensburg, Germany) are deployed in the Flanders Make warehouse laboratory (15.92 m × 10.91 m × 7.36 m height) with ceiling mounting at strategic positions to ensure overlapping fields of view. Cameras capture RGB images at 10 frames per second with resolution of 2440 × 2048 pixels. Data collection scenarios include the following:
Forklift navigation and pallet transportation;
Manual pallet jack operations;
Worker movement patterns;
Loading and unloading activities;
Various lighting conditions (natural and artificial illumination).
Another approach is
synthetic data generation, where a high-fidelity digital twin of the warehouse environment is developed using Unreal Engine 5 with the AirSim plugin [
22]. The simulation generates synthetic RGB images, depth maps, and semantic segmentation masks with pixel-perfect annotations. Virtual cameras replicate real camera configurations, ensuring geometric consistency between synthetic and real datasets.
To further ensure data quality and reliability, especially the simulation-to-real gaps when applying synthetic data, CycleGAN-based style transfer is applied to synthetic images. The style transfer effectiveness is quantified using CLIP embedding distances:
where
and
represent synthetic and real images, respectively. Active learning is implemented by selecting synthetic images with highest prediction errors and their nearest real counterparts in the CLIP embedding space for annotation and training set augmentation.
2.2.2. AI Model Training
A YOLOv8 nanosegmentation model is selected for object detection due to its efficiency and compatibility with edge computing devices. The model is trained on a hybrid dataset comprising 8610 real images and style-transferred synthetic images. The training configuration is summarized in
Table 1.
Model performance is evaluated using the mean average precision (mAP) at an intersection-over-union (IoU) threshold of 0.5, with class-specific precision–recall analysis for target objects: person, forklift, palletjack, and goods.
2.3. World Model
The world model employs a graph-based representation where entities are nodes and spatial relationships are edges. Spatial transformations between reference frames are represented as rigid-body transformations using homogeneous coordinates:
where
is the rotation matrix, and
is the translation vector.
Multi-object tracking is implemented using extended Kalman filters (EKFs) with separate state estimators for each tracked object. The state prediction is as follows:
where
is the state vector,
is the covariance matrix,
is the Jacobian of the motion model, and
is the process noise covariance.
State correction incorporates new observations through the following:
where
is the observation,
is the observation model,
is the observation’s Jacobian, and
is the observation’s noise covariance.
Data association between detections and existing tracks uses the Mahalanobis distance:
where
is the innovation covariance.
2.4. Validation and Analysis
Two deployment architectures are designed and used for validation of the system: distributed edge processing and centralized processing. The distributed architecture employs on-device inference using NVIDIA Jetson AGX Xavier devices, while the centralized approach processes all video streams on a high-performance server. Both architectures utilize Robot Operating System 2 (ROS2) for inter-component communication and Docker containerization for deployment consistency.
Performance metrics are collected over extended operational periods to assess system reliability, accuracy, and computational efficiency under realistic conditions.
3. Optimal Camera Placement and Simulation Environment
In this section, we introduce a camera placement tool designed for efficient evaluation and visualization of camera coverage in warehouse environments. This tool requires minimal user input and operates through a dual-layer architecture for layout configuration and coverage analysis.
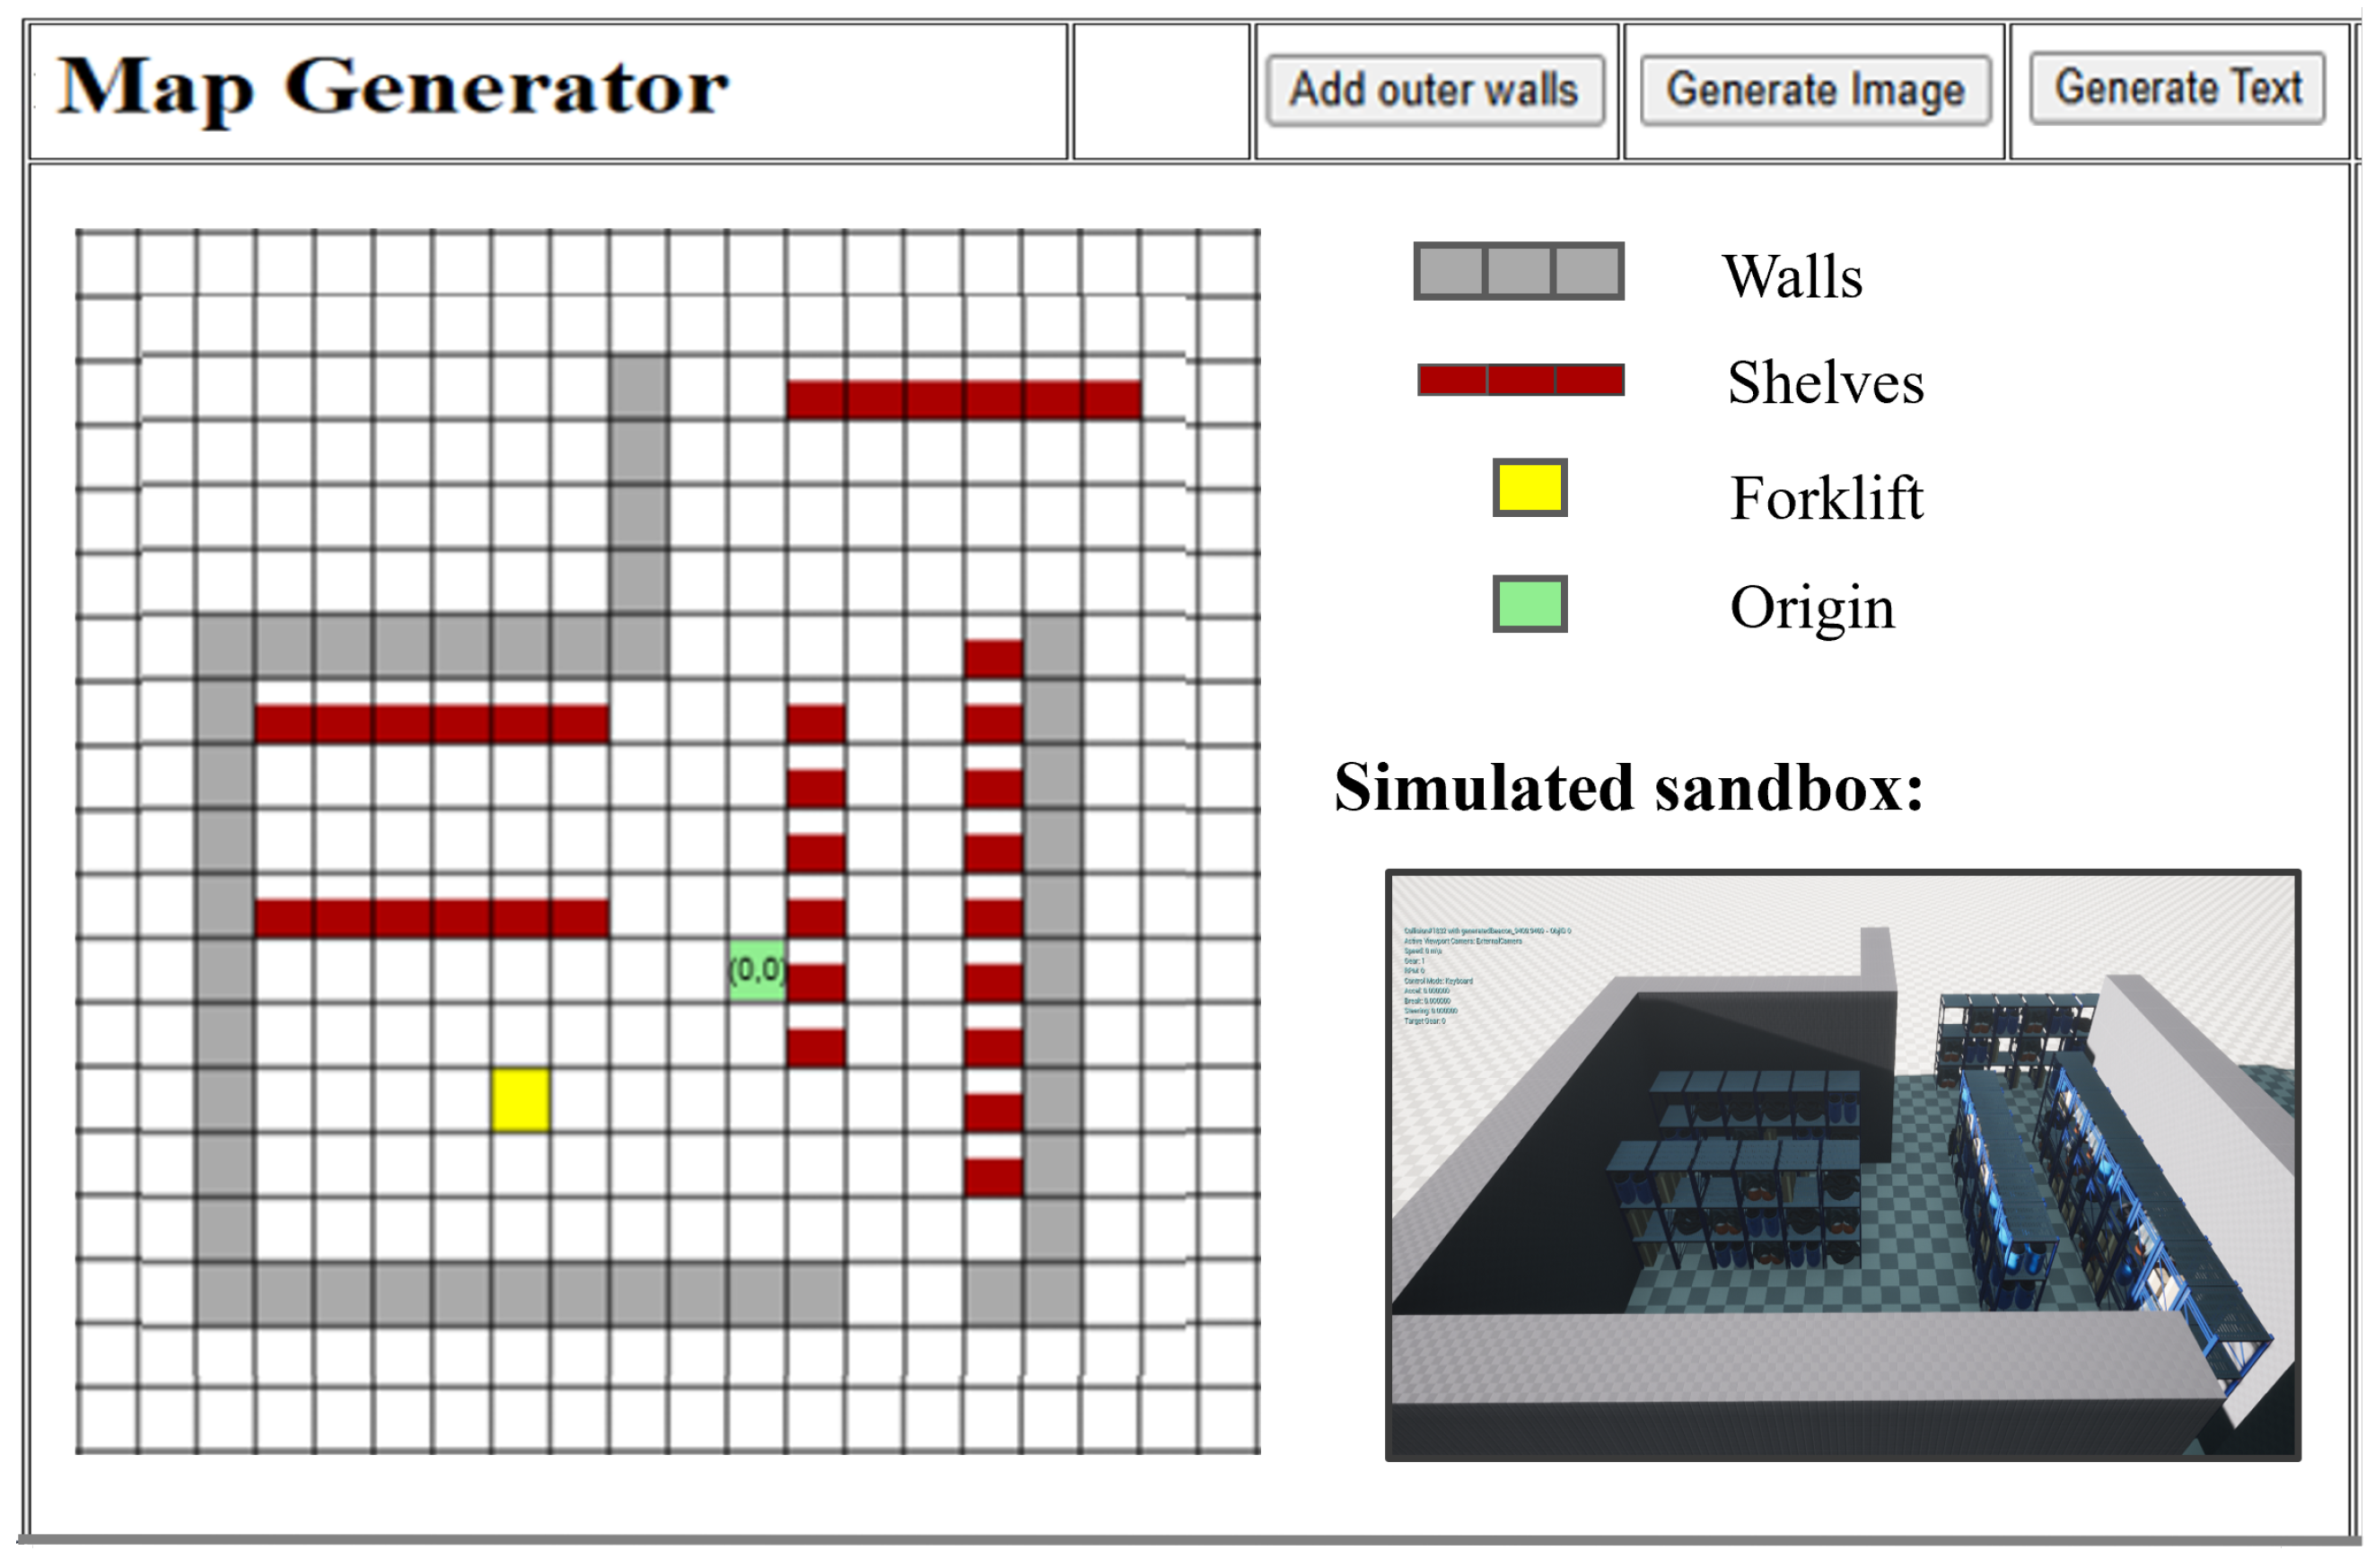
The first layer consists of a HyperText Markup Language (HTML)-based map generator with an intuitive interface, as depicted in the left panel of
Figure 2. Users define essential warehouse parameters, such as overall dimensions and the locations of racks and walls. Cameras are configured by specifying key parameters, including 3D positions (x, y, and z), orientation (roll, pitch, and yaw), FOV, image resolution, and type (e.g., RGB or depth). These configurations are saved as a JSON blueprint for subsequent processing in the simulation’s second layer.
The second layer builds upon the Cosys-Airsim [
22] simulation based on Unreal Engine to visualize the warehouse environment based on the JSON file. The visualization is shown in the bottom right section of
Figure 2. This layer also generates coverage calculations, where calculations are performed separately using mathematical models derived from the JSON (JavaScript Object Notation) parameters and subsequently visualized.
The coverage estimation is implemented in a custom Python-based tool (Python 3.10) that interprets the camera and environment settings from the JSON configuration. For each camera, the tool calculates a frustum of view represented as a four-sided pyramid extending from the camera’s 3D position and determined by the horizontal and vertical FOV. The base of this pyramid is calculated in the ground plane (z = 0) using a trigonometric projection of FOV angles over a specified distance, typically the camera’s height. The orientation of each camera (roll, pitch, and yaw) is applied using 3D rotation matrices to adjust the frustum accordingly.
The intersection points of the pyramid with the ground plane are used to form a polygon, which is projected onto a 2D bitmap representing the warehouse floor. Each polygon is rasterized into a pixel map to estimate the covered area. For statistical coverage analysis, the tool computes the ratio of colored (i.e., covered) pixels to total pixels in the scene, both per camera and in aggregate. Overlapping fields of view are inherently handled through color layering, while occlusions from racks and walls are visualized but not subtracted in the coverage metric. The final output includes both 3D visualization of camera frustums and 2D coverage overlays, enabling users to optimize camera positions interactively.
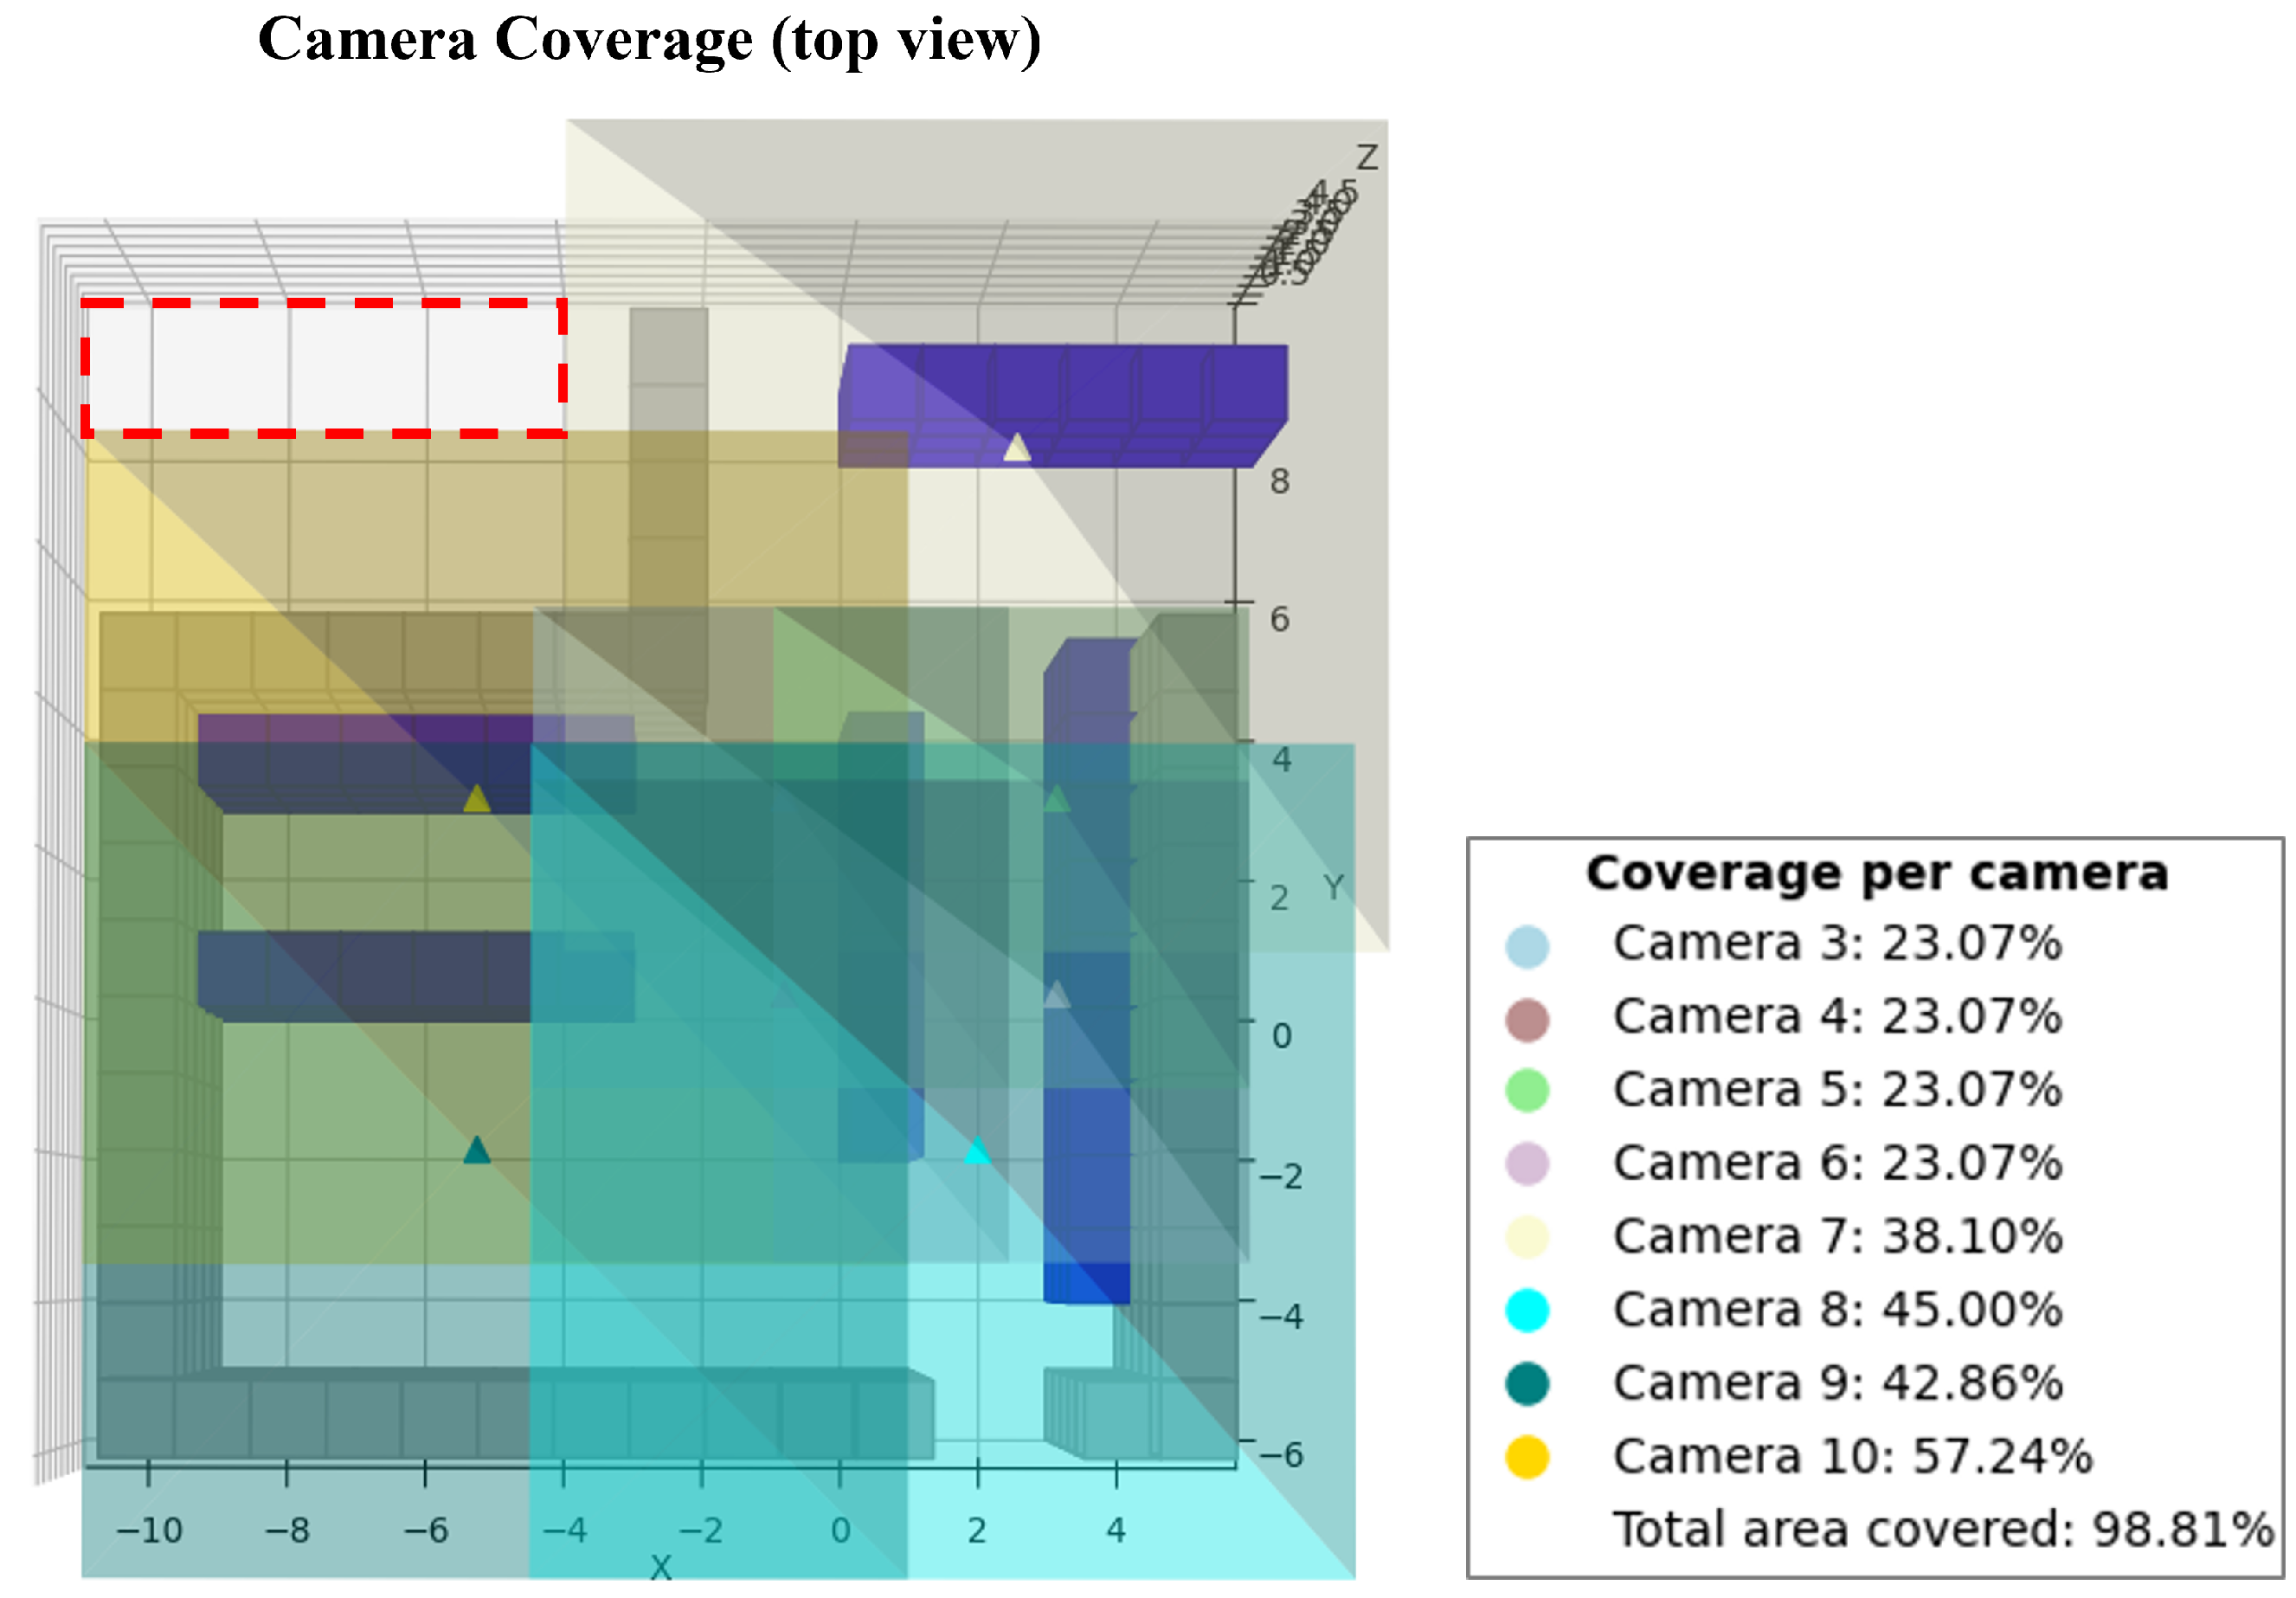
As shown in
Figure 3, the integrated visualization component overlays coverage metrics within the simulated warehouse space, displaying areas with insufficient or excessive coverage alongside relevant statistical data. This output allows users to test different camera positions and refine camera poses for optimal coverage.
4. AI Model Training for Warehouse Applications
For warehouse applications, CV models play a critical role in automating object detection and tracking tasks. These models leverage deep learning techniques, particularly convolutional neural networks (CNNs), to extract spatial features from image pixels and identify objects within complex scenes [
23,
24,
25]. In this work, we selected the YOLO model as the AI model of choice due to its excellent balance between speed and accuracy. Specifically, we deploy YOLOv8n-seg, a nanovariant of the YOLO series introduced in 2023. This model was chosen for its lightweight architecture, enabling compatibility with edge hardware setups. Through a tailored data collection and fine-tuning process, our objective is to achieve precise, high-speed detection well-suited to the dynamic and often unpredictable nature of warehouse environments.
4.1. Data Collection and Annotation
To create a robust dataset for warehouse monitoring, it is essential to capture the diverse range of warehouse objects and operational activities. Common events include objects being placed on the ground, handled by forklifts, moved horizontally, and stacked on shelves. Given the high vantage point of ceiling-mounted cameras, objects often show different orientations, and therefore, a varied and large volume of data is required. To meet these requirements, we provide two complementary data collection strategies.
The first approach involved capturing images from an experimental setup within the Flanders Make warehouse laboratory located in Leuven, Belgium. This indoor facility spans approximately 15.92 m in length and 10.91 m in width, with a ceiling height of 7.36 m. In the southeast corner of the warehouse, two vertical storage shelves are installed, each measuring 5.4 m in length and 6 m in height, and they are composed of five layers spaced 1 m apart. To enable multi-view data acquisition, six Basler acA2440-35uc cameras are mounted on the ceiling, ensuring intersecting fields of view. Each camera captures images at a rate of 10 frames per second.
During data collection, the environment was populated with typical warehouse elements, including pallets, cardboard boxes, and forklifts. A variety of realistic scenarios were staged to reflect common warehouse operations, such as the following:
Pallet picking and stacking;
Forklift navigation and object transportation;
Manual operation of pallet jacks;
Movement of goods within the loading and unloading zones.
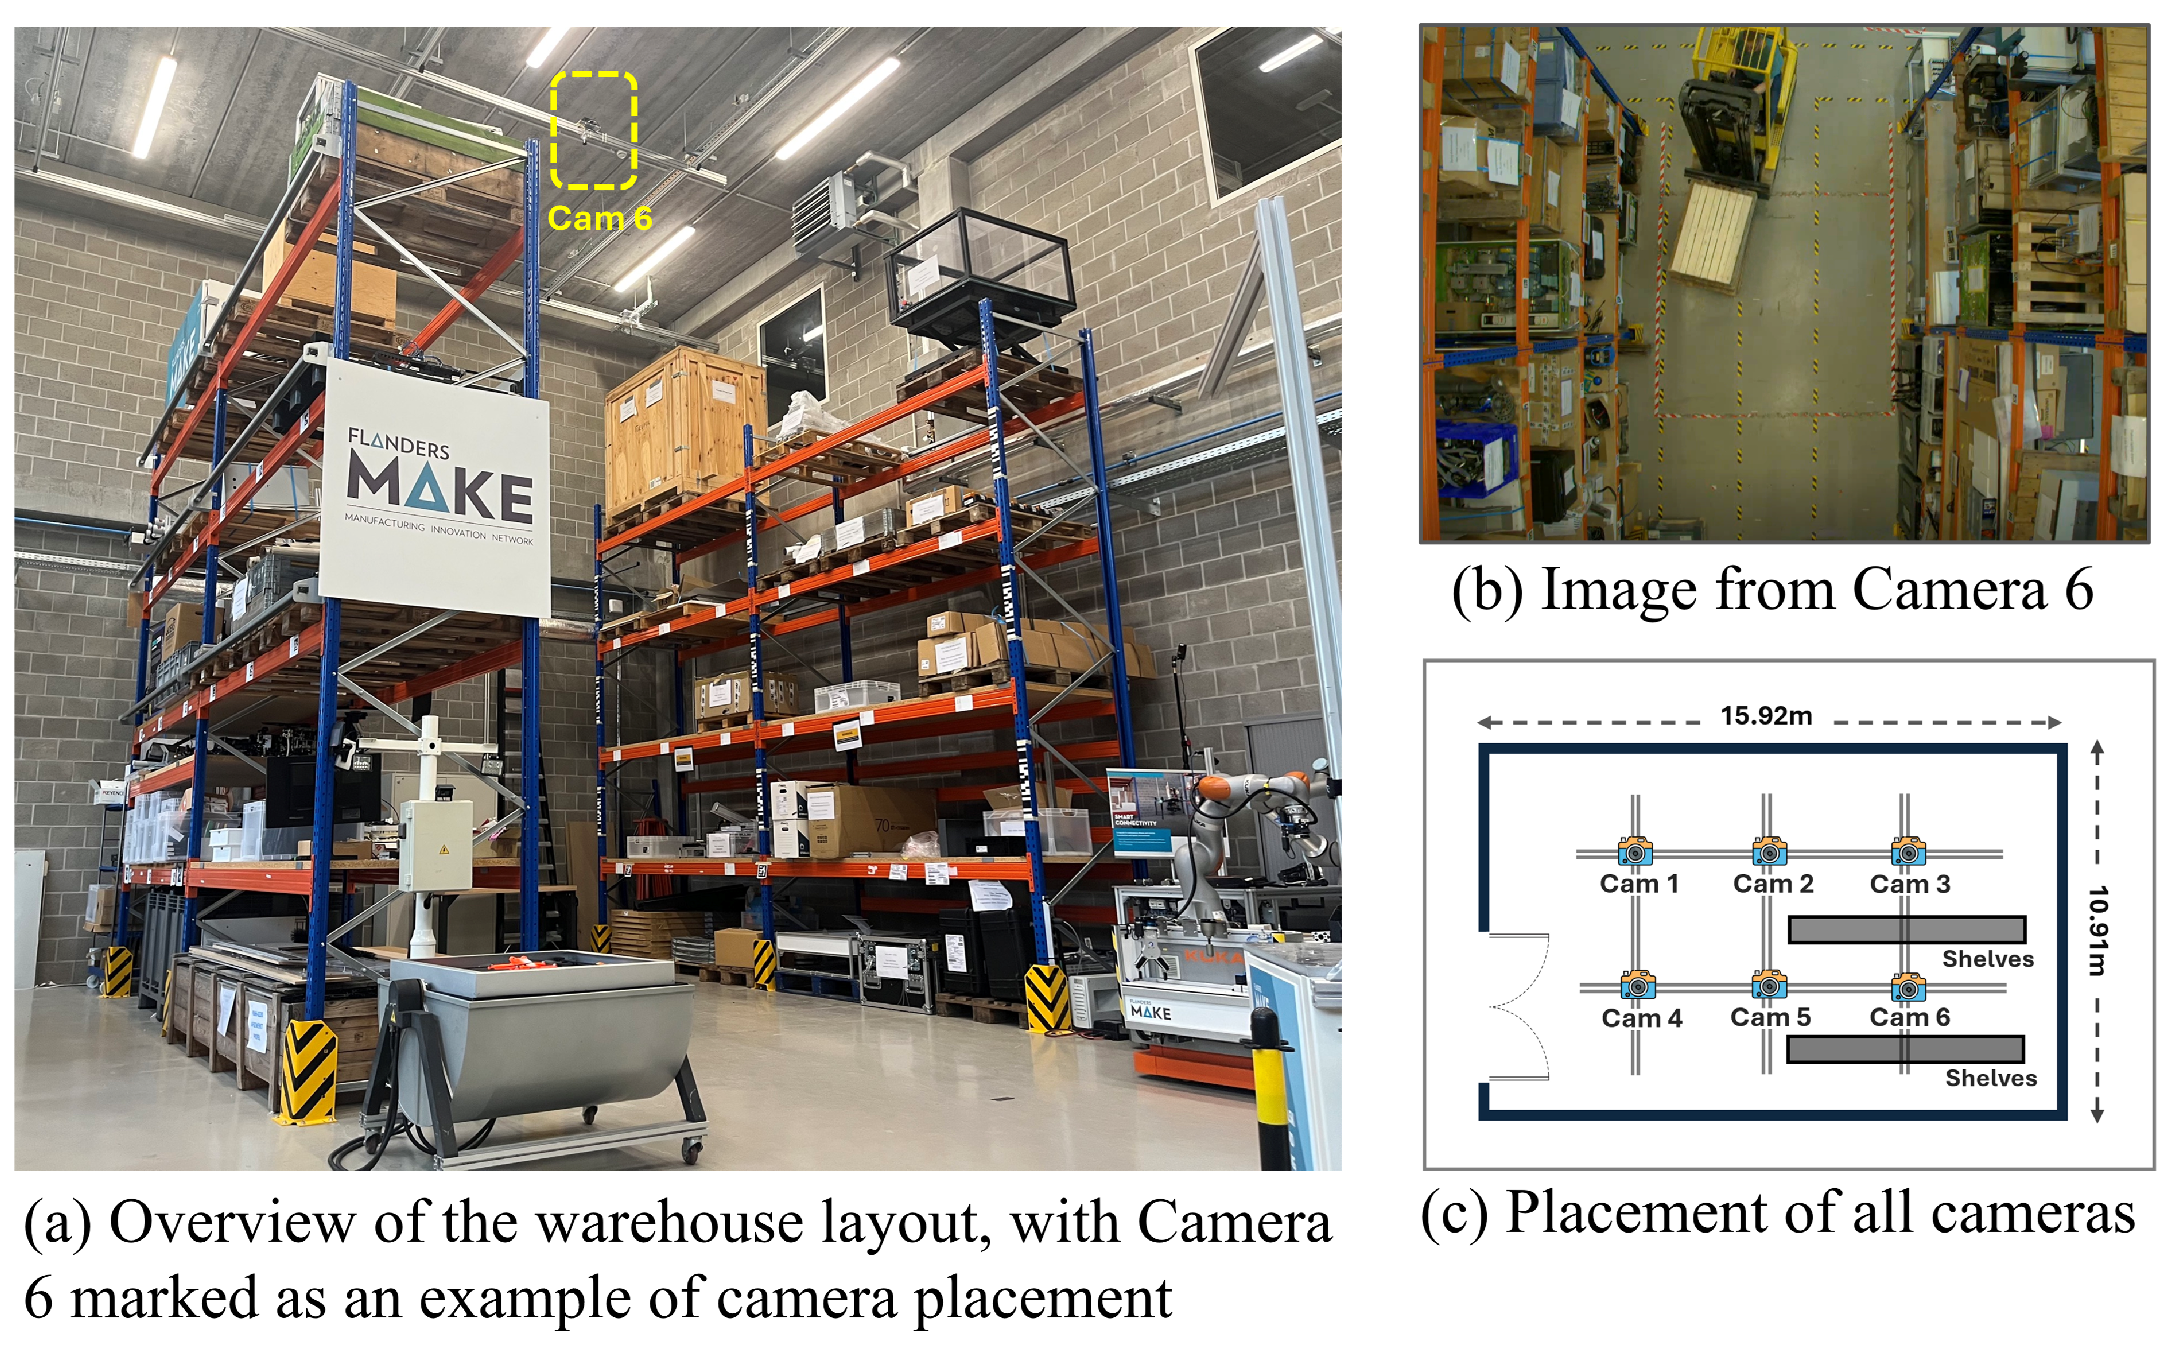
These scenarios were designed to reflect routine warehouse activities. An overview of the warehouse’s layout and a sample image from camera 6 are shown in
Figure 4.
The second approach utilized a simulation-based digital twin of the warehouse, developed using Unreal Engine 5 and the AirSim plugin, to enable the accurate modeling of the physical environment and the precise placement of virtual sensors. This digital twin replicates the physical setup and generates synthetic data for scenarios that are challenging to capture consistently in real-world conditions. The simulation produces synthetic RGB images with realistic camera noise, instance segmentation, and depth images. Panoptic segmentation is also generated from instance segmentation using custom scripts. This approach enables the creation of a larger and more diverse dataset, providing images across varied conditions without requiring labor-intensive manual setup. Additionally, it eliminates the need for on-site personnel to operate equipment while maintaining operational realism.
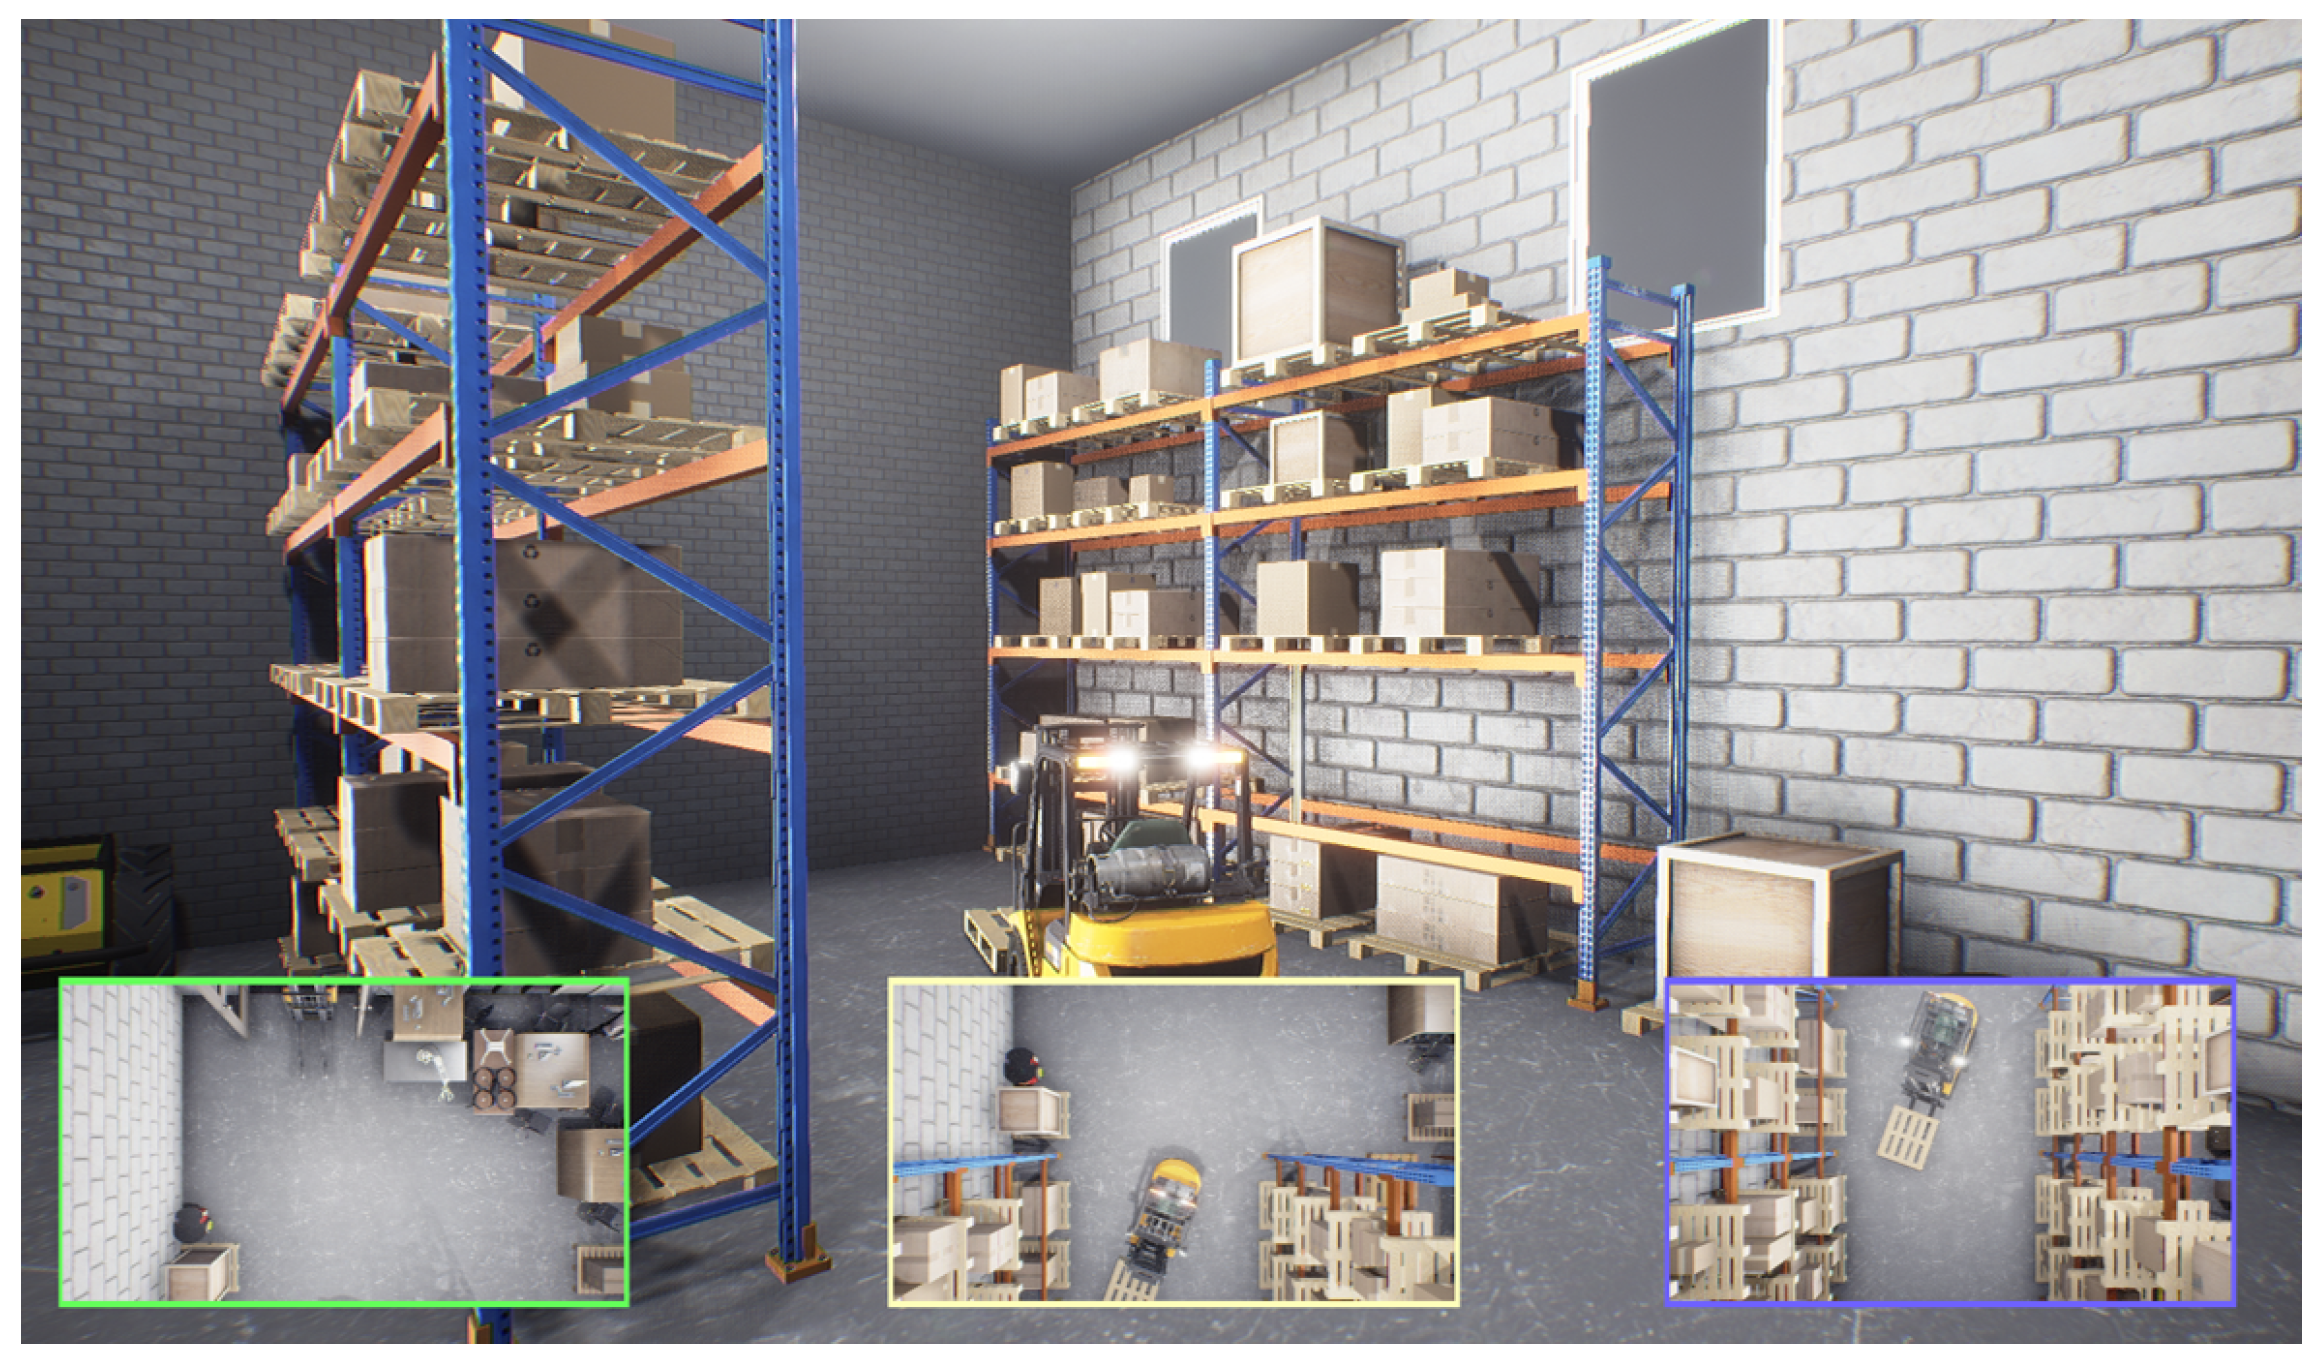
An example of the simulated warehouse environment is shown in
Figure 5, depicting a scene where an operator uses a pallet jack to transport boxes, captured from multiple simulated camera perspectives.
We applied both strategies for data collection, resulting in a comprehensive and diverse dataset. For real warehouse data annotation, we used the Segments.Ai [
26] platform to generate ground truth labels for the collected images. These annotations provide precise pixel locations and classification labels for each object, which were used for YOLOv8 model training.
4.2. Data Preprocessing and Model Training
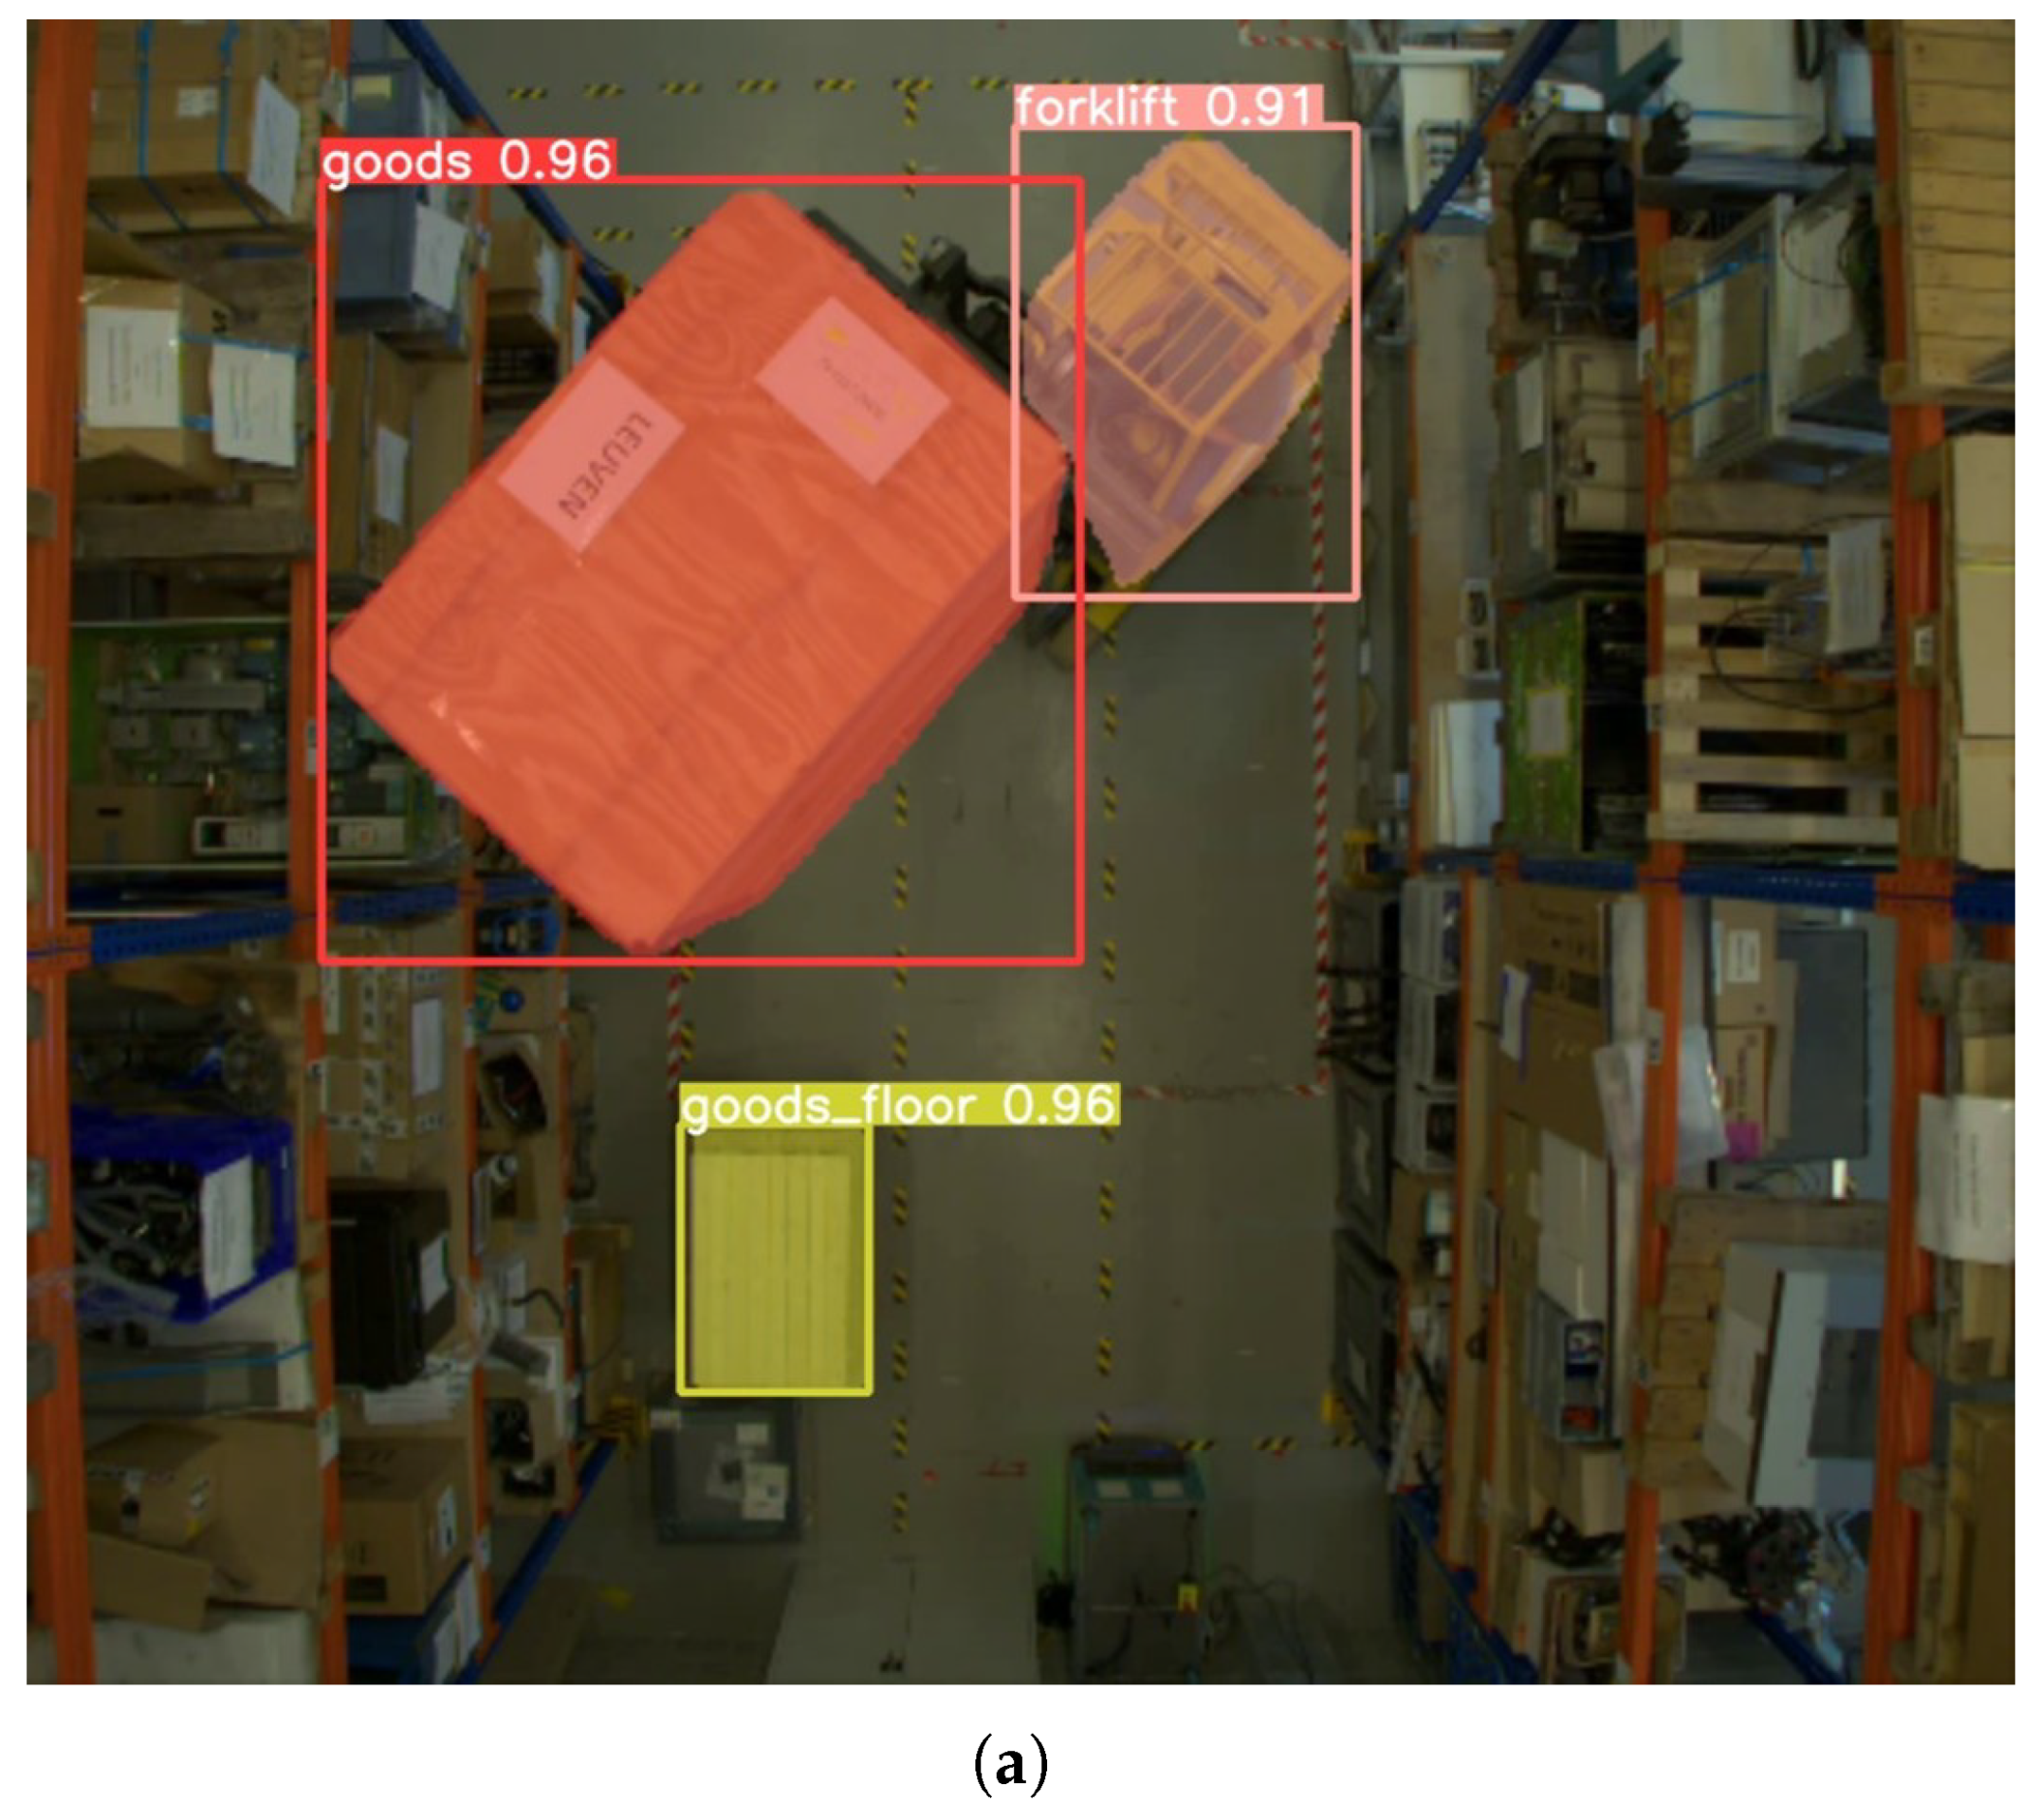
Although both synthetic and real images were collected, the YOLOv8 model described in this subsection was trained exclusively on real images. The annotated real-image dataset was converted to YOLO format to ensure compatibility with the YOLOv8 model. The data was then split into training, validation, and test sets for model training and evaluation. Specifically, the model was trained on a dataset comprising 8610 images, with an additional 2155 images used for validation. A total of 200 training epochs were conducted to fine-tune the model to the specific characteristics of warehouse operations, such as recognizing goods in various positions and tracking dynamic activities involving forklifts, pallet jacks, and human operators. Inference results showing the model’s ability to detect common warehouse objects are displayed in
Figure 6.
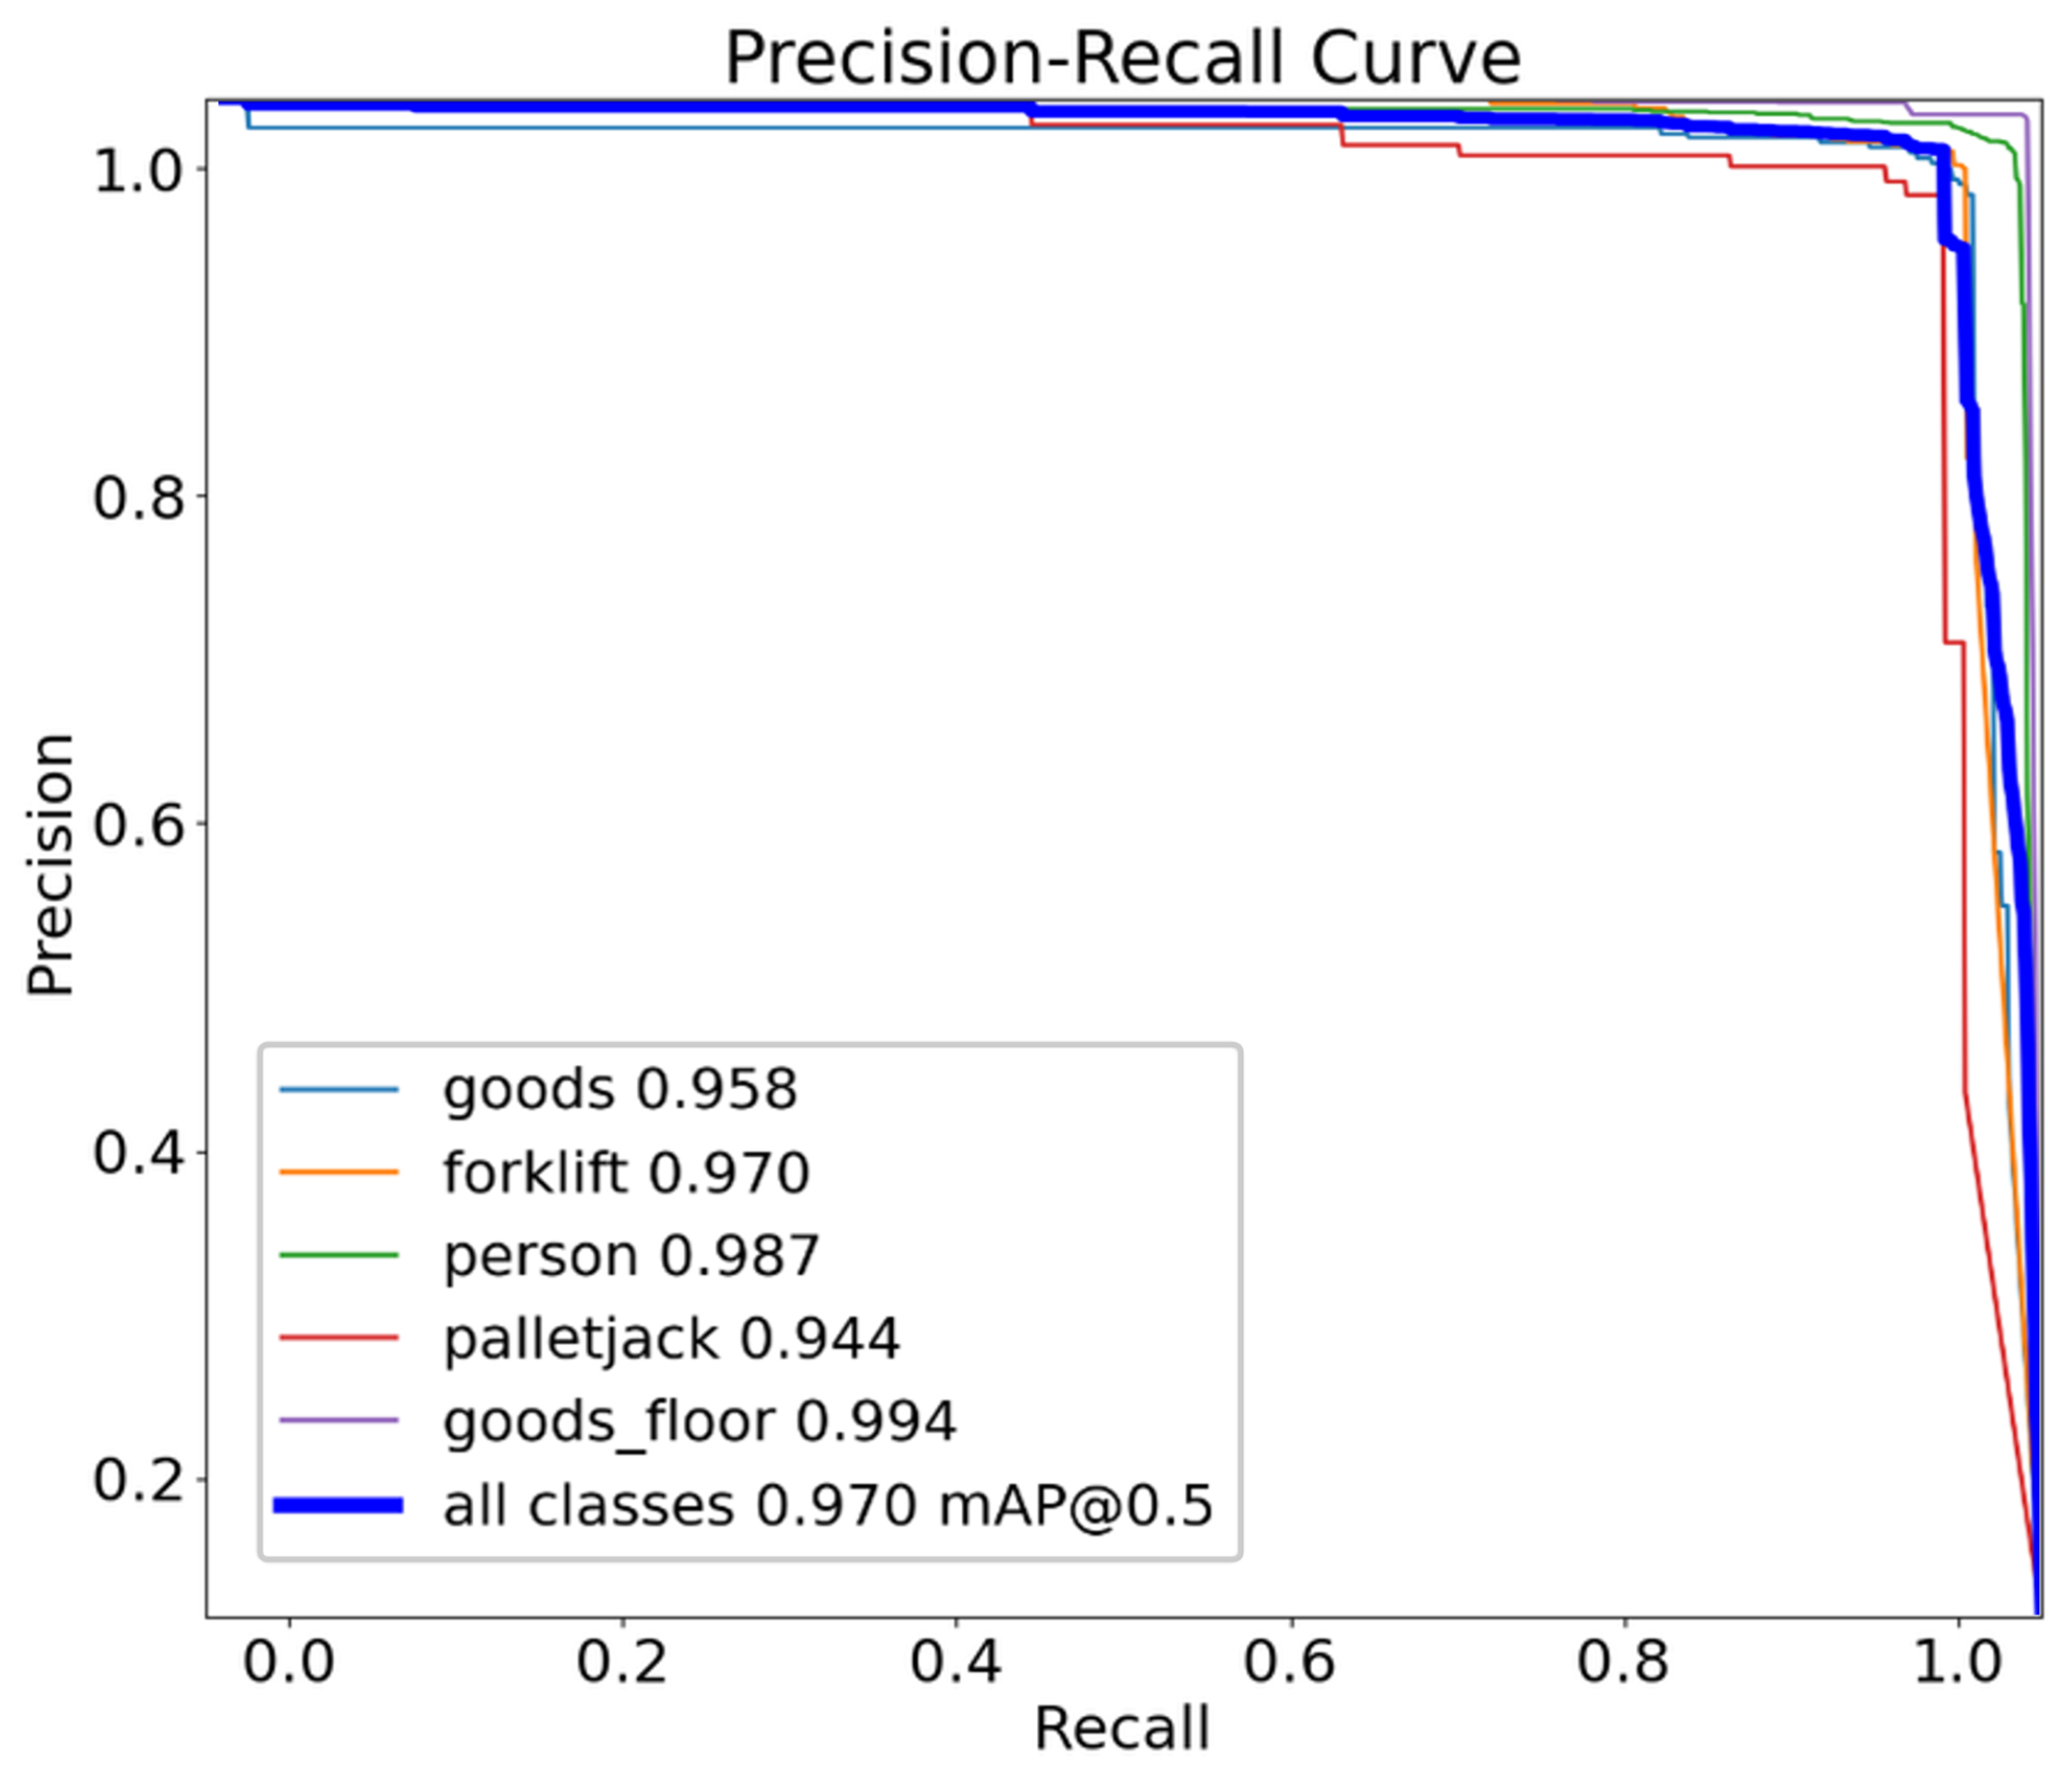
The model’s performance was evaluated using the mean average precision (mAP) at an intersection-over-union (IoU) threshold of 0.5, as well as class-specific precision–recall metrics. As shown in
Figure 7, the precision–recall (PR) curve illustrates high detection performance across all target classes, including person, forklift, palletjack, goods, and goods floor. The overall mAP0.5 score reaches 0.970, indicating excellent average detection accuracy. Notably, the person class achieved the highest precision with a score of 0.987, while even the lowest-performing class, palletjack, maintained a strong score of 0.944. The tight clustering of the curves near the top-right corner demonstrates the model’s consistent ability to balance precision and recall.
While the quantitative metrics indicate excellent overall performance, it is important to consider how the model behaves under both typical and more demanding warehouse scenarios. In typical warehouse conditions, false positives are rare and are primarily mitigated through a combination of high-confidence thresholds and well-curated training data. Under harsh warehouse conditions, such as varying lighting, crowded spaces, and fast-moving assets, the model’s performance can be affected. Although training data includes variations in lighting, extreme low-light conditions or poor camera visibility can still reduce detection accuracy. The model is generally robust to crowded scenes, but when large objects are stacked and heavily occlude each other, detection becomes challenging. For fast-moving objects, which are uncommon in warehouses except for occasional forklift acceleration, cameras operating at 10 fps handle most scenarios effectively; however, reducing the frame rate could negatively impact tracking and subsequent processing.
4.3. Data Augmentation, Style Transfer, and Sim-to-Real Gap Quantification
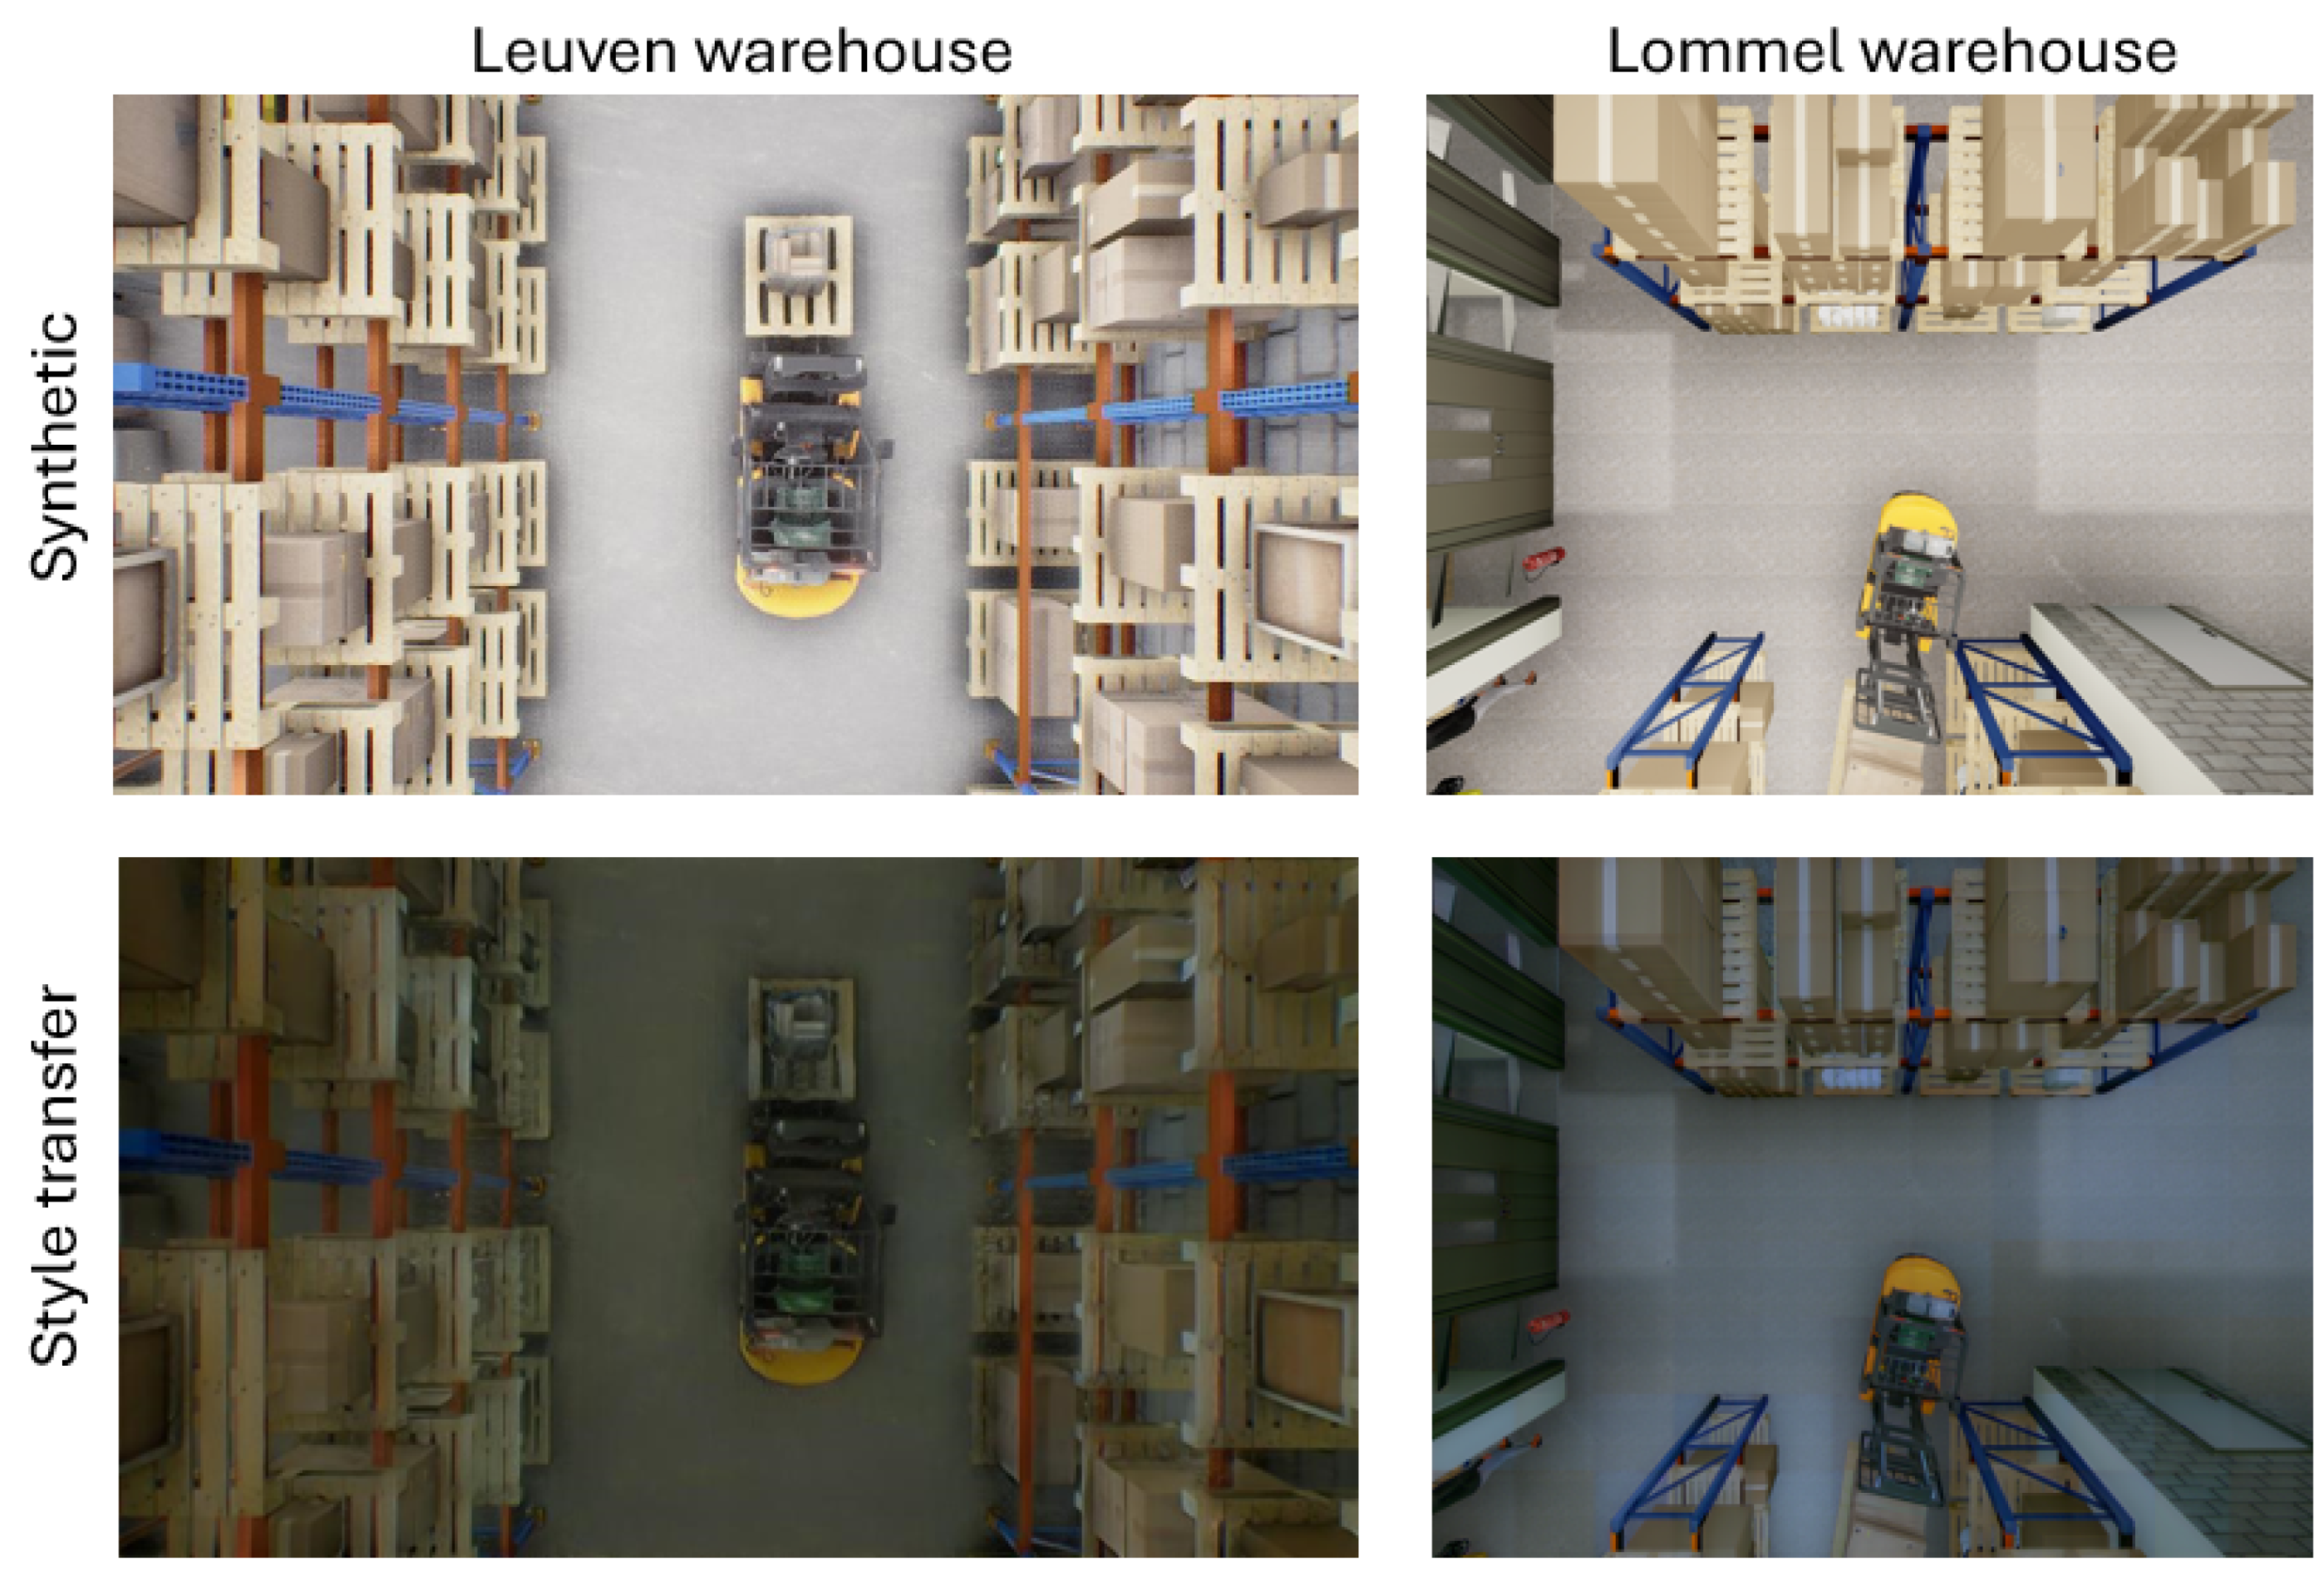
While synthetic data generation from simulation environments enables large-scale, low-cost image collection, a persistent challenge remains: the sim-to-real gap—differences in visual appearance and statistical distributions between synthetic and real-world images. To address this, we implemented a style transfer-based data augmentation pipeline that enhances the realism of synthetic images while preserving their semantic annotations.
We employed CycleGAN, a generative adversarial network trained to transform synthetic images into a realistic style while maintaining cycle-consistency, i.e., the ability to map the transformed image back to its original [
27]. This technique preserves object locations and labels while modifying surface textures, lighting conditions, and other perceptual features to more closely resemble real-world imagery. The result is a hybrid dataset of style-transferred synthetic images that bridge the domain gap while retaining the benefits of automatic annotation (
Figure 8).
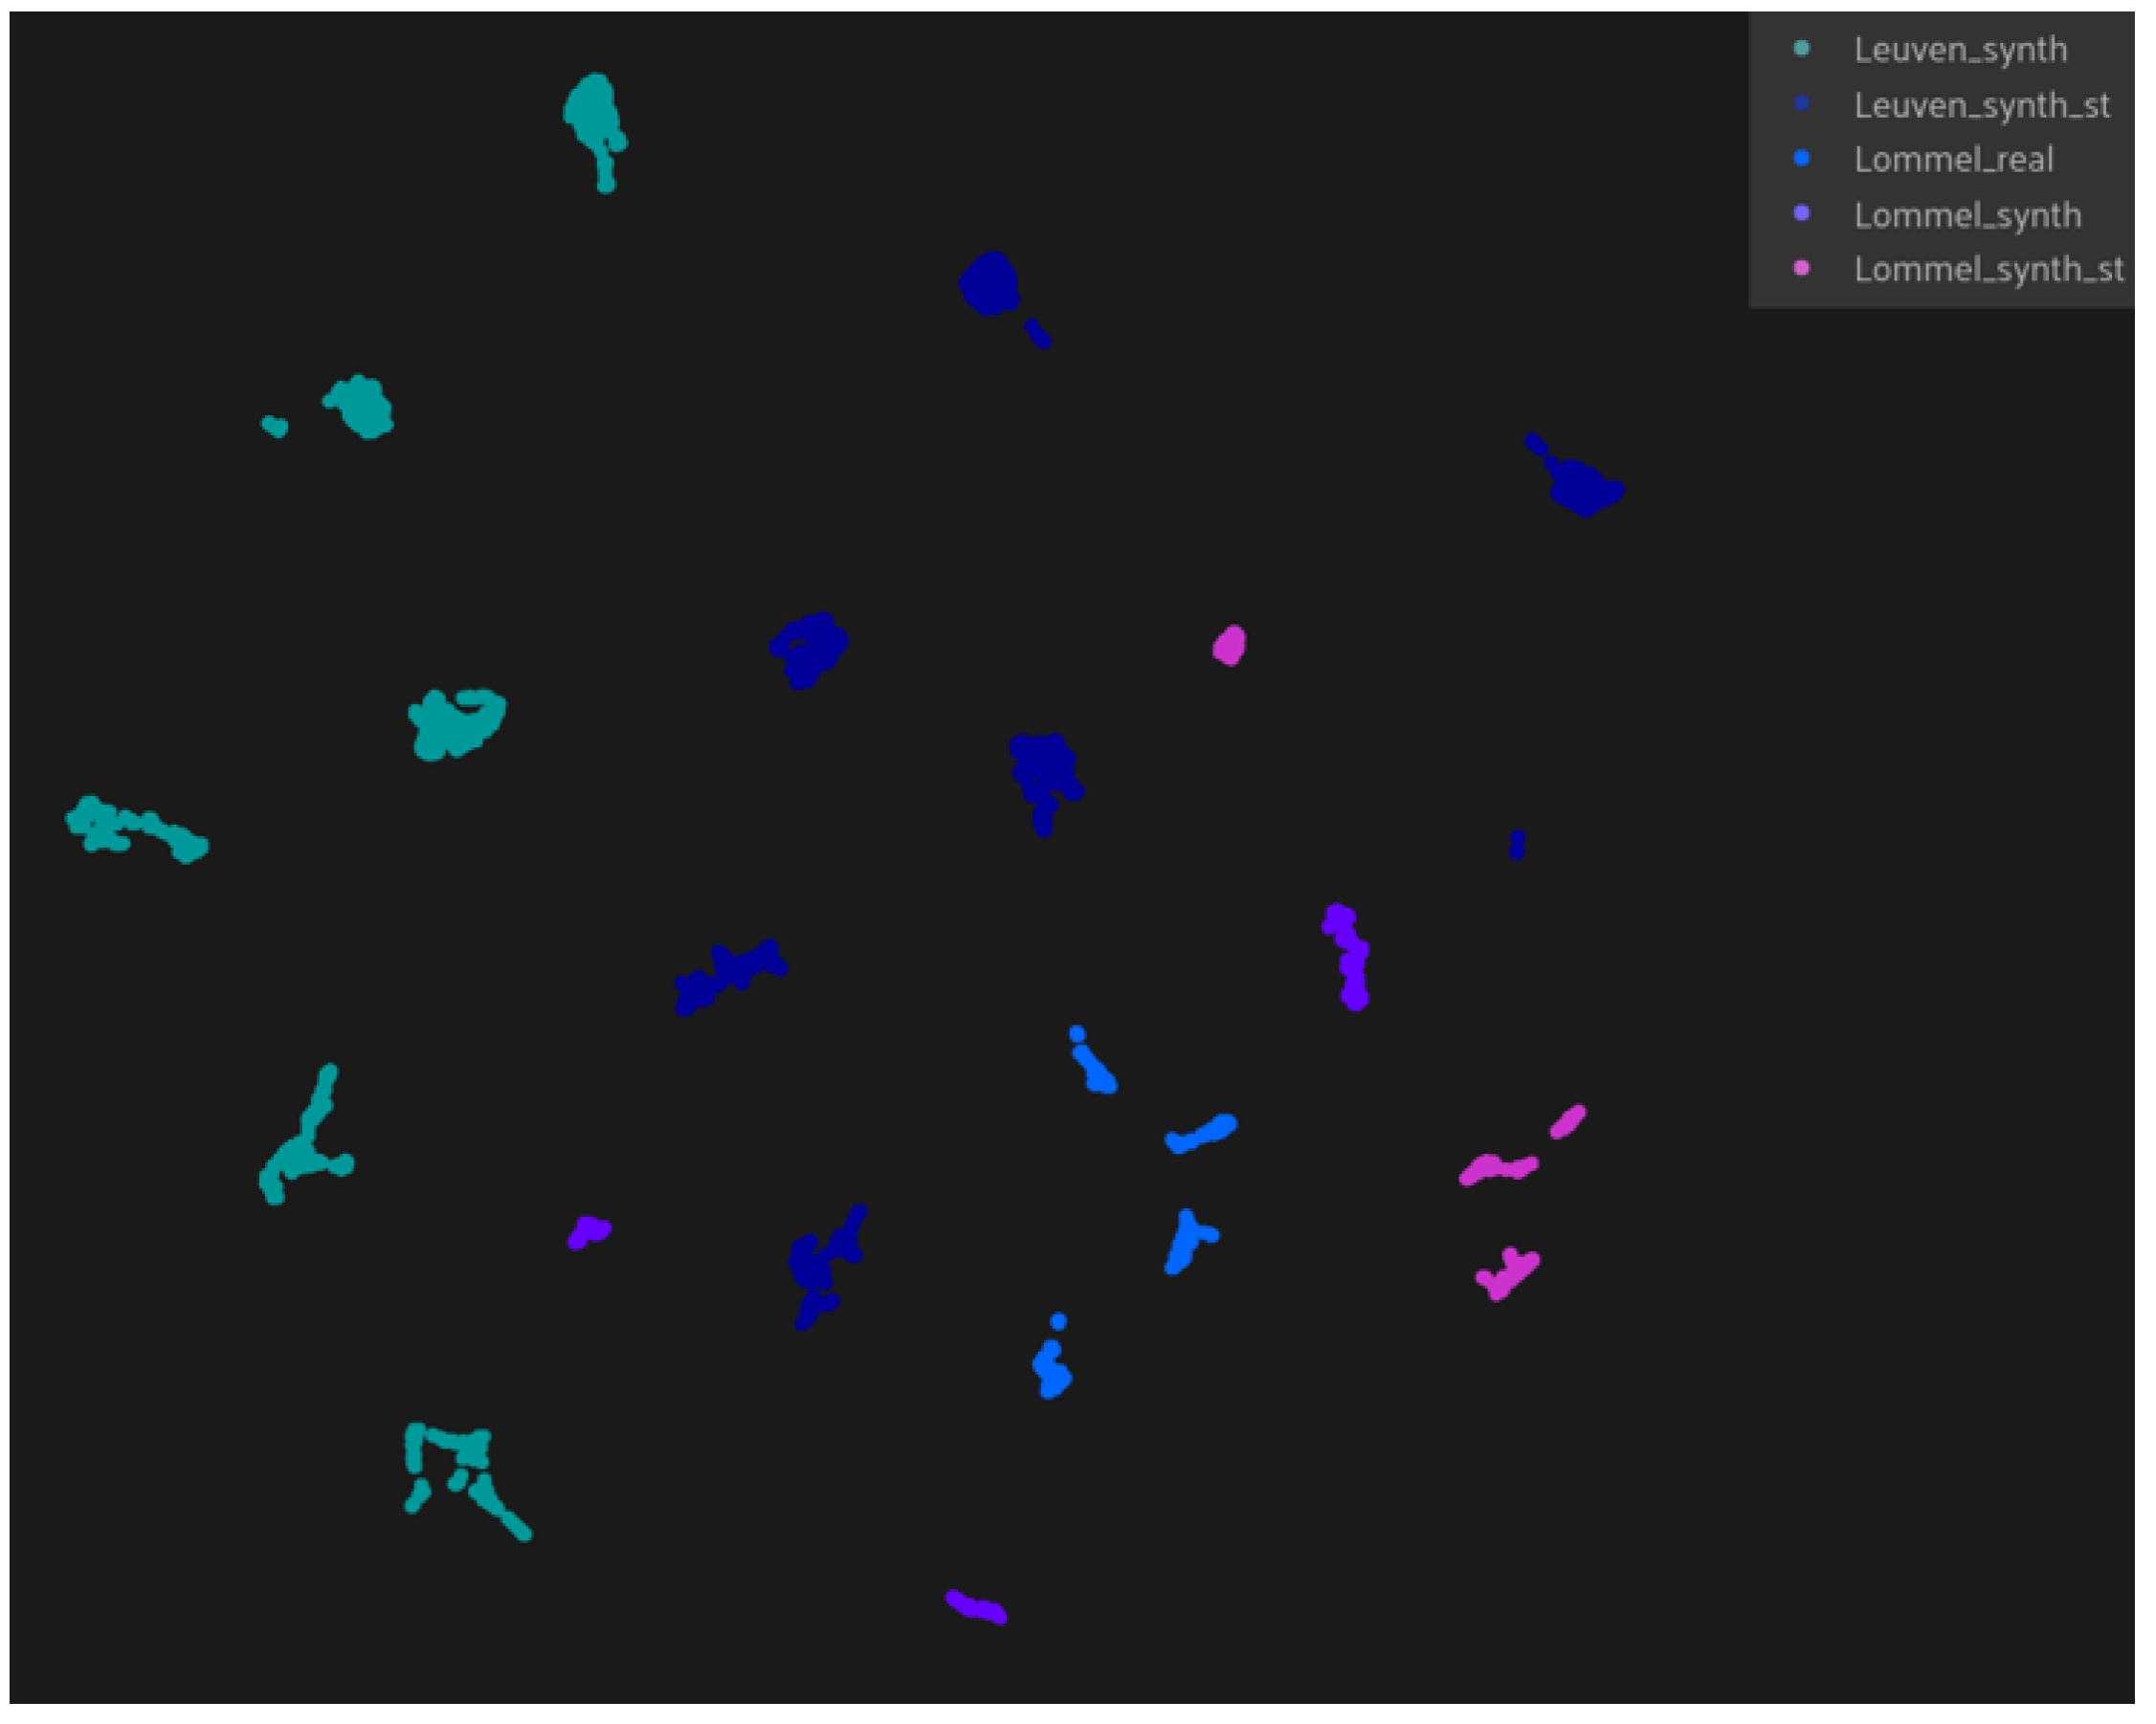
To assess the effectiveness of style transfer, we quantified the sim-to-real distance using a feature embedding-based approach. We used CLIP, a vision-language model, to project both real and synthetic images into a shared embedding space [
19]. In this space, the Euclidean distance between embedding vectors serves as a measure of visual similarity. On average, style-transferred synthetic images were found to be significantly closer to real images than their original synthetic counterparts—reducing the sim-to-real gap by about 10% in the warehouse setting (
Figure 9).
4.4. Active Learning to Reduce Data Annotation Cost
This embedding space also underpinned our active learning strategy. After initial training on a small hybrid dataset, we evaluated the model’s performance across diverse simulation scenarios. Synthetic images that resulted in high prediction errors were identified as underperforming cases. For each of these, we selected their nearest real-world neighbors in the embedding space. If these real images were not annotated, they were prioritized for manual labeling. Both the worst-performing style-transferred images and the closest real counterparts were then added to the training set.
This iterative data selection process allowed us to efficiently identify the most informative training samples, significantly improving model performance while minimizing annotation effort. Over multiple iterations, the model achieved over 95% of its maximum performance using less than 50% of the annotated data volume typically required. Furthermore, this method ensured that new environmental conditions, such as lighting changes or object arrangements, were incorporated into the training process as needed, enabling the model to generalize to unseen scenarios.
The combination of style transfer, embedding-based similarity analysis, and targeted data selection forms a cost-effective, scalable approach for domain adaptation. It supports faster convergence, greater robustness across variable warehouse conditions, and ultimately reduces reliance on extensive manual data labeling.
5. Continuity Tracking and World Model
While the YOLO model effectively detects objects within individual camera views, comprehensive warehouse monitoring requires an integrated understanding of all detected objects across multiple cameras to interpret their spatial relationships and interactions. To achieve this goal, we introduce the world model, a custom-developed module specifically designed to address the problem. The primary goal of the world model is to interpret AI detections from each camera and use them for precise asset identification, multi-camera tracking, and real-time operational awareness. This section describes the world model concept and how it supports continuous tracking across the warehouse.
5.1. World Model Representation
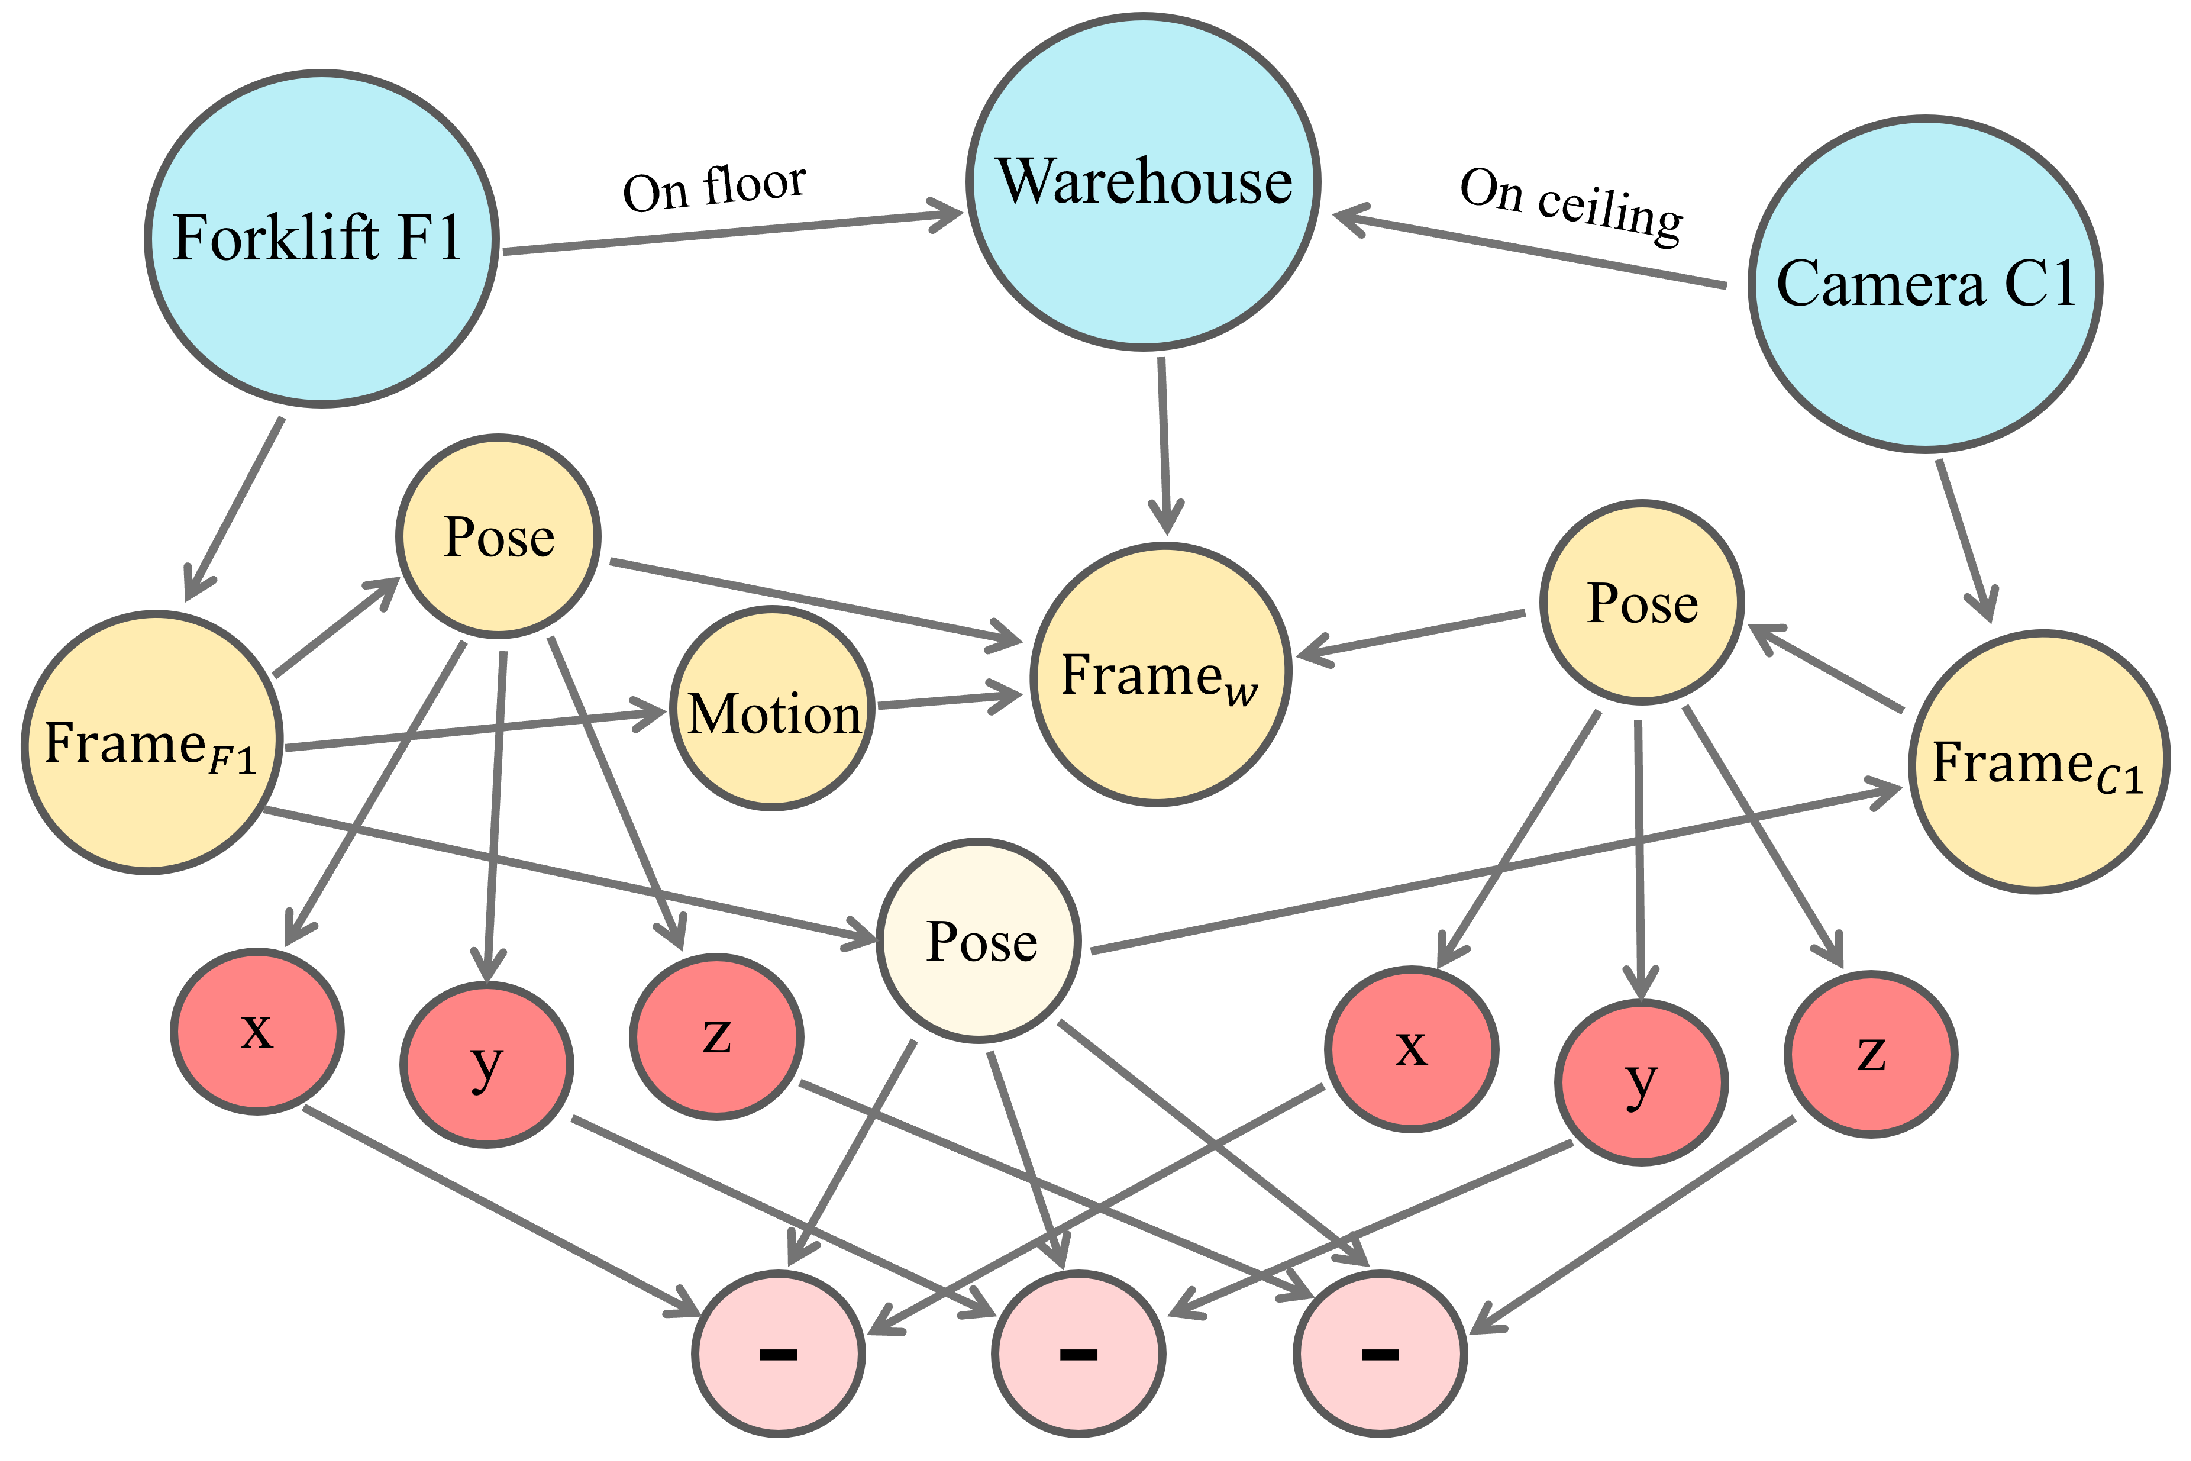
The world model is a layered abstraction of the physical environment that represents both the semantic identity and geometric state of all relevant objects (
Figure 10). It uses a graph-based structure in which entities (such as forklifts, racks, or pallets) are represented as nodes, and spatial, kinematic, and logical relationships between them are represented as labeled edges.
This graph is organized into three layers:
Semantic Layer: Encodes high-level object types and categorical relationships between entities (e.g., “is-a”, “part-of”).
Geometric Layer: Describes the spatial configuration of objects, including relative positions and orientations.
Mathematical Layer: Contains symbolic variables that represent unknown quantities (e.g., coordinates, velocities) and expresses dependencies between them.
Each object in the environment has a reference frame associated with it, and spatial transformations (poses) describe how to move between frames. These transformations consist of a 3D rotation matrix
and a translation vector
, forming a rigid-body transformation:
To compute the pose of one object relative to another, the world model traverses chains of transformations in the graph:
These operations are symbolic and maintain analytical differentiability.
Unknown quantities such as object positions and velocities are represented symbolically and form the latent world state vector . Observations from sensors (e.g., bounding boxes or marker detections) are denoted , and the system defines a forward observation model , where is the expected measurement given a state. This model is constructed automatically from the graph through the composition of spatial transformations and projection equations.
5.2. Continuous Tracking with a Kalman Filter
To enable robust temporal tracking, a separate Kalman Filter is used per object to estimate the unknowns in their geometric states. This estimator maintains a belief over each object’s state
and updates it continuously using a predict–update cycle [
28].
In the prediction step, the object’s motion is estimated using a dynamic model, corresponding to the object’s expected motion:
Here, is the predicted state, is the predicted covariance, is the Jacobian of the motion model , and is the process noise covariance.
In the correction step, new sensor data is integrated. The innovation is calculated using the following:
The innovation covariance
and Kalman gain
are computed using the observation model Jacobian
:
The state and covariance are updated as follows:
This enables the continuous tracking of dynamic entities such as forklifts, even when they temporarily leave the field of view.
5.3. Multi-Camera Tracking and Object Identification
Multi-camera tracking requires associating observations of the same object seen from different viewpoints. The world model enables this by transforming all observations into a common reference frame using chained transformations: computing the expected measurement and its innovation covariance for camera (property of the detection) and the individual states of objects , evaluated for the detection’s time stamp .
Each new detection is compared to its predicted value from each individual existing object using the Mahalanobis distance:
where
is the innovation covariance. If a detection matches no existing predictions (i.e., if the mahalanobis distances are all above a predefined threshold), it is registered as a new object. Mutual exclusion constraints are applied to avoid duplicate associations in the same frame.
Additional semantic features such as object class (e.g., “pallet”, “forklift”) or marker IDs (e.g., ArUco tags) [
29] are used to disambiguate between objects in cluttered scenes. Stale entries are removed after a timeout period if not reobserved, ensuring that the model remains efficient.
To improve robustness under challenging warehouse conditions, such as low lighting or clutter, the system employs motion models for each asset. The motion model can be selected according to the object class of the asset it is linked to (e.g., with different maximum speeds, turning ratios, or mechanical models). These models help maintain tracking even in the presence of occasional false detections. Although incorrect data associations can still occur, the current system does not yet implement logic to correct the tracking history automatically. This limitation can be addressed in future work by incorporating hypothesis tracking in the world model, maintaining multiple candidate associations when uncertainty is high and committing to a decision only when sufficient evidence is available.
5.4. Digital Twin Data Logging
To support real-time visualization and historical querying, the world model is linked to a digital twin framework. Sensor updates and estimated states are streamed to a context broker and logged in a database, as shown in
Figure 11.
Each object is stored as a digital entity with semantic attributes and spatial relationships. The structure supports graph queries to retrieve object locations, interaction history, or semantic classifications over time. This enables warehouse operators to monitor conditions, analyze past events, and optimize asset flow.
6. Beyond Standard Detection
The YOLO model enables real-time instance segmentation, and its detections are tightly integrated into the warehouse World Model to contextualize object positions within a global warehouse frame. This fusion enables spatial reasoning and 3D localization that extend beyond traditional detection. We present two advanced computer vision tasks enabled by this integration: pallet-layer estimation and zone-based activity monitoring.
6.1. Pallet-Layer Estimation
In multi-level storage racks, the accurate layer (or bin) identification of a pallet is critical for warehouse automation. We introduce a vision–geometry fusion method to estimate the vertical placement of goods using ceiling-mounted cameras.
The warehouse world model provides a geometric projection from 3D rack coordinates to each camera’s 2D pixel frame using known extrinsic calibration and projective transformations. Each bin is defined as a polygonal region in image space, representing the 2D projection of 3D bin boundaries. These pixel-level bin masks are used as a geometric prior.
When a pallet is placed or removed, YOLO detects the object and outputs a segmentation mask
corresponding to the object’s visible contour. To estimate which bin the pallet belongs to, we compute the centroid
of the following mask:
Then, for each bin polygon
, we compute a score that indicates whether the point
lies inside the polygon. This is achieved using a simple binary inclusion test, which assigns a value of 1 if the point is contained in the region and 0 otherwise:
or more robustly,
The bin with the highest score is selected as the placement bin. Because each bin is associated with a known height, this automatically infers the vertical layer of the pallet.
This method offers pixel-accurate bin classification without relying on 3D sensing hardware, leveraging spatial priors and image segmentation.
6.2. Zone-Based Activity Monitoring
To monitor dynamic warehouse processes like loading, unloading, or staging, we define zones of interest as polygonal regions in image space. These zones are annotated manually or extracted from the world model. Each zone is associated with a class list of interest (e.g., “pallet”).
Let
be the binary mask of the zone and
the set of binary masks for detected objects of relevant classes. We compute the union mask as follows:
Then, the occupancy ratio is computed as follows:
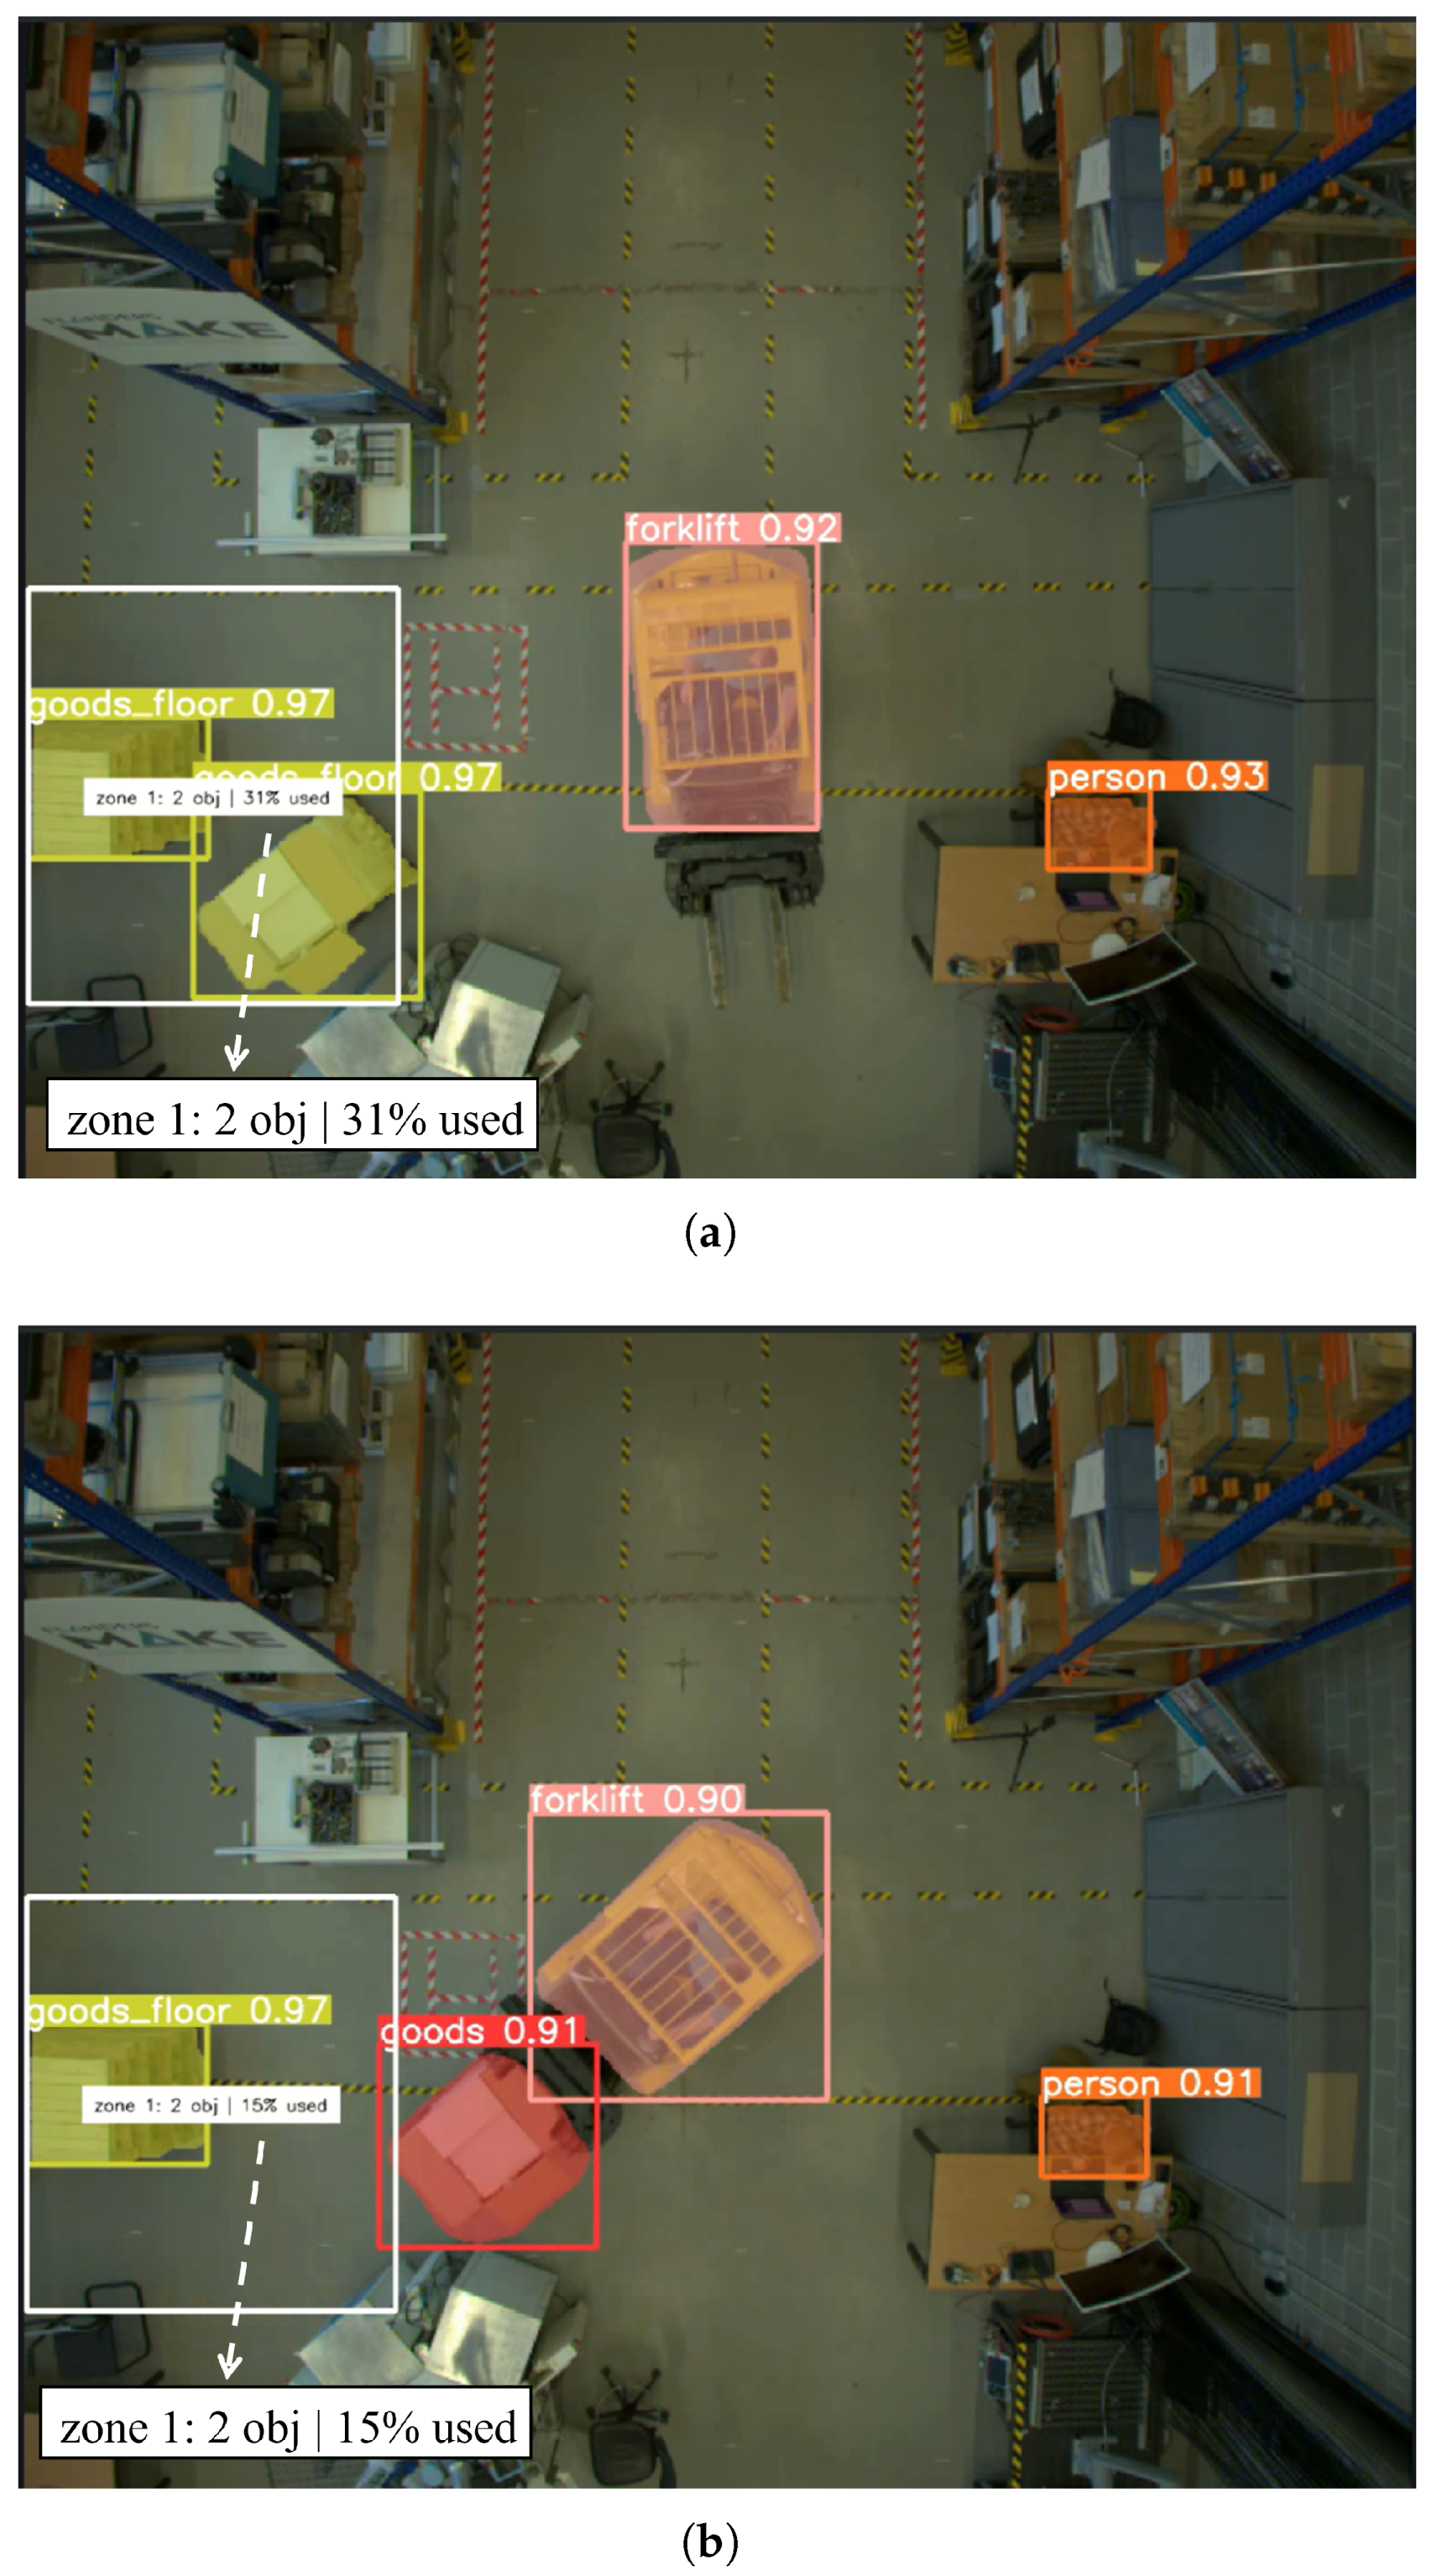
This metric allows the real-time monitoring of zone utilization. When no relevant objects are detected, the occupancy score smoothly transitions back to zero, reflecting cleared space.
Figure 12 shows the dynamic update of zone occupancy in response to forklift operations.
6.3. Other Potential Applications
The following applications can be achieved using the same vision–geometry integration principles:
- (1)
Forklift Distance Estimation By continuously tracking the projected 2D position of forklifts in each frame and converting it to world coordinates via the camera’s extrinsics, the system can integrate the trajectory length to estimate the total driven distance:
This provides fleet management metrics without requiring GPS or wheel encoders.
- (2)
Pallet Traceability The system maintains a per-object identifier and world position history. When a pallet is detected, its location is updated in the world model. If an object disappears and reappears, it can be matched via re-identification in the image and world space, enabling the retroactive tracing of lost items.
- (3)
Traffic Flow Analysis By aggregating trajectories of people and vehicles over time, heatmaps and flow models can be constructed. These are useful for identifying bottlenecks, high-activity areas, and safety violations. Time-sliced density estimates allow the analysis of warehouse dynamics during different shifts or operations.
- (4)
Future Extensions Using these geometric capabilities, the system could be extended to perform predictive modeling (e.g., ETA of deliveries), unsafe proximity alerts (e.g., forklifts near pedestrians), or resource utilization optimization.
Figure 12.
Loading bay occupancy analysis. (a) Two objects occupying 31% of the loading bay. (b) Updated state after a forklift removes one object, reducing the occupancy rate to 15%.
Figure 12.
Loading bay occupancy analysis. (a) Two objects occupying 31% of the loading bay. (b) Updated state after a forklift removes one object, reducing the occupancy rate to 15%.
7. Experiment Validation
In this section, we present a validation of our ceiling-mounted camera approach for real-time warehouse monitoring, integrating AI detection and the world model. Experiments were conducted in two distinct warehouse scenarios to evaluate the system’s feasibility and performance. Additionally, we compare the distributed and centralized deployment strategies in real-world conditions, highlighting their respective advantages and limitations.
7.1. Validation in Distributed Architecture
We deployed the distributed architecture in the Flanders Make warehouse lab in Leuven, as depicted in
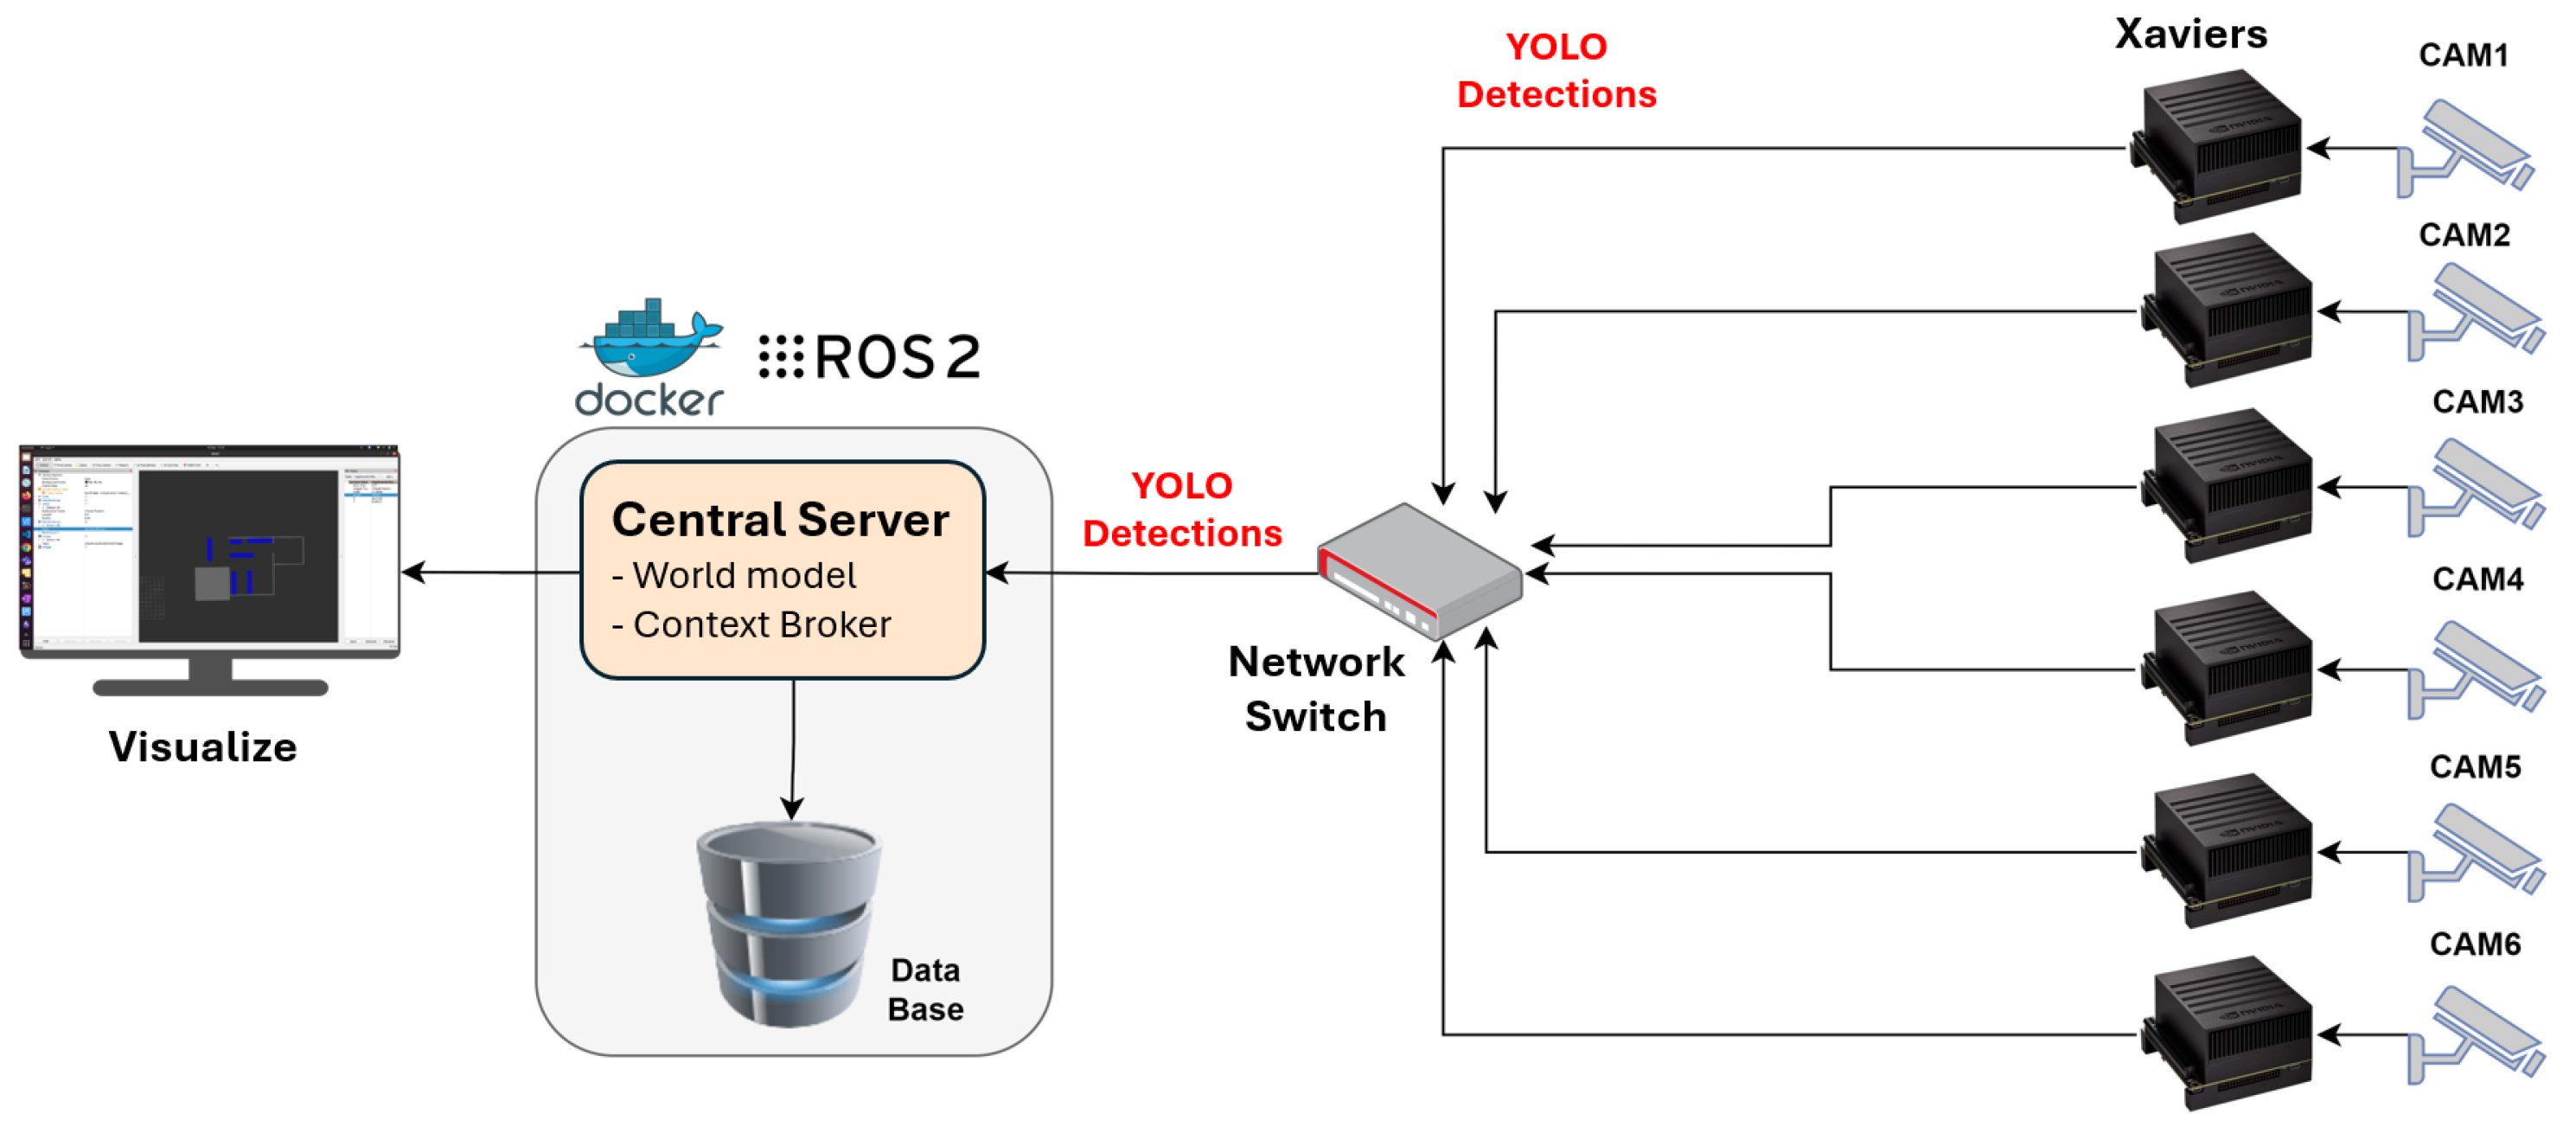
Figure 4. This setup consists of six ceiling-mounted cameras, each paired with an NVIDIA Jetson AGX Xavier device for local processing. Each camera continuously captures video frames, which are fed directly to the corresponding Xavier device running the YOLOv8 model, i.e., video frames are processed locally. Each Xavier device then publishes YOLO detection results as ROS2 messages over the network. A central server, hosting both the World Model and ROS2 within a Docker Compose setup, subscribes to these ROS2 messages, aggregating detection results from all cameras. The World Model interprets these detections to provide a unified, real-time view of warehouse activity. For historical analysis, all processed data are stored in a database. The architecture design is shown in
Figure 13.
During experiments, we simulated typical warehouse activities by having individuals walk through various camera views, some with a pallet jack, to mimic operator behavior. The tracking visualization was performed in Rviz2, where each camera’s field of view and the warehouse map were displayed side by side. When a new object is detected or tracked, a corresponding cube appears on the map, representing the object’s position. As individuals move through different camera views, tracking remains seamless due to the continuous state updates by the world model.
A snapshot of the experiments is shown in
Figure 14. The system successfully identifies and tracks six objects across two camera frames, while only five unique objects are shown on the map. This is because one person was detected by two cameras simultaneously, but the world model’s data association mechanism successfully identified these as a single object. Moreover, adding a Kalman filtering to the world model also ensures smoother tracking as objects move between camera views.
7.2. Validation in Centralized Architecture
We deployed the centralized architecture in the Flanders Make warehouse lab in Lommel, Belgium, as depicted in
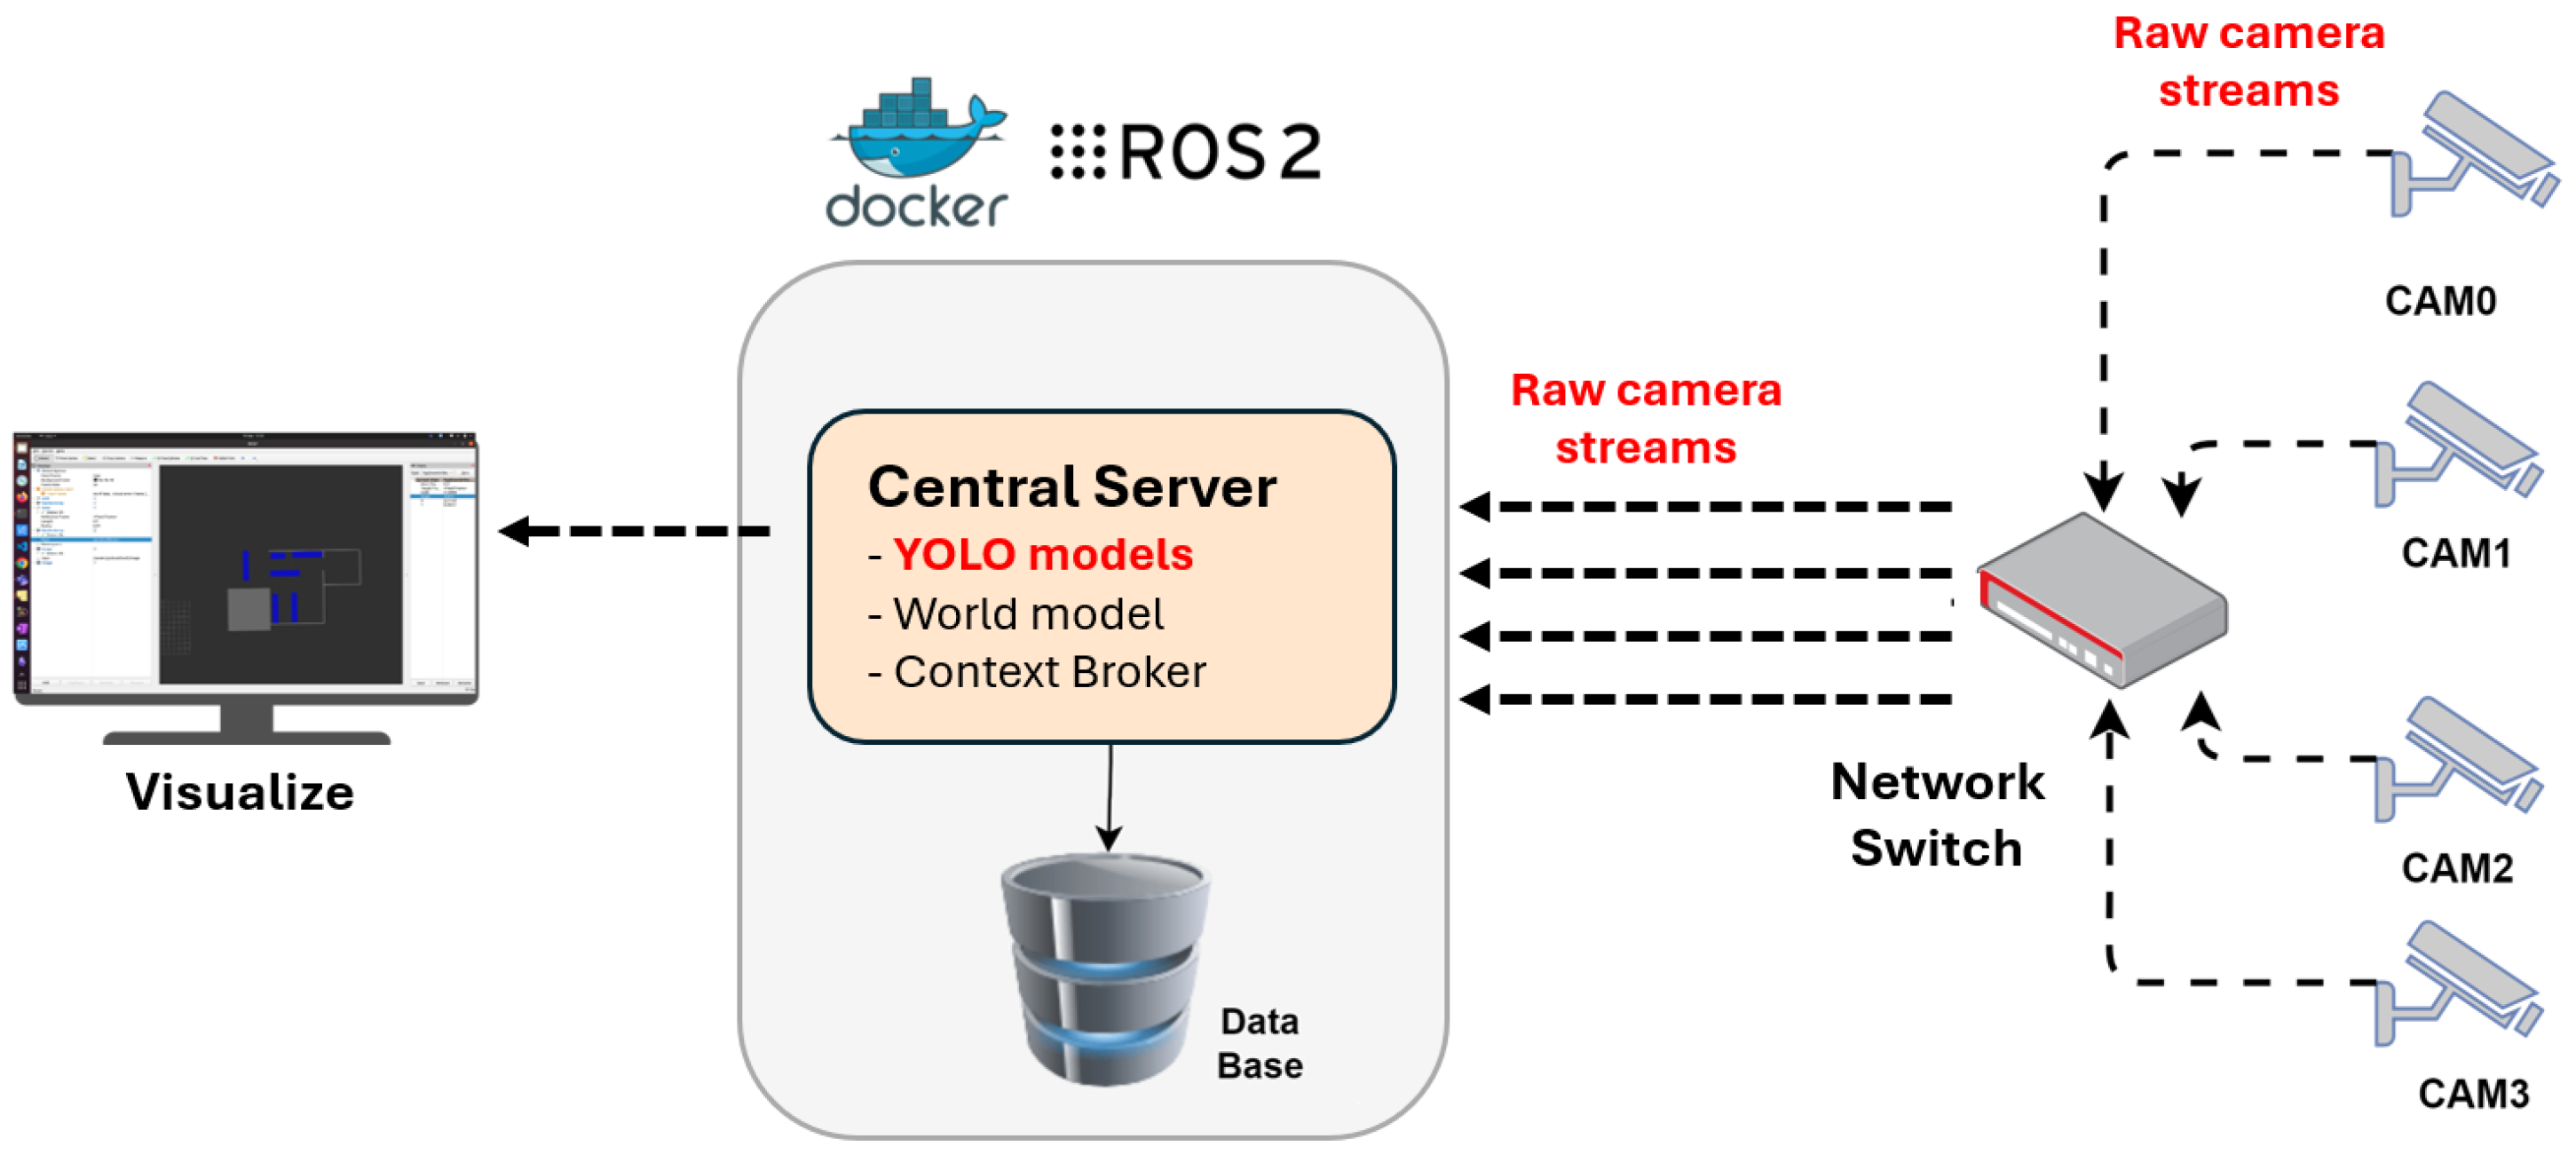
Figure 15. This setup consists of four Basler cameras, each continuously capturing video feeds and transmitting them to a high-performance central server. The server, equipped with a reliable network interface and substantial computing resources, processes all video feeds locally. Both the world model and ROS2 are deployed on this central server using Docker Compose.
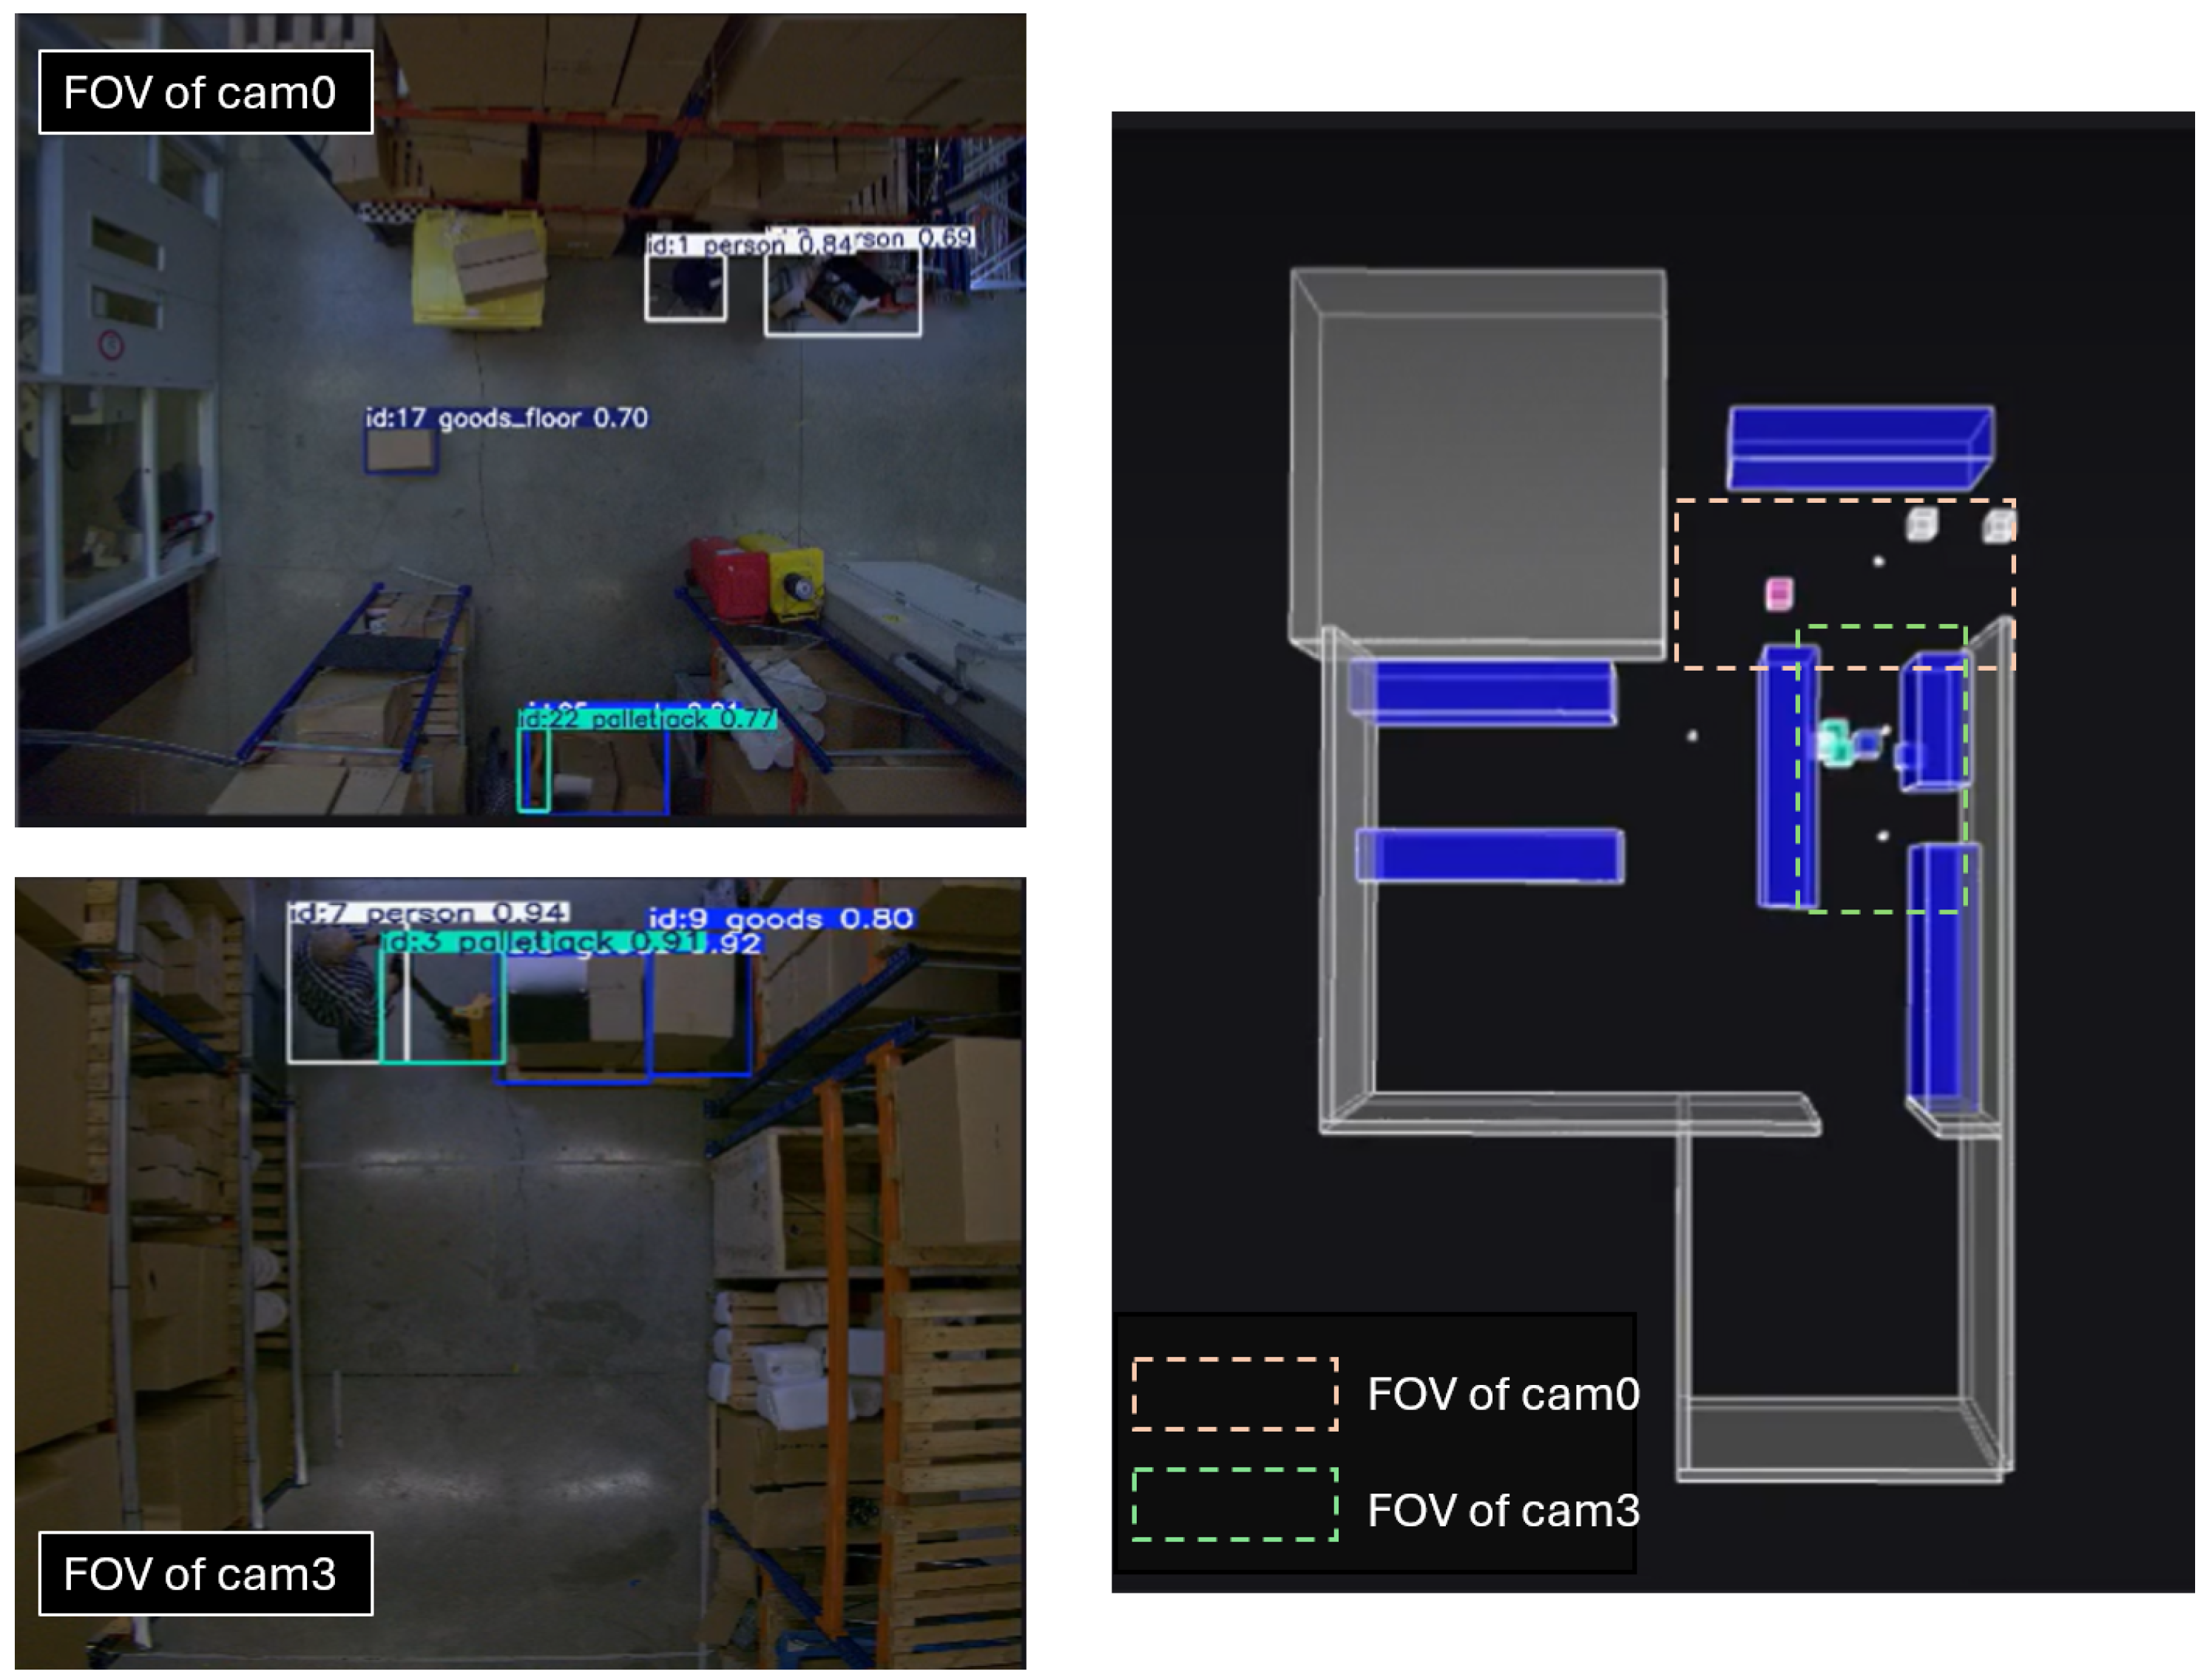
During experiments, individuals moved through different camera views while transporting goods with pallet jacks. The system demonstrated robust detection capabilities, accurately identifying people, pallets, and goods even in cases of partial occlusion. The world model also successfully identified and tracked these objects across overlapping fields of view, ensuring that no duplicates appeared in the output even when events were captured by multiple cameras (e.g., camera 0 and camera 3). A snapshot of the experiment is shown in
Figure 16.
7.3. Model Deployment Evaluation and Validation
Deploying YOLOv8 in a real-world warehouse scenario requires careful evaluation of infrastructure-specific deployment architectures, specifically regarding how images are transmitted from cameras to servers and where the YOLO model runs. Our findings and experiences during implementing these two architectures are detailed below:
Distributed Edge Processing Architecture: In this setup, the YOLO model is running on edge devices, with detection results sent to a central server for data logging and further analysis. By transmitting only detection results rather than raw video, this arrangement minimizes network load, reducing bandwidth requirements and enabling low-latency, real-time processing. However, this approach incurs higher hardware costs, as multiple Jetson devices or similar edge computing units are required. Additionally, edge devices may eventually lack support for the latest frameworks, which can complicate system upgrades and long-term maintenance.
Centralized Processing Architecture: In this setup, video feeds from all cameras are transmitted to a high-performance central computer. This configuration simplifies maintenance and upgrades, allowing for GPU enhancements as needed. However, transmitting high-resolution video streams from multiple cameras requires substantial network infrastructure to avoid bottlenecks, which could impact scalability and latency. To mitigate processing overhead, batching video frames—grouping multiple frames together before feeding them into the YOLO model—is recommended. However, this method sacrifices real-time object-tracking capabilities, as batching introduces delays that disrupt the continuous analysis required for frame-to-frame tracking.
Figure 16.
Experimental validation in the Lommel warehouse (centralized architecture). The world model successfully identifies and tracks objects across overlapping camera views, with items such as persons, pallets, and goods detected accurately even under partial occlusion.
Figure 16.
Experimental validation in the Lommel warehouse (centralized architecture). The world model successfully identifies and tracks objects across overlapping camera views, with items such as persons, pallets, and goods detected accurately even under partial occlusion.
The YOLOv8 Nano model enables real-time inferences even on relatively low-resource hardware, with requirements specified in [
30], while the world model is not computationally intensive, as it only processes detection outputs. Currently, one YOLO model is run per camera, but performance in low-resource environments could be further improved through optimizations such as TensorRT compilation [
31] or batching inference [
32] across multiple camera feeds. These strategies reduce computational load while maintaining real-time performance.
When scaling to larger warehouse environments, both hardware and software considerations are important. Hardware scaling includes adding cameras, deploying additional edge devices, or upgrading central server GPUs, while ensuring sufficient network bandwidth for multiple video streams. On the software side, retraining the AI model is only necessary when detecting new object types, whereas changes in warehouse layout (e.g., rack reorganization) require only updating the world model. For long-term operation, routine maintenance of cameras, edge devices, and servers is essential.
Therefore, designing a smart warehouse architecture necessitates balancing the advantages of each deployment strategies with considerations of operational priorities, budget constraints, and network capabilities, as discussed in this subsection.
7.4. Tracking Performance Evaluation
To assess the robustness of the world model in a distributed edge-processing setup, we conducted a controlled scenario in which four moving assets, two individuals on foot and one individual operating a palletjack, were simultaneously active within the warehouse environment. The assets were observed by overhead ceiling-mounted cameras, and detections were generated in real time using the AI model.
Over the course of the scenario, a total of 6731 detections were produced. These detections were fed into the world model for data association and multi-camera tracking. The expected output was four unique object tracks, corresponding to the ground-truth number of mobile entities.
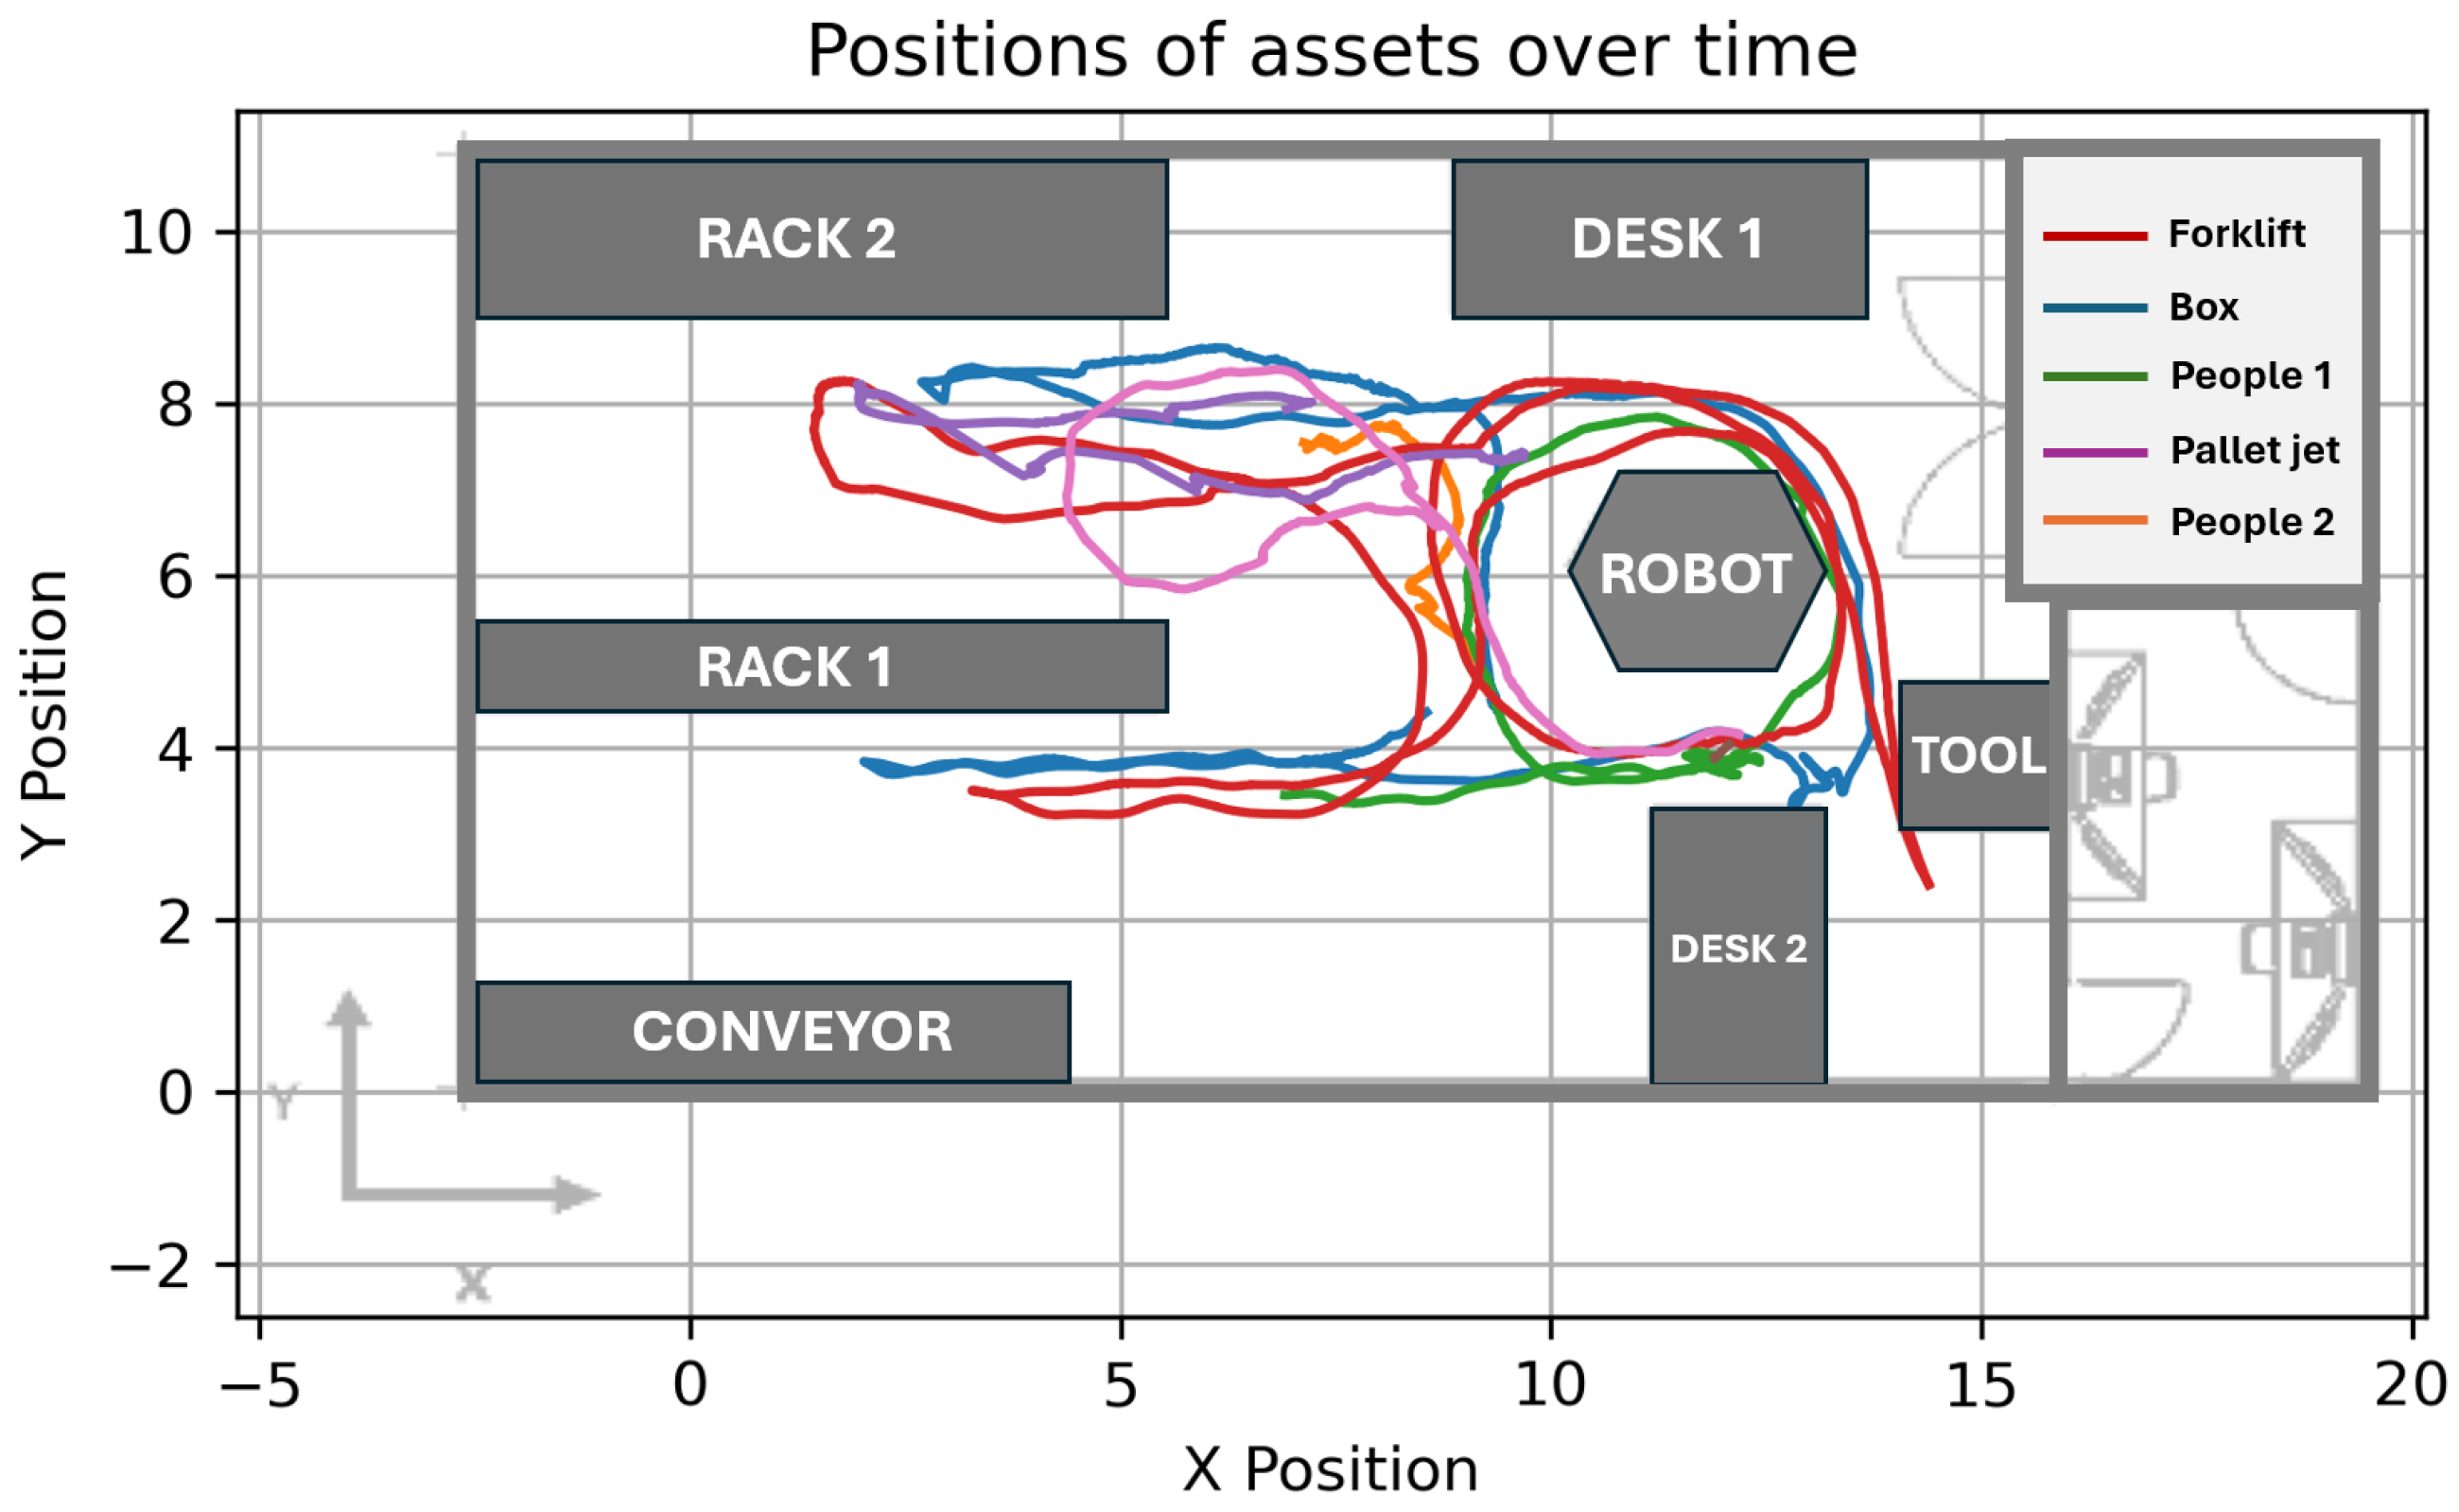
Figure 17 visualizes the sample tracking outputs generated by the world model during this evaluation.
The tracking results are summarized as follows:
In 84% of the frames, the world model correctly identified and maintained all four active tracks.
In 11% of the frames, the system underestimated the number of objects, maintaining only three active tracks, typically due to brief detection dropouts.
In 5% of the frames, the model temporarily overestimated the number of tracks, reporting five distinct entities. These false positives were generally short-lived and resolved via the model’s internal pruning logic.
These results demonstrate that the world model achieves high-accuracy tracking even under real-time constraints and partial observability conditions in a distributed edge architecture.
8. Conclusions
In this paper, we presented a real-time warehouse monitoring system that integrates ceiling-mounted cameras, AI object detection, and a world model for asset tracking and scene analysis. The experimental results demonstrated the system’s effectiveness, achieving 84% accuracy in detecting and tracking objects such as people, pallets, and goods even under occlusion and overlapping camera fields of view.
The contributions of this study are fourfold. We developed a camera placement evaluation tool that enables comprehensive coverage analysis and visualization, allowing warehouse operators to assess configurations with clear visual feedback. We introduced a hybrid AI training methodology that leverages both real-world and synthetic simulation data, enhanced with style transfer and active learning to mitigate the domain gap. We proposed a novel world model framework that transforms object detections into warehouse intelligence by capturing temporal relationships and multi-view correlations, thereby enabling activity-level understanding. Finally, we designed and validated two scalable system architectures, centralized and distributed, tailored to different operational contexts and constraints.
Despite its effectiveness, the proposed system has several limitations. First, the current implementation relies on ceiling-mounted cameras, which may not be suitable for all warehouse layouts. Second, performance may degrade under challenging conditions such as dense object congestion and poorly illuminated areas, both of which reduce the accuracy of AI-based detection models. Third, although rare, incorrect data associations can occur under extreme warehouse conditions, and the current system does not include a mechanism for recovering from such tracking errors.
Future work will therefore focus on three directions: (1) validating the system at larger scales and in more diverse industrial environments, (2) developing recovery strategies within the World Model to handle data association errors, and (3) enhancing robustness under challenging conditions through improved sensing and model adaptation techniques.
Author Contributions
Conceptualization, J.C., A.B.-T., and J.-E.B.; world model research, P.D.C. and S.V.D.V.; simulation research, C.V.; AI research, S.S., J.C., and N.B.; architecture, A.B.-T., J.-E.B., and M.B.; data management and pipeline, M.D. and M.B.; validation, E.R. and M.M. All authors have read and agreed to the published version of this manuscript.
Funding
This research was supported by Flanders Innovation & Entrepreneurship (VLAIO) and conducted as part of the VILICON project RETAIN (Real-Time Automatic Inventory, HBC.2023.0036), carried out within the framework of Flanders Make. Flanders Make is the strategic research center for the Flemish manufacturing industry.
Institutional Review Board Statement
Not applicable.
Informed Consent Statement
Not applicable.
Data Availability Statement
The data presented in this study are not publicly available due to privacy and confidentiality agreements, as they include identifiable human faces and proprietary company assets.
Acknowledgments
The authors would like to thank all co-authors for their valuable contributions and the company involved in the project for their support and collaboration.
Conflicts of Interest
The authors declare no conflicts of interest.
Abbreviations
The following abbreviations are used in this manuscript:
| IOT | Internet of Things |
| WSNs | Wireless Sensor Networks |
| CycleGAN | Cycle-Consistent Generative Adversarial Network |
| CLIP | Contrastive Language–Image Pretraining |
| RGB | Red, green, Blue |
| RFID | Radio Frequency Identification |
| RTLS | Real-Time Location System |
| AGV | Automated Guided Vehicle |
| AI | Artificial Intelligence |
| CV | Computer Vision |
| HTML | HyperText Markup Language |
| FOV | Field of View |
| CNN | Convolutional Neural Network |
| YOLO | You Only Look Once |
| mAP | Mean Average Precision |
| IoU | Intersection Over Union |
| ROS | Robot Operating System |
References
- Zhen, L.; Li, H. A Literature Review of Smart Warehouse Operations Management. Front. Eng. Manag. 2022, 9, 31–55. [Google Scholar] [CrossRef]
- Grand View Research, Inc. Autonomous Forklift Market Size and Trends, 2030. 2025. Available online: https://www.grandviewresearch.com/industry-analysis/autonomous-forklift-market-report (accessed on 18 July 2025).
- Motroni, A.; Buffi, A.; Nepa, P. Forklift Tracking: Industry 4.0 Implementation in Large-Scale Warehouses through UWB Sensor Fusion. Appl. Sci. 2021, 11, 10607. [Google Scholar] [CrossRef]
- Zhang, X.; Tan, Y.C.; Tai, V.C.; Hao, Y. Indoor Positioning System for Warehouse Environment: A Scoping Review. J. Mech. Eng. Sci. 2024, 18, 10350–10381. [Google Scholar] [CrossRef]
- Thiede, S.; Sullivan, B.; Damgrave, R.; Lutters, E. Real-time Locating Systems (RTLS) in Future Factories: Technology Review, Morphology and Application Potentials. Procedia CIRP 2021, 104, 671–676. [Google Scholar] [CrossRef]
- Nagy, G.; Bányainé Tóth, Á.; Illés, B.; Varga, A.K. The impact of increasing digitization on the logistics industry and logistics service providers. Multidiszcip. Tudományok 2023, 13, 19–29. [Google Scholar] [CrossRef]
- Xie, T.; Yao, X. Smart logistics warehouse moving-object tracking based on YOLOv5 and DeepSORT. Appl. Sci. 2023, 13, 9895. [Google Scholar] [CrossRef]
- Yudanto, R.; Cheng, J.; Hostens, E.; Van der Wilt, M.; Vande Cavey, M. Ultra-wideband localization: Advancements in device and system calibration for enhanced accuracy and flexibility. IEEE J. Indoor Seamless Position. Navig. 2023, 1, 242–253. [Google Scholar] [CrossRef]
- Wawrla, L.; Maghazei, O.; Netland, T. Applications of Drones in Warehouse Operations. Whitepaper 2019, 212, 1–12. [Google Scholar]
- Kessler, R.; Melching, C.; Goehrs, R.; Gómez, J.M. Using Camera-Drones and Artificial Intelligence to Automate Warehouse Inventory. In Proceedings of the AAAI-MAKE 2021: Combining Machine Learning and Knowledge Engineering; Martin, A., Hinkelmann, K., Fill, H.G., Gerber, A., Lenat, D., Stolle, R., van Harmelen, F., Eds.; CEUR Workshop Proceedings: Palo Alto, CA, USA, 2021; Volume 2846. Available online: https://ceur-ws.org/Vol-2846/paper38.pdf (accessed on 18 July 2025).
- Tubis, A.A.; Ryczyński, J.; Żurek, A. Risk Assessment for the Use of Drones in Warehouse Operations in the First Phase of Introducing the Service to the Market. Sensors 2021, 21, 6713. [Google Scholar] [CrossRef] [PubMed]
- Malang, C.; Charoenkwan, P.; Wudhikarn, R. Implementation and Critical Factors of Unmanned Aerial Vehicle (UAV) in Warehouse Management: A Systematic Literature Review. Drones 2023, 7, 80. [Google Scholar] [CrossRef]
- Intermodalics, bv. Indoor Visual Positioning. 2025. Available online: https://www.intermodalics.ai/indoor-visual-positioning (accessed on 18 July 2025).
- IdentPro GmbH. Real-Time Localization with Manned Forklifts. 2023. Available online: https://www.identpro.de/en/real-time-localization-with-manned-forklifts/ (accessed on 18 July 2025).
- Essensium bv. PalletTrack: Comprehensive Pallet Flow Tracking. 2025. Available online: https://essensium.com/pallettrack/ (accessed on 18 July 2025).
- BlooLoc bv. BlooLoc yooBeeEYE: Real-Time Warehouse Location Mapping. 2025. Available online: https://www.blooloc.com/en (accessed on 18 July 2025).
- Logivations GmbH. Forklift Onboard Camera—Real-Time Barcode and Label Recognition. 2025. Available online: https://www.logivations.com/solutions/goods-recognition/forklift-onboard-camera/ (accessed on 18 July 2025).
- Halawa, F.; Dauod, H.; Lee, I.G.; Li, Y.; Yoon, S.W.; Chung, S.H. Introduction of a Real Time Location System to Enhance the Warehouse Safety and Operational Efficiency. Int. J. Prod. Econ. 2020, 224, 107541. [Google Scholar] [CrossRef]
- Di Capua, M.; Ciaramella, A.; De Prisco, A. Machine Learning and Computer Vision for the Automation of Processes in Advanced Logistics: The Integrated Logistic Platform (ILP) 4.0. Procedia Comput. Sci. 2023, 217, 326–338. [Google Scholar] [CrossRef]
- Logivations GmbH. AI-Based Real Time Location and Recognition System (AI-RTLS). 2025. Available online: https://www.logivations.com/solutions/visual-identification-and-localization-camera-rtls/ (accessed on 18 July 2025).
- Specker, A. OCMCTrack: Online Multi-Target Multi-Camera Tracking with Corrective Matching Cascade. In Proceedings of the IEEE/CVF Conference on Computer Vision and Pattern Recognition Workshops (CVPRW), Seattle, WA, USA, 16–22 June 2024; AI City Challenge Workshop. pp. 7236–7244. [Google Scholar]
- Jansen, W.; Verreycken, E.; Schenck, A.; Blanquart, J.E.; Verhulst, C.; Huebel, N.; Steckel, J. COSYS-AIRSIM: A Real-Time Simulation Framework Expanded for Complex Industrial Applications. In Proceedings of the 2023 Annual Modeling and Simulation Conference (ANNSIM), Hamilton, ON, Canada, 23–26 May 2023; pp. 37–48. [Google Scholar]
- Terven, J.; Córdova-Esparza, D.M.; Romero-González, J.A. A comprehensive review of yolo architectures in computer vision: From yolov1 to yolov8 and yolo-nas. Mach. Learn. Knowl. Extr. 2023, 5, 1680–1716. [Google Scholar] [CrossRef]
- Mahjourian, N.; Nguyen, V. Multimodal object detection using depth and image data for manufacturing parts. arXiv 2024, arXiv:2411.09062. [Google Scholar] [CrossRef]
- Vijayakumar, A.; Vairavasundaram, S. Yolo-based object detection models: A review and its applications. Multimed. Tools Appl. 2024, 83, 83535–83574. [Google Scholar] [CrossRef]
- Segments.ai. Segments.ai: Multi-Sensor Data Labeling Platform for Computer Vision. 2025. Available online: https://segments.ai/ (accessed on 29 July 2025).
- Chu, C.; Zhmoginov, A.; Sandler, M. Cyclegan, a master of steganography. arXiv 2017, arXiv:1712.02950. [Google Scholar] [CrossRef]
- Wan, E.A.; Van Der Merwe, R. The unscented Kalman filter for nonlinear estimation. In Proceedings of the IEEE 2000 Adaptive Systems for Signal Processing, Communications, and Control Symposium (Cat. No. 00EX373), Lake Louise, AB, Canada, 1–4 October 2000; pp. 153–158. [Google Scholar]
- Kalaitzakis, M.; Cain, B.; Carroll, S.; Ambrosi, A.; Whitehead, C.; Vitzilaios, N. Fiducial markers for pose estimation: Overview, applications and experimental comparison of the artag, apriltag, aruco and stag markers. J. Intell. Robot. Syst. 2021, 101, 71. [Google Scholar] [CrossRef]
- Ultralytics YOLOv8 FAQ. Available online: https://docs.ultralytics.com/help/FAQ/ (accessed on 8 October 2025).
- NVIDIA. TensorRT Developer Guide. Available online: https://docs.nvidia.com/deeplearning/tensorrt/developer-guide/index.html (accessed on 8 October 2025).
- Fowler, J.W.; Mönch, L. A survey of scheduling with parallel batch (p-batch) processing. Eur. J. Oper. Res. 2022, 298, 1–24. [Google Scholar] [CrossRef]
Figure 1.
Methodology overview of a smart warehouse.
Figure 1.
Methodology overview of a smart warehouse.
Figure 2.
Example of the user interface of the camera placement tool for adding walls, placing obstacles, and setting camera parameters. The bottom-right section visualizes the sandbox environment in Unreal Engine based on the chosen setup.
Figure 2.
Example of the user interface of the camera placement tool for adding walls, placing obstacles, and setting camera parameters. The bottom-right section visualizes the sandbox environment in Unreal Engine based on the chosen setup.
Figure 3.
Top-view visualization showing camera coverage across the warehouse. Each color represents the area covered by a specific camera, with statistics on individual camera coverage shown in the legend. The dashed red box indicates an uncovered area with no current camera coverage, and total area coverage is 98.81%.
Figure 4.
Layout of the warehouse and camera positioning setup.
Figure 4.
Layout of the warehouse and camera positioning setup.
Figure 5.
Simulated model of the real warehouse depicted in
Figure 4, created to replicate real-world conditions for synthetic data generation. The bottom row displays the field of view from various simulated cameras.
Figure 5.
Simulated model of the real warehouse depicted in
Figure 4, created to replicate real-world conditions for synthetic data generation. The bottom row displays the field of view from various simulated cameras.
Figure 6.
Object detection in the warehouse. (a) The model identifies common objects such as forklifts and goods on the floor and those being transported by a forklift. (b) Detection of personnel within the warehouse.
Figure 6.
Object detection in the warehouse. (a) The model identifies common objects such as forklifts and goods on the floor and those being transported by a forklift. (b) Detection of personnel within the warehouse.
Figure 7.
Precision–recall curve for the trained YOLO model, showing an mAP of 0.970 at IoU 0.5 across all classes.
Figure 7.
Precision–recall curve for the trained YOLO model, showing an mAP of 0.970 at IoU 0.5 across all classes.
Figure 8.
Style transfer applied to synthetic data representative of two of our warehouses.
Figure 8.
Style transfer applied to synthetic data representative of two of our warehouses.
Figure 9.
Visualization of the projection of the different datasets in the embedding space. Average of real-to-synthetic image gap: 7.36; real-to-synthetic gap with style transfer: 5.96.
Figure 9.
Visualization of the projection of the different datasets in the embedding space. Average of real-to-synthetic image gap: 7.36; real-to-synthetic gap with style transfer: 5.96.
Figure 10.
Property graph representation with three layers of abstraction (shown with different colors). The lighter-colored nodes are derived from the rest of the graph using specialized graph operations. Not all nodes and edges are shown to enhance readability.
Figure 10.
Property graph representation with three layers of abstraction (shown with different colors). The lighter-colored nodes are derived from the rest of the graph using specialized graph operations. Not all nodes and edges are shown to enhance readability.
Figure 11.
Data pipeline for digital twin data logging.
Figure 11.
Data pipeline for digital twin data logging.
Figure 13.
Distributed architecture implemented for warehouse monitoring.
Figure 13.
Distributed architecture implemented for warehouse monitoring.
Figure 14.
Experimental validation in the Leuven warehouse (distributed architecture). The red arrows indicate two detections identified as a single object by the world model.
Figure 14.
Experimental validation in the Leuven warehouse (distributed architecture). The red arrows indicate two detections identified as a single object by the world model.
Figure 15.
Centralized architecture implemented for warehouse monitoring.
Figure 15.
Centralized architecture implemented for warehouse monitoring.
Figure 17.
Example tracking output from the world model. The colored tracks correspond to distinct mobile entities detected and tracked across the scene.
Figure 17.
Example tracking output from the world model. The colored tracks correspond to distinct mobile entities detected and tracked across the scene.
Table 1.
Training configuration for the YOLOv8 nanosegmentation model.
Table 1.
Training configuration for the YOLOv8 nanosegmentation model.
| Parameter | Value |
|---|
| Batch size | 16 |
| Initial learning rate | 0.01 with cosine annealing schedule |
| Training epochs | 200 |
| Input image size | 640 × 640 pixels |
| Data augmentation | Rotation, scaling, color jitter |
| Disclaimer/Publisher’s Note: The statements, opinions and data contained in all publications are solely those of the individual author(s) and contributor(s) and not of MDPI and/or the editor(s). MDPI and/or the editor(s) disclaim responsibility for any injury to people or property resulting from any ideas, methods, instructions or products referred to in the content. |
© 2025 by the authors. Licensee MDPI, Basel, Switzerland. This article is an open access article distributed under the terms and conditions of the Creative Commons Attribution (CC BY) license (https://creativecommons.org/licenses/by/4.0/).
