1. Introduction
Recent geopolitical conflicts, trade disruptions, and economic volatility have exposed hidden vulnerabilities and intensified longstanding challenges within global supply chains. In response, many U.S.-based manufacturers have increasingly adopted reshoring strategies, relocating production and services to the domestic market to reduce exposure to external risks and enhance supply chain resilience [
1]. However, this strategic shift has introduced new operational challenges: large enterprises must now identify and collaborate with regional partners in a timely manner to construct agile and reliable supply networks without compromising quality, responsiveness, or cost-efficiency [
2]. In this context, Small- and Medium-Sized Enterprises (SMEs), which are regarded as the backbone of the American economy, are increasingly recognized as essential contributors to the reshoring effort [
3]. Their agility, niche expertise, and geographic proximity make them ideal contributors to regionalized supply chains. Despite this, two persistent barriers have limited their integration: (i) Large enterprises often lack structured, searchable data on the capabilities and availability of local SMEs [
2], and (ii) Many SMEs lack the visibility and digital infrastructure needed to participate in complex supply networks [
4]. These challenges have hindered effective supplier discovery and slowed the localization of manufacturing and supply chain ecosystems.
Although recent research has advanced understanding of supply chain resilience and digitalization, most efforts have focused on large firms, global optimization, or simulation-based models [
5]. Few studies have developed practical, semantically enriched digital frameworks that make SMEs discoverable and interoperable within regional supply networks. Current approaches are typically limited to static supplier databases or survey-driven assessments, which lack the capacity to capture complex inter-enterprise relationships or to enable cross-platform integration. This leaves an urgent gap for scalable, machine-interpretable solutions that directly support SME integration into reshoring initiatives.
To bridge this gap, this work proposes a knowledge graph-based framework for representing SMEs and their inter-enterprise relationships within regional supply chains. In this framework, supply chain entities are modeled using a graph database and semantically enriched to form a knowledge graph, enabling machine-interpretable representation, relationship mapping, and contextual search functionality. The semantic layer facilitates structured querying, dynamic information retrieval, and improved interoperability across digital platforms. A proof-of-concept implementation was then conducted using enterprise data from the BioPharma sector in Pennsylvania (PA), a state in the U.S. with a high density of manufacturing SMEs [
6]. A dynamic search mechanism was developed, enabling multi-conditional, human-readable queries that support efficient exploration of complex supply chain relationships. These capabilities were shown to outperform conventional keyword-based search tools in both speed and precision. To ensure broader applicability, the knowledge graph was converted into the Resource Description Framework (RDF), a World Wide Web Consortium (W3C) standard, and further aligned with Schema.org vocabulary to enhance semantic consistency, interoperability and enable integration with web-based systems [
7].
In essence, this work addresses the following research gaps: (i) the absence of structured, semantically enriched representations of regional SMEs; (ii) limited mechanisms for querying complex inter-enterprise relationships; and (iii) a lack of interoperable frameworks to support data sharing across systems.
Accordingly, this study is guided by two research questions (RQ):
RQ1: How can SMEs and their relationships within a regional supply chain be effectively modeled using knowledge graphs to enhance dynamic information retrieval and discoverability?
RQ2: In what ways can semantic web technologies (such as RDF and Schema.org) improve the interoperability of SME data?
To investigate RQ1, a graph-based query mechanism was designed and implemented to support flexible, context-aware search for regional SME capabilities and connections. To address RQ2, semantic interoperability was validated through RDF serialization, Schema.org alignment, and cross-platform knowledge sharing scenarios.
The remainder of this paper is structured as follows:
Section 2 reviews related work on supply chain resilience, graph modeling, and knowledge representation.
Section 3 presents the methodology for knowledge graph construction, including data modeling, querying, validation, and implementation using Pennsylvania BioPharma data.
Section 4 extends this methodological framework by addressing semantic interoperability: covering RDF serialization, Schema.org alignment, and cross-platform validation.
Section 5 discusses key findings, implications, advantages and limitations.
Section 6 concludes with the main contributions and directions for future research.
2. Related Work and Motivation
Globalization and lean manufacturing have transformed supply chains into efficient yet vulnerable systems. To minimize costs and enhance responsiveness, firms increasingly rely on globally dispersed suppliers and maintain minimal inventories, making them highly susceptible to disruptions from natural disasters, geopolitical events, and pandemics [
8]. Such disruptions often propagate across interconnected networks, amplifying systemic risks [
9,
10,
11]. Limited visibility into upstream and downstream components further hampers timely response and recovery. Consequently, supply chain resilience, defined as the ability to resist, absorb, and recover from disruptions while maintaining essential functions, has emerged as a critical strategic capability [
9,
10,
11]. While strategies such as supplier diversification, localization, redundancy, and enhanced visibility have been proposed [
12,
13,
14], much of the literature remains theoretical or descriptive, with few scalable or empirically validated implementations [
5].
To capture the systemic nature of supply chains, researchers increasingly model them as complex networks, where entities are connected via material, information, or financial flows [
15]. Graph-based models allow representation of inter-dependencies, simulation of disruptions, and quantification of resilience. Approaches such as centrality analysis [
16,
17], agent-based modeling [
18], and shock propagation [
19] reveal vulnerabilities but remain largely conceptual, focusing on large enterprises while excluding small- and medium-sized enterprises (SMEs). This exclusion is problematic given SMEs’ growing role in resilient, regionalized manufacturing ecosystems.
SMEs are critical contributors to supply chain resilience, especially under the shift toward modular and platform-based manufacturing [
3,
12,
20,
21,
22]. However, SMEs often remain invisible in global sourcing platforms due to limited discoverability, outdated data, and lack of standardized representation. Platforms such as Wikidata [
23], Thomasnet [
24], Mergent Intellect [
25], and Dun & Bradstreet [
26] offer centralized repositories but suffer from incomplete data, poor update mechanisms, and limited query expressiveness. Wikidata requires SPARQL expertise, while commercial directories such as Thomasnet rely on keyword search, often yielding imprecise results. These barriers highlight the need for scalable, semantically rich frameworks that enhance SME visibility, enable dynamic querying, and support cross-platform integration.
Knowledge graphs offer a promising solution by enabling semantic modeling of enterprise capabilities, relationships, and context. They support interoperability with standards such as RDF and Schema.org and allow multi-conditional querying that can surface hidden connections. Recent research has begun to explore knowledge graphs in supply chains, but most contributions remain partial or domain generic. For example, Zhou et al. [
27] proposed a supply chain knowledge graph for market convergence prediction, employing representation learning to infer macro-level trends. While methodologically sound, their work remains focused on high-level markets and does not address regional implementation, SME discoverability, or semantic web alignment. Other studies have leveraged zero-shot frameworks combining knowledge graphs with large language models (LLMs) to map complex, multi-tiered dependencies in electric vehicle supply chains [
28]. While these systems map multi-tiered dependencies and support intelligent querying using language models, they do not incorporate RDF or Schema.org, and the design assumes access to extensive enterprise data, limiting their utility for SMEs.
Düggelin and Laurenzi [
29] developed an ontology-driven decision support system for risk analysis using knowledge graphs, validated through domain expert review. While demonstrating strong knowledge modeling practices, their approach focuses on organizational-level risk rather than SME integration or semantic interoperability. Tu et al. [
30] applied graph neural networks (GNNs) to a large-scale automotive supply chain knowledge graph for supplier recommendation. Their system showed superior predictive accuracy compared to non-graph methods, but it does not address dynamic querying, RDF compliance, or regional contexts, and SMEs remain underrepresented. Karam et al. [
31] proposed a hybrid framework combining knowledge graphs and Bayesian networks for bottleneck detection. While novel in combining structural and probabilistic models, it lacks a schema for supplier discovery or semantic querying.
Kosasih et al. [
32] advanced the field by applying GNNs for risk propagation and reasoning over supply chain knowledge graphs. They encode complex inter-firm relationships and use GNN-based link prediction to surface hidden vulnerabilities. However, their system does not address how such knowledge graphs are constructed, semantically modeled, or deployed in web-based regional applications. Similarly, the distant supervision method proposed by Huang et al. [
33] focuses on automated knowledge extraction for supply chain knowledge graphs, using natural language processing (NLP) and relation extraction to build graphs from text. While critical for scalability, the method does not extend to RDF or Schema.org alignment, nor is it embedded in an end-user system for SME discovery or regional graph querying.
Several recent works leave gaps relevant to SME-focused supply chain resilience. Rolli et al. [
34] introduced an axiomatic RDF-based knowledge graph for Industry 4.0, but their work remains conceptual and lacks SME-focused implementation and supplier discovery features. Saidi et al. [
35] developed reconfigurable supply chain models leveraging semantic technologies, but these remain largely theoretical and do not address SME integration. Similarly, Di Pierro [
36] proposed ontology-enriched graph databases without validation in real supply chain applications. McEachen and Lewis [
37] advanced spatial knowledge interoperability, and Thakker [
38] investigated RDF–property graph translation, but both contributions are outside the scope of SME supply chains.
Earlier foundational works such as Shadkam [
39], Petersen et al. [
40], and Grangel-González [
41] established semantic integration approaches in supplier selection and Industry 4.0 contexts. Complementing these, Petersen et al. [
42] demonstrated an RDF-based information model for manufacturing companies, showing how enterprise and asset data can be exposed via RDF vocabularies and queried using SPARQL. Ameri et al. [
43] applied an ontological RDF in agri-food supply chains to support traceability, validating semantic modeling and query execution in real-world contexts. Similarly, Petersen et al. [
44] developed a federated, semantics-based supply chain analytics framework using SCORVoc RDF vocabularies and distributed SPARQL queries. While these studies provide concrete industrial applications of RDF in supply chain contexts, they remain disconnected from dynamic web deployment, Schema.org compliance, and SME-focused supplier discovery, motivating the distinct contributions of this work.
To systematically compare these contributions,
Table 1 summarizes their core features, focus areas, and limitations relative to the proposed framework. The format of
Table 1 is adapted from [
45,
46] to clearly present a comparative analysis of prior works and highlight the novelty of this study. This analysis reveals persistent gaps, notably in SME integration, dynamic querying capabilities, semantic modeling, and real-world application. Most prior works remain conceptual, lack SME focus, and do not adopt dynamic querying or semantic modeling standards such as RDF or Schema.org. Furthermore, they seldom demonstrate real-world deployment or validation, limiting their practical impact. The proposed research addresses these gaps by integrating semantic structuring, dynamic querying, SME-focused design, and real-world application within a domain-specific context.
3. Knowledge Graphs for Supply Chain Modeling
Modern manufacturing supply chains are complex, multi-tiered ecosystems involving various types of entities, including suppliers, contract manufacturers, logistics providers, and testing centers. These entities are connected by inter-dependent material, information, and financial flows that form dense, dynamic networks. Traditional supply chain models based on linear, tabular representations (e.g., relational databases) are ill-suited to capture such complexity, especially when modeling relationships that are multi-directional, indirect, or conditional [
47].
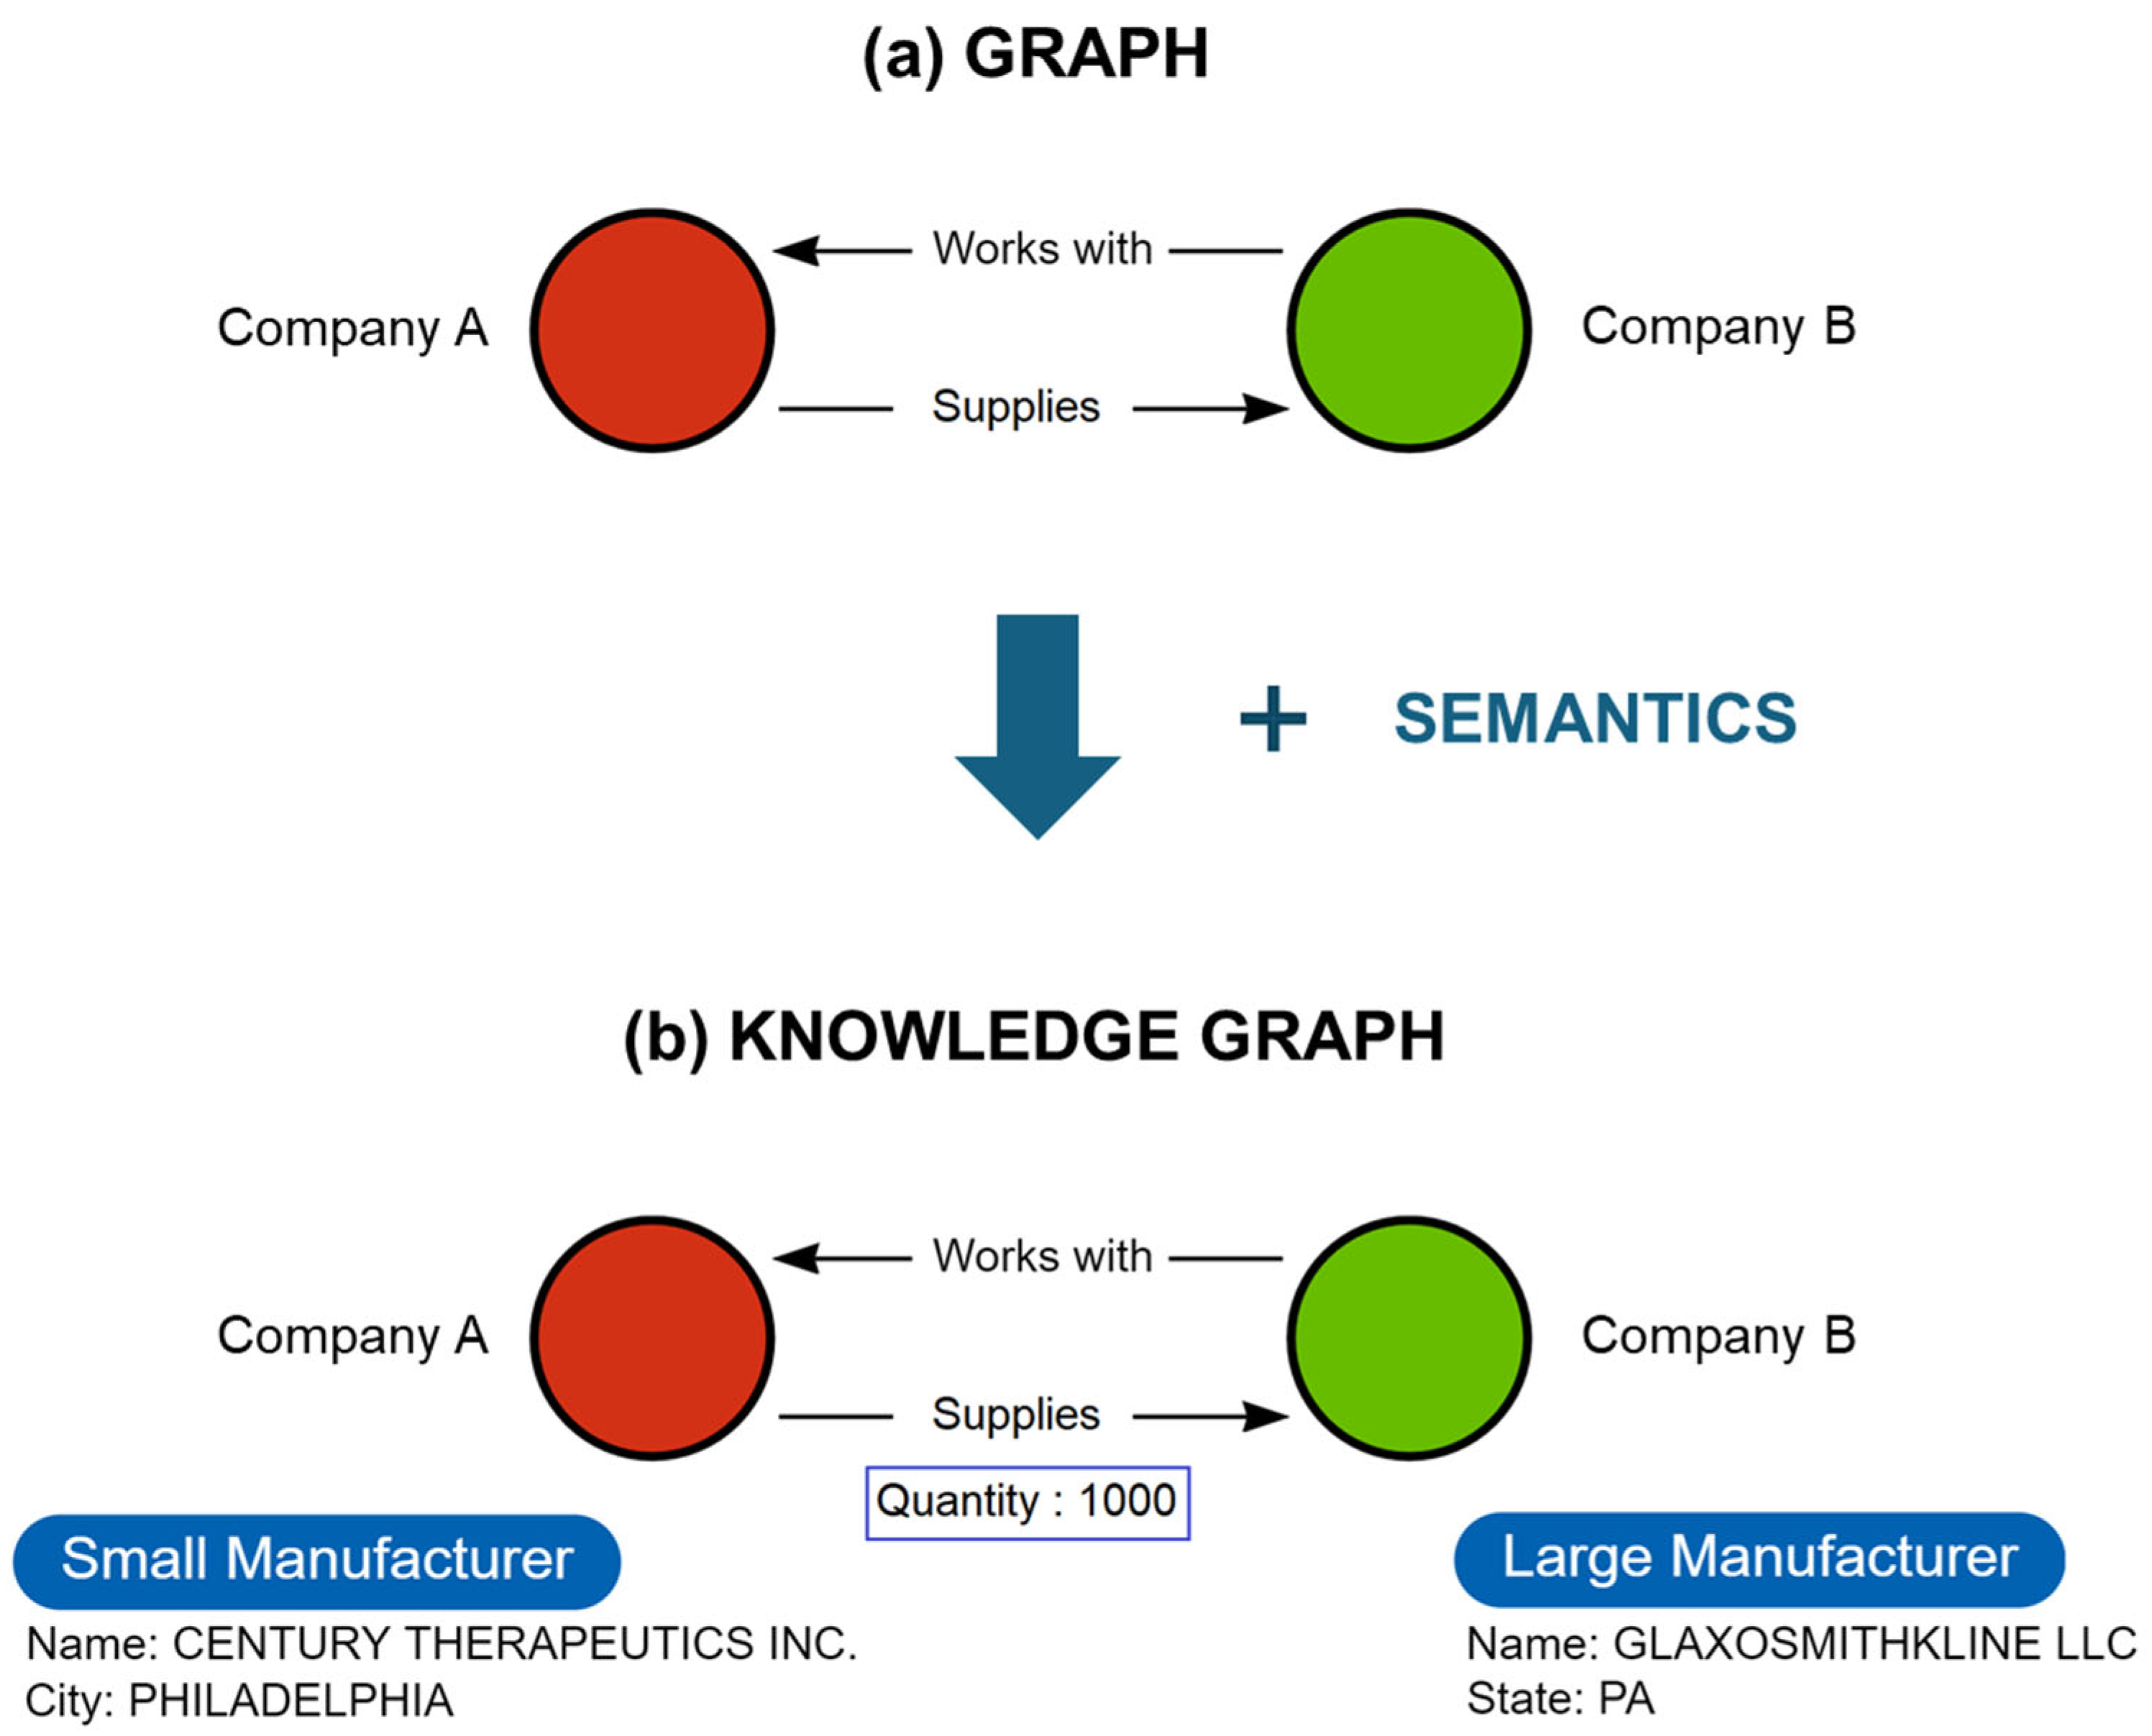
In contrast, graph-based representations provide a more natural and flexible alternative [
15]. In this approach, entities such as companies (e.g., Company A, Company B) are represented as nodes, and their relationships (e.g., “Company A supplies Company B” or “Company B works with Company A”) are represented as edges. The graph-based structures can be stored and managed using a specific type of database called a graph database. Unlike traditional relational databases, graph databases natively store relationships and connections between entities alongside data, enabling seamless querying and manipulation [
47]. To maximize the utility of graph structures for decision-making, they can be enriched with domain knowledge or semantics, thereby creating a knowledge graph [
47]. For example,
Figure 1a illustrates a simple graph with two connected nodes, while
Figure 1b shows the corresponding knowledge graph where the nodes (labeled as Company A and Company B) are enriched with additional attributes such as company size, name, location, and relationship details like the quantity of materials supplied from A to B. This enriched representation not only captures the existence of relationships but also their meaning and context. A formal mathematical definition and example of the knowledge graph structure used in this work are provided in
Appendix A.
3.1. Knowledge Graph Implementation for SME Supply Chains
This section presents a step-by-step methodology for constructing a domain-specific knowledge graph designed to enhance visibility and partner discovery within regional SME supply chains, following the approach of [
48]. The process comprises three main stages:
- (1)
Data Collection and Preprocessing: Gathering enterprise-level data relevant to the target sector, followed by cleaning, structuring, and formatting for knowledge graph construction.
- (2)
Knowledge Graph Schema Design: Importing processed data into Neo4j graph database and defining nodes, edges and categories that structure the knowledge graph.
- (3)
Search Mechanism Design: Developing a dynamic, human-interpretable search mechanism to enable enterprise scouting and discovery within the knowledge graph.
The proof-of-concept implementation focuses on Pennsylvania’s BioPharma sector but is generalizable to other industries.
Figure 2 presents a pictorial flowchart illustrating this methodology. The following sections describe each stage in detail.
3.1.1. Data Collection and Preprocessing
Enterprise-level data were collected from Mergent Intellect [
25], a commercial data platform that aggregates structured business information from Dun & Bradstreet. The dataset included 488 enterprises located in Pennsylvania and categorized under North American Industry Classification System (NAICS) Code 3254 (Biopharmaceuticals). This NAICS code classifies companies based on their primary business activities related to biopharmaceutical manufacturing, ensuring relevance to the sector. For each enterprise, attributes such as company name, location, employee count, sales volume, and business function were extracted. The data were cleansed by removing duplicates and incomplete records, then formatted into a tabular structure for knowledge graph construction.
3.1.2. Knowledge Graph Schema Design
The cleaned dataset was imported into the Neo4j graph database platform to develop the knowledge graph. Once the data were imported, enterprises were modeled as nodes, while their relationships were modeled as edges using Neo4j graph database. The companies are categorized into 8 groups based on the products made/service rendered, namely, Large Scale Manufacturer (
n = 45), and SMEs including: Small Manufacturer (
n = 165), Contract Manufacturer (
n = 34), Material Supplier (
n = 52), R&D Company (
n = 96), Equipment Supplier (
n = 10), Logistics and Supply (
n = 64) and Testing Centers (
n = 22). After node creation, edges labeled “Works With” were established between companies located within the same or neighboring regions, identified via their zip codes and sector relevance. This iterative process resulted in a complete knowledge graph representing Pennsylvania’s BioPharma manufacturing and supply chain ecosystem. The final graph consists of 488 nodes and 11,520 edges.
Figure 3 illustrates a partial view of this knowledge graph.
Unlike existing repositories that focus on isolated enterprise records, the approach presented in this work models SMEs within their broader relational and geographic ecosystem, enabling both direct and multi-hop discovery use cases essential for supply chain resilience.
3.1.3. Search Mechanism Design and Use Case Scenarios
Effective enterprise scouting, particularly for SMEs, is critical to supply chain diversification, risk mitigation, and regional economic development. However, traditional search tools often fail to uncover indirect partnerships or alternative suppliers, limiting their value for strategic sourcing and resilience planning. By integrating entity attributes with inter-firm relationships in a unified structure, the constructed knowledge graph enables dynamic, relationship-driven search capabilities. To assess its practical utility, this work examined both simple lookups and complex, multi-conditional queries. The simple queries reflect fundamental supplier discovery tasks, such as identifying firms by location or organizational type, which are widely used for initial screening. In contrast, the multi-conditional queries capture complex decision-making situations where firms must evaluate multiple criteria simultaneously, for example, balancing specialization, geographic proximity, and collaborative ties. These types of tasks are emphasized in the supplier selection literature [
49] and in studies on supply chain resilience and adaptation under disruption [
50], confirming that the chosen scenarios are representative of real-world supply chain challenges.
- (a)
Simple Relationship-Based Search
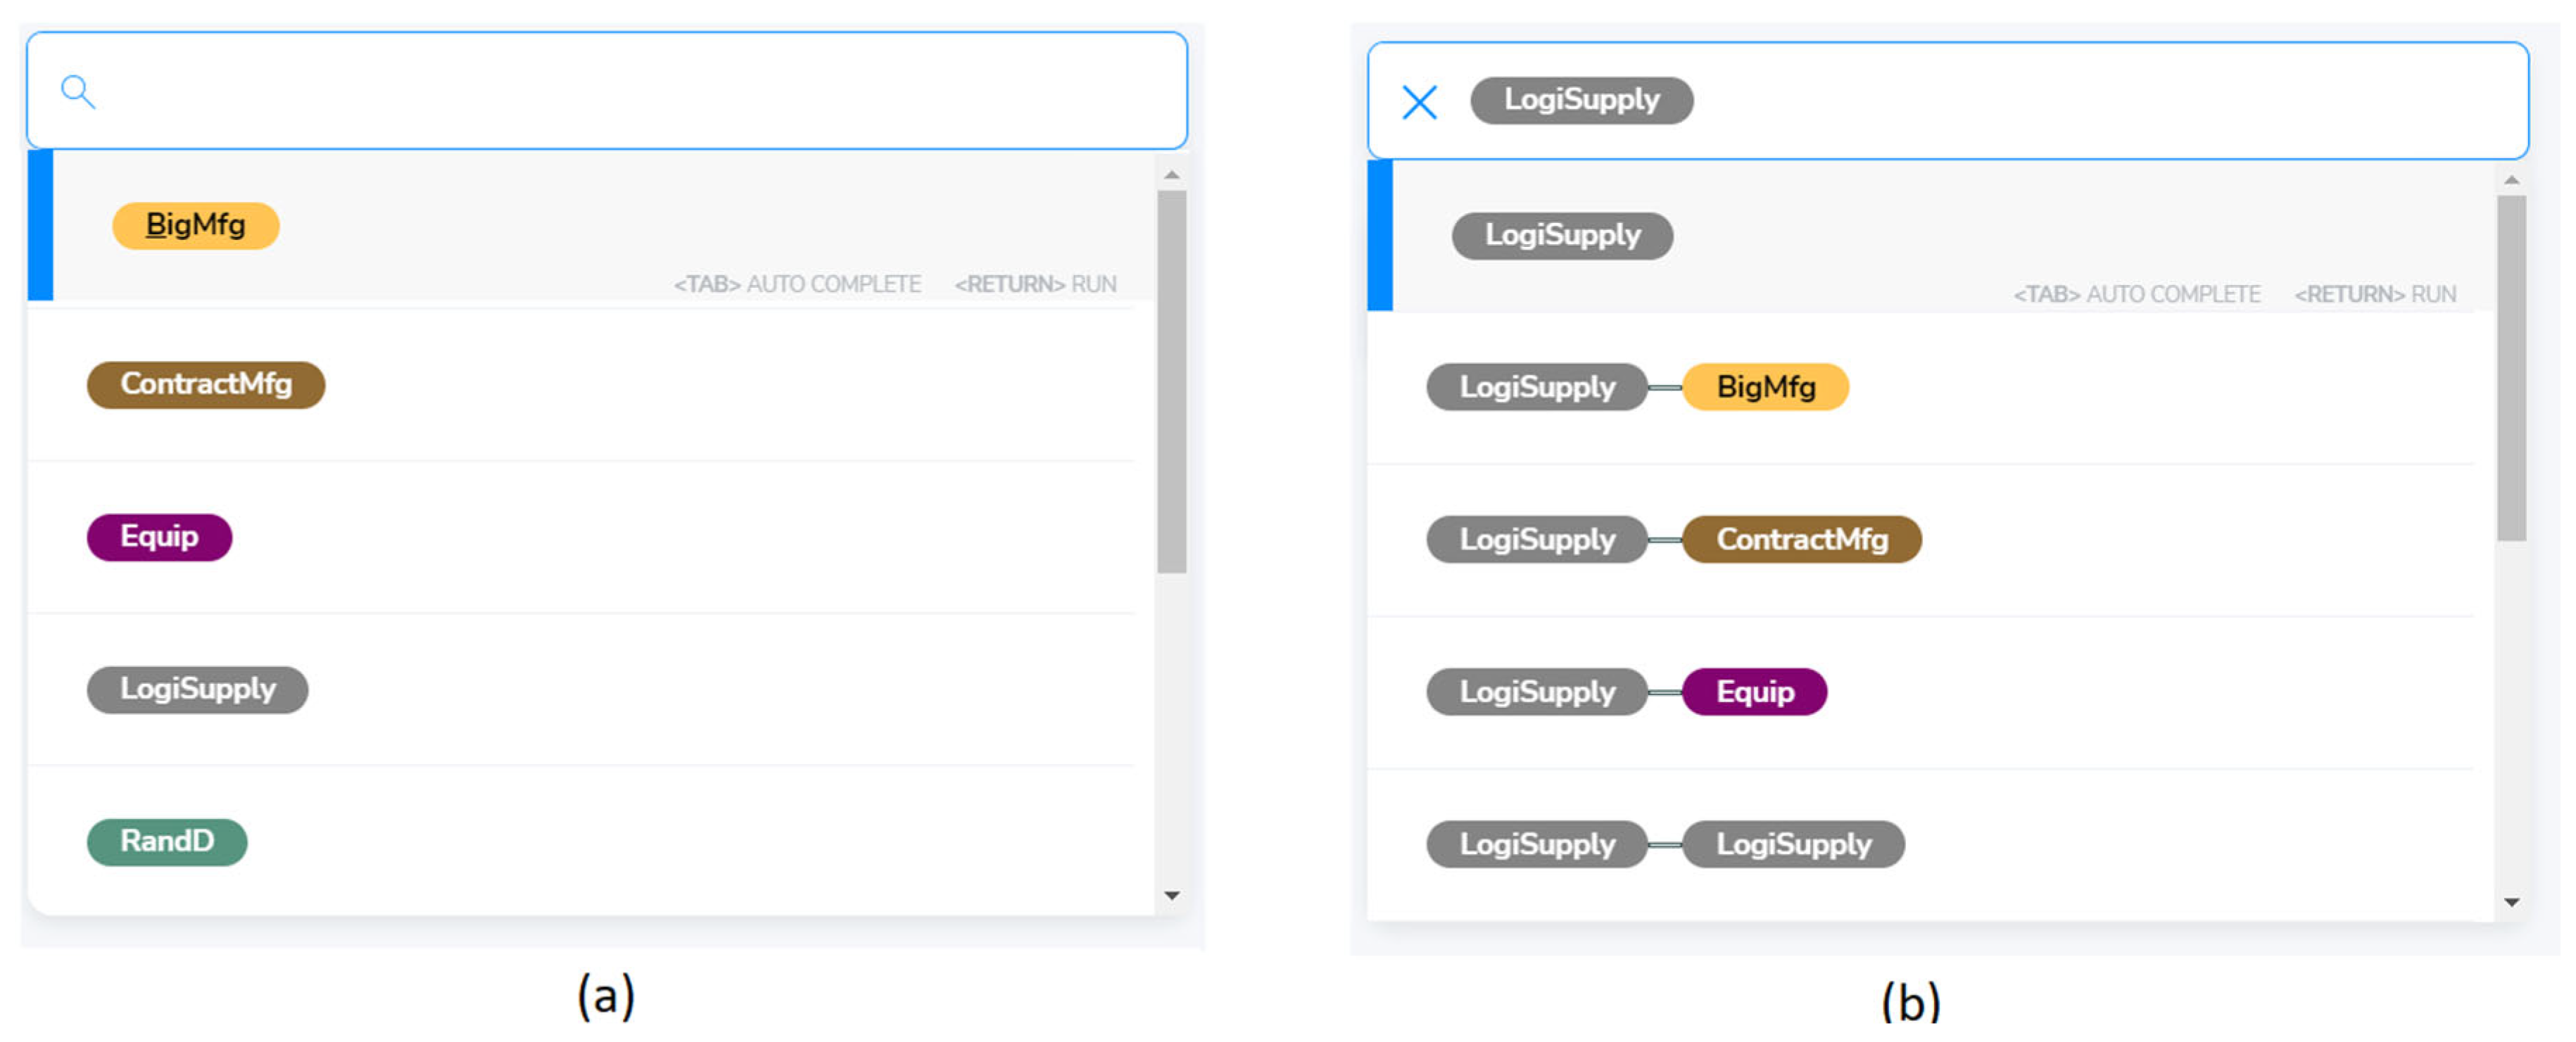
The knowledge graph built using the Neo4j graph database allows intuitive exploration of companies and their direct connections using human language style search prompts. For example, a user searching for all Logistics and Supply enterprises can retrieve matching companies and their relationships by selecting category filters, as shown in
Figure 4.
Figure 4a shows search options to find and filter enterprises by predefined categories such as Contract Manufacturing, Logistics and Supply, R&D, etc. These filters are based on tagged metadata stored in the knowledge graph and appear in the interface as dropdown menus or searchable text fields. Selecting a category displays all enterprises matching that classification.
Figure 4b shows relationship-based prompts to locate, for instance, Logistics and Supply enterprises and explore their connections to other enterprise categories. When activated, this option displays Logistics and Supply enterprises along with their first-degree (direct) connections to other companies.
Users can further refine results by selecting individual enterprises to reveal direct relationships and neighboring entities within the network (
Figure 5). In
Figure 5, the selected enterprise node (ENDO PHARMACEUTICAL, INC.) expands to show all directly connected entities, such as raw material suppliers, contract manufacturers, or other related companies. The visual layout helps users quickly understand the local network context of a given enterprise, offering insights into the company’s position within the regional supply chain. For example, a Logistics and Supply enterprise connected to many other entities may indicate a central role in distribution or supply coordination, while a manufacturer with numerous connections could represent a key production hub within the regional network. While this supports quick exploratory analysis, more detailed or conditional discovery requires advanced queries, discussed in the following section.
Beyond simple searches, the knowledge graph built on the Neo4j graph database supports advanced multi-conditional queries that traverse multiple relationships to discover highly specific enterprise connections. These complex queries are essential in realistic supply chain scenarios where users seek entities based on combinations of attributes and indirect relationships. Such queries, expressed in human-readable templates, can be dynamically adjusted by the user to explore alternative conditions or partners.
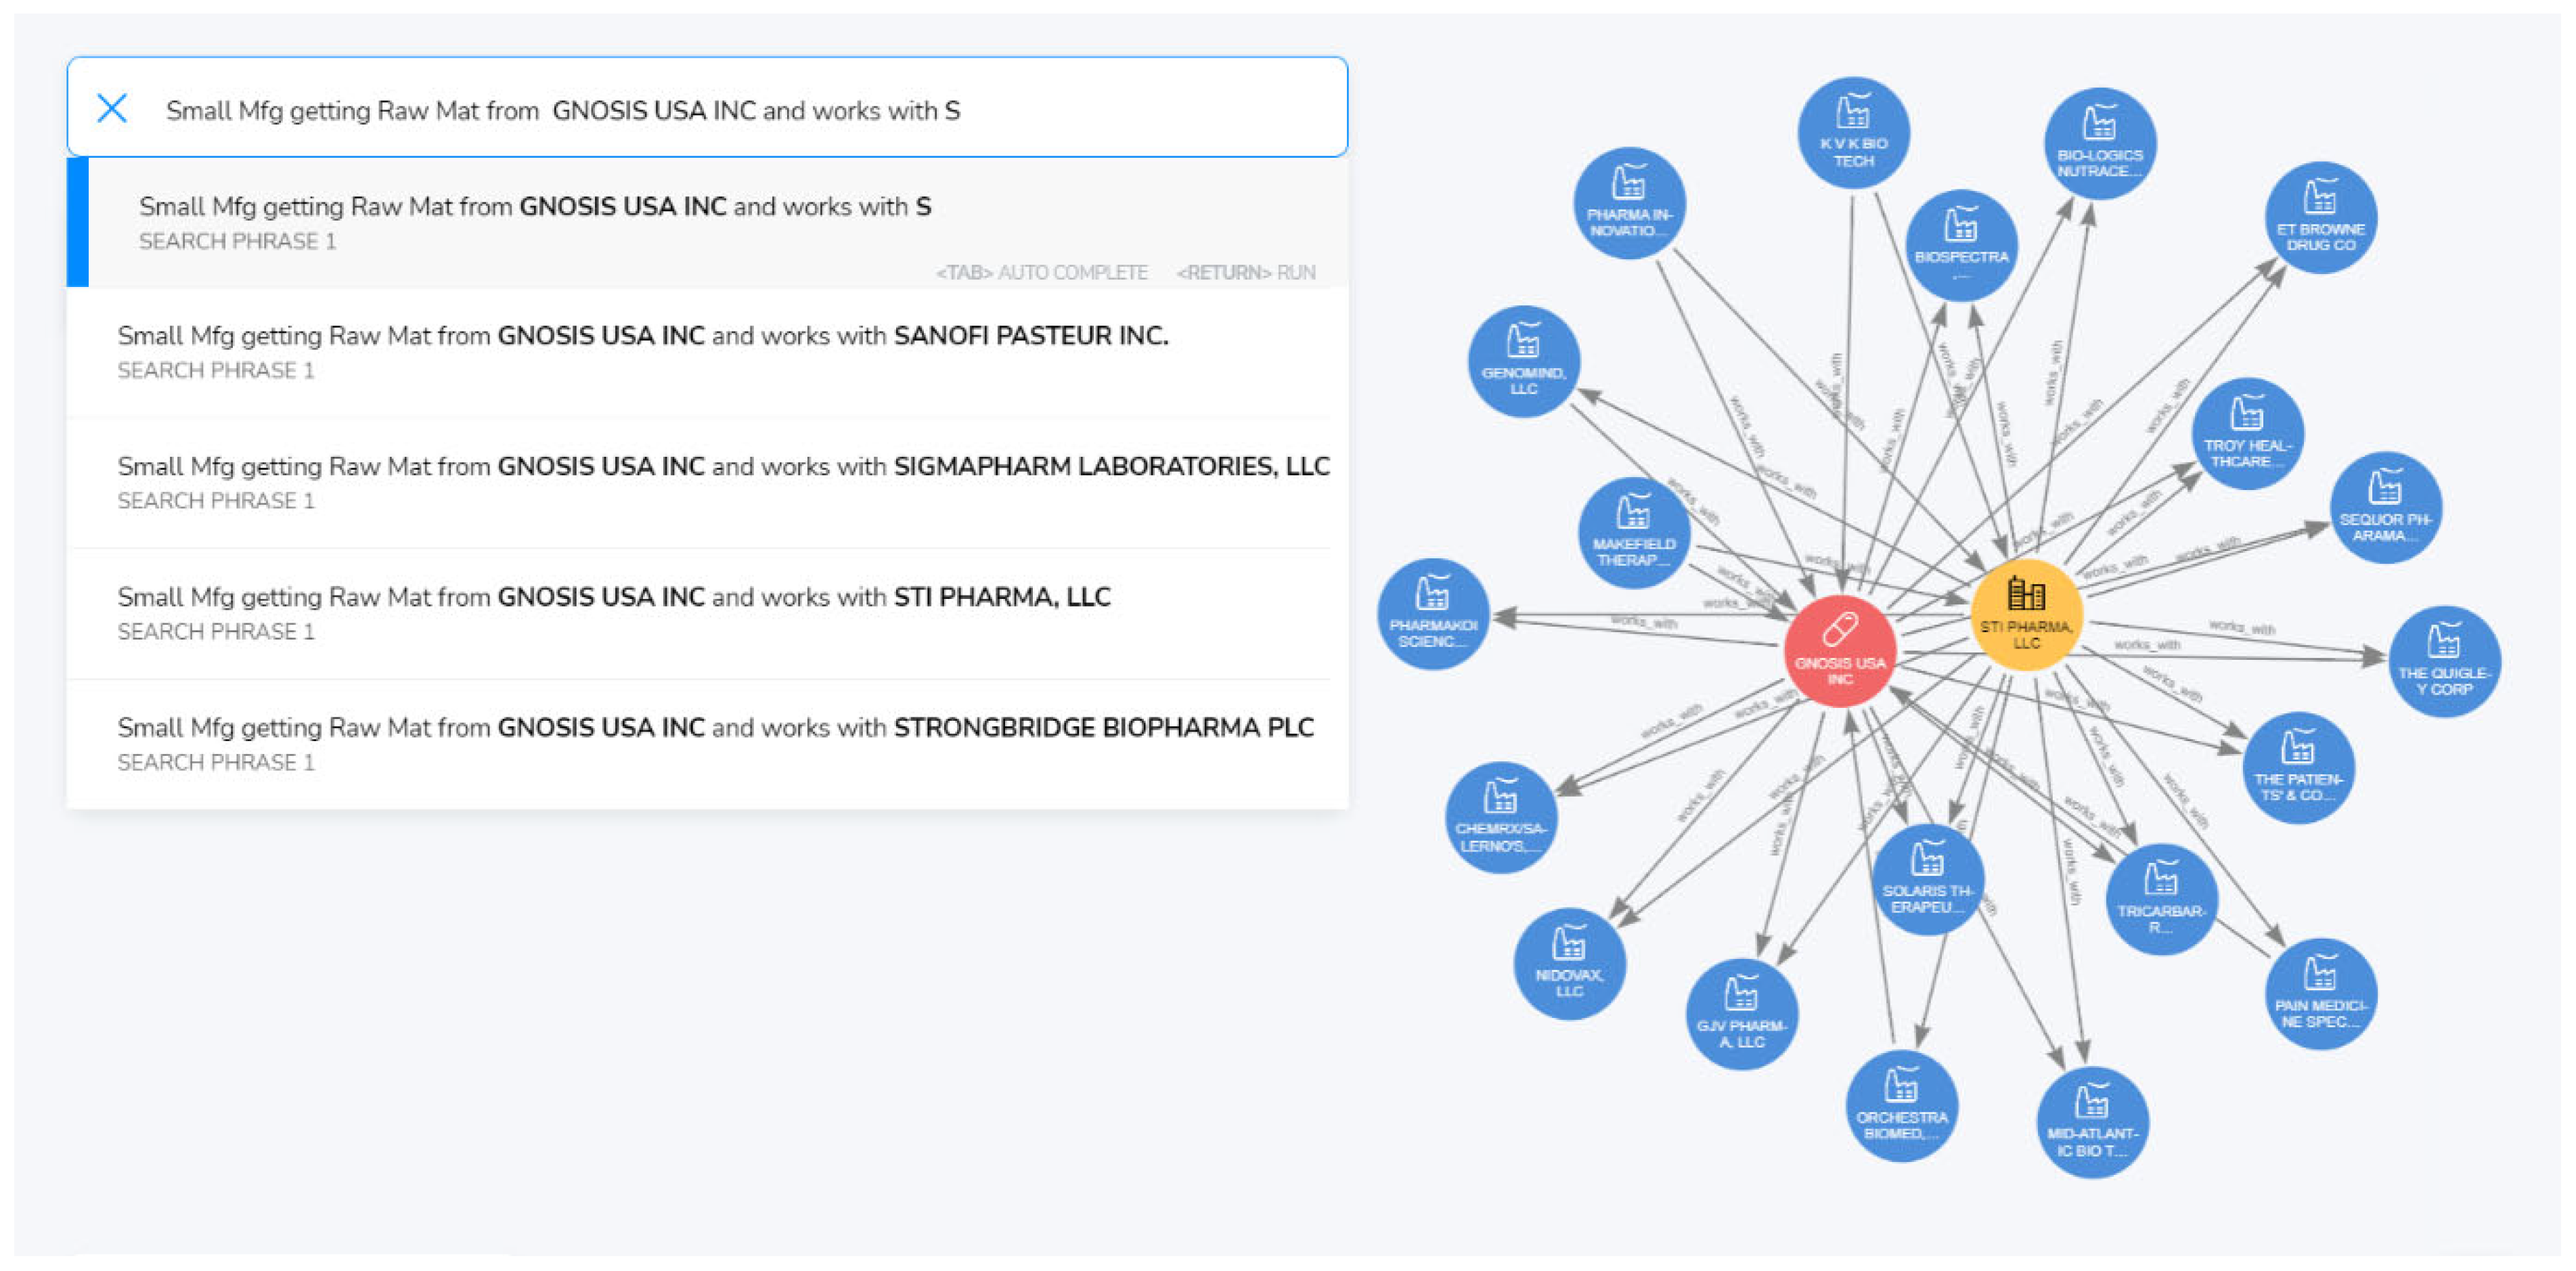
Consider a large enterprise seeking to collaborate with a Pennsylvania-based contract manufacturer who meets both of the following conditions: (i) the contract manufacturer sources raw materials from GNOSIS USA INC., and (ii) the contract manufacturer works with another large manufacturer, STI PHARMA LLC. Such a scenario reflects a realistic due diligence or strategic sourcing situation where enterprises seek partners that are already embedded in a reliable supply network. Traditional supply chain platforms rarely support such multi-hop queries across indirect relationships. In contrast, the knowledge graph efficiently executes this multi-conditional query, instantly returning the set of qualifying enterprises.
Figure 6 shows the results of the query: “Contract Manufacturers that get raw materials from supplier GNOSIS USA INC. and work with STI PHARMA LLC”. This type of query supports transparency, reveals non-obvious connections, and enhances strategic supplier scouting.
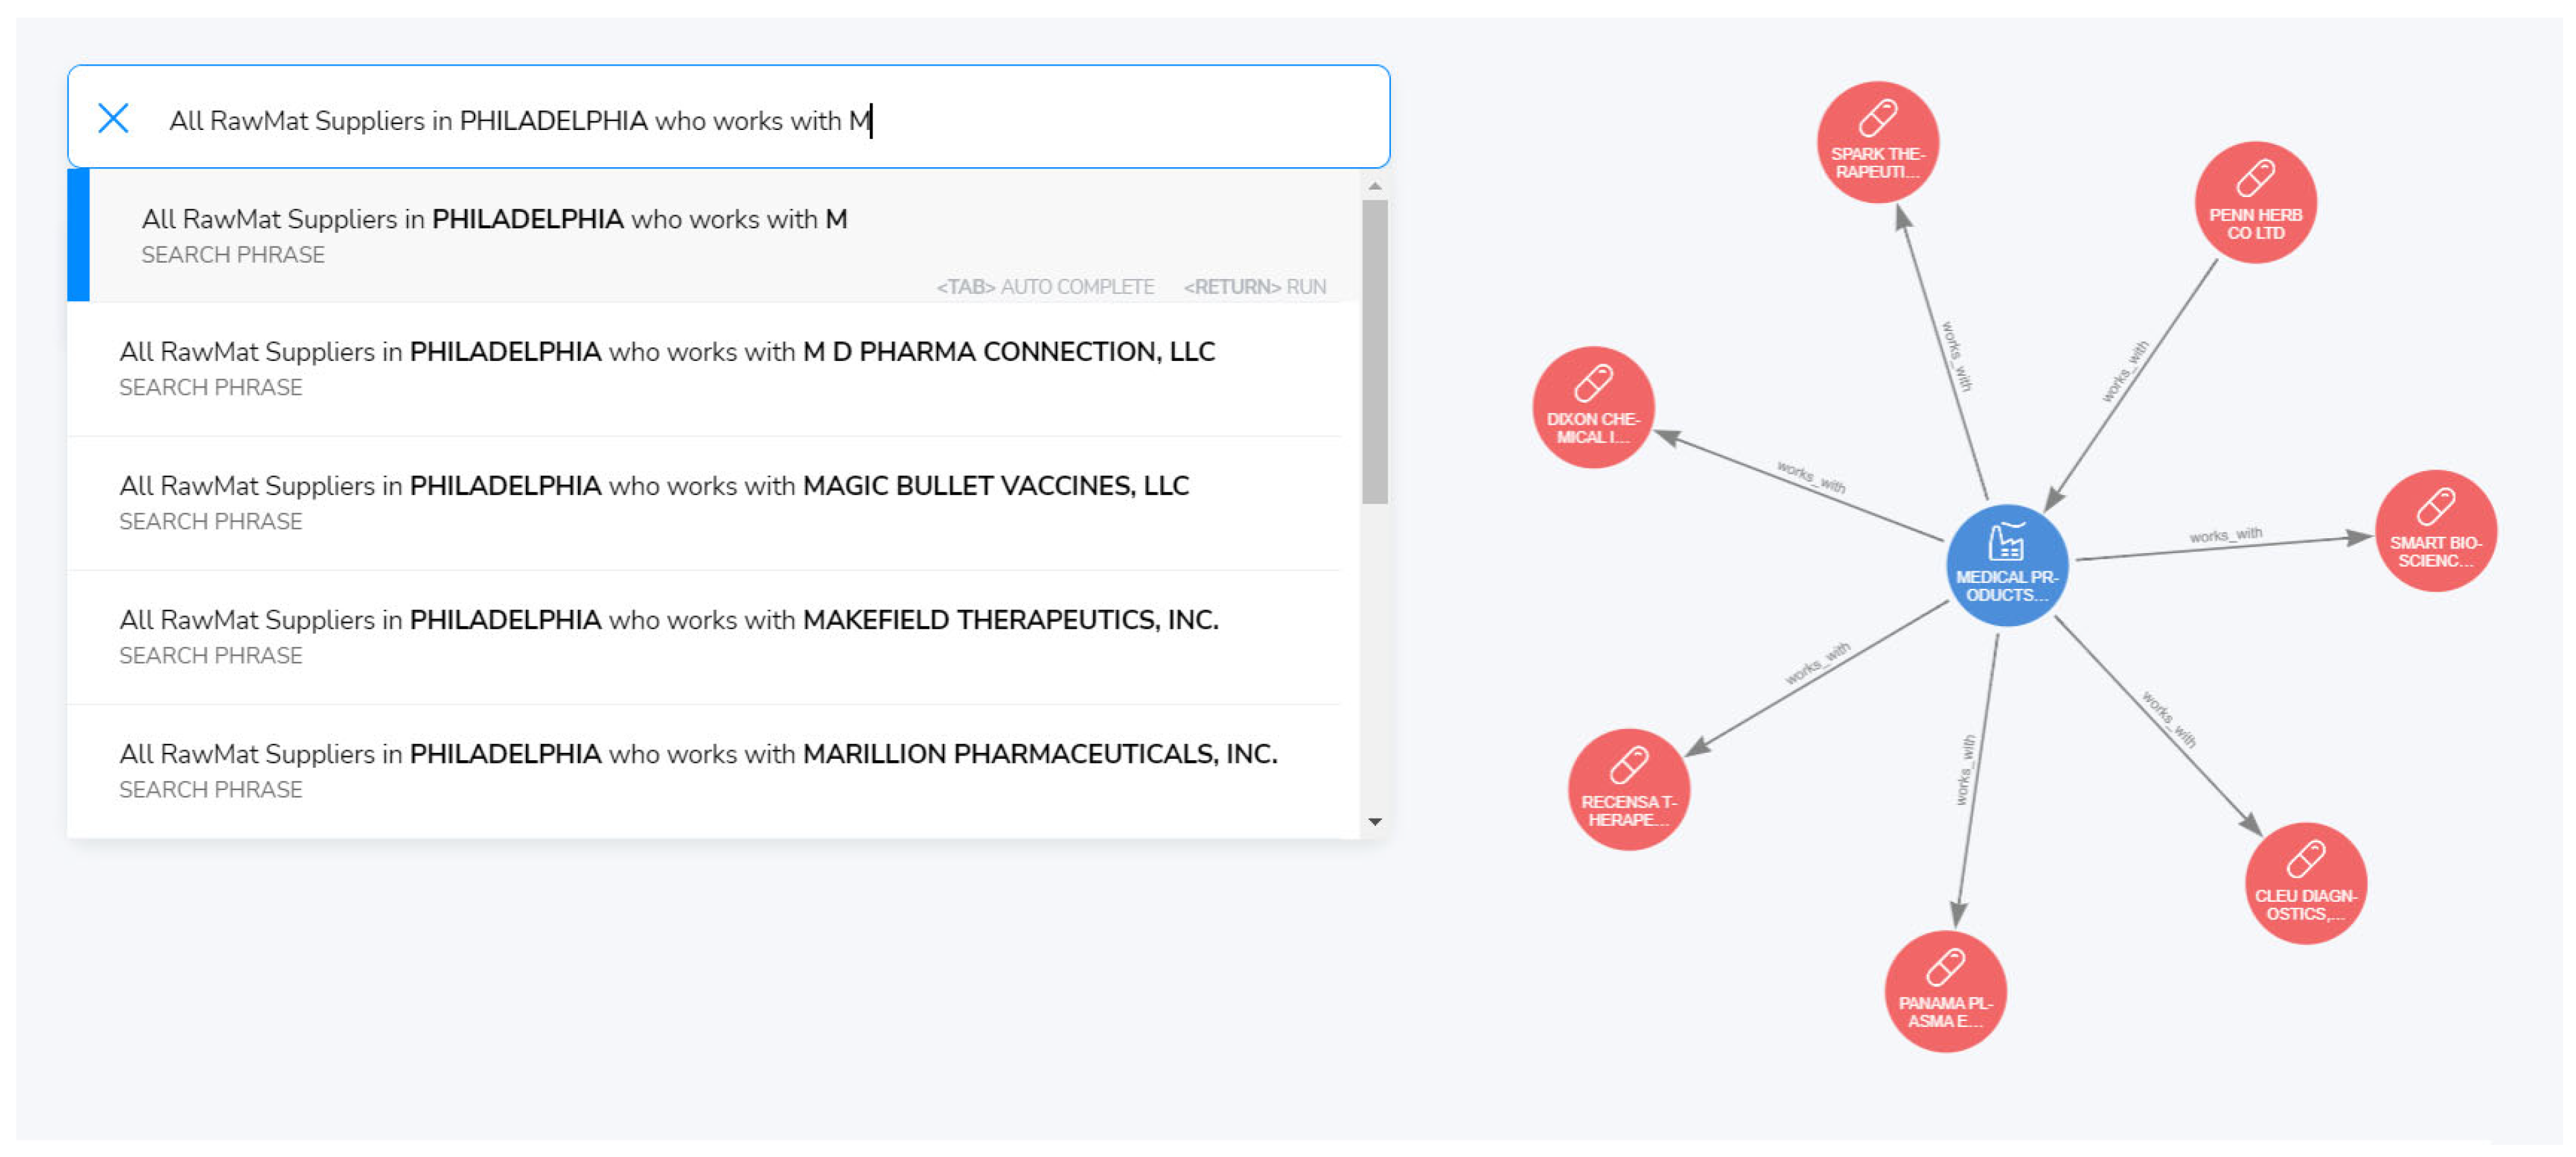
In a second scenario, an enterprise might seek all raw material suppliers located in a specific county (e.g., Philadelphia) that also supply a particular large company, such as MEDICAL PRODUCTS LABORATORIES, INC. This query combines geographic filtering with relationship-based criteria, functionality rarely supported by traditional supplier databases. Using the knowledge graphs built on graph databases, this complex search was executed with ease, again allowing dynamic input of county names or target companies.
Figure 7 displays the query results for: “All raw material suppliers in PHILADELPHIA who work with MEDICAL PRODUCTS LABORATORIES, INC”.
It is also worthwhile noting that the queries are dynamic, meaning the knowledge graph updates the list of companies available for selection in the dropdown menu in real time as queries are typed. This capability enhances localized supplier discovery, improves supply chain transparency, and supports regional economic development by enabling enterprises and policymakers to identify and strengthen trusted local supply networks.
3.2. Performance Evaluation and Comparison
To assess the performance of the proposed knowledge graph model, a series of test queries discussed in
Section 3.1.3 were executed on the constructed knowledge graph. The evaluation focused on the following key metrics: (i) query execution time (Q) in milliseconds (ms) and (ii) the number of nodes and edges returned. The test cases included both (i) simple linear queries with single-hop lookups within the network, and (ii) complex multi-conditional queries requiring traversal of multiple hops and filtering based on combined conditions.
Table 2 summarizes the tested queries (referenced in
Section 3.1.3) and their outcomes.
The knowledge graph-based model delivered near-instantaneous results for simple queries (<1 ms) and maintained execution times under 10 milliseconds even for complex multi-hop queries. This contrasts sharply with existing platforms like Wikidata [
23], which rely on manual or semi-automated updates and offer incomplete industry coverage. For example, a SPARQL query on Wikidata for BioPharma enterprises (Q507443) in the United States (Q30) returned only 217 results, far below actual industry counts and took approximately 802 milliseconds for a simple query. Moreover, platforms such as Wikidata lacks support for complex, multi-conditional relationship queries like those demonstrated here. Therefore, the proposed knowledge graph-based approach not only supports richer, relationship-driven queries but does so with significantly faster response times
3.3. Validation and Accuracy Check
To assess the accuracy of the constructed knowledge graph and its querying mechanism, a targeted manual validation was performed. A stratified random sample of eight enterprises, one from each of the eight key categories (e.g., manufacturers, suppliers, logistics providers), was selected. For each enterprise, direct relationships (first-degree connections) identified by the automated query mechanism were manually cross-checked against known partnerships recorded in the graph database. Additionally, three complex multi-hop queries, similar to those illustrated in
Section 3.1.3 (b), were executed and verified.
4. Interoperability and Standardization
Knowledge graphs and graph databases have seen increasing adoption across industries due to their growing relevance and applications in diverse domains [
51]. The knowledge graph developed in this work for the Pennsylvania (PA) BioPharma sector to enhance supply chain resilience represents one such application. However, to extend the utility and applicability of this knowledge graph across a broader ecosystem of SMEs, it must support key capabilities such as data exchange and integration, semantic reuse, creation of new knowledge, and shared understanding across different systems. These capabilities are collectively encompassed by the concept of interoperability, defined as the ability of multiple systems to seamlessly exchange, interpret, and utilize information [
52]. In the context of graph databases and knowledge graphs, interoperability implies that data must be represented, stored, and shared in a manner that is both machine-readable and intelligible across different platforms and domains [
53]. One of the most effective ways to achieve interoperability is through the adoption of standardized frameworks and protocols.
4.1. Semantic Web Standards
Standardization is driven by consensus among stakeholders including industry, academia, user groups, and regulatory bodies, and ensures common protocols and data formats [
54]. The World Wide Web Consortium (W3C) plays a central role in defining such standards for web-based information exchange. The W3C’s Semantic Web initiative (also known as Web 3.0) introduces a framework for encoding data with well-defined semantics, enabling it to be shared and reused across applications, communities, and enterprises. According to W3C, the Semantic Web provides foundational technologies such as [
55]:
- (i)
RDF (Resource Description Framework): The standard model for data interchange.
- (ii)
SPARQL: The standard query language for RDF-based data.
These technologies facilitate the creation of interoperable datasets and ontologies, supporting flexible integration and reasoning across domains. To make the PA BioPharma knowledge graph interoperable, it was mapped into the RDF format, the W3C standard for structured data exchange on the web. This translation allows seamless integration into other applications and domains, enabling a scalable, interoperable knowledge ecosystem.
4.2. RDF Data Model
The Resource Description Framework (RDF) is a W3C-standardized data model designed for structured information exchange on the Web [
6]. It provides a way to represent and link data so that users can understand the meaning of entities and their relationships across different domains [
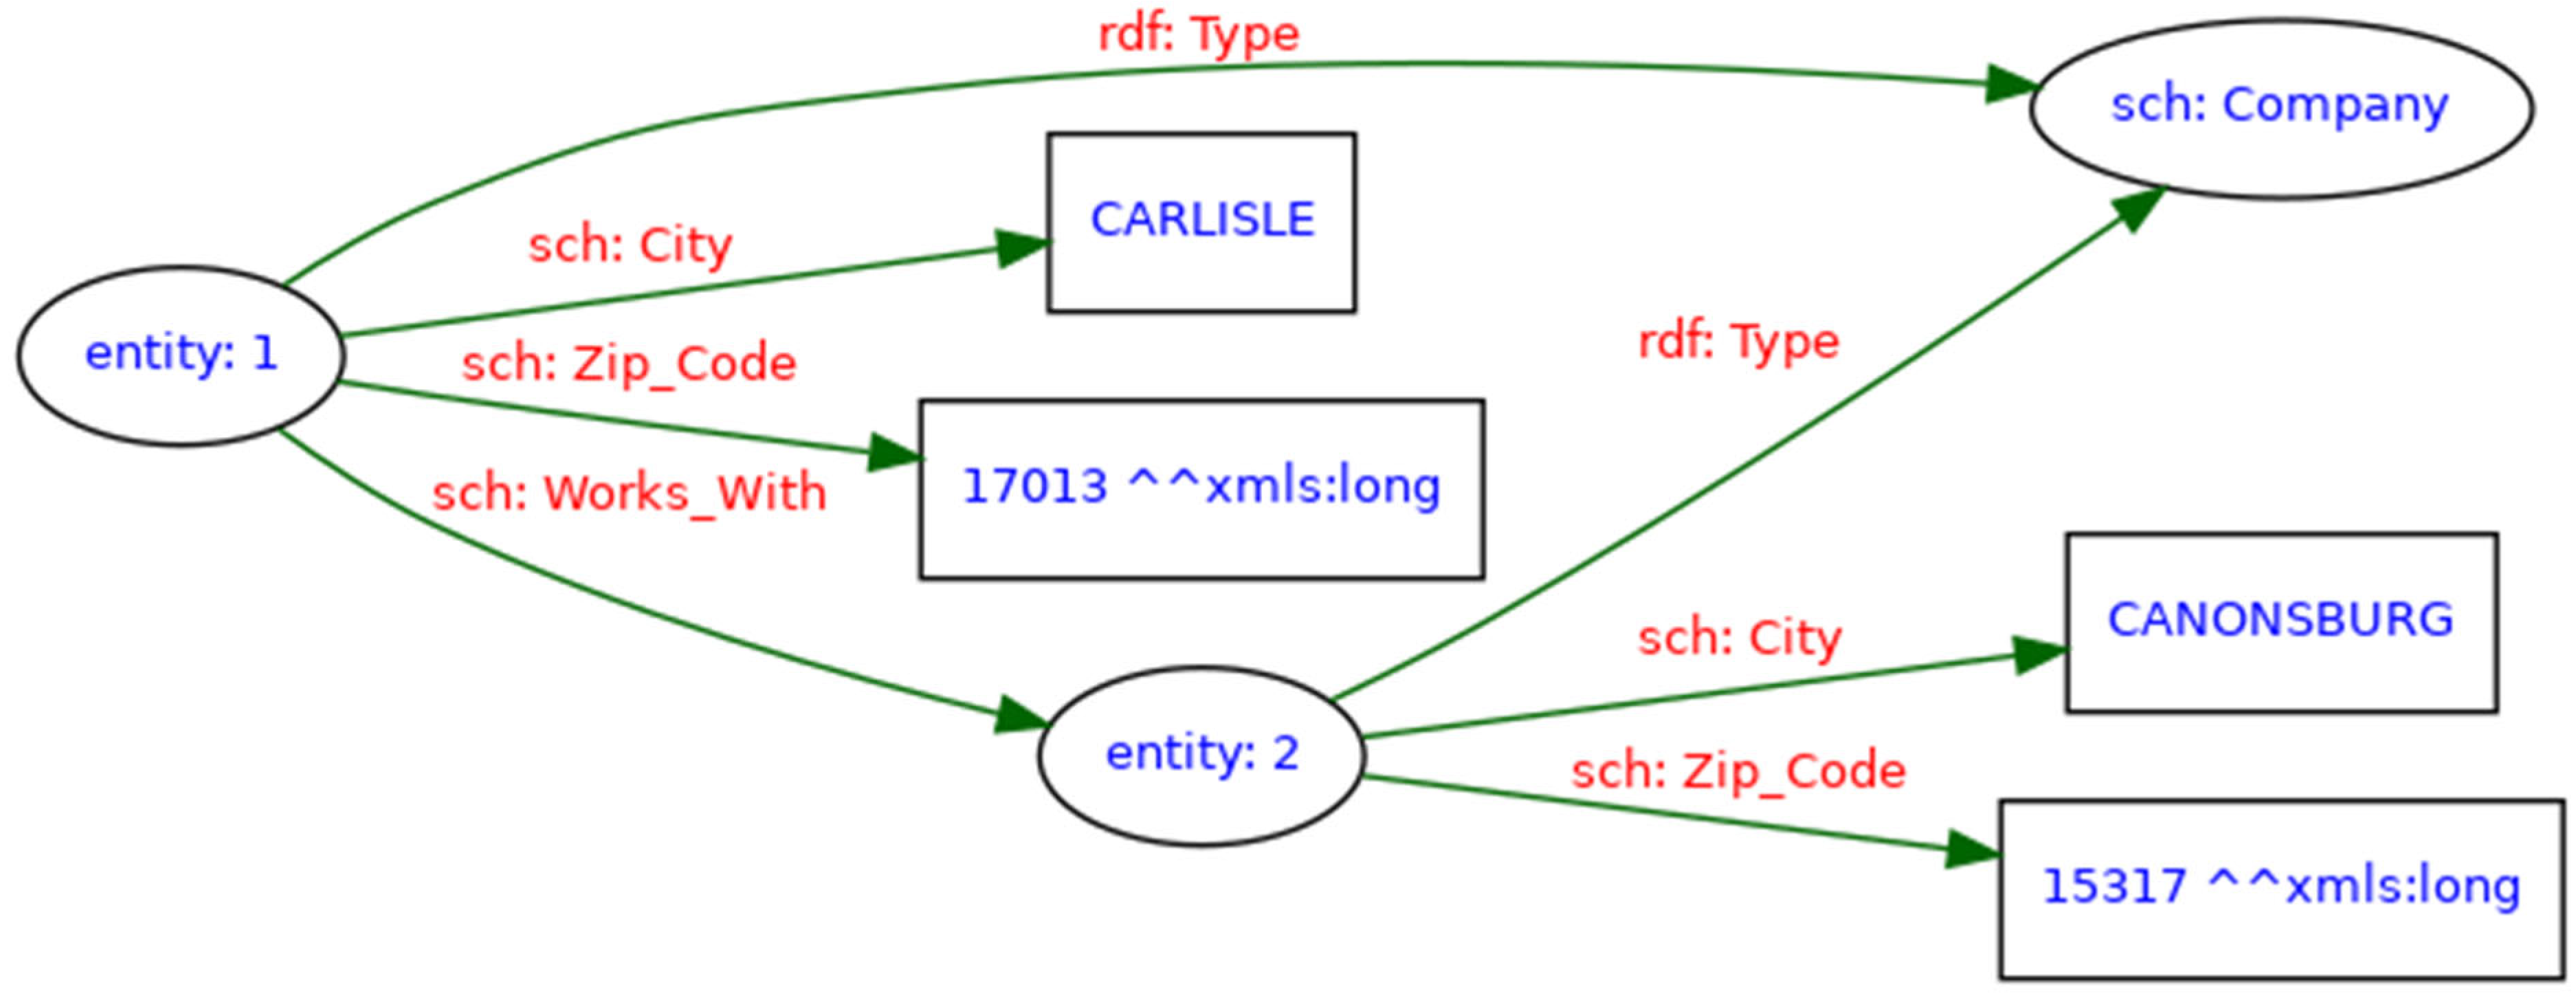
56]. At its core, RDF represents data as triples composed of Subject, Predicate, and Object. The subject and object represent nodes or resources, while the predicate defines the relationship between them. For example, the statement “Entity 1 works with Entity 2” can be modeled using the following RDF triples:
- -
Subject (Node): Entity 1
- -
Predicate (Edge): works with
- -
Object (Node): Entity 2
Each RDF triple uniquely identifies these elements, making it possible to clearly model entities and their relationships. These relationships are often described using shared vocabularies such as FIBO [
57], FOAF [
58], or Schema.org [
59] to support semantic interoperability across systems.
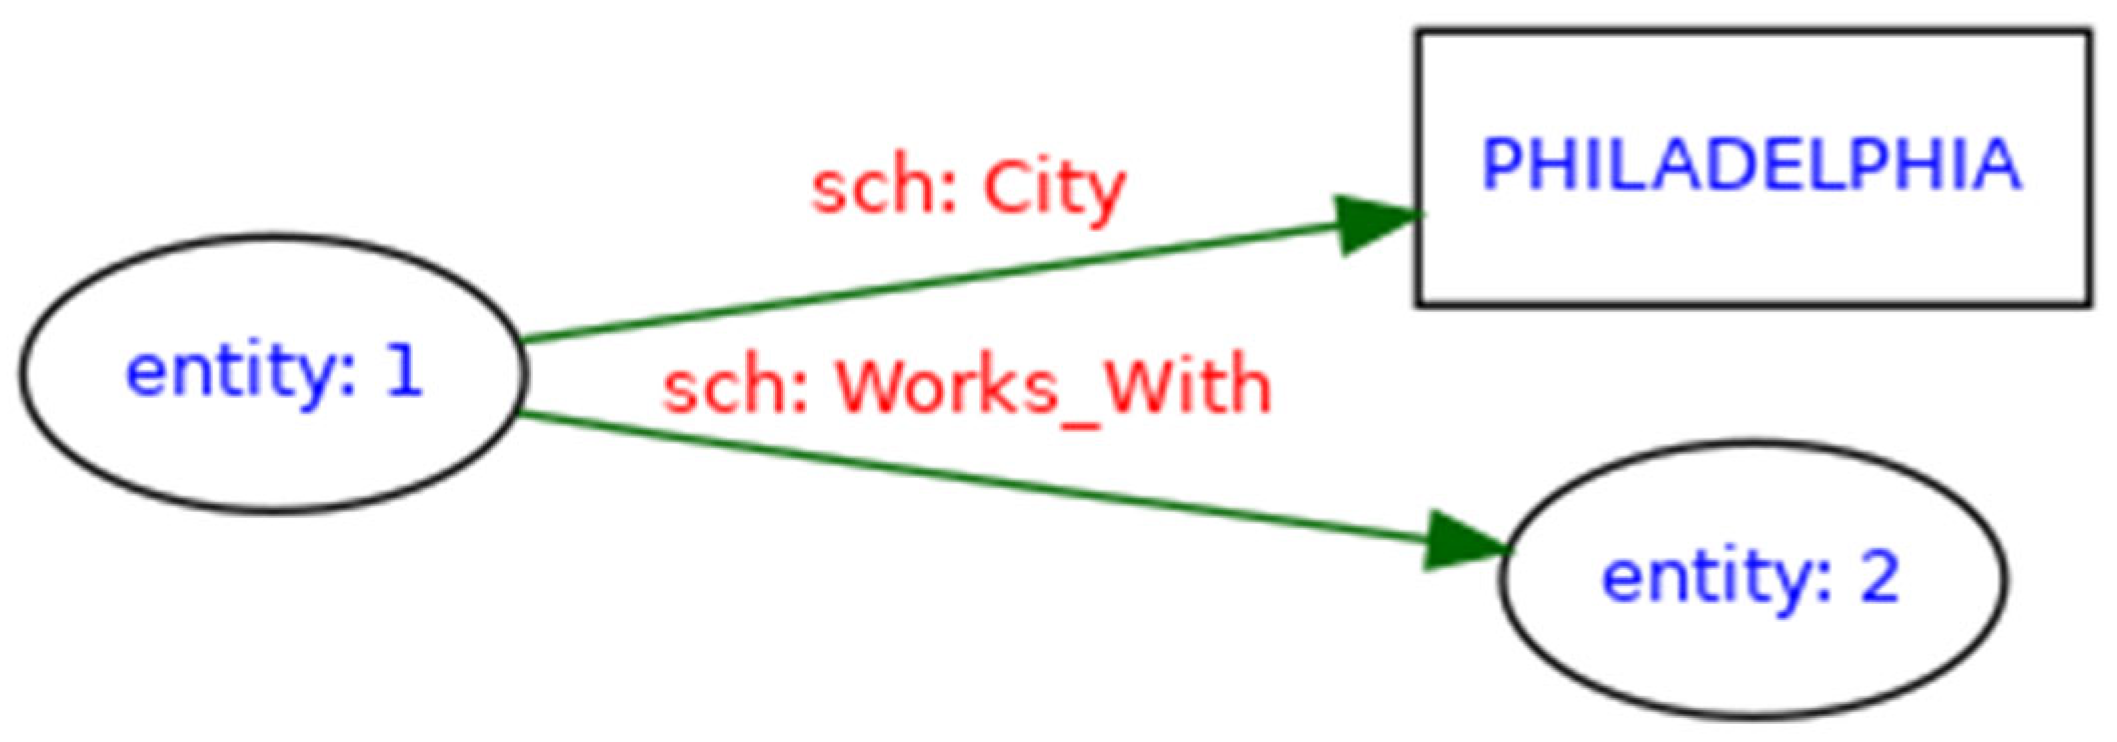
RDF data can be serialized in various formats such as Turtle, RDF/XML, N-Triples, or JSON-LD. For instance, the statement “Entity 1 is located in Philadelphia and works with Entity 2” can be represented in Turtle format as shown below:
In this snippet, “entity:1” and “entity:2” represent entities (e.g., companies or organizations), and “sch:Works_With” is a property linking them. The predicate “sch:City” associates Entity 1 with the city “Philadelphia.” The prefix “sch:” serves as a shorthand for the full URI (Uniform Resource Identifier): <
http://www.example.org/schema/> (accessed on 13 May 2025). The usage of the prefixes such as “sch:” helps improve readability and reduce repetition in RDF syntax.
Figure 8 illustrates a simplified RDF graph based on this example. Since RDF decomposes each data statement, every entity (e.g., Entity 1 and Entity 2) and its properties (e.g., City) are represented as distinct components, often as separate nodes or edges, in the RDF graph. Formal definitions of RDF triple structure, data types, and Turtle serialization syntax are provided in
Appendix B for reference.
4.3. Database Mapping
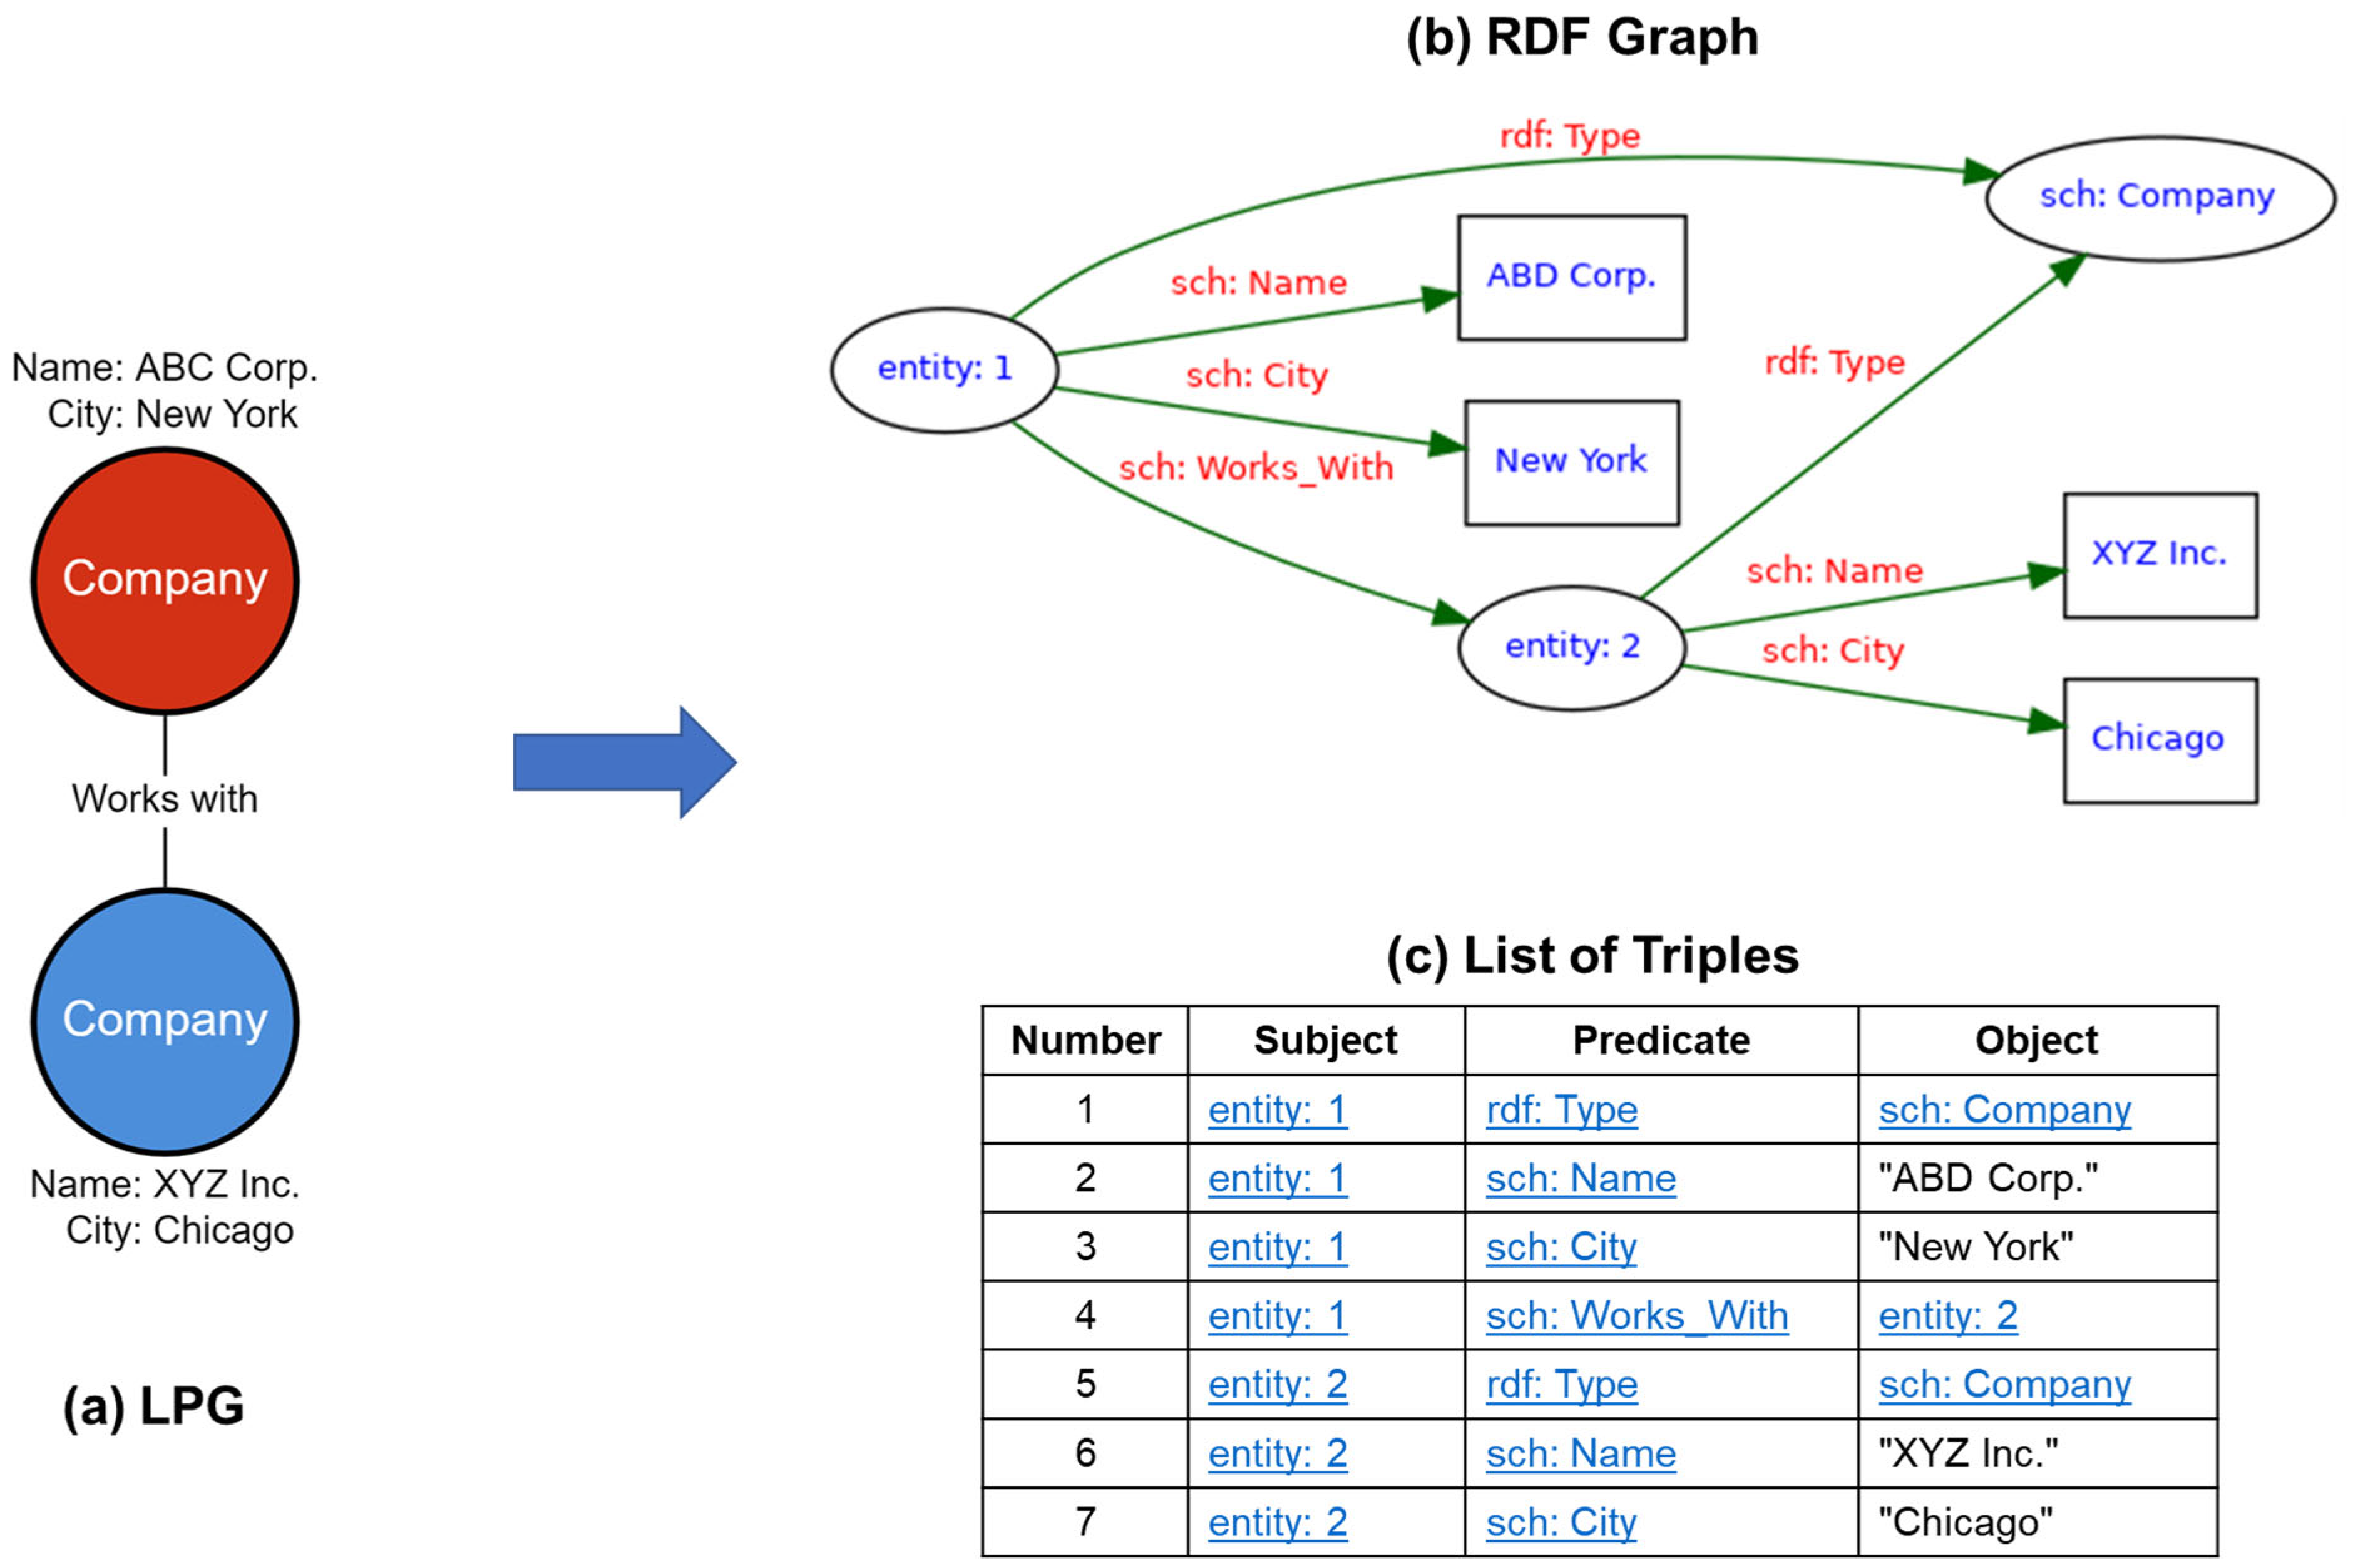
In simple terms, database mapping is the process of translating a database from a source database format to a target database format. To enhance interoperability, the knowledge graph for PA BioPharma, which is a Labeled Property Graph (LPG), needs to be mapped to the RDF format and back in a lossless manner (i.e., preserving all the information). This mapping is performed based on the following procedures:
- (i)
Props → W (Property names from LPG mapped to URIs in RDF).
- (ii)
Values → L (Property values from LPG mapped to Literals in RDF).
- (iii)
Labels → L ∪ W (Labels from LPG mapped to Literals or URIs in RDF).
- (iv)
V ∪ E → W ∪ B (Nodes and Edges from LPG mapped to URIs or BNodes in RDF).
In other words, every element in the LPG, whether node, edge, label, or property, is transformed into a corresponding RDF triple. This enables the preservation of both data structure and semantics.
Figure 9 illustrates this mapping process, showing how the nodes and edge in the LPG are converted into seven distinct RDF triples. In the RDF representation, each entity, relationship, and property is decomposed into triples consisting of a Subject, Predicate, and Object. This granular decomposition allows all information from the LPG to be captured explicitly, with each property and value represented as a separate node or edge in the RDF graph.
As shown in
Figure 9c, some triples use prefixes such as “sch:” or “rdf:”. These act as shorthands for full URIs (e.g., rdf: corresponds to <
http://www.w3.org/1999/02/22-rdf-syntax-ns#> (accessed on 13 May 2025), and sch: to <
http://www.example.org/schema/>) (accessed on 13 May 2025). While such custom or default vocabularies work for general use, they lack semantic alignment with widely adopted standards. To enhance broader web-based interoperability, these prefixes could be mapped to standardized vocabularies such as Schema.org [
59].
4.4. Interoperability Workflow for PA BioPharma Knowledge Graph
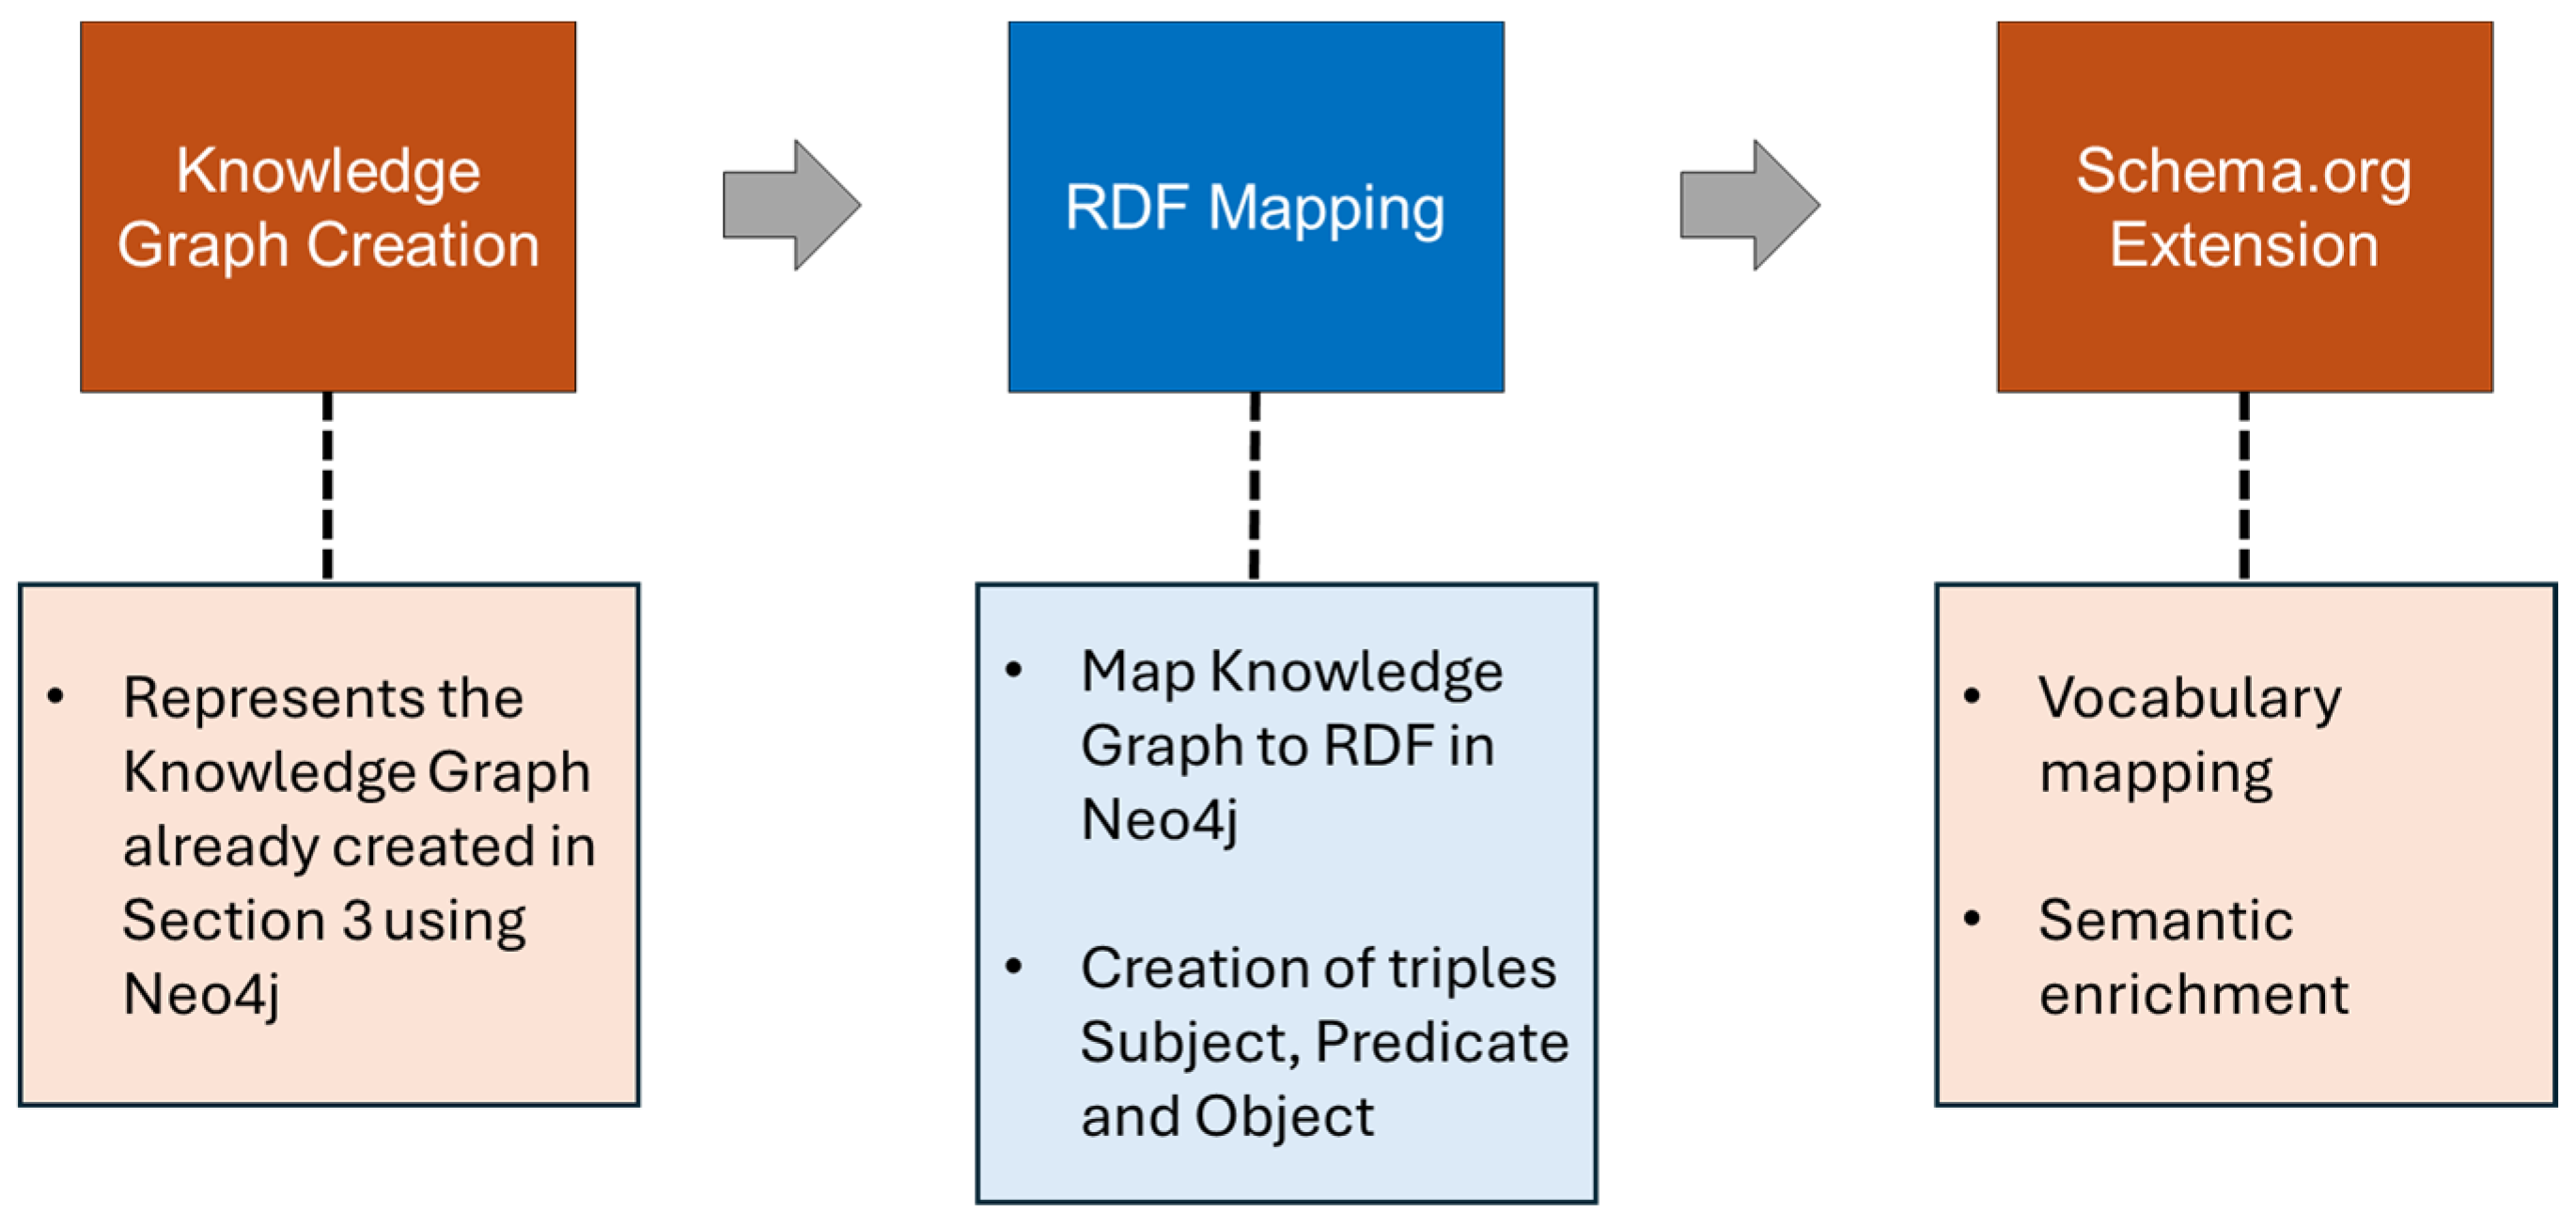
To address the interoperability needs of the knowledge graph developed for the PA BioPharma sector, this work follows a three-step methodological framework:
- (1)
Knowledge Graph Creation: Building the domain-specific knowledge graph as described in
Section 3, using the Neo4j graph database.
- (2)
RDF Mapping: Mapping the knowledge graph to the RDF standard.
- (3)
Schema.org Extension: Extending the RDF graph with Schema.org vocabulary to achieve semantic interoperability.
Figure 10 illustrates this overall interoperability workflow, providing a conceptual roadmap for the detailed steps discussed in the sections that follow.
4.4.1. RDF Mapping
The knowledge graph constructed in
Section 3 serves as the input for the RDF mapping process. This existing graph was implemented in Neo4j and subsequently mapped to the RDF using the Neosemantics (n10s) extension. This extension enables seamless interoperability by allowing data stored in Neo4j’s Labeled Property Graph (LPG) model to be transformed into standard RDF serializations. Data insertion is performed using Cypher query language, and the output is, by default, serialized in Turtle format, though other RDF formats such as RDF/XML can be produced through content negotiation. The original LPG-based knowledge graph comprised 488 nodes and 11,520 edges. After conversion to RDF, the graph expanded into a total of 16,086 RDF triples, reflecting RDF’s more granular, triple-based representation.
Figure 11 presents a partial view of the RDF serialization in RDF/XML format.
As seen in
Figure 11, the RDF output uses a default vocabulary automatically generated based on the Neo4j schema. This vocabulary assigns generic URI prefixes (e.g., neo4j://graph.xxx) to represent node labels, properties, and relationships. Although this schema-specific vocabulary is sufficient for serialization and internal querying, it lacks interoperability for broader web-based data integration. To address this, it is necessary to map the terms in the RDF graph to publicly recognized vocabularies. Specifically, the generic Neo4j vocabulary is aligned with equivalent terms in Schema.org, a widely adopted RDF schema that enhances semantic consistency and facilitates data sharing and integration across heterogeneous systems. This vocabulary alignment ensures that the RDF representation of the PA BioPharma knowledge graph is both machine-readable and semantically interoperable with external data sources and ontologies.
4.4.2. Schema.org Extension
Schema.org is a widely adopted public vocabulary comprising an extensive collection of schemas for structured data. It facilitates machine readability and enhances semantic understanding of content on the internet, significantly improving data discoverability and search engine performance [
60,
61,
62]. Developed collaboratively by major search engines including Google, Microsoft, Yahoo, and Yandex, Schema.org provides definitions for commonly used entities such as organizations, places, products, services, and their associated properties [
63]. Currently, Schema.org vocabularies are used by over 10 million websites and applications to make data more accessible and interpretable by intelligent systems.
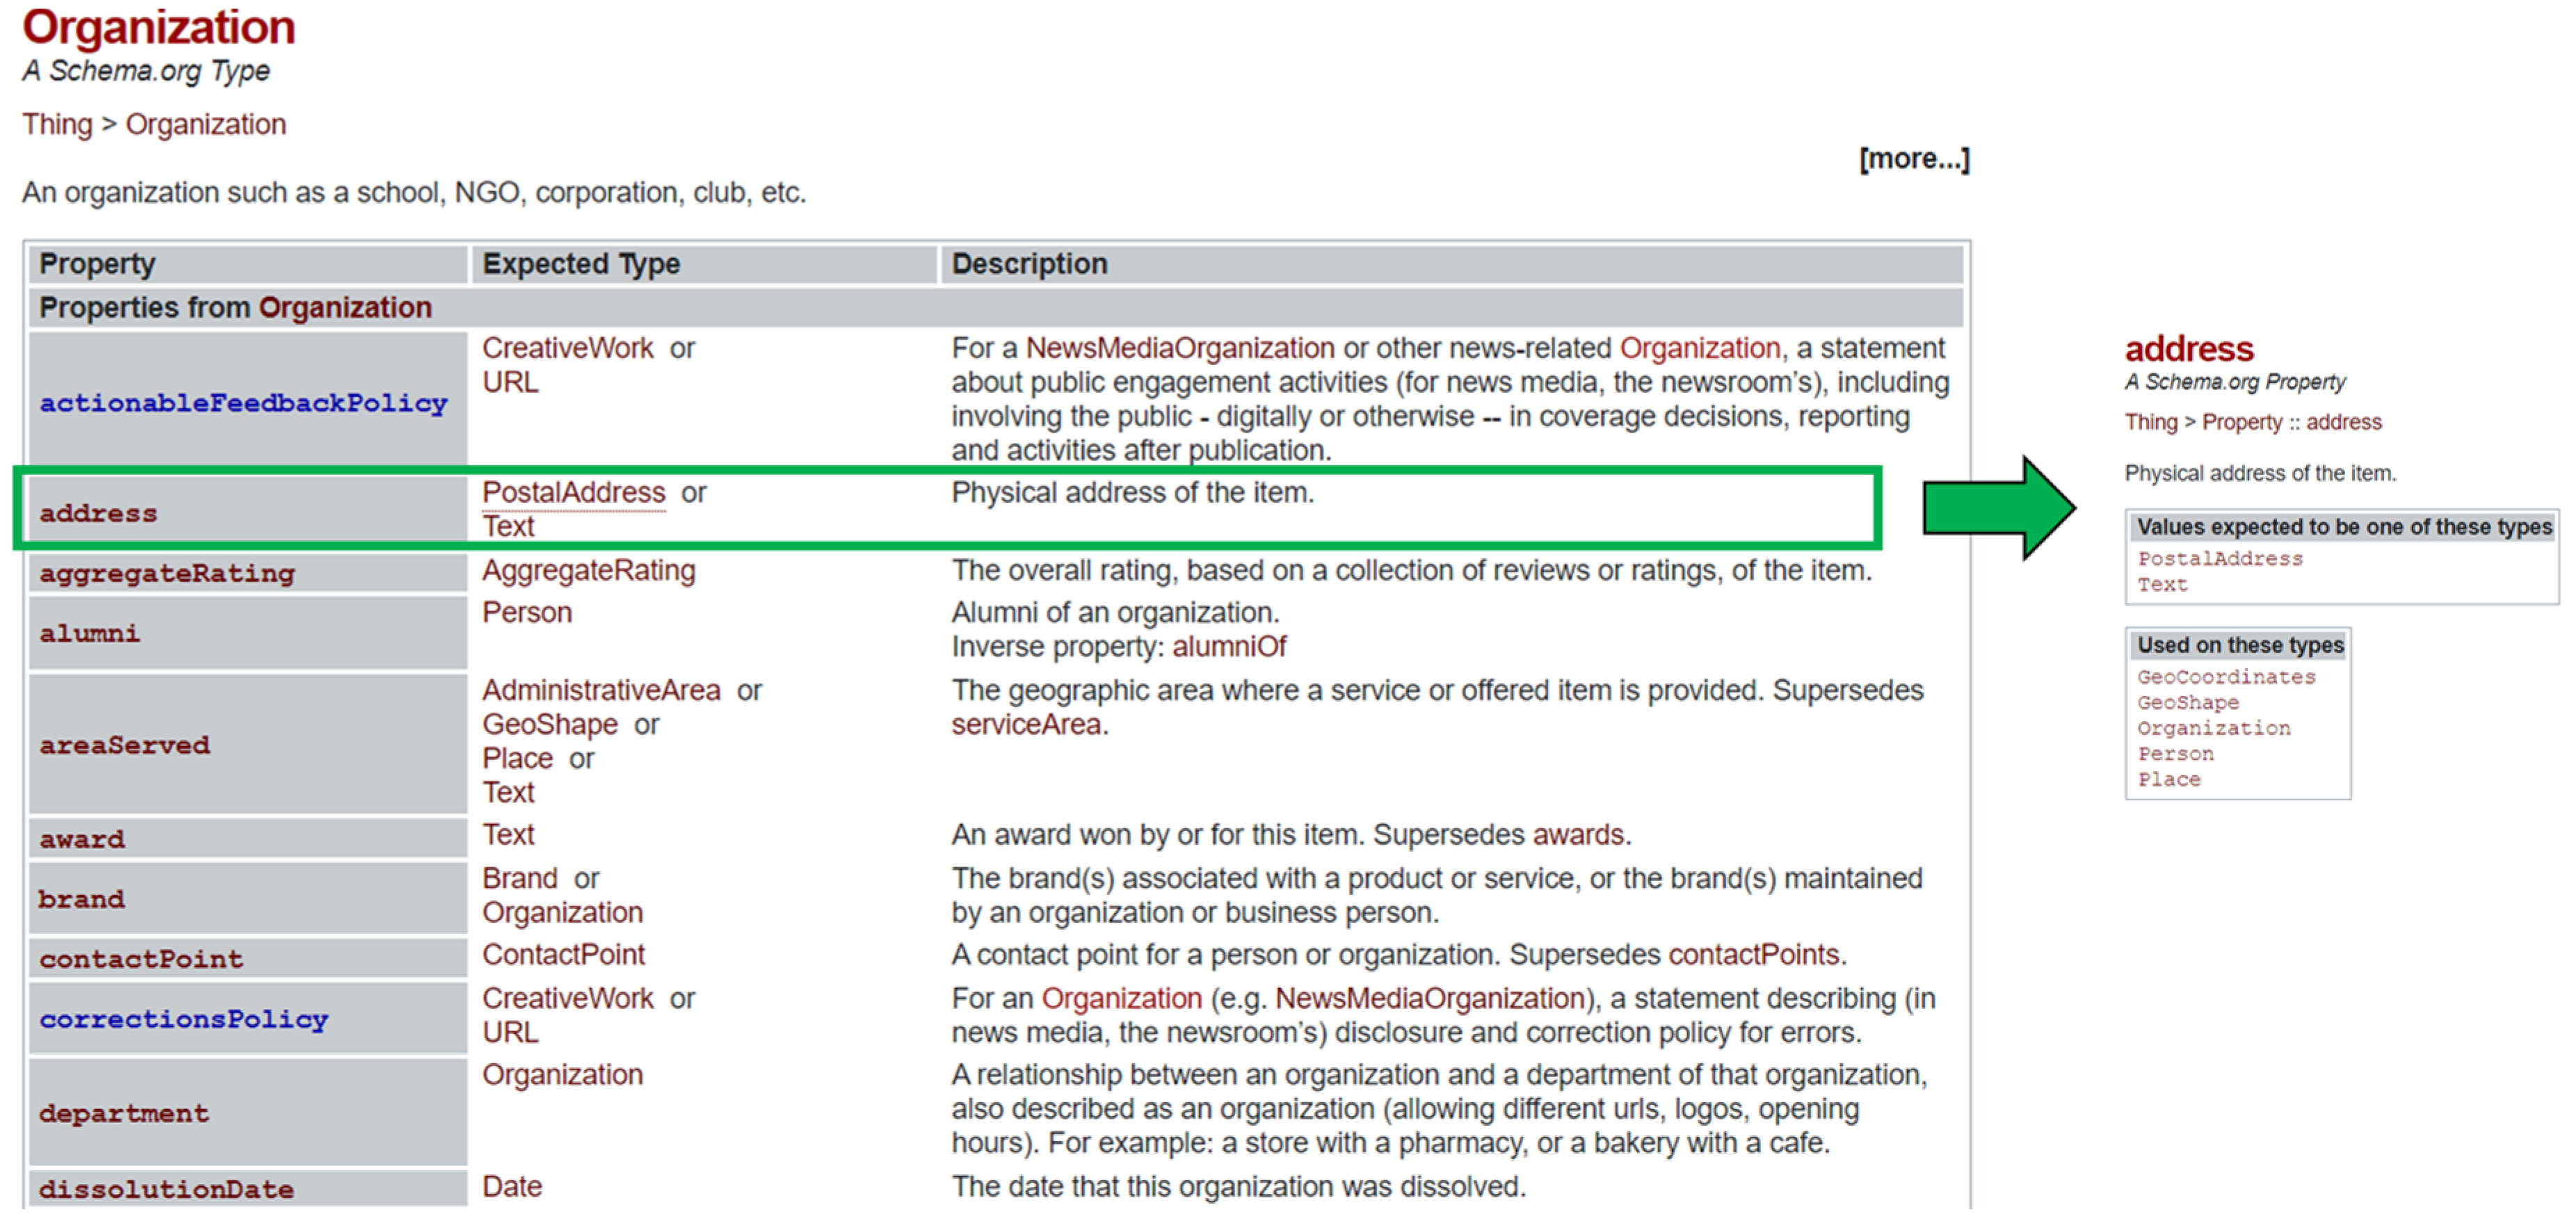
Figure 12 illustrates the rich, structured definitions available through Schema.org, specifically for the tag “Organization” (
https://schema.org/Organization, accessed on 13 May 2025) and its associated property “address” (
https://schema.org/address, accessed on 13 May 2025).
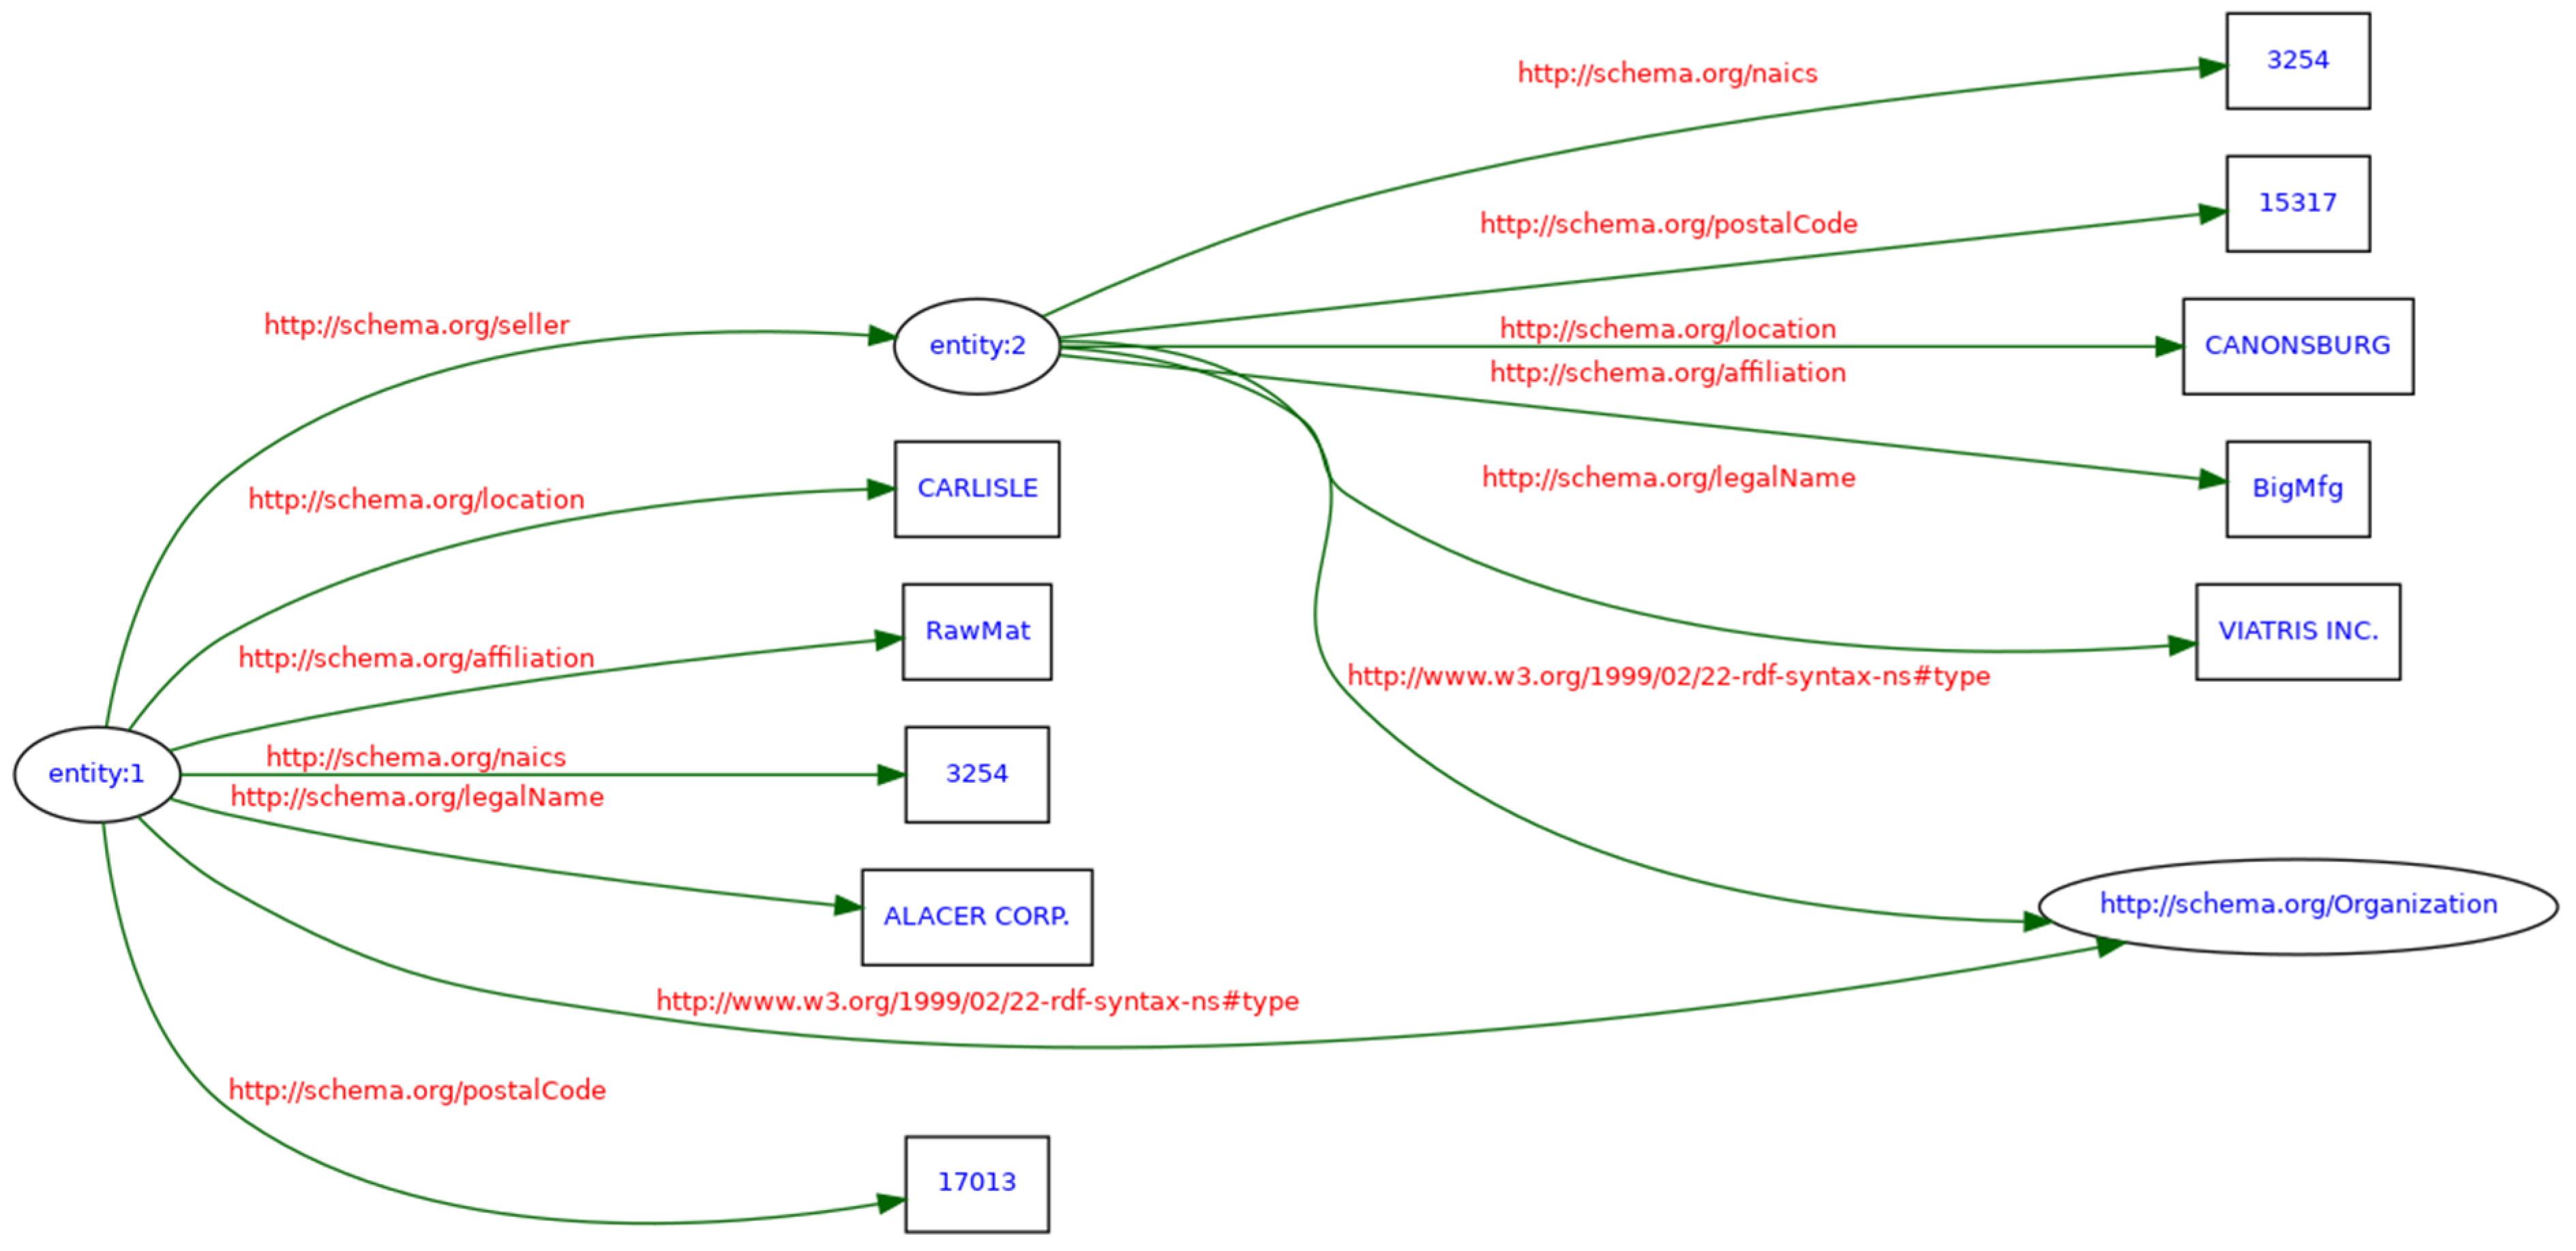
To ensure semantic interoperability of the RDF representation of the PA BioPharma knowledge graph, the generic Neo4j schema vocabulary is mapped to Schema.org vocabulary. This process involves identifying a corresponding term in Schema.org for each node label, property, and relationship in the original Neo4j schema. As a result, the Neo4j-specific URI prefixes (e.g., neo4j://graph.xxx) are systematically replaced with Schema.org URIs (e.g., https://schema.org/xxx), producing a semantically enriched RDF graph that aligns with publicly accepted web standards.
Table 3 presents the mapping between Neo4j schema elements and their equivalent Schema.org elements. A partial graphical view of the RDF graph updated with Schema.org vocabulary is shown in
Figure 13.
It is important to note that both Neo4j’s LPG model and RDF are based on underlying graph structures, which greatly simplifies the mapping process compared to data models based on tabular (relational) or document-oriented schemas [
63]. This structural similarity ensures that the transformation between LPG and RDF, especially when enhanced with Schema.org, is not only seamless but also preserves semantic context and data fidelity.
The transition of the PA BioPharma knowledge graph to RDF format extends beyond technical representation. RDF serialization aligned with Schema.org enables semantic interoperability, allowing the graph to integrate across platforms and applications. This alignment facilitates incorporation into Linked Open Data ecosystems, supplier discovery portals, and other web-based platforms, thereby extending the utility of the knowledge graph beyond its initial implementation. As a result, RDF serialization supports practical supply chain use cases such as enhanced partner discovery, cross-domain querying, and dynamic integration with emerging datasets.
4.5. Interoperability Validation
To evaluate the interoperability of the RDF-based graph data model generated from the Neo4j knowledge graph, the RDF serialization (comprising 16,086 triples) was imported into GraphDB [
64], a leading RDF triple store known for its native SPARQL support. The RDF file was loaded via the GraphDB browser interface, with the loading process completing in approximately 100 milliseconds. To assess interoperability, the same query scenarios discussed in
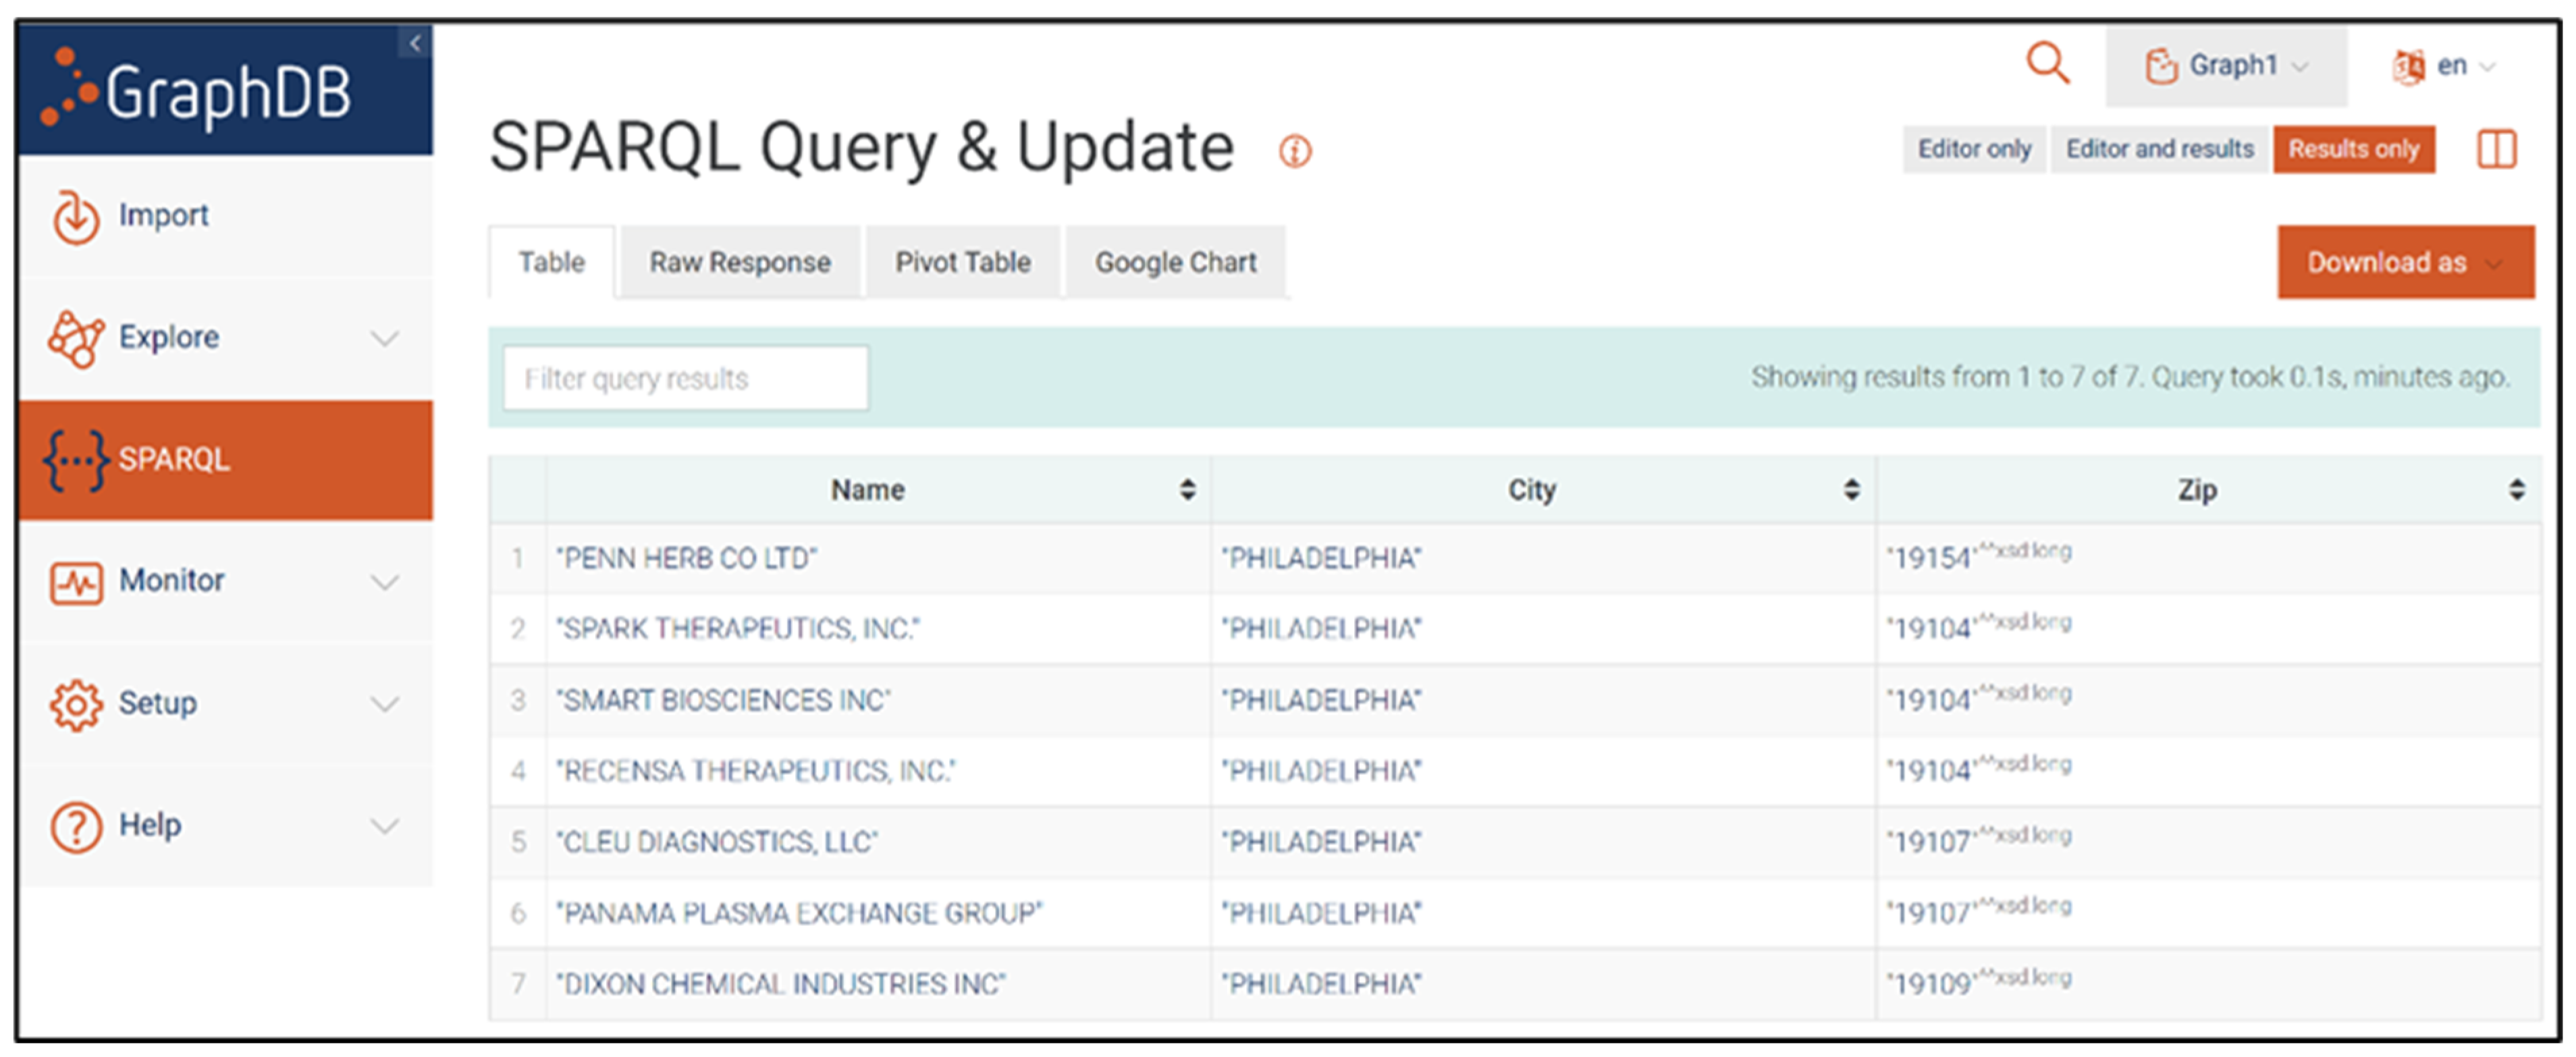
Section 3.1.3 were re-executed on the RDF graph within GraphDB. Each Cypher query used in Neo4j was translated into a semantically equivalent SPARQL query and implemented in GraphDB. The results obtained from GraphDB matched exactly with those from the Neo4j implementation, both in terms of returned entities and relationships. This confirms that the RDF representation preserved the structural and semantic integrity of the knowledge graph, demonstrating cross-platform operability between Neo4j and GraphDB.
Figure 14 illustrates the query results for Scenario 2 (
Section 3.1.3 (b)) as executed within GraphDB.
5. Discussion and Implications
Global supply chain disruptions have accelerated the shift toward localized manufacturing models, highlighting the strategic importance of regional small- and medium-sized enterprises (SMEs) in strengthening supply chain resilience. Despite this, large enterprises often face significant challenges in identifying and evaluating local SME partners due to fragmented data sources, lack of visibility, and limited access to reliable information. Conversely, SMEs struggle to gain exposure and integrate into larger supply chains, often hindered by resource constraints and limited networking opportunities.
This study presents a knowledge graph driven approach to model and analyze supply chain networks, using the PA biopharma sector as a representative case. Implementation of knowledge graphs using the Neo4j graph database effectively mapped SMEs and their interrelationships, demonstrating how such a framework can enhance supply chain scouting and diversification efforts. This aligns with prior research emphasizing the value of network-based models for representing inter-dependencies and enabling resilience analysis [
15,
16,
19]. A core strength of the knowledge graph-based approach is its support for complex, multi-hop querying, enabling users to uncover indirect relationships and hidden collaboration opportunities that may not be apparent through traditional search tools. This directly addresses the gaps noted in existing SME discovery approaches [
27,
29,
33]. The flexibility of the graph database also enables real-time updates and schema evolution, allowing the system to adapt as the supply chain network grows or changes, consistent with supply chain theory on dynamic capabilities for resilience [
9,
10]. This demonstrates a clear answer to RQ1: knowledge graphs can effectively represent SMEs and their relationships within a regional supply chain, enabling dynamic information retrieval and discoverability through multi-hop querying.
Moreover, by converting the knowledge graph into RDF format and aligning it with the Schema.org vocabulary, the knowledge graph becomes interoperable with external systems, facilitating broader integration and reuse across platforms. This feature addresses RQ2, showing that semantic web technologies improve the interoperability of SME data, enabling seamless exchange and integration across systems, and supporting cross-domain queries and collaboration. Validation was performed through the inspection of representative query results and relationship structures, confirming alignment with known supplier networks based on publicly available company data.
To contextualize the contributions of this work, a comparison was drawn with publicly accessible platforms such as Wikidata and Thomasnet. Although both platforms offer useful SME-related information, several limitations were observed. Wikidata, despite supporting complex SPARQL queries, suffers from partial and incomplete data coverage in domain-specific contexts such as the biopharma sector and exhibits slower response times compared to the proposed knowledge graph. Furthermore, Wikidata relies on manual or semi-automated updates, resulting in delayed or outdated information [
27,
31]. It also lacks support for complex, multi-conditional relationship queries and semantic enrichment necessary for advanced supply chain analysis. Thomasnet, on the other hand, primarily functions as a keyword-based directory, offering simple text search capabilities without support for graph-based queries or multi-hop relationship discovery. Its database structure does not facilitate exploration of indirect supplier connections or complex inter-enterprise relationships. Crucially, neither Wikidata nor Thomasnet support semantic interoperability or alignment with widely adopted vocabularies such as Schema.org, limiting their integration potential within broader web-based or linked data ecosystems.
In contrast, the proposed knowledge graph framework delivers curated, domain-specific data with flexible multi-hop querying, enabling discovery of complex inter-enterprise relationships. Its near-instantaneous query response times (about 10 milliseconds even for multi-hop queries) demonstrate a significant performance advantage. Additionally, its real-time update capability and semantic interoperability via RDF serialization and Schema.org alignment provide superior functionality and integration potential compared to existing platforms. These findings build upon prior work advocating for domain-specific, semantically interoperable supply chain knowledge graphs as enablers of SME integration and resilience [
27,
29,
34,
42]. A structured comparison of these approaches is presented in
Table 4.
The RDF serialization and Schema.org alignment of the PA BioPharma knowledge graph have significant implications for inter-enterprise data sharing and system integration. By adopting widely recognized semantic web standards, the framework enables seamless exchange of structured, machine-readable data across organizations [
34,
36,
42,
44]. This supports integration with external systems and open data repositories, enhancing partner discovery, enabling cross-domain querying, and fostering dynamic collaboration across supply chain networks. Such interoperability positions the knowledge graph as a scalable foundation for shared supply chain intelligence ecosystems, aligning with artificial intelligence (AI) and machine learning (ML) initiatives, platform-based manufacturing [
65], and enabling the development of digital supply chain twins.
While implementing a knowledge graph entails costs for software, infrastructure, and maintenance, several factors make this approach increasingly accessible for SMEs. Open-source graph database platforms like Neo4j Community Edition provide a cost-effective starting point, and cloud-based graph services offer scalable, pay-as-you-go options that lower upfront investment. Automation tools and prebuilt integration templates can further reduce technical complexity and cost. Additionally, shared industry platforms or consortium-based models present opportunities for SMEs to collectively access knowledge graph capabilities at a fraction of individual cost. With growing availability of affordable solutions and support models, the proposed framework is well-positioned to be a viable, practical tool for SMEs aiming to enhance visibility, collaboration, and resilience within regional supply chains.
Limitations
While the proposed knowledge graph framework demonstrates significant potential, several limitations must be acknowledged to contextualize its current scope and applicability. First, the approach relies heavily on the availability, quality, and diversity of input datasets. This study uses a single primary data source (Mergent Intellect) chosen for its reliability and domain-specific coverage of Pennsylvania’s biopharma sector. While this ensures quality for the proof-of-concept, reliance on one source limits coverage, generalizability, and the completeness of the knowledge graph. Missing or incomplete data may impact relationship discovery and reduce robustness. Furthermore, automating data ingestion remains a challenge that could impact scalability if not addressed through dedicated pipelines, as noted in prior work [
33,
38]. Expanding data sources and developing automated ingestion pipelines would strengthen coverage, resilience, and applicability.
Second, the targeted manual query validation was limited in scope, involving a stratified random subset of enterprises. This approach served as a proof-of-concept to confirm the feasibility and correctness of the knowledge graph’s querying methodology. However, larger-scale and more exhaustive validation would improve the robustness and generalizability of the conclusions. This could be addressed by developing automated validation tools, which are not currently available.
While the current implementation of the knowledge graph framework demonstrates robust performance on curated datasets, its scalability to larger networks warrants careful consideration. For instance, a comprehensive evaluation of graph database systems across three computing architectures and four scaling factors ranging from 1 GB to 1 TB revealed that Neo4j, while efficient for smaller datasets, exhibits performance bottlenecks for complex queries as graph size approaches 1 TB [
66]. Although the study reported occasional query timeouts in certain scenarios, Neo4j was generally able to execute queries within approximately 1000 s at the largest tested scale [
66]. These findings suggest that knowledge graph frameworks can be extended to handle larger datasets; however, increasing the scaling factor further, particularly beyond several million nodes and edges, may introduce challenges related to query execution time, timeouts, and performance degradation. Addressing these challenges may require alternative implementations, hardware optimizations, or architectural adjustments to ensure consistent performance as dataset sizes grow. Additionally, extending this framework to other sectors or regions would require addressing variations in data availability, domain-specific ontologies, and sector-specific regulatory requirements, which could impact both scalability and applicability.
Additional limitations relate to data confidentiality and legal considerations, which pose significant challenges for sharing RDF triples between platforms. Confidential business information embedded in RDF graphs raises privacy concerns, necessitating measures such as data anonymization, secure sharing protocols, and role-based access control. Furthermore, legal and regulatory restrictions such as intellectual property rights and data protection laws may limit RDF data exchange across organizations and jurisdictions. Addressing these issues is essential to fully realize the potential of RDF-based knowledge graphs for cross-platform supply chain integration.
6. Conclusions
This study developed a knowledge graph-driven framework for modeling and analyzing supply chain networks, using the Pennsylvania biopharma sector as a case study. The approach demonstrated that a curated, domain-specific knowledge graph implemented in Neo4j, converted to RDF, and aligned with Schema.org can significantly enhance visibility, interoperability, and discovery of complex inter-enterprise relationships. Key strengths of this work include support for multi-hop queries, real-time updates, and semantic interoperability, which together enable faster and deeper supplier discovery compared to existing platforms such as Wikidata and Thomasnet.
Stakeholders stand to benefit in several ways: large enterprises gain improved access to reliable, structured SME information for partner scouting and risk mitigation, while SMEs gain enhanced visibility and integration opportunities in larger supply chains. This addresses critical gaps in supply chain resilience and fosters dynamic collaboration, particularly in sectors where rapid adaptation to disruptions is essential.
While the findings provide strong proof-of-concept evidence, limitations in data scope, scalability, and automated validation highlight opportunities for future work. Future research should move beyond the manual proof-of-concept validation by developing automated methods to improve scalability and accuracy. Extending the RDF-serialized knowledge graph for integration with external systems such as Linked Open Data or supplier discovery portals could further enhance interoperability and broaden its applicability across platforms. Since Neo4j performance may degrade at extremely large datasets, addressing scalability through optimization, alternative graph platforms, or distributed architectures will be essential for large-scale adoption. Additional opportunities include expanding data sources to improve generalizability across regions and industries, automating ingestion pipelines to reduce manual effort, developing user-friendly query interfaces such as natural language processing (NLP) to increase accessibility for non-technical users, and integrating predictive analytics and AI-driven insights to enable proactive supply chain risk management.

