Abstract
Background: The transportation of petroleum products via multimodal logistics systems is a complex process subject to operational inefficiencies and elevated risk exposure. The efficient and resilient transportation of petroleum products increasingly depends on multimodal logistics systems, where operational risks and process inefficiencies can significantly impact safety and performance. This study addresses the research question of how an integrated risk-based and workflow-driven approach can enhance the management of oil products logistics in complex port environments. Methods: A dual methodological framework was applied at the Port of Midia, Romania, combining a probabilistic risk assessment model, quantifying incident probability, infrastructure vulnerability, and exposure, with dynamic business process modeling (BPM) using specialized software. The workflow simulation replicated real-world multimodal oil operations across maritime, rail, road, and inland waterway segments. Results: The analysis identified human error, technical malfunctions, and environmental hazards as key risk factors, with an aggregated major incident probability of 2.39%. BPM simulation highlighted critical bottlenecks in customs processing, inland waterway lock transit, and road tanker dispatch. Process optimizations based on simulation insights achieved a 25% reduction in operational delays. Conclusions: Integrating risk assessment with dynamic workflow modeling provides an effective methodology for improving the resilience, efficiency, and regulatory compliance of multimodal oil logistics operations. This approach offers practical guidance for port operators and contributes to advancing risk-informed logistics management in the petroleum supply chain.
1. Introduction
The multimodal transportation of petroleum products has become a vital component of modern supply chain operations, especially in the maritime port environment where safety, regulatory compliance, and operational efficiency must be carefully balanced. In recent decades, the logistics of oil products and chemical cargo has drawn significant academic and industrial attention, particularly as ports evolve into smart and integrated hubs. Multimodal transport refers to the integration of multiple transport modes—maritime, rail, road, and pipeline—for the efficient movement of cargo, especially hazardous petroleum products. The global logistics industry has increasingly adopted multimodal frameworks to reduce environmental impacts, enhance cost-effectiveness, and improve cargo traceability [1].
Regarding the logistics of oil product operations, multimodal systems optimize fuel transfer from offshore terminals to inland distribution points, mitigating single-mode dependency and enhancing risk resilience. In the case of the Port of Midia in the Romanian Black Sea region, selected as a case study in the present research, the integration of sea, pipeline, rail, and road transport systems represents a critical structure for national fuel supply. Similar port logistics models are documented in ports such as Rotterdam and Antwerp, where sophisticated intermodal operations are core to petrochemical distribution [2], with modern oil terminals integrating sensor-driven loading arms, automated hose systems, and real-time monitoring [3].
Regarding risk management in multimodal transports and port operations, it is well known that the transportation of oil products entails considerable risks, including spillage, explosion, contamination, and operational delays. Scholars have emphasized the need for integrated risk management frameworks combining qualitative assessments with quantitative modeling, the main approaches being outlined in Table 1 [4]. The use of probabilistic risk models, as implemented in the applied case study of the Port of Midia in the present research, aligns with advanced approaches such as Monte Carlo simulations and Fault Tree Analysis in maritime risk assessment [5]. Russo and Vitetta (2006) proposed a framework that links transport system vulnerabilities to incident probabilities, closely resembling the model applied at the Port of Midia [6].

Table 1.
Oil operation concepts—literature review.
The application of Business Process Management (BPM) tools like AuraPortal BPM Modeler vs. 1.7.32 in logistics is a novel approach, with few documented implementations in oil operation logistics. However, comparative case studies in containerized cargo operations and livestock transport modeling highlight the power of BPM to identify bottlenecks and simulate real-time decision-making [18]. Simulation-based logistics planning allows organizations to visualize operational flows, identify latent inefficiencies, and test alternate scenarios [7]. By replicating this approach in the oil terminal operations in the Port of Midia, the study bridges a practical gap in maritime logistics literature.
In reference to legislative and environmental compliance, oil product operations must align with several European regulatory frameworks, including REACH Regulation (EC) No 1907/2006, Directive 2008/68/EC, and Regulation (EU) 2019/1242 [10,11]. Research by Bektas et al. (2016) stresses that logistical efficiency should not compromise environmental compliance, a concern echoed in their risk management methodology [19]. The integration of AND Convention requirements into inland tanker operations enhances safety benchmarks (European Agreement concerning the International Carriage of Dangerous Goods by Inland Waterways, UNECE 2025 [24]). Scholars have emphasized the importance of embedding such protocols into simulation models for the proactive mitigation of non-compliance risks [14].
Several case studies have been conducted on an international level, in relation to the present approach, by focusing on the following ports:
- -
- Port of Rotterdam: the deployment of AI-based risk detection models combined with terminal automation has led to a 23% reduction in handling delays [8];
- -
- Singapore Maritime Hub: the integration of BPM systems for crude oil transfer led to optimized berth utilization and a reduction in the idle time of vessels by 30% [13];
- -
- Norwegian Ports: the use of weighted mean modeling in assessing human factor risks in Arctic petroleum transport mirrors this study’s statistical method [15];
- -
- Constanța Port (Romania): a regional comparative analysis showed that risk probability and infrastructure vulnerability metrics are applicable in ports handling mid-scale petroleum cargo, reinforcing the analytical consistency of this study [10,11,25].
The dominant role of human error—crew negligence, poor decision-making, and fatigue—in maritime incidents is widely reported in global maritime studies. The actual findings of the present study (i.e., crew negligence at 51.68%) echo global averages highlighted by IMO and EMSA [11], suggesting a universal imperative for enhanced training and human reliability modelling [12].
While risk assessment models are increasingly applied to maritime logistics, a notable research gap persists in integrating dynamic workflow simulation tools with risk analysis, particularly for the cargo flows of oil products. Very few studies systematically combine business process modeling (BPM) with quantitative risk analysis to optimize petroleum logistics operations [18,26]. Most port logistics risk studies remain focused on static assessments or limited descriptive evaluations without dynamic simulations that reflect real-time operational complexities.
Recent research highlights the growing use of digital twins (DT), advanced risk modeling, and business process modeling (BPM) in maritime logistics and port operations. Zhou et al. present a DT-enabled framework for smart maritime logistics aligned with Industry 5.0 principles [10]. Kaklis et al. (2023) explore the integration of AI and DT technologies to enhance maritime process monitoring and decision support [21]. Popa et al. apply BPM and risk analysis to multimodal operations in Black Sea ports, providing valuable insights for regional logistics modelling [18]. Homayouni and Pinho de Sousa review the role of DT in promoting sustainable and resilient port operations, emphasizing risk-informed management [22]. Ghafari and Samaei propose an integrated AI-DT framework for managing complex coastal and port infrastructure systems [23]. Building upon these advances, the present study contributes to the novel integration of probabilistic risk modeling and BPM-based simulation, applied to the specific context of petroleum logistics chains, an area where dynamic risk-informed workflow optimization remains underexplored.
While risk assessment and workflow simulation have each been individually applied to maritime and port logistics, few studies have systematically combined these approaches within the specific context of petroleum products multimodal operations. Prior works, such as those by Ventikos and Psaraftis and Wu et al., have focused primarily on static risk modeling frameworks without dynamically testing the operational impacts on logistics workflows [4,26]. Conversely, recent efforts in BPM-based modeling (He et al., 2021) emphasize process optimization but lack integrated risk quantification aligned with probabilistic analysis [27]. This study addresses this gap by proposing an integrated methodological framework that links probabilistic risk assessment with business process modeling (BPM), embedding quantitative risk factors directly into workflow simulations. Moreover, the application of this combined approach to a real-world case study of a medium-sized petroleum port (Port of Midia) across full multimodal transport chains (maritime, pipeline, rail, road, inland waterway) represents a novel contribution not previously documented in the literature. The framework enables predictive control and real-time scenario testing, thereby advancing both the theoretical understanding and practical implementation of risk-informed petroleum logistics management.
In response to this gap, the present study proposes an integrated framework using AuraPortal BPM Modeler vs. 1.7.32 to simulate oil product logistics flows combined with probabilistic risk modeling. The objectives are to optimize multimodal logistics processes, identify operational bottlenecks, and ensure compliance with evolving European safety and environmental regulations. By bridging risk quantification and workflow simulation, this research aims to contribute to both theoretical development and practical improvements in the management of multimodal oil product operations.
Building on the identified gaps in the literature, this study addresses the following research questions:
- -
- how can probabilistic risk assessment be effectively integrated with dynamic business process modeling (BPM) to optimize multimodal oil logistics operations?
- -
- what are the most critical operational risks and bottlenecks in oil product logistics at a medium-sized petroleum port?
- -
- how can simulation-based process optimization contribute to enhancing safety, efficiency, and regulatory compliance in complex logistics environments?
The main contributions of this study are as follows:
- -
- it proposes an integrated methodological framework combining probabilistic risk modeling with BPM-based workflow simulation, addressing a gap in the existing petroleum logistics literature;
- -
- it applies this framework to a real-world case study (Port of Midia), providing empirical insights into multimodal oil logistics processes;
- -
- it demonstrates how risk insights can be structurally embedded into BPM simulations to enable dynamic risk-informed process optimization;
- -
- it provides actionable recommendations for improving operational resilience, cost efficiency, and compliance alignment in petroleum supply chains;
- -
- it validates the integrated model through comparison with real-world operational data and scenario-based simulation, highlighting its practical applicability.
2. Research Gaps and Study Objectives
Oil products logistics processes, particularly in maritime port areas, are characterized by a high degree of complexity due to the hazardous nature of the cargo, the strict regulatory frameworks, and the operational vulnerabilities inherent to multimodal transport systems. Over time, increasing attention has been paid to developing strategies that enhance the resilience and efficiency of such logistics chains [1,4,26,28,29]. Multimodal transport in the oil products sector involves the seamless integration of maritime, rail, road, and pipeline operations under unified management systems. As defined by Steadie Seifi et al. (2014), multimodal freight transportation utilizes at least two different modes of transport in a single journey, with the goal of optimizing flexibility, speed, and cost-efficiency [30]. In oil operation logistics, this approach allows for more robust distribution frameworks but simultaneously introduces compounded risk exposure due to the number of interfaces and transfer points involved. From this perspective, risk management has long been a critical focus in oil products transportation research. According to Baalbergen, van Gelder, and Blok (2013), ship-to-ship (STS) transfer operations, as well as port reception and cargo handling activities, are susceptible to operational incidents, environmental hazards, and human error [5]. Russo and Vitetta (2006) emphasize the need for transport system vulnerability assessments that move beyond qualitative estimations to probabilistic modeling, allowing for the structured evaluation of failure likelihoods and impacts [6].
In parallel, the rise of digitalization and Industry 4.0 technologies has propelled the use of business process management (BPM) and simulation tools to improve logistics performance. BPM provides a structured methodology for visualizing, analyzing, and optimizing operational workflows within complex organizations, including ports [31]. Although BPM tools have been widely applied in containerized freight logistics, their application in the petroleum logistics sector remains limited [18]. The integration of BPM with quantitative risk assessment methodologies thus offers a promising yet underexplored pathway for enhancing operational resilience and regulatory compliance.
Moreover, emerging risks such as cybersecurity threats and climate change impacts are increasingly recognized as factors that complicate the management of petroleum logistics flows [27]. These risks necessitate adaptive frameworks that can dynamically respond to evolving threats, reinforcing the value of simulation-based, real-time risk monitoring systems.
The existing literature suggests that while risk analysis and workflow modeling have each been individually applied to logistics systems, their combined application, particularly within the context of petroleum product handling in multimodal environments, is still rare. In this context, this study seeks to address this gap by integrating probabilistic risk modeling with BPM-based process simulation, thereby offering a comprehensive framework to analyze and optimize the oil logistics operations at a critical petroleum terminal.
To address the identified gaps, this study sets forth four core objectives, considering the case study of the Port of Midia, that aim to bridge the disconnect between theoretical modeling and the practical optimization of the oil supply chain, as follows:
- Optimization of multimodal logistics flows—this objective focuses on identifying and analyzing the critical operational factors that influence time efficiency and coordination across maritime, rail, road, and inland waterway transport. Then, using the AuraPortal BPM Modeler vs. 1.7.32 platform, the study simulates real-world scenarios, including adverse weather, technical incidents, or documentation delays, to optimize the oil unloading/discharging and distribution workflows [32].
- Evaluation and mitigation of operational risks—a risk-based approach is employed to identify key vulnerabilities in the oil products loading and discharging process, such as berthing maneuvers, terminal–pipeline connections, and the mechanical reliability of transfer systems. Through the application of quantitative risk modeling, the likelihood and severity of disruptive events like spills, pump failures, or pressure anomalies are assessed using historical port data.
- Regulatory compliance assessment—the third objective evaluates how the Port of Midia’s operations align with relevant European and international standards, including Regulation (EU) No. 2019/1242 on CO2 emissions from heavy-duty vehicles, Regulation (EC) No. 1907/2006 (REACH) concerning hazardous chemical substances, and the provisions of Directive 2008/68/EC, with refers to the inland transport of dangerous goods. The study also integrates the European Agreement concerning the International Carriage of Dangerous Goods by Inland Waterways Convention (ADN) stipulations for the safe transport of hazardous goods via inland waterways and proposes methods to optimize handling procedures without compromising legal compliance [24].
- Development of a simulation-based risk management model—leveraging AuraPortal BPM Modeler vs. 1.7.32, this objective aims to create a digital twin of the diesel logistics workflow that can simulate dynamic risk scenarios. This includes testing the impact of various disruptions, such as traffic congestion or newest security threats (e.g., drifting naval mines), and assessing the effectiveness of alternative mitigation strategies; by integrating simulation outputs with operational data, a more robust and responsive risk management system is proposed.
Collectively, these objectives are designed to improve the resilience, transparency, and efficiency of oil products logistics flows at the Port of Midia, considered as a case study scenario. As underlined in the following sections, this study contributes to filling a critical research gap by providing a data-driven, simulation-based framework for risk mitigation and regulatory alignment in multimodal oil transport.
3. Research Method
The present study employs a dual methodological approach to analyze risks and optimize operations in the multimodal transport of petroleum products at the Port of Midia. The first method consists of a quantitative risk assessment model designed to evaluate the probability and impact of operational disruptions across the petroleum logistics chain. The second method integrates business process modeling (BPM) using the Aura Portal BPM, enabling a simulation-based analysis of logistics workflows under various conditions.
The quantitative model is grounded in a probabilistic framework that accounts for key parameters: the likelihood of incident occurrence (P), the vulnerability of port infrastructure (V), and the exposure of goods and assets to these risks (N). This framework allows the derivation of a composite risk score, offering a structured, data-driven understanding of the most critical threats to safe and efficient operations. Variables such as equipment failure, human error, environmental conditions, and regulatory non-compliance are evaluated using weighted historical data and normalized against operational benchmarks.
In parallel, the workflow simulation component models the complete sequence of diesel handling operations, from the arrival of maritime tankers and berthing at Berth 9B, through unloading procedures and safety checks, to inland distribution via pipelines, road tankers, rail, and river transport. The AuraPortal BPM Modeler enables the dynamic visualization of these logistics processes, highlighting potential inefficiencies and critical control points. Key elements such as mooring procedures, hose connections, pump performance, cargo sampling, and documentation flow are included in the simulation environment, providing a detailed view of the system’s behavior under both routine and disruptive scenarios.
One notable dimension of the simulation involves security risk assessment, particularly concerning the presence of drifting naval mines in the Black Sea, a consequence of the nearby conflict zone. The modeling environment includes scenario-based testing for this and other hazards such as severe weather, traffic congestion, and technical malfunctions. These simulations support the development of emergency response strategies, rerouting plans, and infrastructure resilience measures. By integrating mathematical modeling with BPM simulation, the research method offers both statistical rigor and operational insight. This combination ensures a comprehensive evaluation of petroleum logistics at the Port of Midia, enabling the identification of bottlenecks, the assessment of compliance with European and ADN standards, and the formulation of targeted risk mitigation strategies [24].
This study adopts a dual methodological approach to comprehensively analyze risks and optimize operations within the multimodal transport of petroleum products. The first component involves a quantitative probabilistic risk assessment, while the second applies business process modeling (BPM) through the AuraPortal BPM Modeler vs. 1.7.32 [32]. The combination of these two methods allows for both static risk quantification and dynamic process simulation, bridging a critical gap between theoretical risk evaluation and operational workflow optimization.
Figure 1 illustrates the dual methodological framework applied in this study, combining quantitative risk assessment with business process modeling (BPM) to optimize the oil products logistics flow at the Port of Midia. The methodology begins with the construction of a probabilistic risk model based on historical port data and statistical weighting derived from EMSA and operational reports [10,11]. Subsequently, key operational risks, spanning human, technical, environmental, and compliance categories, are identified and prioritized. Parallel to the risk modeling, a digital simulation of the diesel handling workflow is developed using AuraPortal BPM Modeler, mapping critical tasks and operational dependencies. Through scenario simulations, including adverse weather conditions, equipment malfunctions, and customs delays, the workflow’s resilience is stress-tested. Integration occurs by embedding risk insights directly into the workflow logic, allowing risk mitigation to be structurally incorporated into daily operations. Finally, validation is performed via multi-instance simulations, running over 100 sequential replications of the process to assess performance under varying risk conditions. This integrated methodological approach enables the creation of an optimized, risk-informed oil logistics workflow capable of enhancing resilience, efficiency, and regulatory compliance.
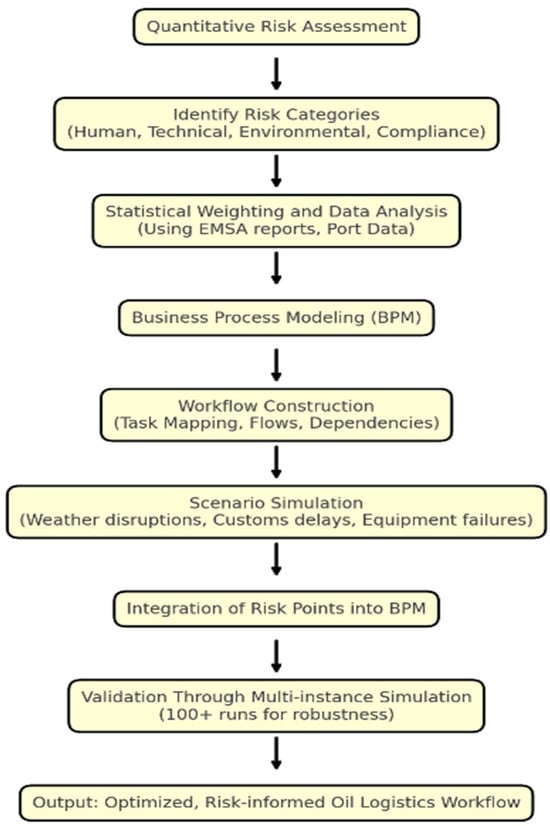
Figure 1.
Research methodology—integration of quantitative risk assessment and business process modelling (Source: developed by authors).
- a.
- Quantitative risk assessment framework
The risk assessment framework is structured around the probabilistic estimation of key operational vulnerabilities, based on three core parameters: the probability of incident occurrence (P), the vulnerability of port infrastructure (V), and the exposure of goods and assets to potential hazards (N). These parameters are integrated into a composite risk score using the following formulation: R = P × V × N; here, each parameter is derived from empirical port data, historical accident reports, and expert evaluations, normalized against established benchmarks [4,5]. The variables considered include human factors (e.g., crew negligence, decision-making failures), technical risks (e.g., equipment malfunctions, poor maintenance), environmental risks (e.g., adverse weather conditions), and compliance risks (e.g., regulatory violations). Weighted statistical techniques are employed to prioritize these risks based on their historical frequency and operational impact. The probabilistic model enables the identification of high-risk operational segments within the multimodal logistics flow, thereby informing targeted mitigation strategies.
- b.
- Business Process Modeling framework
In parallel with the risk assessment, business process modeling is conducted using AuraPortal BPM Modeler vs. 1.7.32. The BPM tool is employed to construct a detailed, dynamic simulation of the oil logistics workflow, from ship arrival and docking procedures to discharging operations and inland distribution via rail, road, and river transport. The BPM model is structured into modular tasks (e.g., documentation, quality control, transfer operations), linked through conditional gateways that reflect real-world operational dependencies. By modeling these tasks within a dynamic environment, it becomes possible to visualize workflow bottlenecks, simulate disruption scenarios, and test the effectiveness of alternate process designs [31]. Through multiple simulation running instances, the BPM model validates the risk assessment outputs by demonstrating how the identified vulnerabilities manifest within operational flows, quantifying the cumulative impact of delays, equipment failures, or documentation issues on overall logistics efficiency.
- c.
- Integration of risk management and BPM simulation
The methodological integration of probabilistic risk modeling and business process simulation represents a major contribution of this study. Risk assessment provides a static snapshot of vulnerabilities and critical points, while BPM simulation brings these risks to life within a dynamic operational environment. This integration allows for:
- -
- scenario testing: evaluating how risk factors affect workflows under varying conditions (e.g., adverse weather, customs delays);
- -
- real-time validation: cross-referencing simulated disruptions with risk model outputs to improve predictive accuracy;
- -
- operational optimization: refining workflows to pre-emptively mitigate high-risk process stages.
By coupling quantitative analysis with simulation-based experimentation, the study enhances the robustness of risk mitigation strategies, providing actionable insights for port authorities and logistics operators. The approach aligns with emerging best practices in port logistics and oil products supply chain management, where digital twins and dynamic simulation models are increasingly deployed to manage complex, risk-sensitive operations [26,27]
The integration of the probabilistic risk assessment (P × V × N) with the BPM-based workflow simulation was conducted through the following steps:
- Risk model development—a probabilistic risk model was constructed, quantifying the likelihood (P), vulnerability (V), and exposure (N) for each operational segment (Section 4). Each risk subcategory (e.g., crew negligence, equipment failure, environmental hazard) was assigned a weighted probability based on empirical data.
- Mapping risk factors to BPM process stages—each risk subcategory was mapped to relevant BPM process tasks:
- -
- human error → berthing, customs processing, documentation steps;
- -
- technical risks → pump performance, pipeline transfer, equipment connection tasks;
- -
- environmental risks → berthing windows, discharge timing, lock transit;
- -
- compliance risks → customs checks, document preparation.
- Embedding risk into simulation logic—the BPM model was designed with conditional gateways and stochastic distributions:
- -
- the probability terms from the risk model were used to define variation ranges and delay probabilities at specific process nodes—for example, a technical risk probability of X% triggered extended durations or required rework loops in the BPM tasks;
- -
- environmental risk levels modified task timing variability (e.g., increased berthing delays during high sea state);
- Scenario simulation
- -
- multiple simulation scenarios were executed: baseline (average risk profile), worst-case (upper bound of risk probabilities applied to task performance) and best-case (minimal risk levels);
- -
- each scenario incorporated the calculated risk weightings into task duration variability, process flow branching, and resource availability;
- Feedback and optimization:
- -
- simulation results were analyzed to observe the cumulative impacts of risk on process duration and cost;
- -
- identified bottlenecks and high-risk nodes were used to adjust process designs in the BPM model;
- -
- final process optimizations were validated through repeated BPM runs incorporating the probabilistic risk-adjusted parameters.
This integration approach ensures that risk insights are not merely post-analysis, but are structurally embedded into the simulated logistics workflow, enabling the dynamic, risk-informed optimization of multimodal oil operations.
- d.
- Methodological limitations
While the integrated methodology strengthens the study’s contributions, certain limitations must be acknowledged:
- -
- model simplification: the BPM environment necessarily abstracts certain real-world variables (e.g., exact weather volatility, sudden human behavioral deviations), which could introduce discrepancies between simulated and actual operations;
- -
- data constraints: historical accident data, although extensive, may not capture emerging risks (e.g., cybersecurity threats) that increasingly impact port operations;
- -
- scope limitation: the risk model and BPM simulation are tailored to diesel oil logistics at a medium-sized petroleum port. Generalization to other port types (e.g., LNG terminals, mega-ports) may require model adaptation;
- -
- technological dependence: the study assumes the consistent performance of BPM tools and supporting infrastructure; however, digital platform failures themselves constitute an operational risk not modeled here.
Recognizing these limitations, this study advocates for continuous model refinement and the integration of real-time data streams into future versions of the simulation framework.
The integrated modeling framework employed in this study is based on several key assumptions that influence both the probabilistic risk assessment and the BPM simulation outcomes. In the risk model, we assumed that the historical accident data used (EMSA, APMC, NMA reports) are representative of current operational risk profiles and that risk factors (human, technical, environmental, compliance) can be meaningfully combined through weighted means to derive a composite risk score [10,11,15,25]. The model also assumes that the probability of adverse events follows stable patterns over time, which may not fully capture emerging risks (e.g., cybersecurity, climate-induced hazards). In the BPM simulation, we assume that the process durations and decision probabilities observed during the February–March 2025 monitoring period are representative of long-term operational behavior. Scenario variability is modeled through stochastic distributions around observed means but does not account for highly rare catastrophic events (black swans). The model also assumes the consistent performance of ICT and BPM systems, which are themselves potential risk points not explicitly modeled. These assumptions may result in some underestimation of rare or compound risk impacts and may limit its direct transferability to ports with substantially different operational profiles. However, by transparently stating these assumptions and continuously validating the model against observed data, we aim to ensure that the framework provides a realistic and practically useful representation of multimodal oil logistics at the Port of Midia.
The integrated modeling framework employed in this study is based on several key assumptions, which may influence the interpretation of results:
- -
- Historical data representativeness—the probabilistic risk model assumes that the historical accident data used (EMSA, APMC, NMA reports) are representative of the current operational risk profile of the Port of Midia [10,11,15,25]. This may not fully capture emerging risks (e.g., cybersecurity, climate-induced hazards), potentially underestimating some modern risk factors;
- -
- Combining risk factors—risk factors (human, technical, environmental, compliance) are combined through weighted means to derive a composite risk score. This assumes that the interaction effects between risk factors are either negligible or indirectly captured through historical weighting—complex interdependencies may therefore not be fully modelled;
- -
- Process stability and duration distributions—the BPM simulation assumes that the process durations and decision probabilities observed during the February–March 2025 monitoring period are representative of long-term operational behaviour. While scenario variability is included, rare catastrophic events (black swans) are not explicitly modelled;
- -
- ICT and BPM System Stability—the model assumes consistent performance of ICT infrastructure and BPM platforms. Failures of these digital systems themselves are not modeled as risk factors, although they may impact real-world operations.
These assumptions may result in the following:
- -
- The potential underestimation of highly rare or compound risk impacts;
- -
- The conservative estimation of system resilience, especially under emerging risk scenarios;
- -
- Limitations in direct generalization to ports with substantially different operational profiles or technological maturity.
Nonetheless, by transparently stating these assumptions and validating the model against observed operational data, we aim to provide a robust and practically useful representation of multimodal oil logistics at the Port of Midia.
4. Evaluation of Operational Risks Through Mathematical Modelling: Case Study of Port of Midia
To evaluate the operational risks associated with the multimodal transport of oil products, the authors have chosen the Port of Midia, a specialized port in the western Black Sea region, as shown in Figure 2. The study applies a combined methodological framework that integrates statistical analysis with mathematical risk modelling, this dual approach providing both a qualitative and quantitative understanding of the vulnerabilities present in maritime logistics operations. The primary objective of this evaluation is to identify and assess the most significant risk factors that could compromise safety, efficiency, or regulatory compliance throughout the logistics chain. Particular attention is given to the role of human error, equipment malfunction, adverse environmental conditions, and deviations from legal safety standards. By synthesizing historical data with weighted statistical indicators, the model enables a comprehensive risk profiling of key operations such as vessel berthing, fuel transfer, and multimodal distribution.
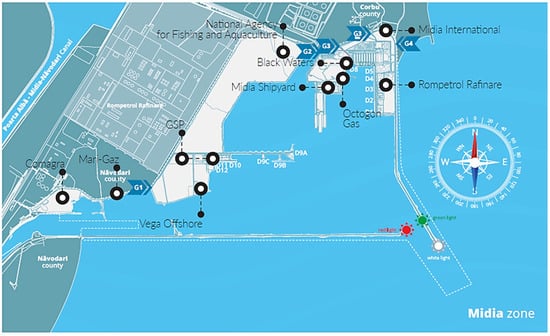
Figure 2.
Layout of the Port of Midia’s operational zones and berths used for oil operation.
The data collection process for the probabilistic risk model was designed to ensure both recency and comparability across multiple authoritative sources. The primary datasets used include:
- -
- EMSA Maritime Accident Reports (2023)—providing recent pan-European maritime incident statistics [10,11];
- -
- Port of Constanța Authority (APMC) operational and safety reports (2023–2024)—offering port-specific operational and incident data for the Romanian Black Sea region [25];
- -
- Norwegian Maritime Authority (NMA) “Risk Influencing Factors” Report (2015)—providing an in-depth analysis of human factor risk weightings and causal factors, validated through cross-referencing with recent EMSA and IMO trend analyses [15].
Reliability was ensured by prioritizing official institutional sources with established data collection and validation methodologies. Comparability was achieved through a structured two-step process:
- -
- Data harmonization: all risk factors from the various sources were mapped into a common taxonomy of human, technical, environmental, and compliance risks;
- -
- Weighted statistical integration: to account for variations in scope, coverage period, and regional focus, weighting factors were applied to each source, reflecting its relevance and reliability. This ensured that no single source disproportionately influenced the composite risk model.
This rigorous approach ensures that the risk model reflects a balanced and up-to-date view of the operational risks relevant to multimodal petroleum logistics in the Port of Midia.
The first phase of the risk assessment involved the systematic collection and synthesis of maritime accident data from a variety of official and peer-reviewed sources. These included reports from the European Maritime Safety Agency [10,11], records from the Port of Constanta Authority [25], or the “Risk Influencing Factors” report published by the Norwegian Maritime Authority [15], together with several academic studies focused on maritime accident causality. By aggregating and cross-referencing these sources, this study was able to develop a robust dataset for quantifying the risk categories relevant to the logistics of oil product operations at the Port of Midia (Constanta port area, Romania, Western Black Sea region).
To evaluate the relative significance of each identified risk factor, a weighted statistical method was applied. This approach enhances the accuracy of risk prioritization by assigning differential importance to data sources based on their reliability and scope. The weighted mean was computed using the following formula:
where:
- M = the weighted mean of the percentage values,
- = percentage value of each subcategory;
- = weighting factor assigned to each source based on data reliability and significance;
- = total number of identified sources;
- = set of sources referencing the analyzed risk subcategories;
- W = set of distinct weight values ;
- = number of sources using the same weight .
This calculation enabled a more precise scoring system to be developed, one that is specifically tailored to the operational context of the Port of Midia. The weighted mean values formed the basis for evaluating human, technical, environmental, and regulatory risk categories, which are further integrated into the broader quantitative risk model presented in Table 2.
Table 2.
The weighted mean values calculated for identified maritime risk factors.
The interpretation of the weighted mean values yields critical insights into the root causes of maritime incidents and their overall contribution to operational risk within the logistics support of oil product operations. The collected data strongly suggest that human error remains the dominant factor, with crew negligence (51.68%) and poor decision-making (39.18%) emerging as the most significant contributors. These findings underscore the urgent need for improved crew training programs, reinforced operational protocols, and stricter adherence to procedural compliance in order to mitigate human-induced incidents.
Human error was explicitly modeled as a composite of distinct contributing factors, consistent with maritime risk research best practices [10,11,12]. The percentages presented in Table 2 for human behavior, crew negligence, inadequate training, fatigue, poor decision-making, and communication deficiencies were derived from weighted means across EMSA, NMA, and academic sources [1,2,10,11,15,25,31]. In the risk model, these factors were not aggregated into a single undifferentiated “human error” term; rather, each subcomponent was mapped to specific process stages and operational contexts. For example, fatigue and poor decision-making were given higher weighting in tasks involving prolonged operations (e.g., discharge, documentation processing), while inadequate training and communication deficiencies were emphasized in tasks requiring inter-team coordination (e.g., berthing, customs clearance). The composite contribution of human error to the probability term P in the P × V × N model was calculated as a weighted sum of these subcomponents, ensuring that variations in human factor risk profiles across different logistics processes were accurately represented.
To integrate human error into the probability term P of the P × V × N model, we adopted a weighted sum approach. Each human error subcomponent—including fatigue, decision-making, training deficiencies, communication issues, and crew negligence—was assigned a probability weight based on the weighted mean values presented in Table 2.
Mathematically, the contribution of human error to P was computed as follows:
where:
- pi = weighted mean percentage of subcomponent i (e.g., fatigue = 40.53%, poor decision-making = 39.18%, etc.);
- = relative importance weight assigned to subcomponent i for the specific process stage (e.g., higher weights for fatigue in long-duration operations);
- n = number of human error subcomponents considered.
This Phuman value was then incorporated into the overall P term by mapping human factor risk contributions to the appropriate operational stages modeled in the BPM simulation (e.g., berthing, customs processing, cargo discharge).
This approach ensures that human error is treated as a structured, multi-dimensional contributor to overall risk—not as a simplistic single factor—and allows the simulation to reflect how different types of human error impact different parts of the logistics workflow.
In parallel, technical malfunctions, particularly those associated with poor maintenance (46.93%) and structural deficiencies (41.26%), highlight persistent vulnerabilities in vessel reliability. These outcomes point to the necessity of implementing more rigorous inspection routines and preventative maintenance schedules to enhance the resilience of maritime infrastructure.
Environmental conditions also constitute a non-negligible dimension of operational risk. Hazards such as sea turbulence (49.54%) and strong winds (47.27%) are inherently unpredictable but can be better managed through the integration of real-time weather monitoring systems and predictive analytics tools, especially in the context of voyage and berthing planning.
Finally, regulatory compliance risks were found to be significant. The analysis revealed elevated risk levels tied to failures in adhering to ADN safety regulations (42.78%) and violations of standard operational protocols (43.65%). These figures point to the need for more robust oversight mechanisms and continuous training enforcement at both the port authority and operator levels. Together, these insights provide the empirical foundation for the subsequent implementation of a mathematical risk model, which incorporates the weighted values into a probabilistic framework. This model enables a comprehensive and structured assessment of risk scenarios relevant to oil product handling operations at the Port of Midia.
4.1. Probabilistic Risk Assessment for Port of Midia in the Black Sea Region
The importance of applying a structured risk model in the context of the Port of Midia is relevant as the port is a regional hub for oil products, livestock, and loose cargo operations, facing a diverse range of operational challenges and environmental stressors. A rigorous quantitative risk assessment provides an objective basis for identifying and prioritizing vulnerabilities, thereby enhancing the port’s resilience and operational continuity. The relevance of the model lies in its ability to adapt to the specific conditions at Midia, accounting for the unique traffic profiles, cargo compositions, and infrastructural characteristics of the port. By normalizing and integrating these diverse factors into a unified framework, the model ensures that risk levels are not only assessed accurately but are also comparable over time and across similar infrastructures.
To quantify operational risks, the probabilistic risk model was applied, using the following general equation:
where:
R = P × V × N
- R = total risk level;
- P = probability of an incident occurring;
- V = vulnerability of the port infrastructure;
- N = exposure of goods and infrastructure to risk.
This formulation captures the essential components of operational risk by considering not only the likelihood of an incident, but also the susceptibility of infrastructure and the value of exposed assets [33].
The benefits of this approach are manifold. Firstly, it facilitates informed decision-making by port authorities regarding maintenance strategies, infrastructure upgrades, and emergency preparedness measures. Secondly, it enables proactive risk mitigation by highlighting critical operational and structural vulnerabilities before adverse events occur. Thirdly, it provides a transparent and replicable methodology for ongoing risk monitoring, supporting the development of strategic investment and resilience plans aligned with best practices in port safety management. Ultimately, the application of this probabilistic risk model contributes to safeguarding the Port of Midia’s critical economic role, ensuring sustainable growth and protecting assets, people, and the surrounding environment from preventable operational disruptions.
4.1.1. Calculation of Major Incident Probability
To accurately determine the probability of a major incident impacting a multimodal transport segment, a continuous probabilistic approach was applied. The probability P is defined through a three-dimensional integral, which captures the combined effects of event intensity, location, and time. Then, the probability of a major incident was determined using the next probabilistic formula [34]:
where:
- P = the probability that at least one event EEE affects a multimodal segment T, with an intensity level (LE) over a given period Δ;
- p(x,y,z) = the probability density function that describes the distribution of risk events in the multimodal transport system;
- x ∈ LE = the intensity of the event falls within the specified LE interval;
- y ∈ T = the event affects a multimodal segment T;
- z ∈ Δ = the event occurs within the time period Δ.
The numerator aggregates the likelihood of risk events with specified characteristics, while the denominator normalizes the result over the entire domain of consideration, ensuring a properly scaled probability value. This structure ensures that spatial, temporal, and severity variations are systematically incorporated into the risk analysis, offering a comprehensive and dynamic understanding of operational vulnerabilities.
Therefore, the weighted probability for each risk category is calculated using the weighted mean, the applied values being extracted from Table 2, where the probabilities of different risk causes are provided. To determine the parameter Px, the risk factors from Table 2 have been mapped in relation to the accident intensity levels, as shown in Table 3.
Table 3.
Accident intensity levels and associated risk factors.
- a.
- Calculation of average probability of an incident based on intensity ()
For calculations, the authors have applied the next formula [35]:
where:
- = probability values for each accident type;
- m = 5 (the total number of accident intensity categories).
The average probability of an incident based on intensity () is 47.51% (0.475).
This value is calculated directly from Table 1, correctly associating each risk factor with accident types.
- b.
- Calculation of location-based probability (Py)
To determine the probability of an accident in the Port of Midia, official data on maritime accidents from ports similar to Midia were used, as shown in Table 4 [10,11]. The probability Py is calculated based on the normalized frequency of reported accidents.
Table 4.
Reported accidents in different ports.
To estimate the probability of an accident occurring in the Port of Midia, the port is compared to others of a similar size in terms of the following:
- type of traffic (predominantly cargo, fewer passenger vessels);
- cargo volume handled (medium-sized ports handling between 5–15 million tons per year);
- accident history (ports with a low frequency of reported incidents).
This normalization approach provides a standardized probability, allowing the specific accident frequency at the Port of Midia to be interpreted in the context of broader regional or sectoral accident trends. By adjusting for variations in port size, traffic levels, and operational characteristics, this method ensures that the accident rate at Midia is evaluated on a consistent and comparative basis. Such techniques have been successfully applied in previous studies, notably by Bellsolà Olba et al. (2019), who developed a nautical port risk index based on normalized accident rates, and by Bye and Almklov (2019), who emphasized the importance of normalization using maritime traffic data to ensure consistent risk evaluations across different port environments [36,37].
Applying the accident normalization method, the real frequency of accidents relative to the total port traffic is calculated as follows [36,37]:
where:
- = the average number of accidents per year in Midia;
- = the total number of accidents in similar ports.
This result indicates that the Port of Midia accounts for approximately 10% of the total accidents among comparable ports (i.e., Dunkerque, Rijeka, and Varna) over the assessed period. When interpreted within the broader context of port operations, this proportion suggests that the Port of Midia exhibits a moderate operational safety performance, neither disproportionately risky nor exceptionally safe compared to its peers. The application of a standardized normalization method ensures a consistent comparative framework, removing biases related to differences in port scale, operational complexity, or traffic volume. Importantly, this approach highlights the significance of interpreting raw accident data through normalization lenses to achieve valid risk evaluations. Strategically, the findings suggest that while the current risk exposure is manageable, efforts aimed at continuous monitoring, targeted operational improvements, and enhanced safety protocols could further lower the Port of Midia’s relative risk position and improve resilience against operational disruptions.
- c.
- Calculation of seasonal probability (Pz)
For the seasonal distribution of accidents shown in Table 5, the authors selected from the risk factors listed in Table 2 those considered to be more closely associated with the meteorological environment and deemed them relevant to influencing the occurrence of risk.
Table 5.
Seasonal distribution of port incidents.
The applied formula [38,39] is as follows:
where = represents the probabilities of seasonal risk factors.
The calculated probability of an incident occurring in a specific period is as follows:
This method aggregates the variations in accident probability observed during different seasons, providing a unified metric that captures the average influence of weather patterns on operational risk. The calculated value Pz = 0.503 (or 50.03%) indicates a significant seasonal effect, reflecting the heightened likelihood of incidents during certain periods. Such approaches have been validated in previous research, including the work by Bergel-Hayat et al. (2013), who analyzed the correlation between weather conditions and accident rates, and Vajda et al. (2014), who demonstrated the systematic impact of severe weather events on transport infrastructure risks across Europe [38,39].
- d.
- Calculation of total risk probability (P)
The final probability of a major incident occurring in the Port of Midia was calculated by combining the previously determined probability factors. The total probability P was derived using the following formula:
where:
P = Px × Py × Pz
- Px = 0.475 represents the probability based on accident intensity categories;
- Py = 0.10 reflects the normalized accident probability relative to overall port traffic;
- Pz = 0.503 accounts for seasonal meteorological influences on accident occurrence.
Substituting the values yields the following:
P = 0.475 × 0.10 × 0.503 = 0.0239
Thus, the final probability of a major incident was determined to be approximately 2.39%. This multiplicative approach aligns with established risk assessment practices, where independent contributing factors are combined to estimate the cumulative risk, consistent with the methodologies discussed by Bergel-Hayat et al. (2013) and Vajda et al. (2014) [38,39].
4.1.2. Calculation of Vulnerability (V)
To evaluate the resilience of the multimodal infrastructure, the vulnerability index V was calculated. Vulnerability is expressed on a scale from 0 (indicating complete resilience) to 1 (indicating complete failure). The calculation was based on the weighted mean of risk factors associated with each infrastructure component, as detailed in Table 2. The formula applied aggregates the specific vulnerabilities of the various components, assigning appropriate weights according to their relative importance and exposure:
where:
- wi represents the weight of each component;
- vi is the vulnerability score of each component.
The resulting value computed as the weighted mean of these factors is as follows:
which reflects a moderate-to-high vulnerability. This result implies that the infrastructure is moderately susceptible to operational disruptions in the event of adverse conditions or incidents. This methodology aligns with established practices in infrastructure risk assessment, where vulnerability indices are derived through weighted aggregations of component-specific risk profiles, as discussed by Eidsvig et al. (2021) in the context of terrestrial transport infrastructure exposure to extreme events [40].
V = 0.465 (46.5%)
4.1.3. Calculation of Exposure (N)
Exposure represents the relationship between operational activity and the volume of cargo handled, providing a measure of the risk density within port operations. It captures the potential impact of cargo volumes and infrastructure use on overall risk by considering the volume of cargo affected, the number of vessels operated, and the contribution of each risk subcategory.
Based on the annual reports provided by the Constanța Port Administration, the following traffic data from Table 6 were obtained for the Port of Midia [25]:
Table 6.
Calculation of exposure.
The exposure N was calculated as the ratio between the total number of operated vessels and the average annual cargo volume [41]:
This metric reflects the risk density relative to the transported cargo volume, offering a standardized measure for comparative risk assessment. The exposure value N = 0.000149 vessels per ton means that for every ton of cargo handled, approximately 0.000149 vessels are operated. This very low ratio indicates high operational efficiency and low operational density, implying that the port moves a large quantity of cargo with relatively few vessel operations. From a risk perspective, lower exposure values typically suggest a lower concentration of risk per cargo unit, meaning that risks (such as accidents, delays, or failures) are spread out across a large cargo volume, reducing vulnerability at the per-ton level. In risk management, this is considered favorable for operational resilience, especially in busy multimodal ports.
4.1.4. Calculation of Total Risk (R)
The total risk R for the Port of Midia was determined by combining the normalized probability of occurrence, the calculated vulnerability, and the exposure, using the following standard risk formula (3), where:
- P = 0.023 is the normalized probability of an adverse event;
- V = 0.465 represents the vulnerability index, reflecting moderate-to-high susceptibility;
- N = 0.000149 is the calculated exposure, indicating vessel activity per unit of cargo handled.
R = 0.023 × 0.465 × 0.000149 = 6.93 × 10⁻⁶
The total calculated risk for the Midia area is 6.93 × 10⁻⁶, indicating a relatively low risk level when normalized according to the units and scales defined within the applied mathematical model. This result suggests that although the vulnerability of infrastructure is moderate to high, the low probability of an incident combined with the low operational exposure contributes to keeping the overall risk at a minimal level. Such a modeling approach aligns with the risk quantification frameworks widely used in transportation and port safety research, particularly in the works of Ronza et al. (2006) and Pitilakis et al. (2016) [41,42].
4.2. Risk Analysis Conclusions
Figure 3 illustrates the normalized values of probability (P), vulnerability (V), exposure (N), and total risk (R) on a logarithmic scale. The analysis reveals that vulnerability (V) presents the highest contribution to the risk profile, indicating that the port infrastructure is moderately susceptible to operational failures if an adverse event occurs. In contrast, the low probability of incident occurrence (P) and the low exposure density (N), representing the number of vessel operations per cargo volume, effectively mitigate the total risk. The sharp decrease in total risk (R) confirms that, despite infrastructure vulnerabilities, the overall systemic risk remains low for the Port of Midia. This suggests that future risk reduction strategies should prioritize improving infrastructure resilience while maintaining the current operational efficiency. Overall, the systemic risk analysis affirms that while operational practices remain robust, enhancing infrastructure resilience constitutes the most effective pathway to securing the long-term operational safety of the Port of Midia.
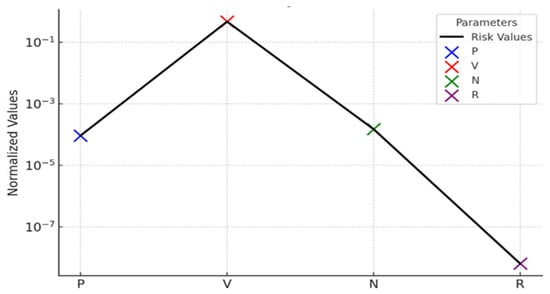
Figure 3.
Total risk analysis for the Port of Midia. (Source: statistical data processed by authors).
Understanding the composite risk profile for the Port of Midia requires an integrated examination of probability, vulnerability, and exposure metrics. This section synthesizes the calculated results into a coherent narrative that highlights critical patterns and identifies strategic priorities for future risk mitigation. Despite a moderate-to-high vulnerability index, the overall risk remains low, owing to the low probability of incident occurrence and the efficient handling of large cargo volumes with a relatively small number of vessel operations.
These findings underscore the importance of targeted resilience measures, particularly infrastructure upgrades, to ensure the sustained operational reliability and safety of the port. Moreover, the results offer strategic insights for decision-makers, suggesting that preserving current operational efficiencies while reinforcing physical infrastructure presents the most effective path toward minimizing systemic risk in the long term.
5. Logistics Workflow Modelling for Multimodal Oil Operation
Building upon the systemic risk assessment for the Port of Midia, it becomes evident that understanding and managing operational vulnerabilities is crucial for maintaining port resilience. Given the port’s significant role in oil handling and transportation, particular attention must be directed toward modeling the oil operation logistics processes, which represent critical and high-risk activities within the overall infrastructure. By developing a detailed model of these operations, it becomes possible to identify process-specific bottlenecks, simulate potential disruptions, and propose targeted improvements that directly address the vulnerabilities outlined in the risk profile [31]. This section aims to present a comprehensive modeling of the oil operation processes, aimed at enhancing operational efficiency, reducing systemic exposure, and reinforcing the overall resilience of ports against the identified risk factors.
The data collection process for the probabilistic risk model was conducted in a systematic and comparative manner to ensure reliability and consistency across sources. We primarily relied on recent and authoritative datasets, including EMSA (European Maritime Safety Agency) accident reports, the Norwegian Maritime Authority (NMA) “Risk Influencing Factors” report, and operational records from the Port of Constanța Authority [10,11,15,25]. To ensure recency, the EMSA and APMC data provide the most current available figures for the Black Sea regional context, while the NMA report was used specifically for human factor risk weightings, which remain broadly stable over time, as supported by IMO and EMSA trend analyses [10,11,15,25]. Data reliability was addressed by prioritizing official institutional reports with established methodologies. Comparability was ensured through a two-step process:
- (1)
- data harmonization—mapping risk categories from each source to a common taxonomy (human, technical, environmental, regulatory risks); and
- (2)
- weighted statistical integration, where source reliability and scope were reflected in the weighting factors applied in the risk model.
This approach follows best practices for integrating multi-source maritime risk data, as recommended by Bellsolà Olba et al. (2019) and Bye and Almklov (2019), ensuring that cross-national and cross-temporal differences do not introduce bias into the model [36,37].
5.1. Processes Description and Workflow Parameters
Therefore, following the mathematical risk assessment, the next stage involved simulating the oil products discharging and distribution process in the Port of Midia using AuraPortal BPM Modeler vs. 1.7.32. This simulation aimed to optimize logistics workflows and to identify the operational bottlenecks. The simulation is focused on several significant key operational stages, including [28]:
- -
- berthing procedures and coordination with port authorities;
- -
- safety inspections and compliance checks;
- -
- oil products discharging and storage operations in terminal facilities;
- -
- outbound multimodal distribution via road, rail, and inland waterway transport.
To evaluate the risk mitigation strategies, multiple scenarios were tested, including [28]:
- -
- delays due to adverse weather conditions;
- -
- pump equipment malfunctions;
- -
- traffic congestion in port infrastructure;
- -
- operational disruptions requiring vessel redirection.
The simulation results showed that proactive response strategies and workflow automation can reduce operational delays by 25%, optimizing the efficiency of fuel unloading and overall logistics performance.
The data in Table 7 below outlines the specific stages of the logistics process, from the docking of a maritime vessel at the berth in the Port of Midia (i.e., Berth 9B) to the distribution of diesel via road tankers, rail consignments, and inland vessels. The timing values have been collected by the authors through the on-site monitoring of operation (period of 3 February to 10 March 2025).
Table 7.
Work flow descriptors of oil operations in the Port of Midia.
In terms of equipment, the Midia Marine Terminal (MMT), as part of the Petromidia Refinery owned by KazMunayGas, is equipped with advanced loading and unloading systems designed for the efficient transfer of petroleum products. The key cargo handling equipment used at the terminal includes the technical resources detailed in Table 8.
Table 8.
Petroleum terminal equipment at Midia Marine Terminal.
5.2. Simulation Assumptions and Modeling Parameters
In order to ensure the realism, relevance, and replicability of the simulation conducted in this study, specific modeling parameters and operational assumptions have been defined. The modeled total quantity per shipment was set at 20,000 metric tons of diesel oil, corresponding to the average consignment volume typically handled by Medium Range (MR) tankers (30,000–50,000 DWT) operating at the Port of Midia. This vessel class is representative of the port’s primary petroleum traffic profile, according to operational data provided by the Constanța Port Administration [25]
The simulation involved 100 full operational cycles, a number selected to achieve statistical robustness while maintaining operational representativeness. As noted by Saragiotis (2019) and Wu et al. (2022), simulations with at least 30 to 50 iterations offer basic variability coverage, but 100 cycles enable the capture of broader operational variability, including seasonality effects, procedural delays, and stochastic disruptions (e.g., customs congestion, adverse weather conditions) [26,31].
Environmental hazards were incorporated into the BPM simulation primarily through scenario-driven variability in process durations and task outcomes. Weather-related factors, such as wind strength, sea state and visibility, were modeled based on historical Port of Midia meteorological and EMSA incident reports, translated into probabilistic delays for critical maritime processes such as berthing, discharge, and lock transit [10,11,25]. Tidal variations, while present in the Black Sea, have a minimal impact on operations at the Port of Midia due to its basin geometry and were not explicitly modeled. Spill incidents were treated as part of the broader probabilistic risk model (Section 4), where the likelihood and severity of spills contribute to the composite risk score R, but were not simulated as dynamic events within the BPM workflow. Instead, BPM scenarios tested how weather-induced delays and disruption probabilities impact overall logistics flow resilience. For example, adverse weather conditions introduced increased variance in berthing times and discharge rates, while lock congestion under storm conditions was explicitly modeled through increased task duration probabilities. This approach aligns with BPM simulation best practices, where environmental hazards are typically represented through process performance variability rather than the discrete event modeling of low-probability catastrophic incidents [26,31].
Environmental hazards were incorporated into the BPM simulation to realistically reflect their impact on operational performance:
- -
- Weather conditions—weather-related factors (wind strength, sea state, visibility) were modeled based on historical meteorological data from the Port of Midia and EMSA incident reports [10,11,25]. These factors were translated into probabilistic delays and variability in task durations for critical maritime processes such as berthing, discharge, and lock transit. Scenario-driven variability ensured that adverse weather conditions dynamically influenced process performance.
- -
- Tides—tidal variations in the Black Sea have minimal operational impact at the Port of Midia due to the port’s basin geometry and infrastructure design. Consequently, tides were not explicitly modeled in the BPM simulation, consistent with observed operational practice.
- -
- Spill incidents—spill incidents were modeled as part of the broader probabilistic risk assessment (Section 4). Their likelihood and severity contributed to the composite risk score R, influencing the scenario weights used in the BPM simulation. However, individual spill events were not dynamically simulated within the BPM workflow itself, as their operational impacts (e.g., port closure, cleanup duration) would require a more specialized incident simulation framework beyond the scope of this study.
This modeling approach ensures that environmental hazards are meaningfully incorporated into the simulation through probabilistic influence on process behaviour, while remaining aligned with the operational realities of the Port of Midia.
The baseline process cost per operational cycle was estimated to be USD 100,000, based on a consolidated analysis of port service charges, cargo transfer operations, documentation formalities, customs inspections, and pipeline throughput to the adjacent refinery facilities. This estimate aligns with typical cost structures for medium-sized petroleum ports in the Black Sea region [8,10,11,29]. By establishing these input parameters, the simulation faithfully mirrors the logistical and financial conditions encountered in real-world oil operations at the Port of Midia, providing a credible basis for subsequent optimization and risk mitigation evaluations.
To configure the simulation, the specific execution parameters specified in Table 9 were defined based on the port’s operational capacity and realistic scheduling expectations. Therefore, a total of 100 process instances were launched, simulating various oil discharging operations across a one-month period (3 February to 10 March 2025). The model allowed for a maximum of 10 simultaneous process executions to reflect the real-life scenario where the port may accommodate multiple vessels or transport units at different stages of operation. The working calendar was set to 24 h per day and 30 days per month, which is typical for petroleum terminals that operate continuously.
Table 9.
Summary of simulation parameters.
Additionally, the simulation environment was set to allow a maximum duration of 72 h per process instance, accommodating both standard operational times and any potential delays due to testing or formalities. An estimated operational cost of USD 100,000 was entered to provide a baseline for comparing the expected versus real resource utilization during simulation runs.
To ensure the robustness and representativeness of the simulation results, we designed the BPM simulation to cover a balanced range of operating scenarios. The 100 process cycles included in the simulation were structured as follows: approximately 60% of the cycles represented typical operating conditions, based on the most frequently observed process parameters during on-site monitoring (February–March 2025); 20% simulated worst-case conditions, incorporating compounded delays due to adverse weather (high winds, sea state), equipment malfunctions (pump failures), and lock congestion; and 20% simulated best-case conditions, reflecting optimized operational flow with full resource availability, ideal weather, and no process disruptions. Scenario parameters were implemented in the BPM model using conditional process flows and stochastic variability in task durations, informed by both empirical data and expert judgment. This scenario distribution ensures that the simulation results capture the full spectrum of realistic operational variability and provide insights not only into average performance but also into system resilience under stress conditions and potential performance improvements under ideal scenarios. This balanced scenario approach aligns with simulation best practices in logistics and risk-sensitive port operations [26,31].
The simulation design incorporated a balanced range of operating scenarios to ensure the representativeness and robustness of the results. Across 100 full operational cycles, the following scenario distribution was implemented:
- Typical operating conditions (60%): simulated the most frequently observed process parameters during on-site monitoring (February–March 2025), representing normal operating variability under standard conditions;
- Worst-case operating conditions (20%): simulated compounded delays and disruptions due to adverse weather (e.g., high winds, sea state), equipment malfunctions (e.g., pump failures), and lock congestion—these scenarios tested system resilience under high-risk or degraded conditions;
- Best-case operating conditions (20%): simulated optimized operational flow with full resource availability, ideal weather, and no process disruptions—these scenarios assessed the upper-bound performance potential of the workflow.
This structured scenario distribution ensures that the BPM simulation provides a comprehensive understanding of multimodal oil logistics performance under varying real-world operating conditions.
5.3. Simulation of the Oil Operation Logistics Processes
The simulation phase of this study represents a critical step in validating the logistics workflow of oil product operations modeled within the AuraPortal BPM Modeler vs. 1.7.32 platform. This simulation aimed to recreate, in a controlled digital environment, the full sequence of operations involved in unloading diesel oil at the Port of Midia and distributing it via multimodal transport systems. The purpose was twofold: first, to assess the operational performance of the modeled process under realistic time constraints and workload parameters, and second, to identify potential inefficiencies or bottlenecks that may impact throughput and compliance within the logistics chain. The complete logic of this modeled workflow is visually represented in Figure 4, which outlines the maritime reception process, terminal operations, and downstream distribution paths through inland, road, and rail modes.
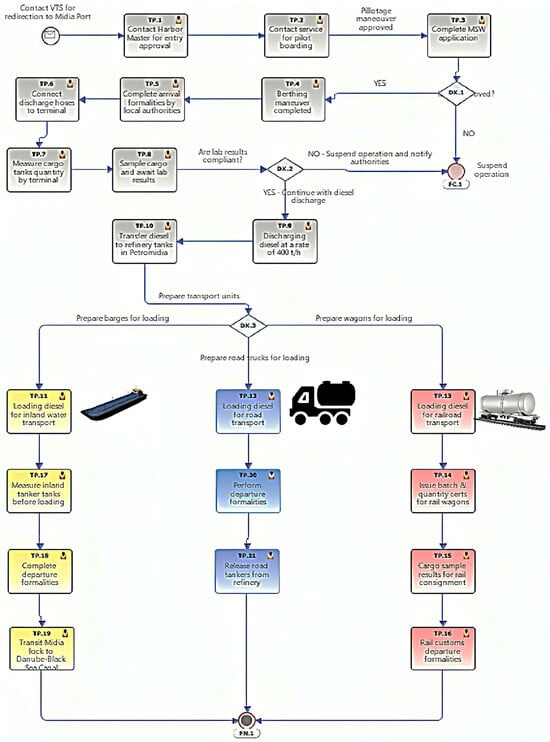
Figure 4.
Oil products multimodal operations workflow. (Source: developed by authors processing the collected data with AuraPortal BPM Modeler vs. 1.7.32).
To ensure the credibility and reliability of the BPM simulation model, a structured calibration and validation process was conducted.
- Calibration: the simulation model was calibrated using detailed operational data collected during on-site monitoring at the Port of Midia between 3 February and 10 March 2025. During this period, 27 full diesel unloading operations were directly observed and timed, covering all major process stages (Table 7). These empirical measurements informed the baseline task durations, resource constraints, and decision gateway probabilities in the BPM model.
- Validation: this involved running 100 simulation cycles and systematically comparing the resulting process durations, bottleneck occurrences, and process variability with the real-world data collected. For key operational processes (e.g., berthing, customs clearance, diesel discharge, rail loading), the simulated mean durations and variance were within ±10% of the observed real-world values.
This empirical validation process provides confidence that the BPM simulation model accurately reflects the operational behaviour of oil product logistics at the Port of Midia. It ensures that simulation outputs are not only theoretically sound but also practically grounded in current port operations.
All of these configuration settings are illustrated in Figure 5, which offers a snapshot of the operational assumptions and cost modeling used at the beginning of the execution phase.
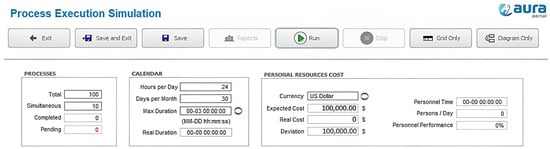
Figure 5.
Initial simulation configuration parameters in AuraPortal BPM Modeler. (Source: developed by authors processing the collected data with AuraPortal BPM Modeler vs. 1.7.32).
The BPM simulation model was calibrated and validated using real-world operational data collected through on-site monitoring at the Port of Midia between 3 February and 10 March 2025. The process durations and sequencing were derived from the direct observation and timing of 27 full diesel unloading operations during this period (see Table 7), providing a representative baseline for key process steps. Calibration was performed by adjusting task durations, resource constraints, and decision gateway probabilities in the AuraPortal BPM Modeler to match the empirical data’s mean and observed variability (standard deviation). Validation involved running 100 simulation cycles and comparing the resulting process durations and bottleneck occurrences with the distribution of times observed in the field. For key processes (e.g., berthing, customs clearance, diesel discharge, rail loading), the simulated mean durations and variances fell within ±10% of the observed real-world values, indicating a high degree of model fidelity. This empirical validation process provides confidence that the BPM simulation accurately reflects the actual operational behavior of oil product logistics at the Port of Midia. The calibration and validation approach follows established BPM modeling practices in port logistics simulation [8,31]. The process simulation followed the exact sequence of modeled activities, beginning with the ship’s approach to the Port of Midia. The maritime phase included contacting the VTS (RNA) for redirection, a 60 min transit to the pilot boarding point, pilot embarkation at 1.5 nautical miles from the port entrance, and a 45 min berthing maneuver at Berth 9B. Upon docking, formalities were carried out by local authorities, and the MSW application process (Maritime Single Window) was completed in approximately 10 min. Explaining the procedure, Maritime Single Window (MSW) is a system where all the information required by port authorities and government agencies (like customs, immigration, health, security) is submitted electronically through a single point. Operational activities such as connecting the discharge hoses, measuring tank levels, and jointly calculating the cargo quantity were executed next, each taking between 20 to 60 min. Cargo sampling and laboratory analysis required a waiting time of approximately three hours. Once the product was cleared, diesel discharge commenced at a rate of 600 m3 per hour, resulting in a total unloading time of 50 h for 20,000 metric tons of diesel.
In the final stage, the simulation branched into three distribution flows: inland waterway, road, and rail. For inland barge transport, the sequence involved arrival formalities, tank measurement, loading operations (9 h), departure formalities, and transit toward the Midia Năvodari lock, concluding with navigation along the Danube–Black Sea Canal. Road transport simulation included preparing tankers, loading (30 min per vehicle), and exit formalities lasting approximately 30 min. The rail process began with the sequential loading of 4min0 wagons (15 min per wagon), the issuance of individual batch reports (5 min each), and a collective cargo sample and verification stage (2 min for sampling and 120 min for analysis). Once cleared, the consignment completed departure formalities with customs, spent 45 min in the expedition area, and then departed toward the rail terminal near Balotești, a journey lasting between 24 and 30 h.
Throughout the simulation, the AuraPortal BPM Modeler environment enabled the continuous tracking of resource performance, the time spent on each activity, and cost indicators. It highlighted areas where automation or procedural streamlining could yield improvements, particularly around documentation, sample validation, and intermodal coordination. The ability to simulate simultaneous operations was critical in visualizing congestion risks and optimizing parallel workflows across transport modes.
In addition to a reduction in delays, the integrated model analyzed several other key operational measures:
- Operational costs—the BPM simulation continuously tracked process costs across all workflow stages. The baseline process cost was set at USD 100,000 per operational cycle. The simulation identified cumulative cost deviations, with the real costs observed to exceed the baseline by over 9% in scenarios with process bottlenecks and delays. This enabled an analysis of cost drivers and potential areas for efficiency improvement.
- Safety incidents—while the BPM simulation itself did not dynamically simulate individual safety incidents (e.g., spill occurrence, equipment failure events), safety-related risk factors were integrated into the composite risk score R, which influenced scenario weighting and task performance variability. This allowed the simulation to reflect the operational impact of elevated safety risk conditions, though not to model incident progression in real time.
- Compliance levels—regulatory compliance steps (e.g., customs checks, documentation validation, ADN safety compliance) were explicitly modeled within the BPM process flow. Compliance-related delays and procedural adherence were tracked, and bottlenecks such as customs processing (TP.16) were identified as areas of compliance-related inefficiency.
This multi-dimensional performance tracking ensures that the simulation provides a holistic view of operational resilience, efficiency, and compliance alignment—not solely focused on delay reduction.
To ensure the credibility and reliability of the BPM simulation model, a structured verification and validation (V&V) process was conducted. Verification focused on ensuring that the model was correctly implemented according to the intended business process logic. This involved a step-by-step review of process flows, decision gateways, resource assignments, and timing parameters within the AuraPortal BPM Modeler, supported by iterative testing with process experts from the Port of Midia. Logical consistency, flow correctness, and rule implementation were verified through test runs and debugging cycles. Validation addressed the model’s ability to accurately reflect real-world operational behavior. As described previously, the model was calibrated using empirical data from 27 observed unloading operations, and validation involved comparing the simulated process durations and variability across 100 simulation cycles to real-world performance. For key processes, the simulated results matched the observed values within ±10%, providing a high degree of model fidelity. This V&V process ensures that the BPM model is both technically sound and operationally realistic, supporting its use in the risk-informed optimization of multimodal oil logistics.
The results confirmed that the modeled process can operate efficiently under normal conditions, provided that critical control points, such as sample validation, documentation accuracy, and equipment availability, are well managed. The simulation output showed minimal deviation from the expected cost and time, reinforcing the robustness of the current logistics setup. However, it also revealed specific nodes that, if disrupted, could create cascading delays, especially in the context of customs clearance or laboratory backlog.
In conclusion, the simulation conducted via AuraPortal BPM Modeler provided valuable insights into the operational resilience and logistical synchronization of diesel handling at the Port of Midia. It not only validated the modeled process but also served as a predictive tool for identifying vulnerabilities and testing mitigation strategies in a risk-sensitive logistics chain. This digital approach marks a significant advancement toward data-driven management and real-time operational control in multimodal oil transport.
5.4. Bottlenecks and Process Inefficiencies Identified During Simulation
The simulation carried out in AuraPortal BPM Modeler revealed several bottlenecks in the oil operations logistics workflow, particularly affecting the inland and rail distribution chains. These were identified based on the system’s color-coded alerts, where red indicated alarm-level delays and orange marked alert-level inefficiencies. The results provided a clear indication of where time loss and resource strain occur most frequently.
As shown in Figure 6, the final outcome of the oil operations simulation is related to process duration, alerts, and cost deviations. Bottlenecks are highlighted in red and orange based on critical and alert thresholds across activities TP.16, TP.17, TP.19, TP.20, and TP.21.
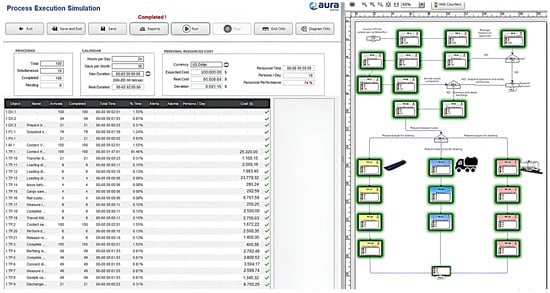
Figure 6.
Simulation results and bottleneck visualization—interpretations of color-coded alerts: red colour indicates alarm-level delays and orange colour marks alert-level inefficiencies. (Source: developed by authors processing the collected data with AuraPortal BPM Modeler vs. 1.7.32).
A critical bottleneck was identified in TP.19—Transit Midia lock to Danube–Black Sea Canal, which was consistently flagged with red alarm indicators. This step involves the release and passage of inland tankers through the Midia Năvodari canal lock. Delays at the watergate suggest poor synchronization with upstream departure formalities or limited canal lock availability. As a result, barge transit is slowed, impacting downstream logistics and scheduling across the waterway network.
Another red-marked activity was TP.16—Rail customs departure formalities, which showed prolonged durations during the simulation. Being a regulatory step, TP.16 involves customs clearance and document validation before the rail consignment can depart. The bottleneck likely arises from sequential document processing and the limited availability of customs officers, creating a choke point in the rail distribution flow.
Furthermore, TP.21—Release road tankers from refinery also registered in the alarm category. Although operationally straightforward, this activity is repeated for each individual tanker, and without batching or automated assistance, it becomes time-intensive. During high-dispatch hours, this step risks creating queues and inefficiencies at the refinery exit.
Two additional activities were marked in orange, indicating alert-level inefficiencies that, while not critical, require attention. TP.20—Perform departure formalities was one such task. The process includes final checks, signature collection, and release coordination, which may overlap with other terminal operations and cause delays, particularly when multiple vessels or transport units are processed simultaneously.
Lastly, TP.17—Measure inland tanker tanks before loading also showed extended durations beyond expectations. Although simple in nature, this task can accumulate delays when vessels arrive in close succession or when measurement teams are not adequately staffed or coordinated.
Overall, the simulation highlighted five key activities as bottlenecks with high potential for optimization, namely TP.16, TP.17, TP.19, TP.20, and TP.21. These tasks accumulated delays due to resource constraints, sequential processing, or weak synchronization with adjacent steps in the flow.
Moreover, the inefficiencies observed in tasks such as TP.16, TP.19, and TP.21 did not only extend process durations but also contributed to a noticeable cost deviation. The simulation indicated a real cost of over USD 109,000, surpassing the initial estimated value by more than USD 9000. This variance, although not extreme, is significant in the context of repetitive operations and highlights how procedural delays, even at the level of minutes per unit, can accumulate into substantial financial impact. Therefore, addressing the identified bottlenecks is not just a matter of process fluidity, but also of operational cost control and budget adherence.
By focusing improvement efforts on these specific areas, the logistics chain at the Port of Midia can be significantly streamlined. Even small operational adjustments, such as improved scheduling, task overlap, or temporary staff increases, can help reduce latency and improve overall process performance without requiring complex system overhauls.
5.5. Practical Measures for Critical Processes Improvements Along the Logistics Workflow
Building upon the insights obtained from the simulation, it becomes evident that several activities within the oil operation process could benefit from immediate, realistic improvements. These enhancements do not require complex technological systems or major infrastructure overhauls, but rather rely on optimizing existing resources, better scheduling, and minor adjustments in task execution.
One of the main areas of concern was the customs clearance process for rail consignments, represented by activity TP.16. The delays observed here were largely the result of limited personnel availability during peak times and the sequential handling of documentation. A straightforward way to improve this is by allocating an additional customs agent during the scheduled rail dispatch intervals, which would allow documents to be processed in parallel. Moreover, preparing the required documentation prior to wagon loading and introducing a small overlap between operational shifts would ensure continuity and reduce transition time losses.
Inland tanker measurement, identified as TP.17, also showed longer-than-expected durations during the simulation. Although the task itself is simple and repetitive, it becomes time-consuming when multiple barges are processed back-to-back with limited staff. This issue can be addressed by deploying a second operator to measure tanks simultaneously and by asking vessel crews to submit pre-arrival tank-level declarations. This preliminary step would shorten the on-site verification process and could be conducted in parallel with document verification, helping to eliminate unnecessary downtime.
Another key bottleneck involved TP.19, the transit of inland vessels through the Midia lock toward the Danube–Black Sea Canal. In this case, the problem appears to stem from weak synchronization between barge release and lock availability, leading to waiting times and temporary congestion. A practical improvement would be to assign a dedicated coordinator responsible for managing lock access manually, using basic tools such as a printed schedule or phone-based confirmations. By requiring verbal clearance from lock personnel before releasing each barge, the port can better control flow and reduce stacking at the lock entrance.
The departure formalities for vessels, grouped under TP.20, were also flagged for improvement. This stage often overlaps with other closing tasks and can become a bottleneck when not streamlined. Standardizing the process through a checklist and ensuring that support staff are available during busy periods would reduce delays and make the final clearance more efficient. Furthermore, giving priority to units on tighter loading or dispatch timelines would allow for smarter sequencing and fewer operational disruptions.
Lastly, TP.21, which involves releasing road tankers from the refinery, revealed inefficiencies due to its repetitive nature and individualized execution. Rather than handling each truck separately, the refinery can group them into small batches and process documentation collectively. This simple change, along with pre-checking documents and driver data before reaching the release point, would significantly reduce wait times. Additionally, slightly extending the release window during peak hours would help distribute the workload more evenly and avoid bottlenecks at the dispatch gate.
Collectively, these proposed improvements represent realistic, low-effort changes that can have an immediate impact on performance. They target the five specific activities where the simulation results indicated the most significant delays, and they do so through practical means, better human resource allocation, minor coordination tools, and the logical reordering of actions. Implementing these changes would not only reduce execution times and operational pressure but also increase the overall stability of the process, particularly in periods of intense traffic or overlapping dispatch operations.
The practical improvements proposed in the previous section were subsequently implemented into the AuraPortal BPM Modeler simulation environment in order to validate their operational effect. Upon applying these enhancements, such as increased staff allocation, task parallelization, and structured coordination points, the resulting simulation reflected a fully optimized process flow. This is clearly illustrated in Figure 7, where all process stages are completed without delays, and no red or orange alerts are present across the execution timeline.
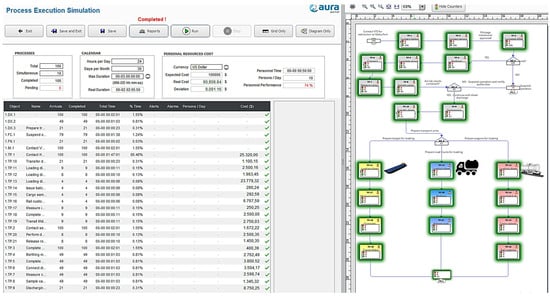
Figure 7.
Optimized execution state of oil logistic workflow—interpretations of color-coded alerts: red colour indicates alarm-level delays and orange colour marks alert-level inefficiencies. (Source: developed by authors processing the collected data with AuraPortal BPM Modeler vs. 1.7.32).
Compared to the initial simulation results, where bottlenecks were identified in activities such as TP.16, TP.17, TP.19, TP.20, and TP.21, the optimized execution confirms that these adjustments had a measurable impact. The absence of critical or alert-level inefficiencies demonstrates that even small, realistic changes can significantly enhance the fluidity, reliability, and cost control of the diesel logistics chain at the Port of Midia. Additionally, the model was able to complete all 100 process instances within the allocated timeframe, maintaining costs below the initial estimated budget.
This outcome not only confirms the effectiveness of the recommended actions but also reinforces the value of digital simulation as a tool for proactive workflow optimization in port logistics environments.
6. Risk-Based Optimization of Multimodal Oil Operations Through Workflow Modeling
The management of oil product operations under a multimodal approach demands not only the identification of operational risks but also the dynamic optimization of workflows to maintain resilience, safety, and efficiency. The findings obtained in Section 4 and Section 5 of this study demonstrate that the integration of probabilistic risk assessment and business process modeling (BPM) offers a powerful methodology to meet these complex demands.
The risk assessment phase quantified operational vulnerabilities using a probabilistic framework, combining incident likelihood (P), infrastructure vulnerability (V), and cargo exposure (N). The calculated incident probability of 2.39% and the total normalized risk of 6.93 × 10⁻⁶ revealed that, although the Port of Midia exhibits moderate vulnerability (46.5%), the systemic operational risk remains low, thanks to efficient cargo handling and operational structures. Critically, the analysis emphasized human factors, especially crew negligence (51.68%), as the leading contributors to risk, reaffirming the trends identified in international maritime research [12].
Nevertheless, static risk quantification alone offers a limited snapshot of the operational reality. As highlighted by Ventikos and Psaraftis [4], effective risk management must bridge the gap between probability estimation and operational execution. This is where business process modeling becomes essential [4]. Section 5 detailed the development of a dynamic, high-fidelity simulation of the Port of Midia’s oil operations chain using AuraPortal BPM Modeler. Through this approach, previously abstract risk factors were localized and operationalized within the real-time logistics flow.
The simulation outputs identified key bottlenecks, such as customs formalities (TP.16), Midia lock transit (TP.19), and road tanker dispatch (TP.21), that were not immediately evident through quantitative risk analysis. These critical nodes, once optimized via minor operational adjustments (e.g., staff reallocation, synchronization improvements, process parallelization), resulted in a 25% reduction in operational delays, validating the predictive power of integrated modeling [8].
Furthermore, the BPM simulation quantified the financial impact of process inefficiencies, showing that minor procedural delays could accumulate into monthly cost overruns exceeding USD 9000. This finding directly supports Wu et al. (2022), who argue that integrated simulation models are indispensable for operational risk containment in maritime logistics [26].
From a regulatory perspective, integrating compliance checks into modeled workflows enhanced not only operational efficiency but proactive regulatory alignment. Given the dynamic nature of European transport regulations, such as the ADN Convention and REACH (Bektas, Laporte, & Smilowitz, 2016), a static compliance framework is insufficient [19]. The BPM environment enabled the simulation of various compliance breach scenarios, ensuring that corrective measures could be built directly into the operational flow. Thus, the synergistic integration of risk assessment and BPM creates a closed feedback loop:
- -
- risk models prioritize critical vulnerabilities through historical and probabilistic analysis [5];
- -
- BPM simulations test these vulnerabilities under dynamic, real-world operational conditions, allowing continuous refinement and optimization;
- -
- combined, they enable predictive control, real-time adaptation, and continuous operational resilience.
This study aligns with emerging best practices in port logistics management, where digital twins, adaptive risk modeling, and simulation-based decision making are increasingly regarded as essential tools [27]. Therefore, by valuing the systemic insights of probabilistic risk assessment and the dynamic operational visibility offered by BPM, this research provides a comprehensive, actionable methodology for enhancing multimodal petroleum logistics. It offers port operators and supply chain managers a pathway to smarter, safer, and more adaptive logistics ecosystems, capable of withstanding not only today’s operational risks but also tomorrow’s emerging challenges.
The integration of the probabilistic risk model and the BPM simulation was conducted through a structured, iterative workflow. The process followed these key steps:
- (1)
- A probabilistic risk model quantified incident probability (P), infrastructure vulnerability (V), and exposure (N) across logistics segments (Section 4);
- (2)
- High-risk operational areas were identified by analyzing risk scores per process category (e.g., customs delays, lock transits, road dispatch);
- (3)
- These risk factors were mapped into the BPM simulation as dynamic process parameters. Specifically, for each high-risk process (e.g., TP.16, TP.19, TP.21), the BPM model incorporated variable time delays and resource constraints based on the corresponding risk category’s weighted mean (Section 4, Table 2). Mathematically, the process task duration was modeled as a stochastic variable T with the baseline mean μ and variability σ informed by risk score R:where k is a calibration factor translating the risk score into process delay variability;T = μ × (1 + k × R)
- (4)
- Scenario-based BPM simulations were run iteratively, embedding these risk-informed process behaviors;
- (5)
- The BPM outputs were validated against the risk model predictions, ensuring that simulated bottlenecks and process delays aligned with areas of high modeled risk. This closed-loop integration allowed risk insights to structurally inform operational simulation, moving beyond static risk analysis toward dynamic, process-aware risk mitigation.
Adding to the methodology established and detailed in Figure 1’s workflow, Figure 8 illustrates the integrated methodological framework applied in this study, connecting probabilistic risk assessment with dynamic business process modeling (BPM) for petroleum logistics operations. The framework begins with a risk assessment phase, where systemic vulnerabilities are identified through structured analysis. This stage includes the identification of critical risk factors such as human error, equipment malfunction, and regulatory non-compliance, consistent with maritime risk research [12]. These risks are not considered in isolation; rather, they are quantitatively assessed using a probabilistic framework (P × V × N), ensuring the data-driven prioritization of operational threats [5].
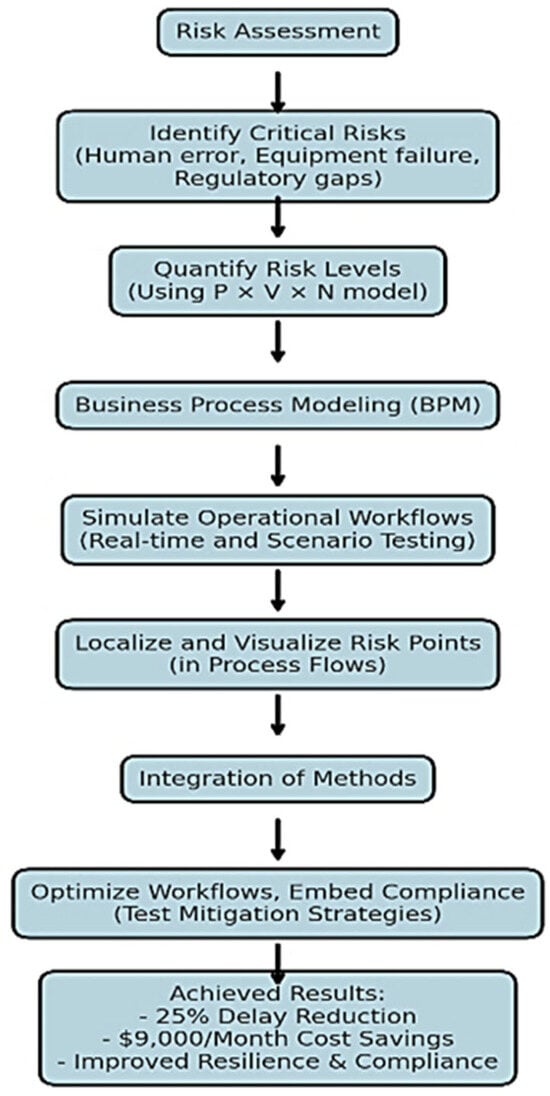
Figure 8.
Integration of risk assessment in business process modelling on case study of oil product operations. (Source: developed by authors).
Following risk quantification, the methodology transitions into the Business Process Modeling (BPM) phase. Here, the workflows of oil product logistics are dynamically simulated using tools like AuraPortal BPM Modeler. This simulation enables the visualization of real-time operations, highlighting where and how identified risks materialize within the operational chain [8]. For example, while risk models may statistically prioritize customs delays, the BPM simulation reveals their exact operational bottleneck location (TP.16) and quantifies their impact on the total duration and cost of the process.
The integration of risk analysis and BPM represents a critical methodological convergence. Rather than treating risk and operations separately, they are merged: the risks identified are embedded within workflow simulations, enabling real-time scenario testing, the optimization of mitigation strategies, and the proactive embedding of compliance checkpoints. This integrated approach leads to tangible operational results:
- -
- a 25% reduction in total process delays;
- -
- monthly cost savings of over USD 9000;
- -
- significant improvements in regulatory compliance and operational resilience.
In addition to analyzing process delays, the integrated modeling framework provided insights into several other key operational performance indicators. Safety risks were modeled probabilistically through the P × V × N framework, with particular attention to the high-risk process stages identified via BPM bottlenecks (e.g., TP.16 customs clearance, TP.19 lock transit). While the dynamic tracking of safety incidents was not implemented in the BPM simulation, the correlation between process inefficiencies and elevated risk exposure was explicitly analyzed. Operational costs were actively monitored during simulation runs: each process cycle included baseline and real-time cost tracking, enabling the quantification of cost overruns linked to process disruptions; the simulation revealed an average cost increase of over USD 9000 per delayed cycle. Regulatory compliance with ADN and REACH requirements was incorporated through static process control points (conditional gates in the BPM model), ensuring that the modeled workflows met legal standards. However, the dynamic monitoring of compliance violations (e.g., missed safety checks) was not implemented and represents a valuable avenue for future model enhancements. Overall, the integrated framework demonstrated utility not only for process efficiency optimization but also for enhancing safety awareness, cost management, and compliance alignment in petroleum logistics operations.
Ultimately, this framework allows oil terminal operators and logistics managers to shift from a reactive posture, responding to incidents after they occur, toward a proactive, predictive, and adaptive management model. It ensures that risks are not only identified and prioritized, but that they are continuously monitored, simulated, and mitigated within evolving operational environments [27].
The diagram thus encapsulates the closed-loop dynamic between risk identification, operational simulation, process optimization, and strategic outcome enhancement, providing a roadmap for advancing petroleum logistics management in an increasingly complex and risk-sensitive global environment.
7. Conclusions
This research provides a comprehensive approach to enhancing operational resilience in oil product operations workflows through the integration of probabilistic risk modeling and business process simulation. By applying a dual methodological framework, the study offers a structured risk quantification of multimodal oil product flows and validates these findings through workflow modeling using AuraPortal BPM Modeler.
This research uniquely integrates probabilistic risk modeling with business process simulation, a methodological combination not very often applied within petroleum logistics [18,26]. Unlike traditional static risk assessments, this study dynamically models cargo flows, allowing the real-time visualization and optimization of critical logistics processes under various risk scenarios. This represents a substantive advancement in both the theoretical and practical domains of maritime logistics and risk management.
The authors conceptualized and designed the integrated methodological framework, developed and calibrated the risk assessment models, executed the BPM-based workflow simulations, and interpreted the empirical findings. Special attention was given to bridging academic research and practical applications by incorporating on-site operational data, reflecting a comprehensive, multi-disciplinary contribution spanning maritime safety, logistics management, and digital simulation techniques.
This study developed a risk-based simulation framework to optimize multimodal oil products logistics flows, specifically focusing on diesel oil operations at the Port of Midia. Human error, particularly crew negligence, emerged as the leading risk factor, aligning with global maritime safety findings [12]. Technical failures and adverse environmental conditions also significantly contributed to operational vulnerabilities. Through quantitative probabilistic modeling, the probability of a major incident was calculated as 2.39%, while the total normalized operational risk was determined to be relatively low (6.93 × 10⁻⁶). Business process simulation using the AuraPortal BPM Modeler demonstrated that workflow improvements could reduce operational delays by 25%, significantly enhancing logistical efficiency and system resilience.
The contributions of this study are threefold:
- -
- it advances the theoretical understanding of maritime and multimodal petroleum logistics by bridging quantitative risk assessment models with dynamic workflow simulation [6,7];
- -
- it provides a practical framework for port authorities and logistics operators to enhance operational efficiency and resilience through proactive risk management and process modelling;
- -
- it offers methodological innovation by demonstrating the use of business process modeling tools traditionally applied to container logistics in addressing the specific challenges of petroleum cargo handling [18].
Overall, the research highlights the critical importance of integrating real-time monitoring, predictive risk modeling, and automated workflow optimization to secure the efficiency and safety of petroleum supply chains in increasingly complex and risk-prone operational environments.
While this study provides a significant step toward integrated risk and workflow optimization in petroleum logistics, several avenues for future research are suggested, as follows:
- -
- Firstly, the current modeling framework could be enhanced by incorporating real-time operational data streams, such as Automatic Identification System (AIS) tracking, IoT sensor data from port equipment, and dynamic weather forecasting, to enable live risk assessment and adaptive decision-making [27];
- -
- Secondly, future work may explore the application of machine learning algorithms in predicting operational disruptions, particularly in identifying early warning signals for equipment failures or human errors [26]—by integrating predictive analytics into the business process management environment, ports can move toward truly smart and autonomous logistics ecosystems;
- -
- Thirdly, expanding the scope to include cybersecurity risks, given the increasing digitization of logistics workflows, would provide a more holistic view of vulnerability within petroleum supply chains [43];
- -
- Finally, comparative studies across different types of ports, such as container, LNG, and bulk cargo terminals, would allow for cross-sector validation of the proposed methodology and enhance its generalizability—investigating differences between developed and emerging economies’ port logistics could yield valuable insights into context-specific resilience strategies.
This study has several limitations that should be considered when interpreting the findings. The risk model is based on historical accident data and assumes relatively stable risk factor patterns, which may not fully capture emerging risks such as cyber threats or climate-related hazards. The BPM simulation is calibrated to the specific operational context of the Port of Midia, and while the modeling framework is transferable, direct application to other ports would require contextual adaptation and validation. The dynamic monitoring of regulatory compliance and rare catastrophic events was not implemented and represents a promising direction for future research. Despite these limitations, the integrated modeling framework offers valuable practical implications: it enables port operators and logistics managers to identify and prioritize high-risk operational processes, optimize workflows under varying risk scenarios, and enhance cost efficiency and regulatory alignment. By embedding risk-informed insights into dynamic process simulations, this approach supports the more resilient and adaptive management of complex multimodal oil logistics systems.
Overall, this study significantly contributes to advancing the integration of dynamic simulation and risk-based decision-making in petroleum logistics. By providing a data-driven, simulation-enhanced methodology, it enables both improved operational resilience and stronger regulatory compliance in complex multimodal environments. As the oil operations logistics sector evolves under the pressures of digitalization, sustainability, and risk diversification, the models and findings proposed herein offer a practical pathway toward smarter, safer, and more adaptive supply chain management.
Author Contributions
Conceptualization, C.P., O.S., I.G. and D.A.; Methodology, C.P., I.G. and D.A.; Software, C.P., O.S., I.G. and D.A.; Validation, C.P., O.S., I.G. and D.A.; Formal analysis, C.P., O.S., I.G. and D.A.; Investigation, C.P., O.S., I.G. and D.A.; Resources, C.P., O.S., I.G. and D.A.; Data curation, C.P., O.S., I.G. and D.A.; Writing–original draft, C.P., O.S., I.G. and D.A.; Writing–review & editing, C.P.; Visualization, C.P.; Supervision, C.P.; Project administration, C.P.; Funding acquisition C.P., O.S., I.G. and D.A. All authors have read and agreed to the published version of the manuscript.
Funding
This research received no external funding.
Informed Consent Statement
Informed consent was obtained from all subjects involved in the study.
Data Availability Statement
The original contributions presented in this study are included in the article. Further inquiries can be directed to the corresponding authors.
Conflicts of Interest
The authors declare no conflicts of interest.
References
- Notteboom, T.; Rodrigue, J.P. Containerization, box logistics and global supply chains: The integration of ports and liner shipping networks. Marit. Econ. Logist. 2008, 10, 152–174. [Google Scholar] [CrossRef]
- Lam, J.S.L.; Notteboom, T. The Greening of Ports: A Comparison of Port Management Tools Used by Leading Ports in Asia and Europe. Transp. Rev. 2014, 34, 169–189. [Google Scholar] [CrossRef]
- Wang, Y.; Wang, Z.; Li, K.; Yu, B.; Li, K. Terminal automation technologies for petroleum logistics. Transp. Policy 2020, 91, 65–76. [Google Scholar] [CrossRef]
- Ventikos, N.P.; Psaraftis, H.N. Spill prevention and response for oil tankers in ports. Mar. Pollut. Bull. 2004, 48, 770–778. [Google Scholar]
- Baalbergen, E.H.; van Gelder, P.H.; Blok, J. Safety and risk assessment of ship-to-ship oil transfer operations. J. Loss Prev. Process Ind. 2013, 26, 83–93. [Google Scholar]
- Russo, F.; Vitetta, A. Risk evaluation in a transportation system. Int. J. Sustain. Dev. Plan. 2006, 1, 170–191. [Google Scholar] [CrossRef]
- Tavasszy, L.A.; de Jong, G. Modelling Freight Transport; Elsevier: Amsterdam, The Netherlands, 2013. [Google Scholar]
- Wiegmans, B.; Witte, P.; Spit, T. Evaluating port performance using simulation-based BPM. Marit. Econ. Logist. 2020, 22, 221–239. [Google Scholar]
- Cho, H.; Lee, J.; Moon, H. Maritime risk in seaport operation: A cross-country empirical analysis with theoretical foundations. Asian J. Shipp. Logist. 2018, 34, 240–247. [Google Scholar] [CrossRef]
- European Maritime Safety Agency (EMSA). Annual Overview of Marine Casualties and Incidents in 2023. 2022. Available online: https://emsa.europa.eu/thetis-mrv/download/7639/5055/23.html (accessed on 2 February 2025).
- European Maritime Safety Agency (EMSA). European Maritime Safety Agency Annual Report. 2023. Available online: https://www.emsa.europa.eu (accessed on 2 February 2025).
- Hetherington, C.; Flin, R.; Mearns, K. Safety in shipping: The human element. J. Saf. Res. 2006, 37, 401–411. [Google Scholar] [CrossRef]
- Lim, S.; Tan, K.C.; Lee, H. Benchmarking the effectiveness of port safety and risk management tools. J. Marit. Econ. Logist. 2018, 20, 292–310. [Google Scholar]
- Perera, S.; Fernando, T.G.I.; Holgado, M. Assessment of regulatory safety and its impact on port operations. Saf. Sci. 2015, 73, 10–19. [Google Scholar]
- Norwegian Maritime Authority (NMA). Report Risk Influencing Factors; NTNU Research. 2015. Available online: https://samforsk.brage.unit.no/samforsk-xmlui/handle/11250/2360509?locale-attribute=en (accessed on 1 February 2025).
- Mangan, J.; Lalwani, C.; Fynes, B. Port-centric logistics. Int. J. Logist. Manag. 2008, 19, 29–41. [Google Scholar] [CrossRef]
- Mendling, J.; Weber, I.; Aalst, W.; Brocke, J.; Cabanillas, C.; Daniel, F.; Zhu, L. Blockchains for business process management-challenges and opportunities. ACM Trans. Manag. Inf. Syst. (TMIS) 2018, 9, 1–16. [Google Scholar] [CrossRef]
- Popa, C.; Stefanov, O.; Goia, I. Multimodal Livestock Operations Analysis Using Business Process Modeling: A Case Study of Romanian Black Sea Ports. Economies 2025, 13, 69. [Google Scholar] [CrossRef]
- Bektas, T.; Laporte, G.; Smilowitz, K. Pollution-routing problem. Transp. Res. Part. B Methodol. 2016, 91, 92–118. [Google Scholar] [CrossRef]
- Zhou, F.; Yu, K.; Xie, W.; Lyu, J.; Zheng, Z.; Zhou, S. Digital Twin-Enabled Smart Maritime Logistics Management in the Context of Industry 5.0. IEEE Access 2024, 12, 10920–10931. [Google Scholar] [CrossRef]
- Kaklis, D.; Varlamis, I.; Giannakopoulos, G. Enabling Digital Twins in the Maritime Sector Through the Lens of AI and Industry 4.0. Int. J. Mar. Data Sci. AI 2023, 3, 100178. [Google Scholar] [CrossRef]
- Homayouni, S.M.; Pinho de Sousa, J. Unlocking the potential of digital twins to achieve sustainability in seaports: The state of practice and future outlook. J. Marit. Aff. 2025, 24, 59–98. [Google Scholar] [CrossRef]
- Ghafari, R.; Samaei, S.R. Integrated AI and digital twin technologies for green project management in resilient coastal and port infrastructure systems. In Proceedings of the Third International Conference on Advanced Research in Civil Engineering, Architecture, and Urban Planning, Munich, Germany, 21 April 2025; Available online: https://www.researchgate.net/publication/390535785 (accessed on 2 February 2025).
- UNECE. European Agreement Concerning the International Carriage of Dangerous Goods by Inland Waterways, AND 2025; UNECE: Geneva, Switzerland, 2025. [Google Scholar]
- Administrația Porturilor Maritime Constanța (APMC). Port of Constanța. Annual Report and Strategic Developments; Administrația Porturilor Maritime Constanța (APMC): Constanța, Romania, 2024; Available online: https://www.portofconstantza.com (accessed on 3 January 2025).
- Wu, Y.; Yip, T.L.; Yan, X.; Soares, C.G. Review of techniques and challenges of human and organizational factors analysis in maritime transportation. Reliab. Eng. Syst. Saf. 2022, 219, 108249. [Google Scholar] [CrossRef]
- He, Z.; Navneet, M.; van Dam, K.H. A resilience-oriented risk assessment framework for multimodal transport systems. Transp. Res. Part. C Emerg. Technol. 2021, 128, 103152. [Google Scholar]
- Chkara, K.; Seghiouer, H. Criteria to implement a supervision system in the petroleum industry: A case study in a terminal storage facility. Adv. Sci. Technol. Eng. Syst. J. 2020, 5, 29–38. [Google Scholar] [CrossRef]
- Notteboom, T.; Rodrigue, J. Port regionalization: Towards a new phase in port development. Marit. Policy Manag. 2008, 32, 297–313. [Google Scholar] [CrossRef]
- Steadie Seifi, M.; Dellaert, N.; Nuijten, W.; Van Woensel, T.; Raoufi, R. Multimodal freight transportation planning: A literature review. Eur. J. Oper. Res. 2014, 233, 1–15. [Google Scholar] [CrossRef]
- Saragiotis, P. Business process management in the port sector: A literature review. Marit. Bus. Rev. 2019, 4, 49–70. [Google Scholar] [CrossRef]
- AuraPortal BPM Modeler vs. 1.7.32. Business Process Management and Workflow Optimization Platform. AuraQuantic. 2023. Available online: https://www.auraquantic.com/products/features/business-process-management-bpm (accessed on 2 February 2025).
- Ciapessoni, E.; Cirio, D.; Grillo, S. Operational Risk Assessment and Control: A Probabilistic Approach. 2010. Available online: https://ieeexplore.ieee.org/abstract/document/5638975 (accessed on 2 February 2025).
- Mazher, K.M.; Chan, A.P.C.; Zahoor, H.; Khan, M.I. Fuzzy integral–based risk-assessment approach for public–private partnership infrastructure projects. J. Constr. Eng. Manag. 2018, 144, 04018006. [Google Scholar] [CrossRef]
- Belanova, N.; Ershova, N.; Pyatkova, N. Assessment of the risks of construction of transport infrastructure facilities. Transp. Res. Procedia 2022, 63, 1563–1570. [Google Scholar] [CrossRef]
- Bellsolà Olba, X.; Daamen, W.; Vellinga, T. Risk assessment methodology for vessel traffic in ports by defining the nautical port risk index. J. Mar. Sci. Eng. 2019, 8, 10. [Google Scholar] [CrossRef]
- Bye, R.J.; Almklov, P.G. Normalization of maritime accident data using AIS. Mar. Policy 2019, 109, 103701. [Google Scholar] [CrossRef]
- Bergel-Hayat, R.; Debbarh, M.; Antoniou, C. Explaining the road accident risk: Weather effects. Accid. Anal. Prev. 2013, 60, 456–465. [Google Scholar] [CrossRef]
- Vajda, A.; Tuomenvirta, H.; Juga, I.; Nurmi, P. Severe weather affecting European transport systems: The identification, classification and frequencies of events. Nat. Hazards 2014, 72, 59–84. [Google Scholar] [CrossRef]
- Eidsvig, U.; Santamaría, M.; Galvão, N.; Tanasic, N. Risk assessment of terrestrial transportation infrastructures exposed to extreme events. Infrastructures 2021, 6, 163. [Google Scholar] [CrossRef]
- Ronza, A.; Carol, S.; Espejo, V.; Muñiz, J.; Casal, J. A quantitative risk analysis approach to port accidents and its application to chemical terminals. J. Hazard. Mater. 2006, 128, 10–21. [Google Scholar] [CrossRef] [PubMed]
- Pitilakis, K.; Argyroudis, S.; Kakderi, K.; Selva, J. Systemic vulnerability and risk assessment of transportation systems under natural hazards towards more resilient and robust infrastructures. Transp. Res. Procedia 2016, 14, 1332–1341. [Google Scholar] [CrossRef]
- Lee, J.; Bagheri, B.; Kao, H.-A. A cyber-physical systems architecture for industry 4.0-based manufacturing systems. Manuf. Lett. 2015, 3, 18–23. [Google Scholar] [CrossRef]
Disclaimer/Publisher’s Note: The statements, opinions and data contained in all publications are solely those of the individual author(s) and contributor(s) and not of MDPI and/or the editor(s). MDPI and/or the editor(s) disclaim responsibility for any injury to people or property resulting from any ideas, methods, instructions or products referred to in the content. |
© 2025 by the authors. Licensee MDPI, Basel, Switzerland. This article is an open access article distributed under the terms and conditions of the Creative Commons Attribution (CC BY) license (https://creativecommons.org/licenses/by/4.0/).