1. Introduction
Petroleum supply chains in the estuary sector are a key factor that directly impacts the efficiency of oil product distribution operations, meeting the needs of both local and international markets. The estuary sector represents the vital link between the final refineries and consumers through fuel stations and various distribution centers. The challenge is to ensure a smooth flow of oil products, such as gasoline, diesel, and liquefied natural gas, from refineries to consumers, while reducing costs and minimizing environmental emissions and achieving operational efficiency [
1].
Planning supply chains in this sector requires defining flexible strategies for managing logistical facilities, storing products, and selecting suitable transportation methods. Given the importance of this sector in securing the availability of energy and resources for modern energy needs, it is necessary to develop accurate and advanced methods and planning strategies that contribute to improving performance and achieving sustainability.
Strategic planning in the estuary sector focuses on defining long-term, overarching goals and key decisions that will impact the sector’s future performance. This type of planning involves determining the optimal locations for warehouses and gas stations, as well as selecting the most cost-effective and environmentally efficient methods for transferring [
2]. In. It also considers the feasibility of building new facilities or updating existing ones to maximize the benefits of resources [
3].
One of the key strategic decisions facing supply chain managers during the design phase of the supply chain network is selecting the optimal location for the warehouse or distribution center. This decision entails a significant investment and requires substantial financial expenditures to establish it [
4]. It has long-term effects because it cannot be easily and repeatedly changed. Warehouse location is a precursor to the supply chain design process, which has a significant and far-reaching impact on the overall performance of the logistics and distribution system. An optimal location enhances overall operational performance by ensuring efficient product delivery and minimizing transportation costs. It also enhances customer satisfaction by ensuring timely delivery and reducing lead times. The strategic and optimal choice of location is crucial and necessary for both companies and consumers because it directly impacts logistics efficiency and supply chain sustainability [
5].
This study addresses the urgent issue of determining the most efficient location for the new petroleum products distribution center, a complex decision due to infrastructure damage, vast geographical coverage, and the need to reduce transportation costs and emissions. Consequently, the primary objectives of this research are to determine the optimal location of a distribution center among four proposed locations, evaluate each site using advanced simulation and improvement tools, minimize transportation expenditures, and reduce emissions while maintaining the provision of effective service. Consequently, this study aims to address the following research question: How can the optimal location of the Petroleum Product Distribution Center in Anbar Governorate be determined to minimize transportation costs and emissions while ensuring adequate service provision? The study assumes the accuracy of the available data related to transportation costs, distances, and emissions, and that the proposed locations are viable within the current infrastructure context. The scope of this research is explicitly limited to the Petroleum Products Distribution Company network within the Anbar Governorate, including comprehensive reviews of proposed distribution center locations. Following this introduction, the paper reviews the relevant literature on improving distribution centers, outlines the methodology and analytical tools, discusses the results, and highlights the key findings, limitations, and recommendations for future research.
2. Literature Review
2.1. Petroleum Supply Chains (PSC)
Supply Chain Management is defined as the coordination of the physical, logical, and financial flows management between the supply chain networks (SCN) [
6], whose goal is to deliver the right product, in the right amount, at the right time, for the right customer, meaning to respond to customer demand efficiently [
7].
Ref. [
8] defined SCM as “the management of upstream and downstream relationships with suppliers and customers to deliver superior customer value at less cost to the supply chain as a whole”.
For these reasons, supply chain management is one of the modern and advanced management methods that have emerged and developed rapidly in various industries. It has become an important and necessary factor in companies’ success and ability to control flows and provide exceptional services to their customers to be competitive.
Petroleum supply chains (PSC), or oil supply chains (OSC), are the most complex and advanced of all other supply chains. It is vertically integrated and includes activities from exploration to refining, refineries, and distributing those refined products in an extensive logistical network to consumer markets [
3].
The petroleum supply chain (PSC) is divided into three sectors: upstream, middle, and downstream. The upstream sector includes oil exploration, drilling, extraction, pro-duction, and transportation of crude oil.
Some authors, including [
9], consider transporting crude oil to be an activity of the downstream sector, and others, including [
10], consider it to be among the activities of the middle sector. Regardless of these differences, refining is among the activities of the middle sector. According to [
9] the downstream sector includes the storage, distribution, and marketing of refined products.
Transportation infrastructure, refinery, depot, and distribution center (DC) locations, demand patterns, and storage capacities are key factors that affect the efficiency of the oil supply chain network. To design a resilient supply chain that effectively addresses logistical challenges and meets sustainability goals, advanced techniques such as simulation tools and optimization models are increasingly being applied. Recent studies emphasize that integrating simulation with logistics optimization enhances the adaptability of supply chain networks to demand fluctuations, transportation disruptions, and supply bottlenecks, enabling real-time adjustments and improved decision-making [
11].
2.2. AnyLogistix Software
ALX is an advanced piece of software from AnyLogic Company that combines both optimization and simulation capabilities to handle the complexities of supply chain management. Thanks to its user-friendly interface, the model can be constructed and analyzed without requiring extensive programming knowledge, only the most basic knowledge [
12]. The software features a robust optimizer and a visual map-based interface, enabling the design and maintenance of your supply chain models while enhancing scalability and adaptability for varying levels of complexity [
13]. It has also been widely applied to address supply chain disruptions, such as enhancing supply chain resilience [
14]. It supports various experiments, a form of stochastic and dynamic simulation used to model disruptions and different scenarios [
15]. Integrating operational data with simulation and optimization techniques empowers organizations to improve sustainability and resilience in their supply chains [
13,
16].
Several studies have utilized ALX to support decisions in various sectors, achieving meaningful results. For example, ref. [
15] ALX to analyze the effect of interruption on the design of production and distribution networks. The study focused on the behavior of production demand during periods of turmoil and recovery. This study sheds light on how to simulate the supply chain disorder, providing valuable insights into the recovery strategies that enhance operating performance and reduce costs. Ref. [
17] applies the tool to design sustainable logistics networks, and merge the life cycle evaluation methodology (LCA) to evaluate environmental effects through different logistical network scenarios. This study highlighted the program’s ability to support a sustainability model in supply chain designs, thereby improving both cost and environmental impact.
In the pharmaceutical sector, ref. [
17] utilizes ALX to assess risk in supply chains and enhance the site selection process for new facilities in Mexico. By simulating various supply chain configurations, the study demonstrated how ALX can facilitate the expansion of production facilities, thereby increasing the efficiency of the supply chain. Ref. [
18] expanded the use of ALX during the COVID-19 pandemic to predict the effects of the epidemic’s spread on global supply chains. The study employed simulation models to evaluate the disorders caused by epidemics and the proposed strategies to enhance the elasticity of the supply chain, demonstrating how the program can effectively manage crises. Ref. [
19] analyzed the effect of COVID-19 on the food supply chain in Germany. Their twin digital approaches enabled them to integrate the disorders in the food retail processes and suggest strategies to optimize elasticity, indicating the ability to adapt to the program across various supply chain sectors. Ref. [
20] also utilized ALX in a simulation approach to optimize the distribution of COVID-19 vaccines in Norway. Their study focused on optimizing the cold chain logs, highlighting the ALX ability to improve the temperature-sensitive supply chains. In another related study, ref. [
21] utilized the program to redesign vaccine supply chains in three countries, offering insight into how different countries enhanced their vaccine distribution networks through simulation. Ref. [
22] applied ALX to analyze the grape distribution network in the Brazilian Valley of São Francisco, with a focus on determining the optimal location of distribution centers (DCS). Their study demonstrated how ALX can enhance agricultural supply chains by improving logistical services and distribution efficiency. In [
14], an integrated framework was developed to enhance simulation using ALX, enabling the design of the supply chain to be more flexible. This framework combines planning and control decisions, providing a comprehensive approach to managing the supply chain.
AlX was also used to analyze the supply chain for e-commerce. Ref. [
16] used the tool to predict the demand for jewelry products and improve the supply chain for e-commerce. By identifying cities with high financial returns and demanding the product, the study showed how ALX can improve supply chains in the retail sector. Likewise, ref. [
22] utilized ALX to optimize food distribution networks, demonstrating its effectiveness in enhancing logistics services across various industries.
In recent years, ref. [
23] applied a comparison of simultaneous reopening strategies after supply chain disruptions. Separate multi-term events, simulating the model presented, provided insight into the impact of reopening the facility on the performance of the global supply chain [
24]. I proposed a periodic methodology using ALX to enhance the elasticity of supply and sustainability of the supply chain, and to verify the validity of the approach in the study of agricultural food [
25]. The program’s utility also demonstrated the modeling of supply chain efficiency in logistics services in Antarctica, which improves cost and operational timing. Ref. [
26], in their studies on optimizing the distribution network for agricultural food products, used the ALX to confirm that strategic decisions related to the size and location of the facility, such as factories and distribution centers, are pivotal in managing the supply chain, which significantly affects transportation costs, lead times, and responding to demand. They also highlighted that improving the locations of the facility through simulation tools, such as ALX, can enhance efficiency and reduce costs for suppliers, facilities, and clients within a strategic designer distribution network.
Finally, ref. [
13] examined the application of ALX to enhance the sustainability of the supply and logistics chain by reviewing case studies. Their studies identified the trends and challenges in enhancing supply chain performance, confirming the increasing importance of tools such as ALX in managing the modern supply chain.
The current literature highlights the use of ALX in various industries, including pharmaceuticals, retail food, and disaster alert, to improve supply chain networks and enhance flexibility. However, there is a shortage of studies that focus specifically on the petroleum sector, especially in the context of making strategic decisions for the optimal distribution center sites. This research aims to fill this gap through the application of green field analyses (GFA) and the simulation techniques in ALX to locate the most effective distribution center for petroleum products, addressing both operational efficiency and sustainability in a sector with unique logistical and environmental challenges.
3. Methodology
At this stage, primary data were collected through interviews with department managers at the Petroleum Products Distribution Company—Anbar Branch and gas station managers to gather information about filling station data, their locations, demand, costs, selling prices, and other relevant details. ALX was utilized by entering the coordinates of gas station locations (for customers or order nodes), daily recurring order quantities, and storage capacities of 100 active gas stations to determine the location of the proposed distribution center using the GFA method. Next, the DC locations obtained from the GFA results (GFA DC), the Ramadi location, the Habbaniyah location, and the Haqlaniya location were validated for their feasibility using the SIM method. Feasibility was evaluated based on the accessibility of the distribution path given in the SIM results. Moreover, the transportation cost was compared across the four facilities, and the location with the lowest transportation cost was then chosen, as the fixed costs and other costs are equal among the four facilities.
3.1. Case Company
This paper examines the supply chain network structure of a petroleum products distributor in Iraq, specifically in Anbar Governorate. The company is called the Petroleum Products Distribution Company. The company was established in 1959 and is the first government institution to practice distributing petroleum products in Iraq. The Petroleum Products Distribution Company, one of the entities within the Ministry of Oil, serves as a strategic link in the chain of oil industry operations. The importance of its activity stems from the fact that it is linked to citizens’ lives, whether for direct consumption or industrial and commercial purposes, to sustain daily life.
The company is responsible for providing petroleum products to citizens, supplying electric power generation stations and private and governmental generators throughout the country with gas oil fuel, and marketing refinery production of liquid gas, gasoline, jet fuel, diesel, and gas oil through the management and operation of sales outlets represented by filling stations distributed throughout Iraq. The Anbar branch is considered one of the main branches of this company and one of the basic pillars for ensuring the stability of fuel supplies in Anbar Governorate, the largest Iraqi governorate in terms of area, which amounts to 138,579 km2 and constitutes 32% of the total area of Iraq. PPDC-ANBAR plays a pivotal role in distributing petroleum products to over 100 gas stations across Anbar Governorate. It is part of a vast distribution network that provides petroleum products, such as gasoline, diesel, liquefied gas, and kerosene, to various sectors in Anbar Governorate, ensuring the continuity of economic and social life in the governorate and its surrounding areas.
The company has been facing significant challenges for many years, especially after the infrastructure of its facilities was severely damaged due to the events that Iraq has witnessed since 2003 and the subsequent military operations, sabotage, and theft. These damages caused all oil tankers, petroleum product distribution centers, railway lines, and pipelines transporting petroleum products in western Iraq to be out of service. These challenges were exacerbated with the fall of western Iraqi cities and some other cities into the grip of terrorist organizations in 2014 and 2015, which added additional pressure on the company as it sought to secure energy under difficult and complex circumstances (PPDC).
In the face of these challenges, the company must make strategic and tactical decisions to design an efficient and effective distribution network for its new petroleum products. This study will address one of the most important of these decisions: determining the optimal locations for distribution centers, considering the locations of current and potential customers, the distances between them and the distribution centers, and their needs for petroleum products. The study aims to help the company choose the best location to establish the distribution center from among four proposed locations, three of which were proposed by the company: the Ramadi location, the Habbaniyah location, the Haqlaniyah location, and the fourth location (GFA DC), which will be obtained through the results of the GFA experiment in the AnyLogistix software (ALX). This study also aims to determine the feasibility of the four distribution center locations using the SIM experience with the ALX, through which customer requests can be met at the lowest possible cost, while maintaining the highest levels of efficiency in distribution and reducing the cost and emissions associated with transportation and distribution operations.
3.2. Data Collection
In this part, the most important data collected from the Petroleum Products Distribution Company—the Anbar Branch and gas station managers will be clarified for use in the research.
3.2.1. Gas Station Demand and Location
In
Table 1, the periodic demand data for each gas station are presented, which must be met during the simulation. In this study, two parameters were used to define the periodic demand for the fuel station: order interval and quantity. The table also contains the geographical location (latitude and longitude) of each gas station, which is useful for plotting the location of each station in ALX and can therefore be considered with the demand data to determine the location (GFA DC) proposed using the GFA experiment.
3.2.2. Product
Table 2 shows information about the product type, purchase price, and selling price to determine the optimal profit from the implemented scenario.
3.2.3. Additional Data
Table 3 presents key transportation parameters for truck shipments necessary to implement the ALX simulation, including truck capacity, truck speed, and transportation cost, among others.
The truck speed value was determined by Iraqi traffic regulations, and the carbon emission coefficient was calculated using the methodology provided by [
27].
3.3. Data Processing
Data processing begins with Greenfield’s analysis using ALX software to determine the latitude and longitude points of the proposed distribution centers. Greenfield analysis data requirements include filling station data, such as location coordinates and periodic order quantities. The data were entered into the ALX, and the Greenfields analysis experiment, also called the Center of Gravity, was conducted to determine the proposed optimal location for the GFA distribution center based on the locations of the filling stations and order quantities, which results in the following:
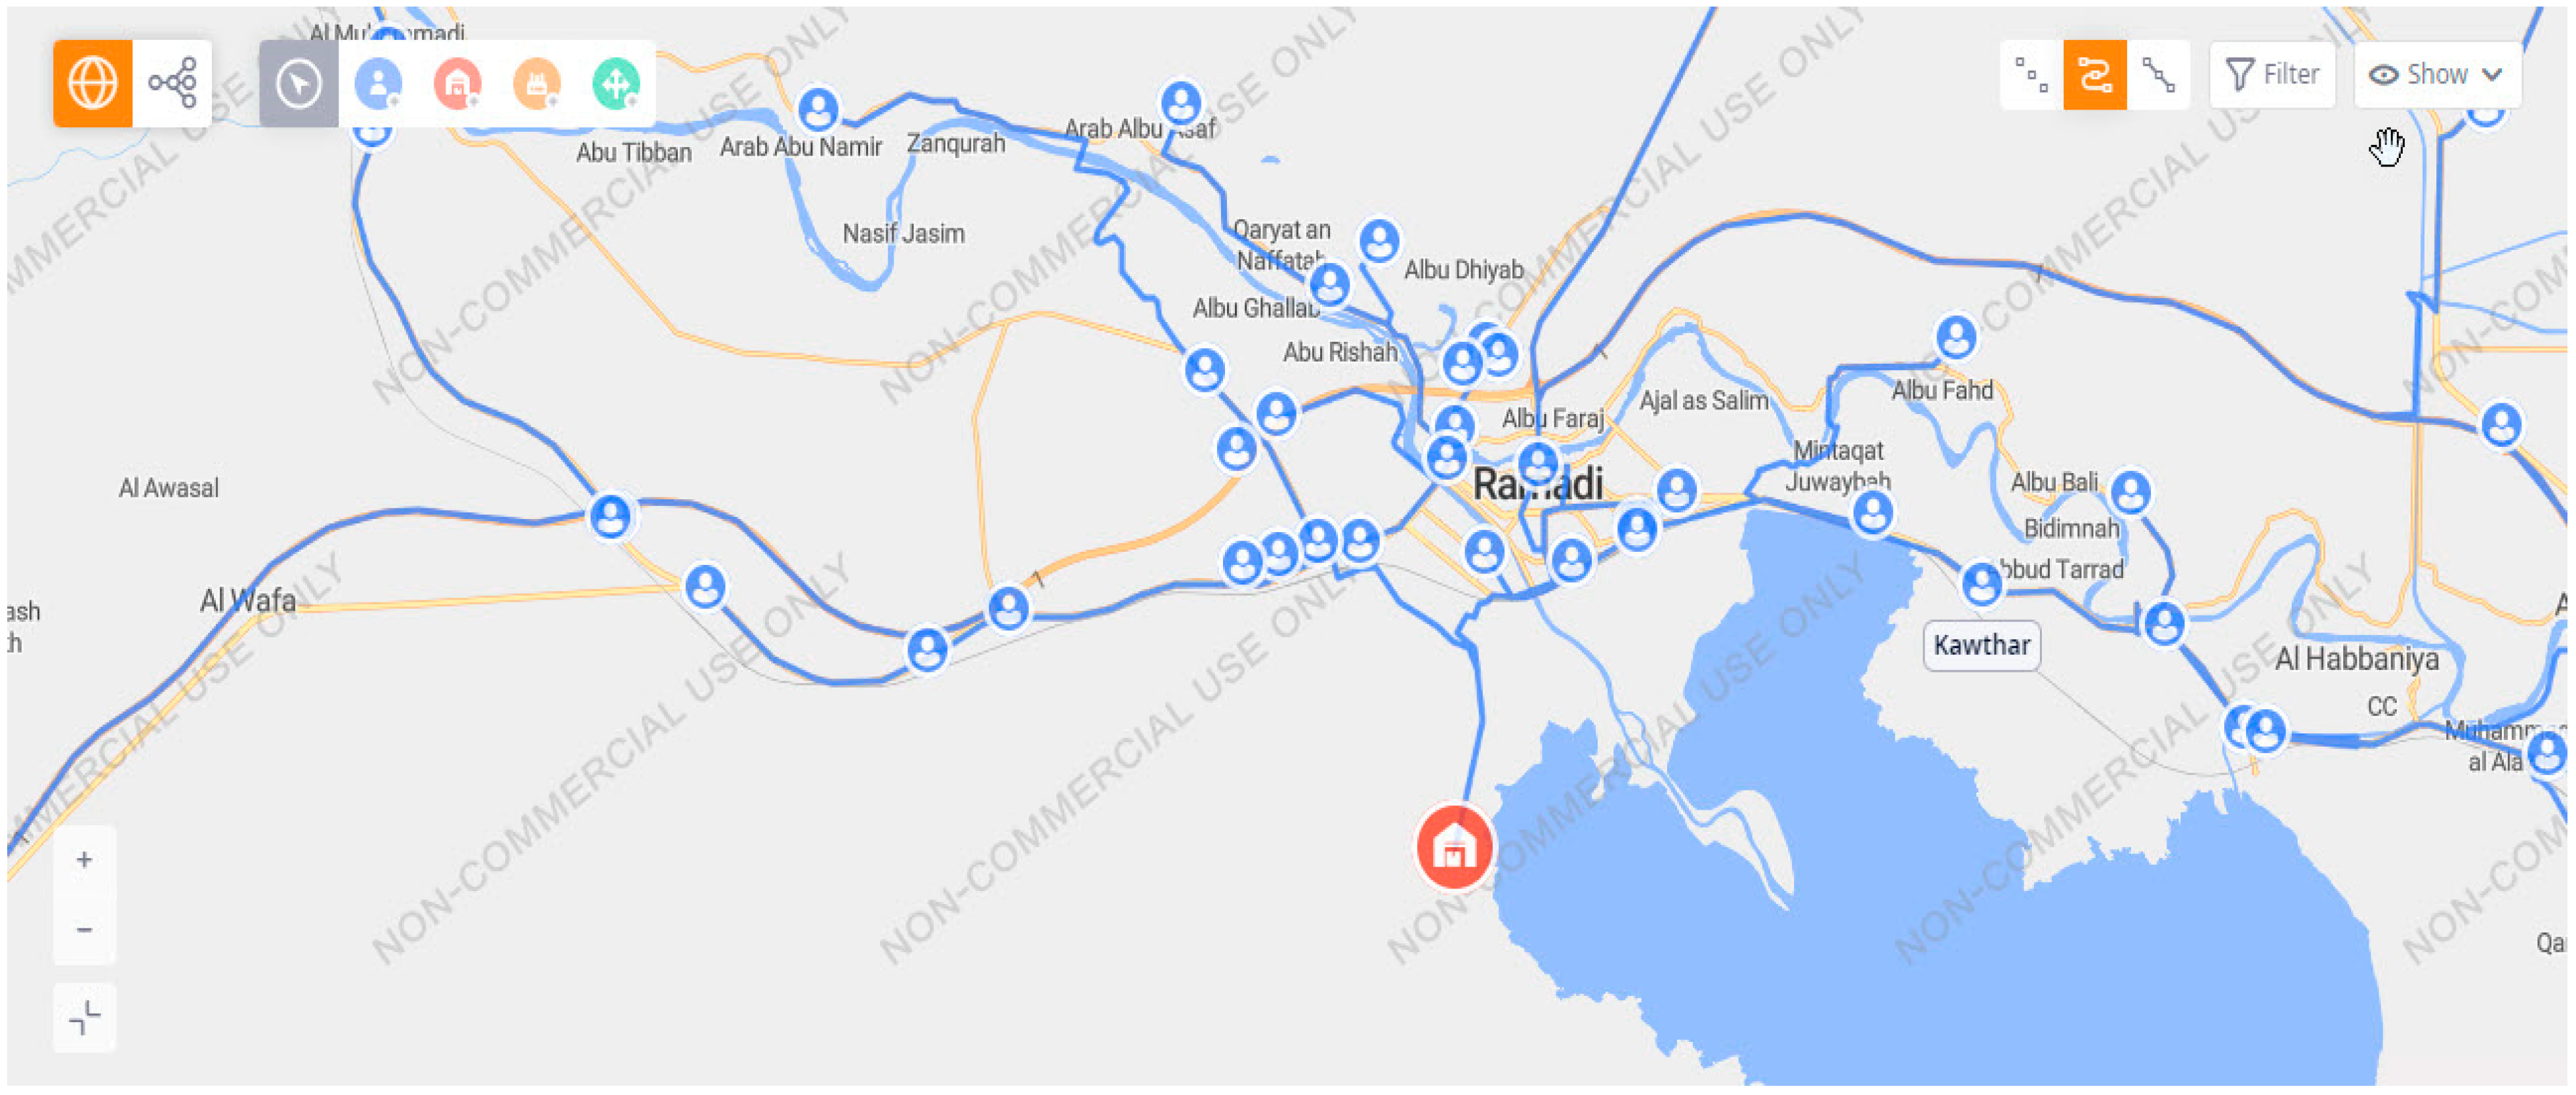
In this experiment, the data were processed to determine the location of the proposed distribution center using the GFA method through the ALX. The results of this experiment indicated the location of the distribution center at latitude 33.435243 and longitude 43.336008, or more specifically, this location is situated in the center of Ramadi, the capital of Anbar Governorate, as shown in
Figure 1. Despite this, further steps must be taken to verify whether the experiment’s results can be implemented, and this is why it is necessary to conduct a SIM experiment.
3.4. Simulation (SIM) Experiment
A SIM experiment was conducted to determine if the results of the GFA experiment are valid. Also, through the results of the (SIM) experiment that was conducted for the four scenarios, a comparison was made between them to find out the best scenario by evaluating the financial aspect, specifically the value of the profit, the cost of transportation, or the length of the total distance, assuming that other costs are equal, such as the cost of establishing a distribution center, the cost of storage, and other facility costs (fixed cost), including the cost of transportation per kilometer, the vehicle capacity, and the vehicle speed. In this experiment, the net profit or the lowest transportation cost is compared among the proposed GFA location, the Ramadi location, the Habbaniyah location, and the Haqlaniya location to assist decision-makers in the company in choosing the best location to increase the company’s net profit.
3.5. Greenfield Analysis (GFA)
Greenfield analysis (GFA), also known as center of gravity analysis, is a technique used to determine the optimal locations for new facilities [
15], considering factors such as customer locations, distance from warehouses to customers, and customer demands. The optimal location of the warehouse or facility is determined by finding the point where the sum of the distances of all suppliers to the factory (demand point) is at its minimum, weighted by the volume of product flow between each supplier and the potential factory. The distances from customers to the warehouse are calculated to determine the optimal location of the warehouse.
GFA is a method that utilizes a high level of abstraction and minimal detail as input to analyze existing data, including customer locations (order points), demand per customer, the number and locations of distribution centers, and/or service distances.
To design the distribution network for petroleum products in Anbar Governorate, we begin by determining the locations of gas stations and their daily demand, which are the basic parameters related to the Gas Flow Area (GFA). We applied a mathematical model based on GFA, as described by [
28]. The ordered pair of coordinates (
xi;
yi) represents the location of each gas station, which cannot be changed, as they are the input data or problem information.
In contrast, the coordinates of the distribution center or new warehouse, p, are variable and determined after calculating the data in a way that matches the set parameters. Therefore, (px, py) are the decision variables in this scenario.
In addition, we assume that the distance value and the transport volume (demand-D) are linearly related to the transport cost, Z. We can see that the possible distances and coordinates of the potential distribution center or warehouse will affect the total transportation cost. The transportation cost from the potential distribution center (
px;
py) to the customer’s packing station location (
xi;
yi) is approximately equal to the distance and demand, as shown in the following equation:
where
N is the total number of gas station locations
D(xi;
yi) is the demand for gas stations
d[
(xi;
yi);
(px;
py)], which is the travel distance from the gas station location (
xi;
yi) to the distribution center (
px;
py) To reduce the transportation cost, it is necessary to change
px and
py so that
Z (px;
py) becomes a minimum.
Unconstrained decision variables can determine the optimal point Z.
The first derivative
Z’ is determined as follows:
Equations (4) and (5) are used to calculate the optimal location of the distribution center based on demand data [
28].
We apply Equations (1)–(5) according to the calculation of the optimal coordinate pair for the distribution center, using ALX, as the calculations involved are complex.
4. Results
4.1. Experiment Analysis
(SIM) Experiments were conducted on each of the four scenarios to obtain the results for each scenario or distribution center as follows:
4.1.1. GFA DC Location
To conduct the simulation experiment (SIM) for the GFA DC location obtained through the greenfield analysis experiment, the necessary data are entered, which include gas station and product data, as well as the coordinates of the GFA DC location, as shown in
Figure 1. We can see from the results of the experiment how our supply chain performance is by analyzing the key performance indicators shown in
Table 4.
4.1.2. Ramadi Location
The same SIM experiment was conducted, but for the Ramadi location. The experiment was conducted using the same previous input data, including costs and coordinates of filling station locations, as well as order quantities. The only difference is the location coordinates of a distribution center, where coordinates were entered for the Ramadi location, as shown in
Figure 2. You can view the experiment’s results in
Table 5. The total costs have increased to 6,749,151,793 IQD, compared to the result of GFA DC, which was 6,517,645,674 IQD. Likewise, CO
2 emissions increased to 1,631,795 kg, compared to the GFA DC result of 1,575,822 kg, due to the increase in transportation distance.
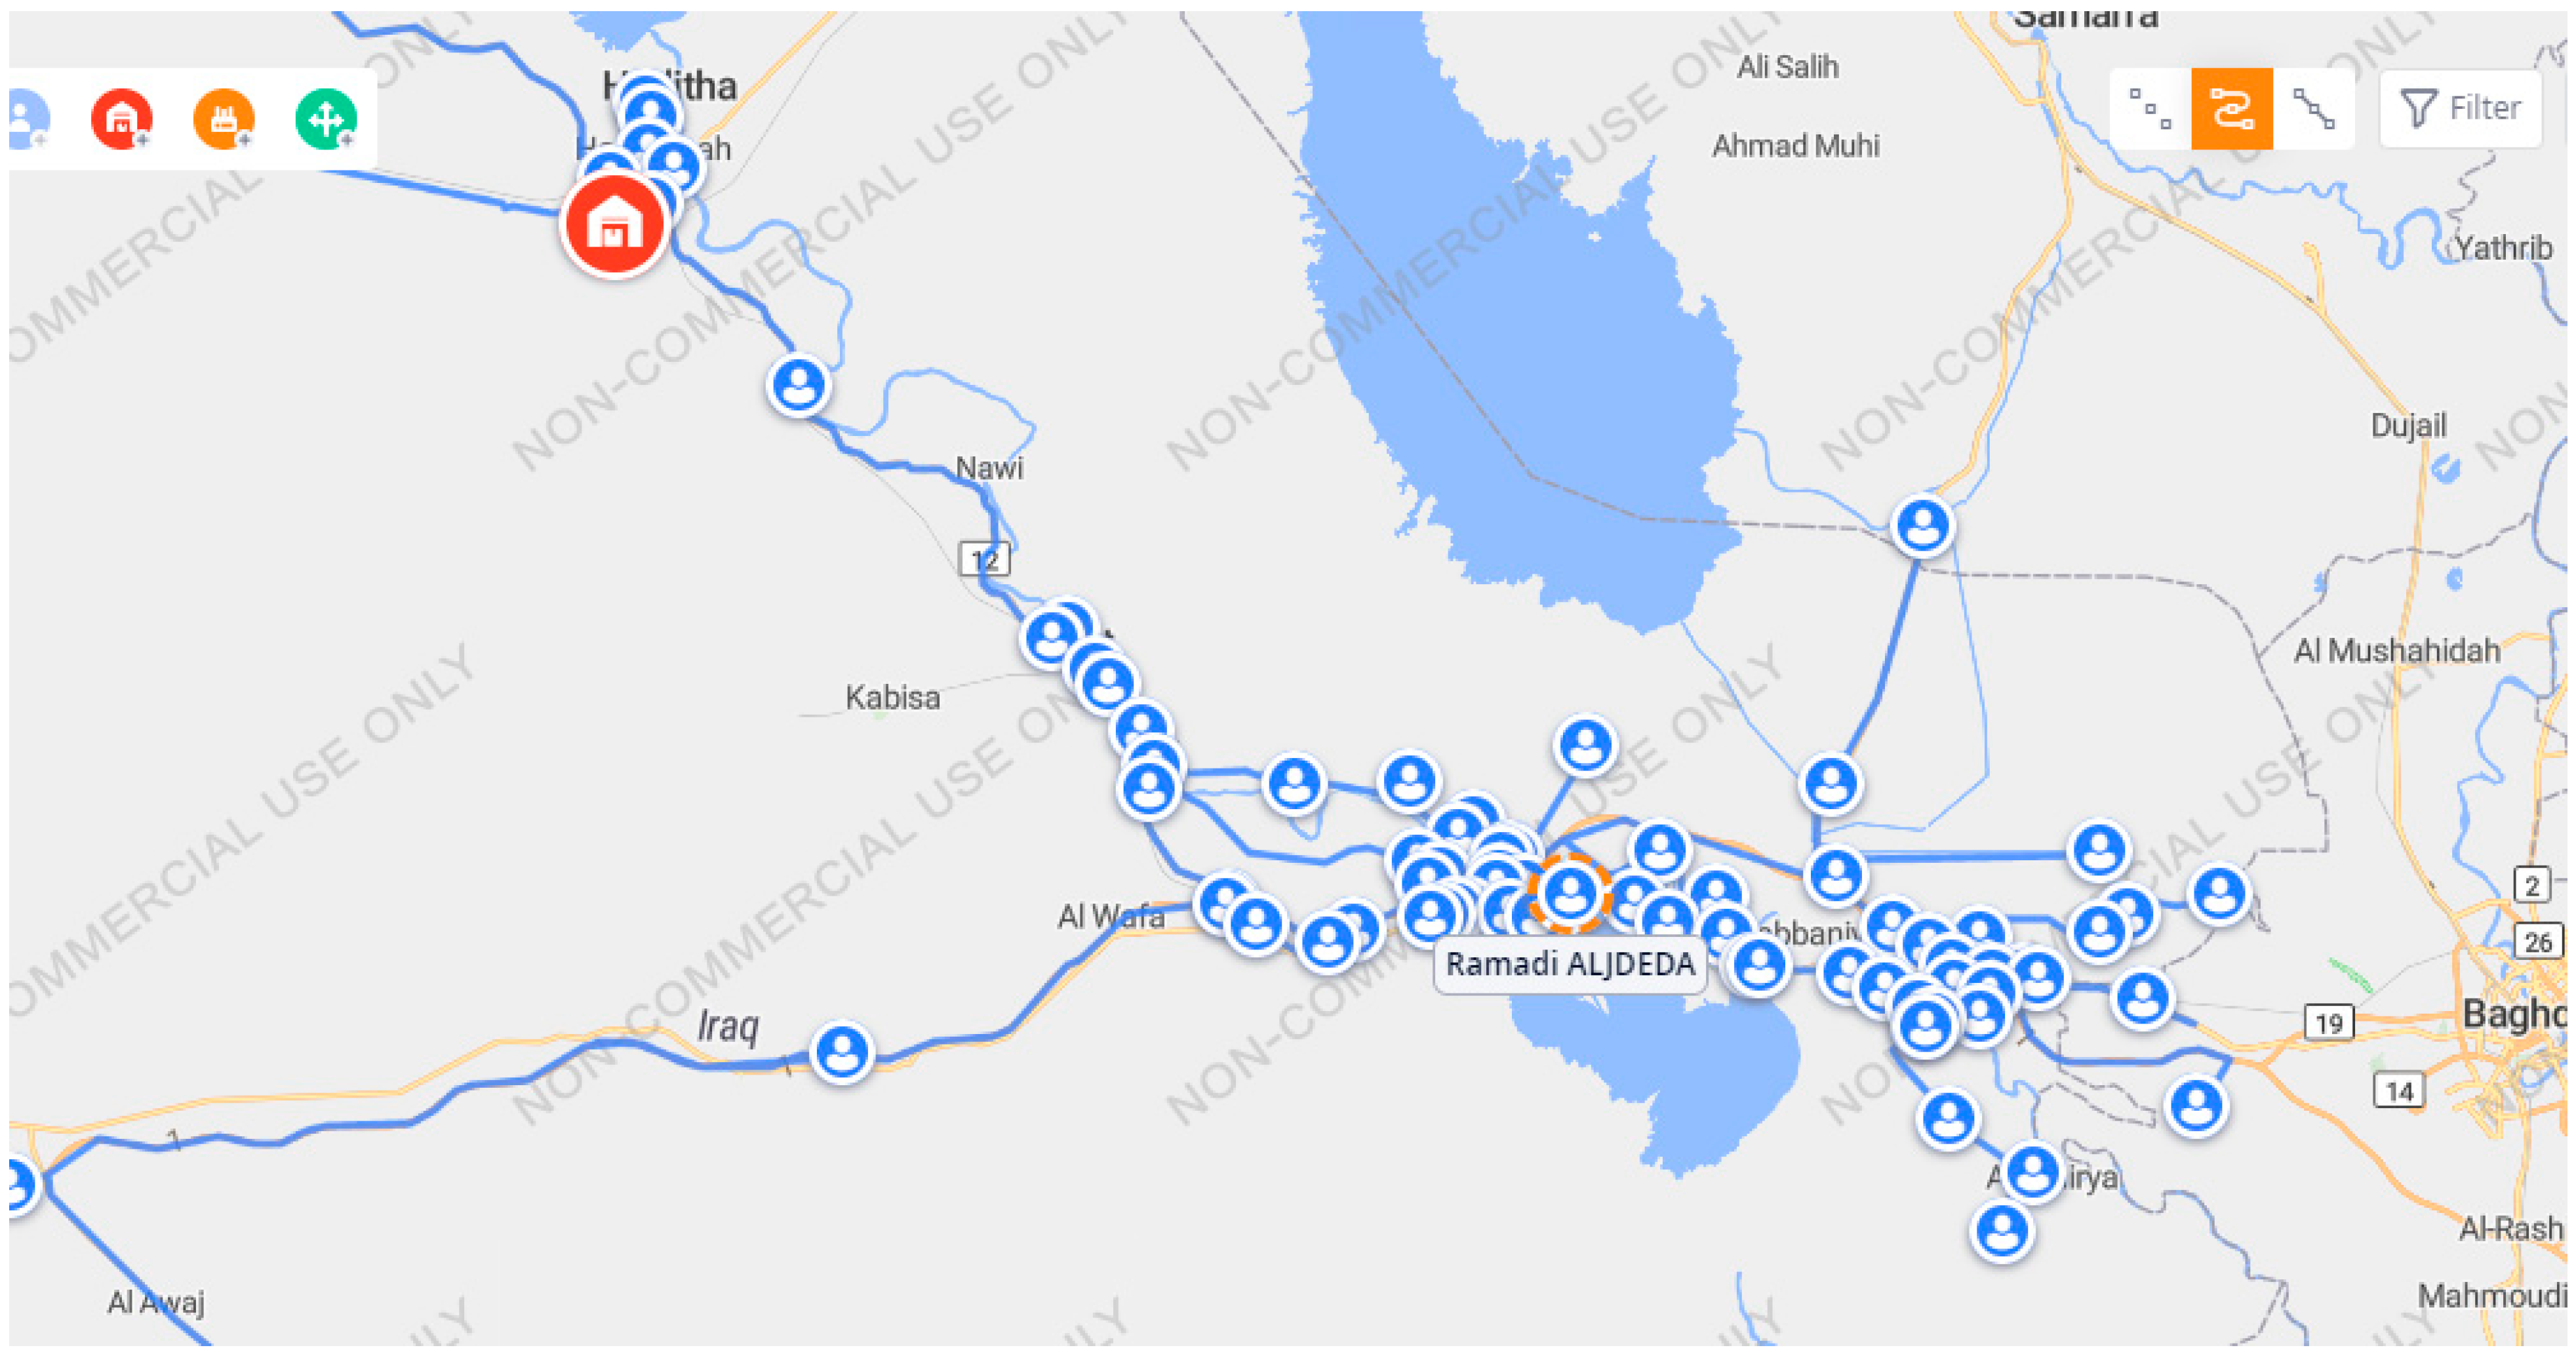
4.1.3. Habbaniya Location
The same SIM experiment was conducted again for the proposed distribution center (located in Habbaniya). The experiment was conducted using the same previous input data, including costs and coordinates of filling station locations, as well as order quantities. The only difference is the distribution center location coordinates, where the Habbaniya location coordinates were entered. As shown in
Figure 3, we can see the results of the experiment in
Table 6, which indicate that the total costs were 6,846,310,260 IQD. At the same time, the location changes also led to increased CO
2 emissions from the transportation process (1,655,286 kg).
4.1.4. Haqlaniya Location
With the same previous input data of costs and coordinates of filling station locations, as well as order quantities, the only difference in this experiment is the distribution center location coordinates, where the Haqlaniya location coordinates were used. A SIM experiment was conducted for the proposed location (Haqlaniyah location), and as shown in
Figure 4, the results of the experiment are presented in
Table 7. Notably, the total costs and CO
2 emissions increased significantly. They were (13,662,535,469 IQD) and (3,303,297 kg) on straight.
5. Discussion
As shown in
Table 8, a comparative analysis was conducted across four distribution scenarios. Although statistical testing was not applicable due to the deterministic nature of the model outputs, a relative difference analysis reveals meaningful insights:
The Ramadi distribution center achieved the lowest transportation cost (6.75 billion IQD) and CO2 emissions (1.63 million kg), representing a reduction of over 50% in both metrics compared to the Haqlaniya scenario (13.66 billion IQD and 3.30 million kg CO2).
The GFA-based optimization (GFA DC) further improved results, lowering costs by approximately 3.4% compared to Ramadi and reducing CO2 emissions by an additional 3.4%.
Although Habbaniya performed moderately better than Haqlaniya, it remained inferior to both GFA and Ramadi options in all indicators.
Although the GFA DC location proposed through the Green Field Analysis (GFA) experiment achieves the lowest CO
2 emissions, lowest transportation cost and the shortest transportation distance, as shown by the results of the simulation experiment (SIM) in ALX, compared to the locations of other distribution centers, as shown in
Table 8. It was found upon ground inspection of the proposed location (GFA DC) that the proposed ground location could not be selected due to the following critical considerations:
Practical constraints—The land area available for the proposed location is insufficient to accommodate the structural design and storage capacities planned for the distribution center. The petroleum products distribution center requires ample space for storage tanks, operational facilities, and future expansion [
5].
Regulatory restrictions—Government regulations in Iraq prohibit the establishment of industrial facilities, including petroleum product distribution centers, within residential neighborhoods for several reasons related to health, safety, and the environment. These facilities and installations can pose risks such as fires, air pollution, noise, and damage to internal road infrastructure due to the heavy loads of fuel trucks.
The other three locations proposed by the company have sufficient areas to establish the required distribution center. They are located far from residential neighborhoods, with the added benefit of potential future expansion, as the company owns the land. Thus, the fixed costs and other costs are equal for all three facilities; therefore, the comparison is based on the lowest total transportation cost.
On this basis, the Ramadi location is the optimal site for establishing the required distribution center, as it has the lowest total transportation cost among the three locations.
6. Conclusions
This study identifies the Ramadi location as the optimal choice for establishing a petroleum products distribution center in Anbar Governorate, despite the GFA DC location offering lower costs and emissions in simulations. The Ramadi site’s advantages in terms of land availability, regulatory compliance, and future expansion potential make it the most feasible option. The use of the simulation model, as shown in this study through ALX, proves to be a valuable tool for understanding the complexities of logistics chains. ALX is a powerful software that combines optimization and simulation to manage complex supply chains. Its user-friendly interface enables model creation and analysis without extensive programming knowledge. ALX enhances supply chain resilience by simulating it, helping organizations improve sustainability and adaptability. However, it comes with certain limitations. First, it is data-intensive, requiring large amounts of detailed data for accurate simulations, which can be challenging to obtain in real-world settings. Additionally, the software relies on manual data entry, which increases the risk of errors in inputting critical information for simulations or optimization. Moreover, the commercial version of ALX is quite expensive, making it challenging for researchers or smaller organizations with limited budgets to access. Despite these challenges, ALX remains a valuable tool for strategic decision-making in supply chain optimization.
One of the significant limitations of this research is the lack of access to a database, particularly financial data, for the researchers. This required conducting numerous face-to-face meetings with department managers at the company and fuel stations to gather the necessary data for completing the study.
For future research, we suggest extending the analysis to other regions with different logistical challenges, incorporating dynamic demand and disruptions into the model, and integrating additional sustainability metrics such as energy consumption and social impacts to provide a more comprehensive evaluation.
Author Contributions
Conceptualization, M.S.J. and A.B.A.; methodology, M.S.J. and F.M.; software, M.S.J.; validation, A.B.A., O.A. and F.M.; formal analysis, M.S.J.; investigation, M.S.J.; resources, M.S.J.; data curation, M.S.J.; writing—original draft preparation, M.S.J.; writing—review and editing, M.S.J.; visualization, M.S.J.; supervision, F.M.; project administration, M.S.J. and O.A.; funding acquisition, M.S.J. All authors have read and agreed to the published version of the manuscript.
Funding
This research received no external funding.
Data Availability Statement
The data supporting the findings of this study were collected through face-to-face interviews with department managers and fuel station managers, as well as field visits to fuel stations to record their geographic coordinates. The data are available upon reasonable request from the corresponding author.
Conflicts of Interest
The authors declare no conflict of interest.
References
- Lima, C.; Relvas, S.; Barbosa-Póvoa, A.P.F.D. Downstream oil supply chain management: A critical review and future directions. Comput. Chem. Eng. 2016, 92, 78–92. [Google Scholar] [CrossRef]
- Barbosa-Póvoa, A.P. Process supply chains management—Where are we? Where to go next? Front. Energy Res. 2014, 2, 23. [Google Scholar] [CrossRef]
- Kazemi, Y.; Szmerekovsky, J. Modeling downstream petroleum supply chain: The importance of multi-mode transportation to strategic planning. Transp. Res. E Logist. Transp. Rev. 2015, 83, 111–125. [Google Scholar] [CrossRef]
- Dabibi, M.; Farhang Moghaddam, B.; Afshar Kazemi, M.A. Locating distribution/service centers based on multi objective decision making using set covering and proximity to stock market. Int. J. Ind. Eng. Comput. 2016, 7, 635–648. [Google Scholar] [CrossRef]
- Gianpaolo, G.; Gilbert, L.; Roberto, M. Introduction to Logistics Systems Management.; John Wiley & Sons, Ltd.: Hoboken, NJ, USA, 2013. [Google Scholar]
- LeMay, S.; Helms, M.M.; Kimball, B.; McMahon, D. Supply chain management: The elusive concept & definition. Int. J. Logist. Manag. 2017, 28, 1425–1453. [Google Scholar]
- Wang, G.; Huang, S.H.; Dismukes, J.P. Product-driven supply chain selection using integrated multi-criteria decision-making methodology. Int. J. Prod. Econ. 2004, 91, 1–15. [Google Scholar] [CrossRef]
- Christopher, M.; Gattorna, J. Supply chain cost management and value-based pricing. Ind. Mark. Manag. 2005, 34, 115–121. [Google Scholar] [CrossRef]
- Lima, C.; Relvas, S.; Barbosa-Póvoa, A. Stochastic programming approach for the optimal tactical planning of the downstream oil supply chain. Comput. Chem. Eng. 2018, 108, 314–336. [Google Scholar] [CrossRef]
- Leiras, A.; Ribas, G.; Hamacher, S.; Elkamel, A. Literature review of oil refineries planning under uncertainty. International Journal of Oil, Gas and Coal Technology 2011, 4, 156–173. [Google Scholar] [CrossRef]
- Kallinteris, N.; Aslam, H. Integrating Simulation and Logistics Optimization for Resilient Supply Chain Networks. IFAC-PapersOnLine 2024, 55, 2713–2718. [Google Scholar] [CrossRef]
- Vitorno, L.; Silva, F.C.A.; Gomes, C.F.S.; Medina, A.C.; Santos, M. Simulation of the grape distribution network in the São Francisco Valley region: Anylogistix. Procedia Comput. Sci. 2022, 214, 1015–1022. [Google Scholar] [CrossRef]
- Longo, F.; Manfredi, K.A.; Solina, V.; Conte, R.; Cosma, A. Improving Supply Chain Sustainability and Resilience via anyLogistix: Research Trends and Future Challenges. Procedia Comput. Sci. 2024, 232, 1721–1728. [Google Scholar] [CrossRef]
- Ivanov, D.; Dolgui, A.; Sokolov, B.; Ivanova, M. Integrated simulation-optimization modeling framework of resilient design and planning of supply chain networks. IFAC-PapersOnLine 2022, 55, 2713–2718. [Google Scholar] [CrossRef]
- Ivanov, D. Disruption tails and revival policies: A simulation analysis of supply chain design and production-ordering systems in the recovery and post-disruption periods. Comput. Ind. Eng. 2019, 127, 558–570. [Google Scholar] [CrossRef]
- Dos Santos Hermogenes, L.R.; De Almeida, I.D.P.; Lellis Moreira, M.Â.; De Araújo Costa, I.P.; Gomes, C.F.S.; Dos Santos, M.; De Oliveira Costa, D.; De Moura Pereira, D.A. E-commerce Supply Chain analysis using the ANYLOGISTIX computational tool. Procedia Comput. Sci. 2022, 214, 487–494. [Google Scholar] [CrossRef]
- Marmolejo-Saucedo, J.A.; Rodriguez-Aguilar, R.; Manuell-Barrera, O.S.G. Technical evaluation of the opening of facilities in the pharmaceutical industry: Optimization to supply chain in Mexico. IFAC-PapersOnLine 2019, 52, 2692–2697. [Google Scholar] [CrossRef]
- Ivanov, D. Predicting the impacts of epidemic outbreaks on global supply chains: A simulation-based analysis on the coronavirus outbreak (COVID-19/SARS-CoV-2) case. Transp. Res. E Logist. Transp. Rev. 2020, 136, 101922. [Google Scholar] [CrossRef]
- Burgos, D.; Ivanov, D. Food retail supply chain resilience and the COVID-19 pandemic: A digital twin-based impact analysis and improvement directions. Transp. Res. E Logist. Transp. Rev. 2021, 152, 102412. [Google Scholar] [CrossRef]
- Sun, X.; Andoh, E.A.; Yu, H. A simulation-based analysis for effective distribution of COVID-19 vaccines: A case study in Norway. Transp. Res. Interdiscip. Perspect. 2021, 11, 100453. [Google Scholar] [CrossRef]
- Prosser, W.; Folorunso, O.; McCord, J.; Roche, G.; Tien, M.; Hatch, B.; Spisak, C.; Genovese, E.; Pare, B.; Donatien, K.; et al. Redesigning immunization supply chains: Results from three country analyses. Vaccine 2021, 39, 2246–2254. [Google Scholar] [CrossRef]
- Vitorino, L.; Costa, I.P.A.; Terra, A.V.; Medina, A.C.; Gomes, C.F.S.; Santos, M. Analysis of food distribution network using Anylogistix computational tool. IFAC-PapersOnLine 2022, 55, 2018–2023. [Google Scholar] [CrossRef]
- Jha, H.; Mohan, U. A multi-period discrete event simulation model for comparing synchronous and asynchronous facility reopening in global supply chains affected by disruption. Supply Chain Anal. 2023, 2, 100010. [Google Scholar] [CrossRef]
- Cimino, A.; Longo, F.; Mirabelli, G.; Solina, V. A cyclic and holistic methodology to exploit the Supply Chain Digital Twin concept towards a more resilient and sustainable future. Clean. Logist. Supply Chain 2024, 11, 100154. [Google Scholar] [CrossRef]
- Coronado-Hernandez, J.R.; Rios-Angulo, W.A.; de Avila, J.; Segovia, C.E.; Gatica, G.; de León, F.J.-P. Naval Antarctic Supply Chain Modeling and Simulation. Procedia Comput. Sci. 2024, 238, 1023–1028. [Google Scholar] [CrossRef]
- Bounadi, N.; Boussalia, S.R.; Bellaouar, A. Optimizing a Distribution Network for Agri-food Products in Algeria Using AnyLogistix Software. LOGI-Sci. J. Transp. Logist. 2024, 15. [Google Scholar] [CrossRef]
- Calculate Truck CO2 Emissions. n.d. Available online: https://impargo.de/en/docs/calculate-co2-emissions (accessed on 10 May 2025).
- Ivanov, D. Supply Chain Simulation and Optimization with anyLogistix, 6th ed.; Berlín School of Economics and Law: Berlin, Germany, 2024. [Google Scholar]
| Disclaimer/Publisher’s Note: The statements, opinions and data contained in all publications are solely those of the individual author(s) and contributor(s) and not of MDPI and/or the editor(s). MDPI and/or the editor(s) disclaim responsibility for any injury to people or property resulting from any ideas, methods, instructions or products referred to in the content. |
© 2025 by the authors. Licensee MDPI, Basel, Switzerland. This article is an open access article distributed under the terms and conditions of the Creative Commons Attribution (CC BY) license (https://creativecommons.org/licenses/by/4.0/).


