1. Introduction
The circular economy (CE) is a model of production and consumption that keeps existing materials and products in use for as long as possible. Waste is eliminated and products, packaging, and materials are circulated at their highest value. Circular economy models primarily aim to relieve resource depletion. As a planet, we are running out of natural resources and closing the loop saves materials, energy and water. As a result of increased material and energy efficiency, the greenhouse gas (GHG) emissions of circular supply chains can be significantly lower than linear supply chains. Despite these benefits, the large-scale implementation of circular supply chains is lagging, a key barrier being the economic viability of system implementation.
The World Economic Forum annually presents the ‘Circularity Gap Report’, which assesses the state of the world in relation to circularity. The most recent report showed that circularity dropped worldwide from 9.1% in 2018 to 7.2% in 2023. In the meantime, environmental and social problems such as resource and nature depletion, unequal access to resources, and pollution from the poor treatment of waste resources are mounting, bringing an urgent need for change [
1].
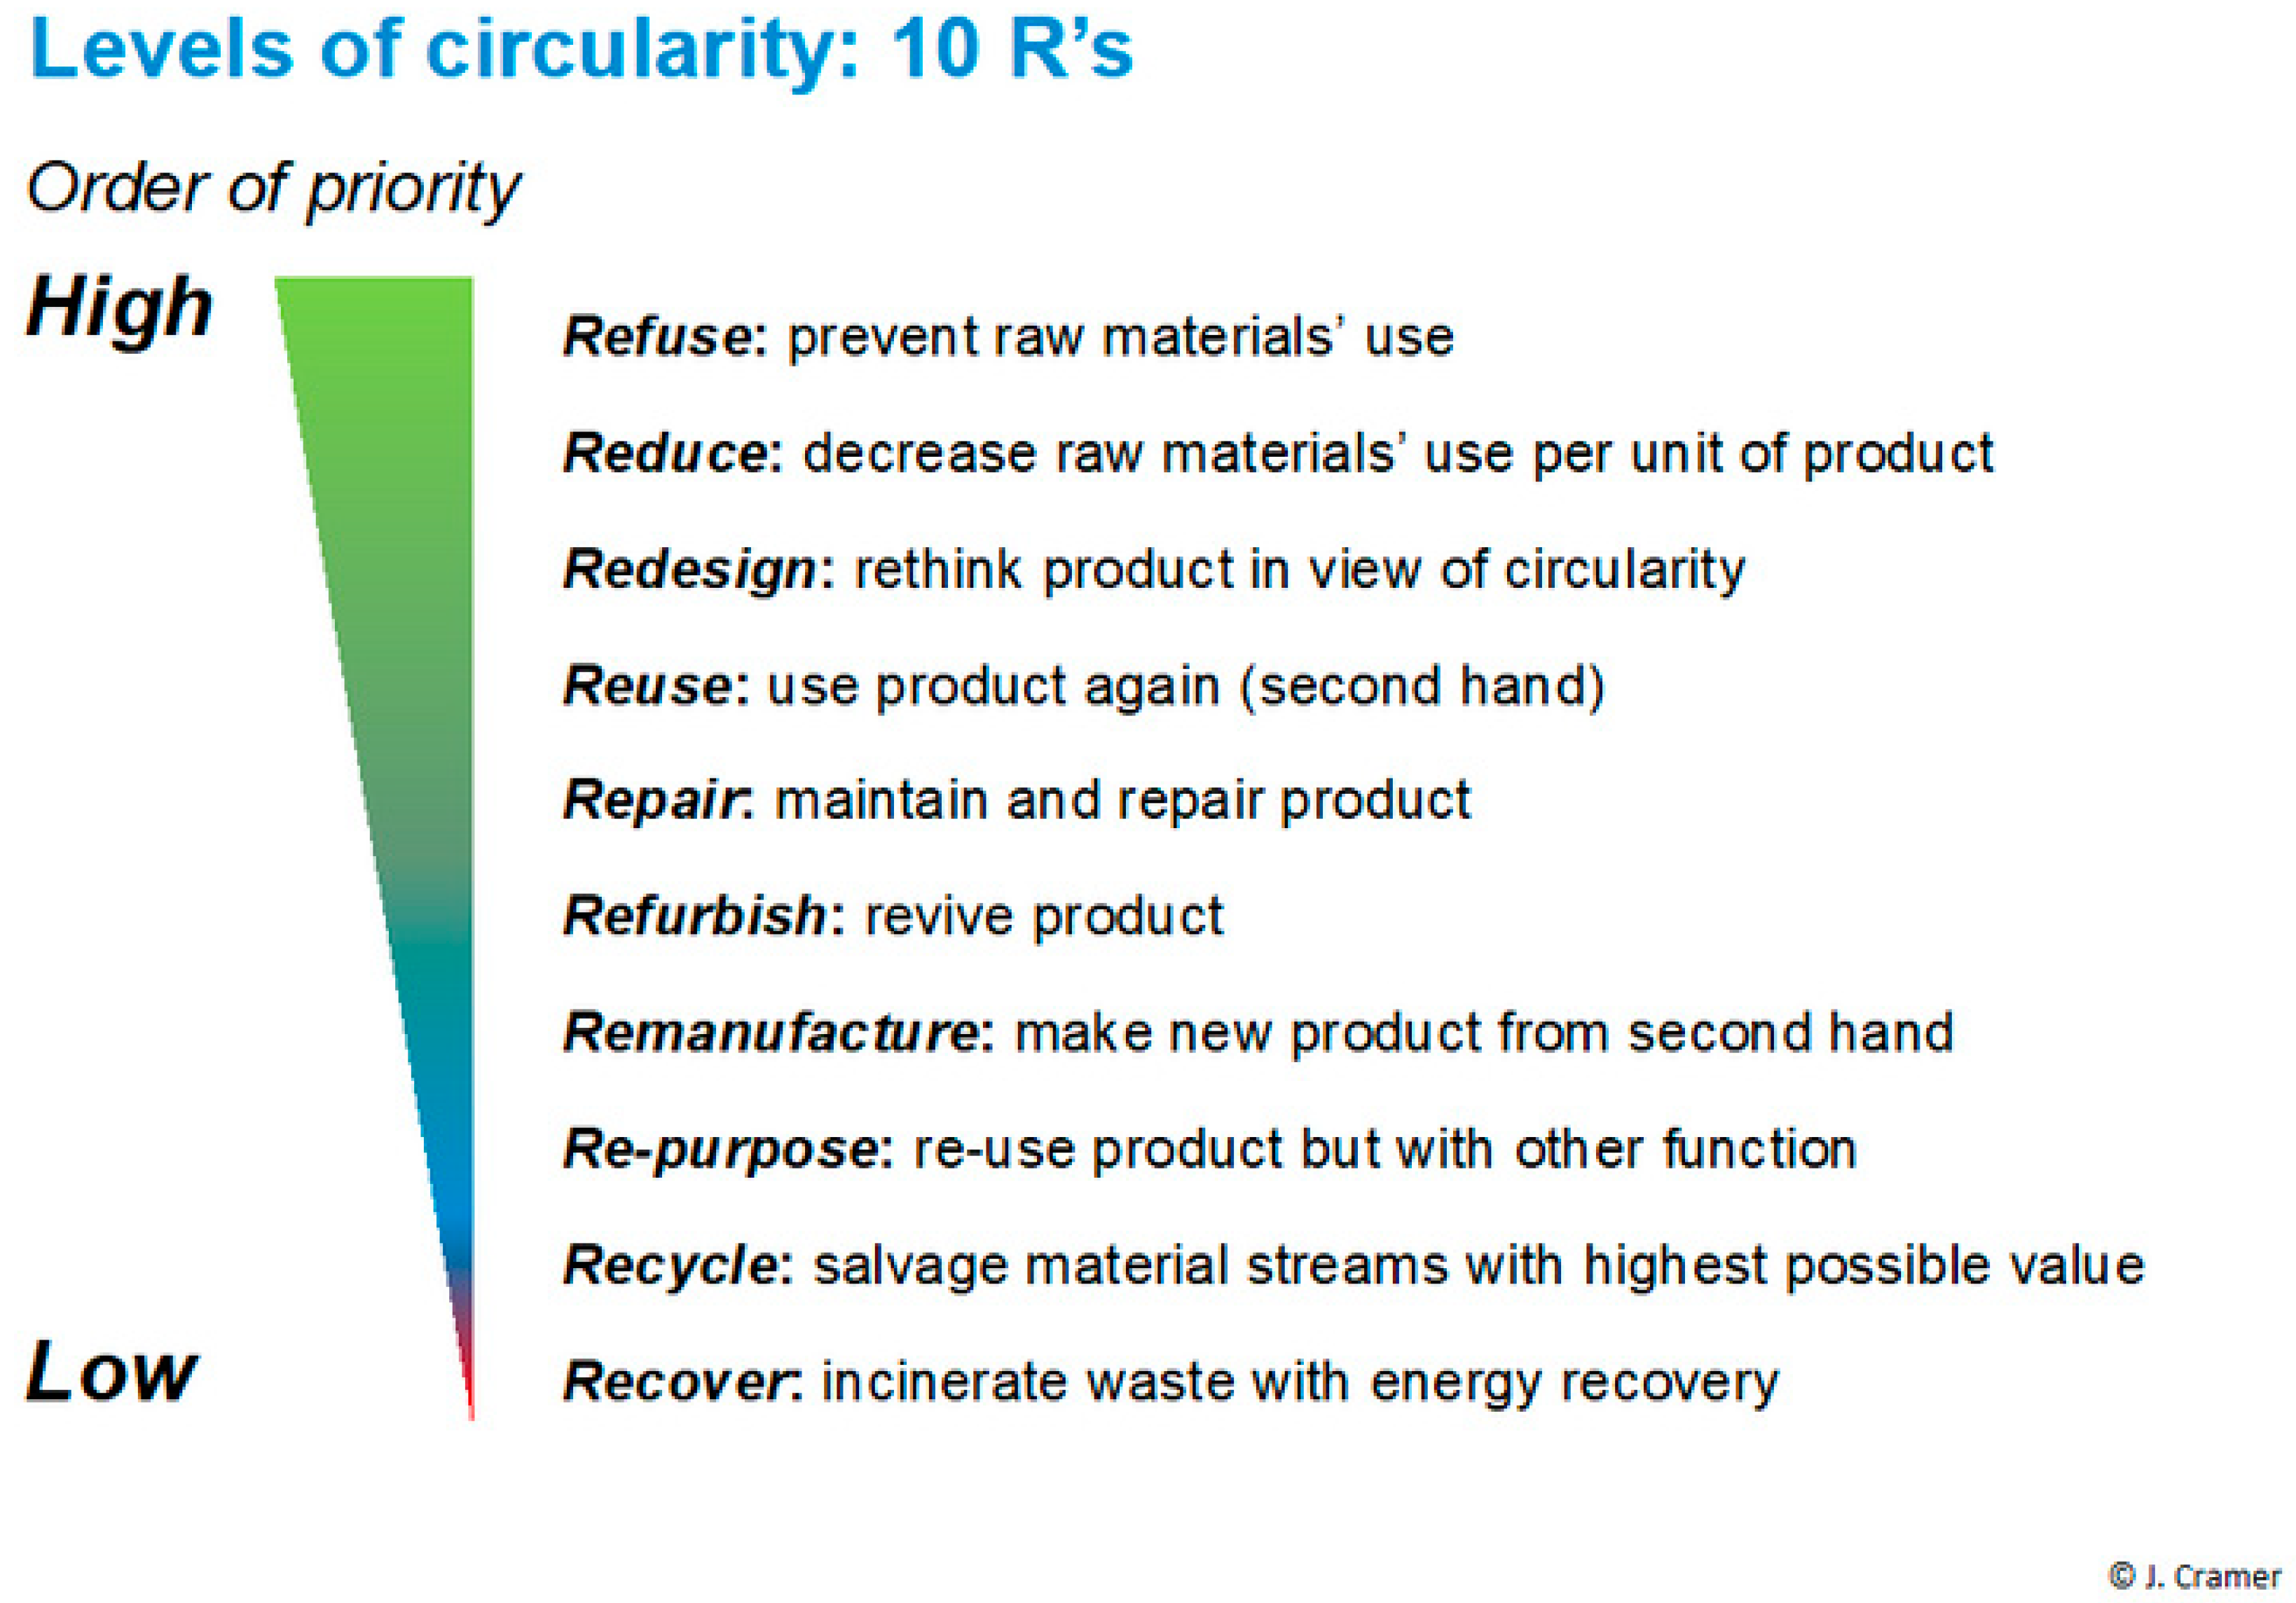
Developing circular economy practices for electrical products includes implementing new business models, such as leasing and hire, eco-design, and managing return channels for reuse, repair, refurbishment, and recycling [
2,
3]. Cramer has prioritized different options for reducing resource use and managing waste to increase circularity
(Figure 1) [
1].
The reuse of electrical items has been advocated [
4] but is subject to limitations such as inconsistent collection and a perception of low-quality output. In Spain, for example, less than 10% of consumers have defective electronics repaired, and less than 1% have ever bought secondhand items [
5]. Nevertheless, markets for many products, such as refurbished phones, are expected to grow [
6]. Moreover, product or parts reuse generally has a lower carbon footprint than material recycling, and it may result in multiple recovery loops instead of one [
2].
Waste Electrical and Electronic Equipment (WEEE) refers to discarded electrical and electronic devices. WEEE can include a wide range of items, such as computers, smartphones, refrigerators, and other household appliances. Managing WEEE is important because electronic waste often contains hazardous materials, including heavy metals and other substances that can be harmful to the environment and human health if not properly handled and disposed of. Many countries have implemented regulations and recycling programs to address the proper disposal and recycling of electronic waste.
Extended Producer Responsibility (EPR) is one such policy approach designed to make importers and manufacturers of products responsible for the entire life cycle of their products, especially when it comes to waste management.
This article considers four concurrent recovery options for electrical products, as defined in
Table 1, three reuse options, and one recycling option. The key driver in value creation is the closed-loop supply chain. It is defined as “the design, control, and operation of a system to maximize value creation over the entire life cycle of a product with dynamic recovery of value from different types and volumes of returns over time” [
7].
The purpose of this research is to assess the potential for municipal waste collection points to be used as a supply source for the resale of secondhand equipment. In addition to the GHG and resource benefits of reuse previously mentioned, the socio-economic benefits of these types of schemes can include the following:
Offering lower income communities’ digital connectivity.
Supporting local economies and social enterprises with training and employment via refurbishment and resale activities.
Providing an indicator for the wider carbon footprint benefits of reuse over other disposal methods.
This research observes and quantifies the resource potential of devices that could be refurbished, assesses the likely level of re-work (e.g., is this economically viable and practical to repair?) whilst also looking at the social behavior patterns when IT equipment is discarded (device age and condition) at a municipal waste collection site in Melbourne, Australia. This project took place during the summer of 2021 and was based on an assessment of 450 devices.
The results demonstrate potential to increase circularity by reuse but also show that actual application is lagging behind. Trends in age, parts salvaging, repair cost, markets, and product condition were identified as current bottlenecks preventing reuse. At the same time, new regulations based on EPR force the industry to take action. EPR is an environmental policy approach in which a producer’s responsibility for a product is extended to the post-consumer stage of its life cycle [
9].
Globally, there is a lack of data on e-waste reuse. This article contributes by showing the cases (product and parts) in which reuse maximizes the benefits of product recovery and when to revert to recycling. This is validated against the actual types of devices found in the Melbourne sample by assessing whether there are enough of the ‘right’ devices to make reuse viable. This assumes there is a market for those returned and refurbished devices. Also, it means that those devices should meet the quality and specification needs of consumers and can be remarketed at a competitive price. An Integer Linear Programming optimization model is applied that calculates the best so-called Recovery Strategies for four product categories: monitors, printers, laptops, and desktop computers.
2. Trends in Reuse Markets
This section describes why, driven by legislation and commercial markets needs, most recovery strategies are recycling based, but there are two recent trends that incentivize reuse. First, EPR-based regulations are beginning to include specific reuse targets that complement recycling targets. Secondly, the reuse market is growing slowly but certainly due to circular economy developments.
Since academic research articles on markets are scarce, we have included trusted non-academic sources within this literature review.
2.1. Consumer Trends
The global market for used computers is forecast to double by 2030, indicating that there is sustained demand for IT equipment and a greater acceptance of alternative ownership models, moving away from solely buying new [
10]. The decline in the sales of desktop computers acts as another example of this [
11], where these devices are more likely to be upgraded and modified to keep them in use for a longer period of time.
Technologies used in IT equipment and consumer electronics are changing quickly. For devices such as mobile phones, two- to three-year-old devices are considered ‘old’, and five-year-old devices are ‘out-of-date’, meaning older units are being viewed as obsolete and are prone to becoming e-waste. This encourages devices to be discarded as waste after a certain period but also provides a supply of stock that can fulfill demand for users not demanding the latest technologies [
12].
Prior research indicates that there are some consumer market segments more suited to used electronics than others. At an international level, electronic products are often shipped from wealthier nations to less economically developed or emerging markets for processing and resale. Research in the smartphone sector [
13] on this topic acts as a strong indicator for laptops and tablets and is echoed through industry feedback in the similarity of trade routes. Used smartphones are often traded in to be returned through specific buy-back or exchange programs developed by brands and retailers. This research shows that typically, 30% of these handsets are sold in developed markets, whereas 70% are sold elsewhere in emerging or less-developed markets. If correct controls are not in place, this international trade can exacerbate harmful environmental and social issues like child labor. During the shipment of devices from country to country, it is highly likely that the shipment will be classified as used electronics and not waste, which permits more freedom of movement under waste laws. One of the major impacts relates to the illegal international trading of e-wastes that are informally dumped instead of being resold, reused, or recycled. This trade is a means for brokers, smugglers, and organized crime groups to meet demands for the cheap disposal of used electronic products [
14].
The demand for used devices can be considered locally as well as internationally because the same forces are at play. The growing social divide in communities is visible in part through access to technology and connectivity, often called the ‘digital divide [
15,
16]’. The gap in access to IT equipment and online connectivity may have previously been a less visible issue on a local level but was highlighted to the public during the 2020/21 COVID-19 pandemic when households were forced into lockdowns. This required the population of many countries to work remotely and/or home school, both requiring adequate access to IT equipment and the internet at an affordable cost.
Research on mobile phones from the Green Alliance [
16] suggests that, although mobile devices may be more suited for redistribution within a marketplace, the more saturated laptop market would benefit from circular economy models that keep the device with a single user for a longer period of time by extending the use phase.
2.2. Emerging Policy Measures
The policy strategy in the EU’s Circular Economy Action Plan is one of the more mature regulatory measures and sees Information Technology equipment as a target sector under the Eco-Design Directive [
17,
18]. The scope goes beyond exclusively IT equipment, including other communication technologies, and the European Commission (EC) has indicated that printing devices will be included. To catalyze a change, the EC will be mobilizing existing and new policy instruments in line with the new sustainable products policy framework to promote longer product lifetimes [
2]. Measures that may feature in regulating these products include several recognized initiatives that consider a holistic oversight of the impacts of electronics across the production, use, and reverse supply chain, such as new circular business models, digital product passports, improved consumer information (on environmental impact), the avoidance of premature obsolescence (including hardware and software), product standardization for remanufacturing, durability, reusability, upgradeability, and repairability, and the improvement of the collection and treatment of waste electrical and electronic equipment. It is expected that this review will include software issues, said to be causing premature obsolescence, and harmonize recycling infrastructure and certification. Although the EU seems to be leading, similar developments are also taking place around the world. The right-to-repair movement is gaining significant momentum in various parts of the world, not just in Europe. However, specific regulations and laws regarding the right to repair vary by country. In the United States, for example, many states are considering or have already passed right-to-repair legislation [
19]. These laws aim to give consumers and independent repair shops access to the information and parts needed to repair electronic devices. The movement primarily focuses on smartphones, laptops, and other consumer electronics, as well as agricultural equipment. Each of these proposals will likely impact opportunities for the reuse of IT equipment. However, many barriers still exist to enable these alternative e-waste management strategies. Information is often not available, nor are spare parts, disassembly is increasingly difficult, and consumers often do not know what their options are. In fact, the EEE repair industry is shrinking in developed countries [
20]. The supply of information and spare parts over the long life cycles of products, well-distributed facilities that can disassemble and repair products, the right-to-repair and eco-design regulations, and a decision-making system to optimally decide on an end-of-life strategy for products, call for a complex and integrated closed-loop supply chain from design to reuse.
2.3. Extended Producer Responsibility
New EPR regulations aim to ensure that producers take responsibility for the environmental impact of their products, from the design and production phase through to the end-of-life stage. They aim to shift the burden of dealing with waste from local governments and taxpayers to importers and manufacturers, encouraging more sustainable and environmentally friendly product design and end-of-life management practices.
Key components of Extended Producer Responsibility include the following:
Product Design: Importers and manufacturers are encouraged to design products with consideration for their environmental impact, making them easier to recycle or dispose of properly. The current collective EPR systems give little incentive to eco-design [
21].
Waste Collection and Recycling: Importers and manufacturers are responsible for setting up or contributing to systems for the collection, recycling, and proper disposal of their products when they become waste. Current systems prove reasonably successful in this, although collection rates could be improved [
22].
Financial Responsibility: Importers and manufacturers may be required to financially support the collection and recycling infrastructure. This could involve fees or taxes based on the environmental impact of their products. The potential impact of this is discussed in [
8].
Regulatory Compliance: Governments often implement EPR through regulations that require importers and manufacturers to comply with specific waste management and recycling standards. Pros and cons are discussed in [
22].
EPR is commonly applied to industries that produce products with a significant environmental impact, including electronics, batteries, packaging materials, and vehicles. Many countries and regions around the world have adopted EPR programs as part of their environmental policies to address the challenges associated with waste management and promote a circular economy. These predominantly drive recycling activities rather than reuse initiatives. In many cases, a collective national recycling system is set up by importers and manufacturers in collaboration with other stakeholders. These tend to be managed by an independent party, usually collective foundations, operating on behalf of many producers and other stakeholders.
The drivers within legislation for reuse are closely coupled to the collection targets most often adopted into producer responsibility and stewardship systems, in the form of recycling and/or reuse targets in e-waste. These regulatory tools are legally binding target-driven systems, whereby importers and manufacturers themselves (individual producer responsibility or their collective operator producer responsibility organizations (PROs)) are responsible for the collection of discarded electronics. Examples of established EPR systems for WEEE are found across Europe, where countries have implemented the WEEE Directive 2012/19/EU into national law. Since 2019, this has prescribed a 65% (roughly equivalent to 13.5 kg per capita) collection target that includes preparation for reuse. North America and the Asia Pacific have more recently established regulations that operate with similar target-based systems. This trend looks to increase globally as stewardship and producer responsibility models are adopted into more national laws, standards, and requirements.
Within EPR policies, France recognizes the reuse of electronics in its reporting, but without mandatory producer targets. Data from [
23] show, for all categories combined, that the “preparation for reuse” and “reuse of pieces” represented 5% and 1%, respectively, of the tonnages processed for professional devices—equipment solely designed for business use, not household use. The professional device reuse rate is much higher than for household e-waste (less than 2% in total). This can be explained by a duration of use by the holders that is less than the product lifespan; that is, when a holder of new equipment discards the equipment before it reaches the end of its life. This generates different deposits in terms of quality and quantity between professional and household used devices particularly for IT equipment and telecommunications devices.
Spain has been a leading country in mandating targets specifically for reuse. The Spanish Royal Decree [
24] requires 3% of large household appliances and 4% of IT equipment to be prepared for reuse. Based on 448,842 tons [
25] of large household appliances and 52,262 [
26] tons of IT equipment placed on the market each year in Spain in 2018, this equates to a target of 13,465 tons of large household appliances and 2090 tons of IT equipment that need to be prepared for reuse.
Most EU member states have difficulty meeting the collection targets, but no penalties have been applied until now.
India has been actively working on implementing EPR for various products since 2016, including e-waste (management) rules. Currently, informal workers play a significant role in collection, reuse, and recycling activities, which means gaining accurate data about e-waste management is challenging. Illegal dumping and limited treatment options are also major challenges affecting the e-waste value chain in India [
27]. Similarly, because e-waste is still not a well-recognized health and environmental threat, less attention is given to the e-waste problem, especially in African countries, making the public vulnerable to toxic elements [
28]. It has been considered that countries with informal sector operations should avoid directly adopting EPR procedures like those adopted in industrialized countries and instead develop their EPR schemes based upon their capacity to implement them [
29].
In East Asia, China has recognized the importance of holding producers accountable for the entire life cycle of their products to address environmental concerns and has been exploring and implementing EPR measures for various products and industries, including electronic waste [
22]. Japan has a well-established EPR system, especially for packaging, electronics, and end-of-life vehicles. The country has been a pioneer in promoting sustainable waste management practices and encouraging producers to take responsibility for their products. South Korea has also implemented EPR programs for various products, including packaging and electronic waste. The government has been working on strengthening and expanding these programs to enhance waste management and recycling efforts.
Other Asian countries, such as Malaysia and Thailand, have also started to implement EPR. The same goes for Australia and New Zealand, with, amongst others, the Australian and New Zealand Recycling Platform Ltd. (TechCollect) operating as a collective compliance organization. In the USA, EPR laws vary from state to state and often focus on specific product categories of electronic waste, batteries, and, more recently, packaging materials. Some argue that individual systems are better [
29], others state that this leads to a patchwork of regulations in the US, resulting in inconsistencies and a lack of scale. Moreover, not all electronics are in scope for US EPR in e-waste [
30].
EPR is complemented with other regulations in many countries. France, for example, has led the way with a mandatory repairability index [
31] as one part of the ‘anti-waste laws’ for some electronics, including laptops, scoring how readily devices can be upgraded or repaired. Carbon fees, also known as carbon pricing or carbon taxes, are mechanisms designed to put a price on carbon emissions in order to incentivize businesses and individuals to reduce their greenhouse gas emissions. They can complement EPR schemes by encouraging companies to be more resource efficient and adding the cost of pollution to the cost of activities that generate it.
Although not within scope of this study, collection is of crucial importance to EPR systems; in fact, collection rates tend to be lower than recovery rates. One way to improve this is to apply vehicle routing models, which optimize the pickup and delivery of cargos to different depots [
32]. Given vehicle capacity and energy consumption that vary with load, the mathematical model seeks to simultaneously reduce costs and waiting time for customers. However, they do not measure volumes to meet the collection quota imposed, nor the energy mix to convert energy consumption into carbon emissions. In a related paper, a two-stage stochastic programming model using deteriorating and damaged products [
33]. The model reduced the cost of purchasing, transporting, storing, product recovery, and shortages. This cut down on greenhouse gas emissions related to transportation, product recovery, and recycling programs. Revenue sharing and quantity discount contracts were examined in the business models. Numerical examples analyzed the trade-offs between economic and environmental objectives under different supply chain parameters. As it would need substantially more data than our model, it would be hard to apply this model in a real-life case study like this paper.
3. Research Methodology
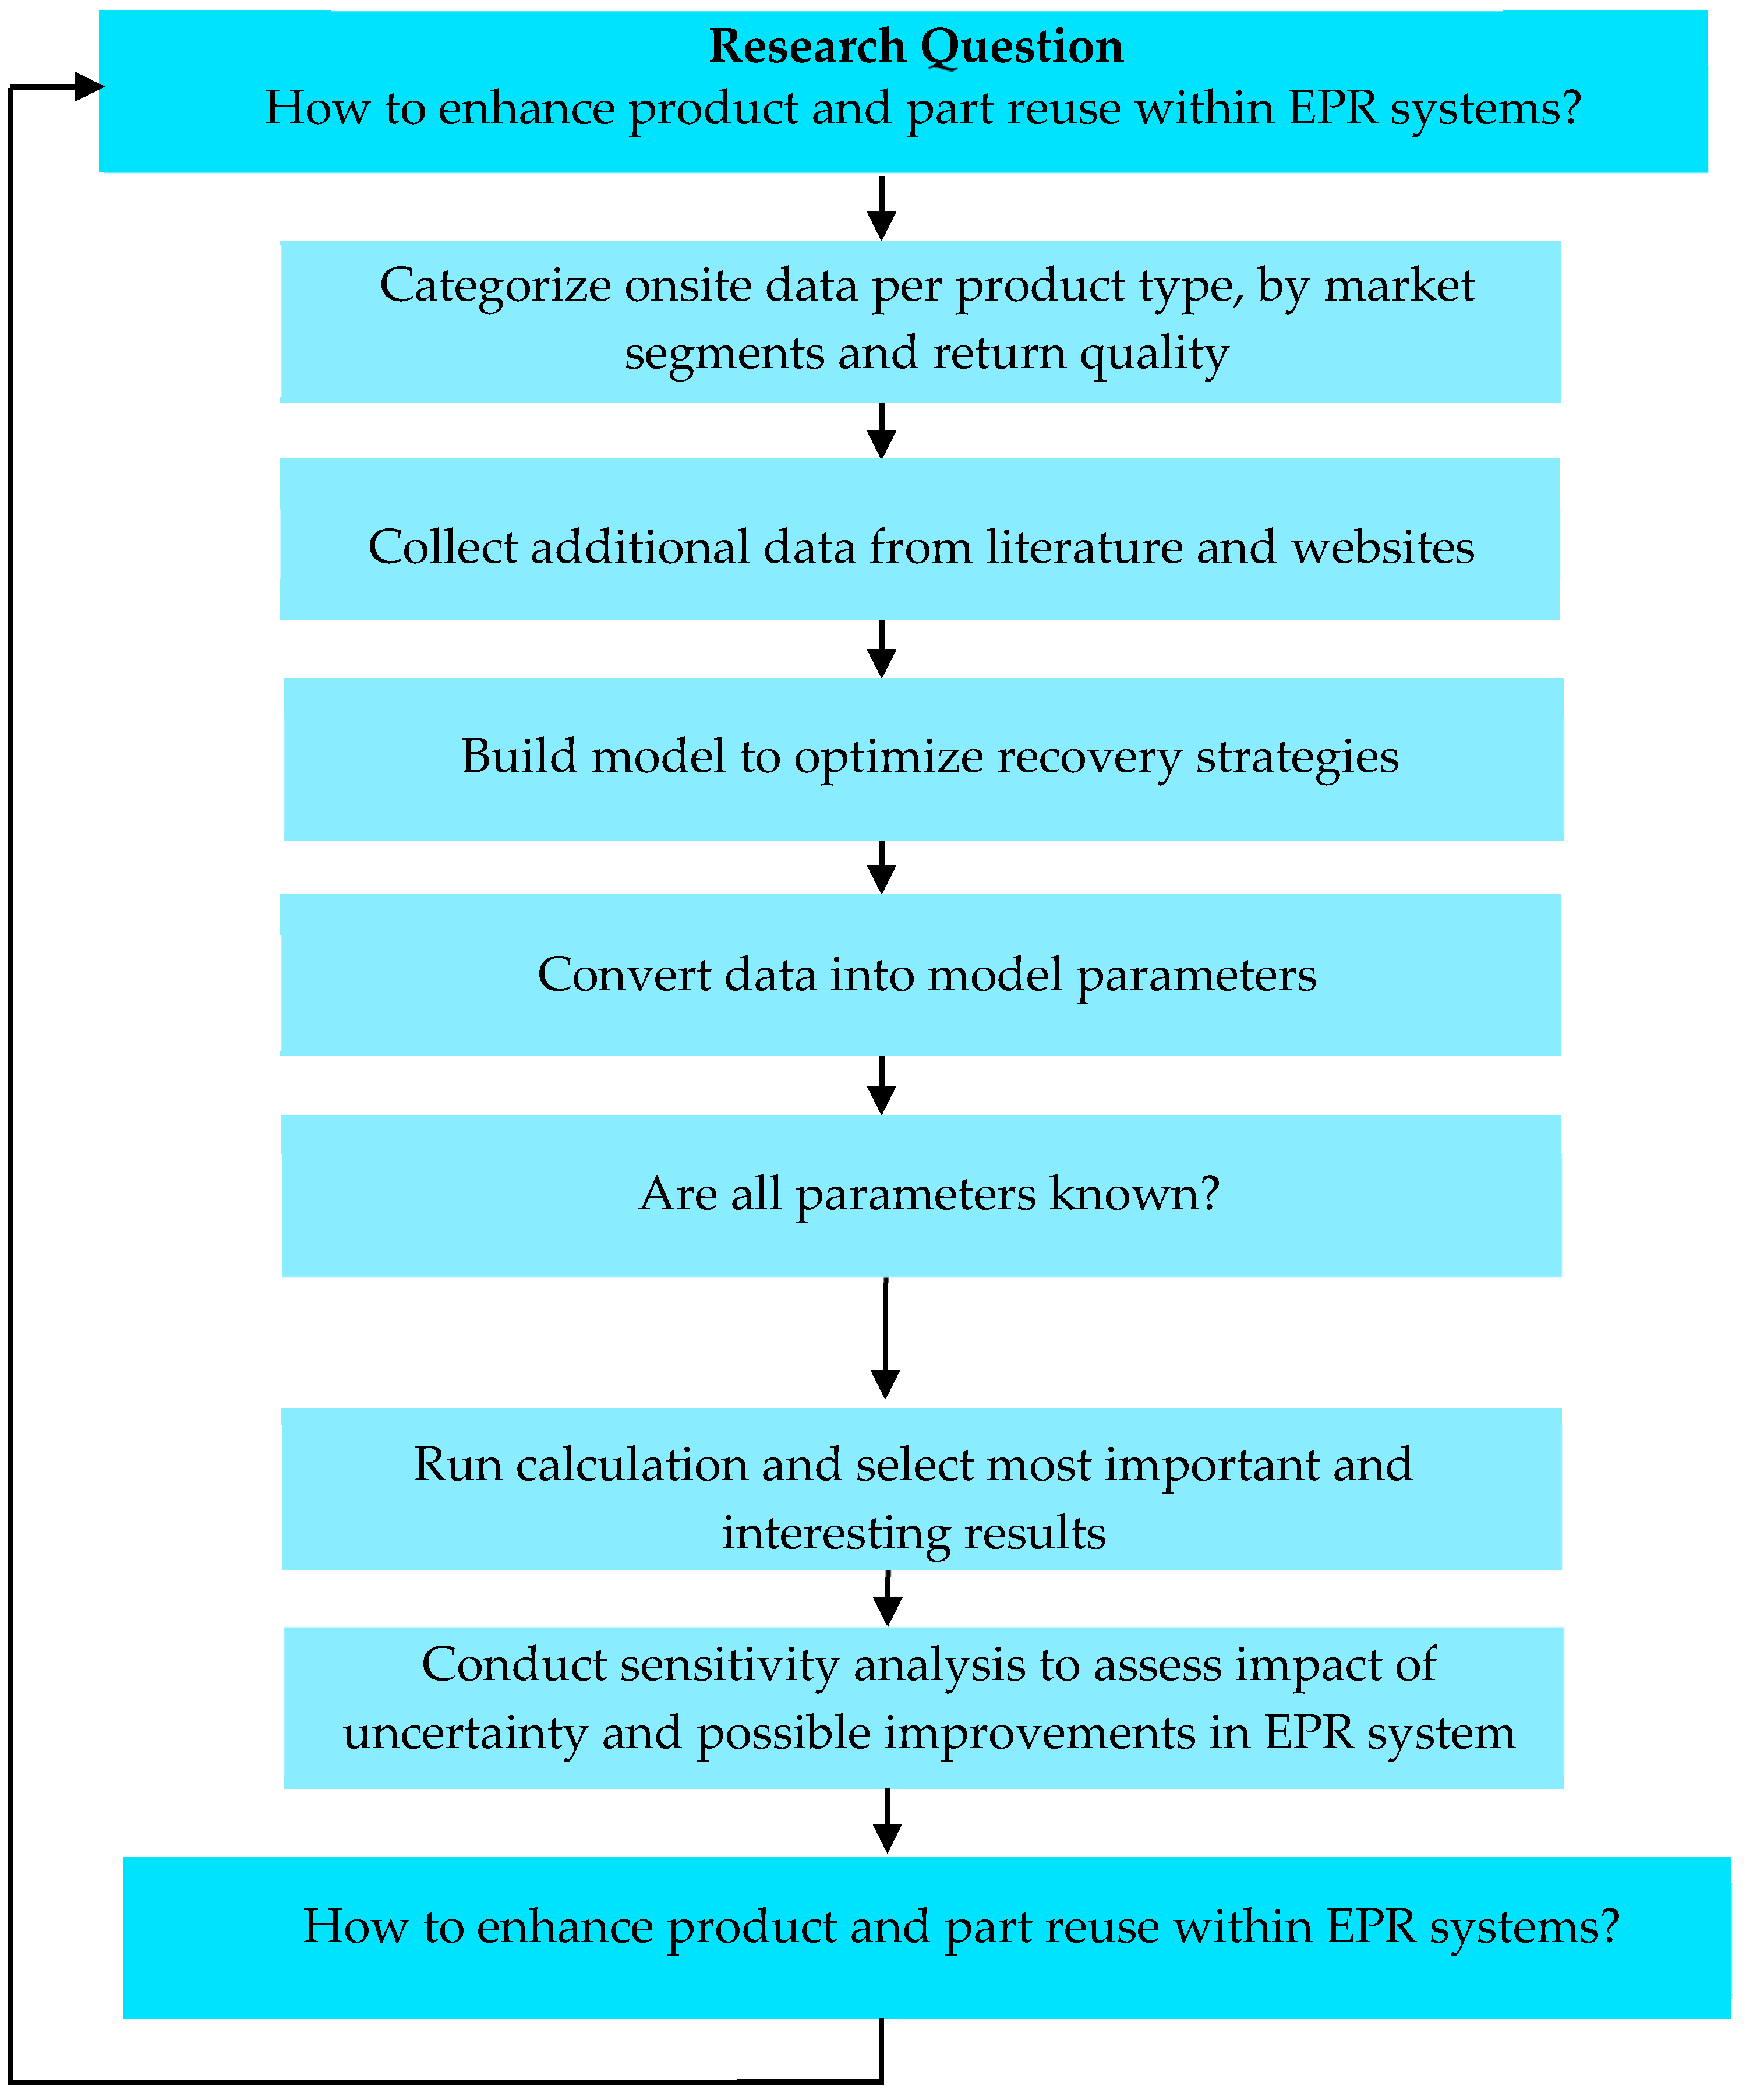
We apply a 9-step method, which is schematically pictured in
Figure 2. In order to answer the research question and set model parameter values, we first need to structure the data collected on-site in Melbourne. Products are categorized by type to distinguish the differing function and value of each type. On the return side, we categorize products into three classes based on visual inspection for visual aesthetics, damage, and completeness (i.e., parts missing), followed by a sample number of products from each group undergoing a functional test (e.g., power on device or print test page). These tests and the resulting categorization are illustrative of how an asset management operation may consider potential opportunities for reuse where quality and condition are deemed high enough. The higher the return quality, the more feasible the product is for reuse. On the other side, we classify products based on their brand as premium, medium, or low segment. Subsequently, we add the number collected for each of the nine classes, displayed in
Table 2, for all four product types. Data on material composition and carbon footprints are collected from the literature for all four product types for the new production (to calculate footprint reduction) for all recovery options. All sources give data for a single product which fits the model. Finally, market data, i.e., buy-back prices, sales prices and cost structures, were averaged from several different asset management buy-back organizations that seek to buy, refurbish, then resell those products where they deem there to be market value remaining in the product (note: buy back was not offered for all products, presumably due to the low value or demand for that category of product). Prices are always given per single product, cost data are usually at the bulk level; hence, we have to calculate the cost per single product by dividing the weight per product into the total volume.
Once parameter values are set, we can run the model and compare the results for 15 recovery strategies. Also, we can test the robustness of strategies in scenarios by sensitivity analysis. Next, we elaborate on the case, data collection, model, optimization strategies, and how to do sensitivity analysis.
3.1. Case Description
Australia operates a co-regulatory arrangement for the National Television and Computer Recycling Scheme (NTCRS), supporting importers and manufacturers to meet obligations under the Recycling and Waste Reduction Act 2020 (RAWR Act), which replaced Australia’s former product stewardship legislation (Product Stewardship Act 2011). The Act mandated producers to finance the end-of-life collection and treatment of devices. ANZRP (Australia and New Zealand Recycling Platform) is a co-regulatory arrangement with operators fulfilling producers’ responsibilities as waste collectors and processors. The general trend in the market is one of increasing recycling rates versus a decline in waste arisings. Reuse of products is minimal.
The priority focus of this research is to introduce new evidence in the form of primary data gathering and analysis of IT equipment returned to a municipal waste collection site in Melbourne, Australia. The reuse potential of the equipment has been assessed both economically and environmentally. More specifically, the purpose is to better understand the amount and nature of IT equipment being discarded by consumers and assess the type, condition, and market of the items discarded. This work aims to develop an understanding of the feasibility for reuse and the type of re-work that might be necessary to return used IT equipment (monitors, printers, laptops, and desktop computers) to the market.
The material assessed meets the definition of waste and arises from householders discarding IT equipment.
3.2. Data Collection
The reuse study took place in Melbourne, Australia, and was based on an assessment of 450 devices during the summer of 2021. The research took place with support from waste management partner ANZRP and city collections.
The data provided are mainly volume based. After collection and testing/visual inspection, the products were classified into three quality level categories (good, average, and poor). Products of good quality can be easily repaired at low cost, average quality requires more effort and new parts/materials to make the product fit for reuse, and poor-quality returns can only be recycled at the material level. Subsequently, logistics and recovery costs were assessed, both for reuse and recycling differentiated per quality level. From secondary sources (websites and the academic literature), complementary data were collected on buy-back and selling prices per market segment, as well as material composition and carbon emissions. Market segments are premium (high quality and expensive), low (cheap products and lower quality), and medium, competing on the price/quality ratio.
Appendix A lists all the data sources used.
Table 2 below lists the numbers for the
monitors (M),
printers (P),
laptops (L), and
desktop computers (D). Please note that we present the results by product type, as they can be quite different. We do so by utilizing the same structure. Also, we have not presented all the results but have selected the most interesting ones; otherwise, the paper would have been too long.
3.3. Calculation Model
The calculation model is based on Integer Linear Programming. The economic part of it maximizes margins given sales prices, collection and recovery costs, and, if applicable, buy-back costs. The environmental objectives are reflected in two Key Performance Indicators. First, the reuse rate and recycling rate are calculated as the fraction (percentage) of the return flow allocated to these options and added up as the total recovery rate. Second, the impact on climate change is modeled by the carbon footprint delta. By this, we mean the difference between the footprint of the newly built products and the various recovered products/materials. As reuse avoids repeating some of the forward supply chain processes, in particular mining and basic production, the footprint of reuse can be up to 80% lower than the new build. For material recycling, the delta is only comparing virgin material with recycled materials, and we assume that new products are built from these secondary materials. Therefore, the delta is significantly smaller for recycling. The feasibility of recovery options is technically determined by the quality of the return, which is modeled at three levels, and the same goes for market segments. Results are calculated per product (type), so the total volume is not relevant for the model. For the purpose of this analysis, Booleans are set manually, as explained later.
After comparing the recovery strategies on a holistic level, we drill down into the results to gain more insights. For example, differences in the margins per market segment, per recovery option, or per inbound quality level are helpful to refine the recovery strategy. Finally, the best recovery strategies are subjected to sensitivity analysis to see how robust they are and to see which parameters are crucial to success. For example, sensitivity analysis shows varying critical parameters from the dataset, e.g., sales price ranging from −30% to +30%. Recovery strategies are explained later; but first, the mathematical formulation is outlined. The energy mix is also varied as we have different CO2 coefficients per continent.
Index sets:
P = product types p (desktop, laptop, monitor, and printer);
Q = inbound quality level q (poor, average, and good);
S = market segments (premium, medium, and low);
R = recovery options (reuse A, repair B, parts reuse C, and recycle D);
T = recovery rates to meet targets imposed by EPR regulations (t1 = sum of reuse options A, B, and C, and t2 = recycling D).
The index sets represent all the relevant dimensions of the optimization problem, in line with the case descriptions. Both parameters and variables need to be defined in line with this. The parameters represent the data values per product for which the model needs to calculate the (outcomes of) 15 recovery strategies. This means that (return) volumes convert into fractions F.
Parameters:
Carbonnew, p—CO2 kg eq per new product p produced;
Cpqr—CO2 kg eq per product p collected in quality q and dispositioned to option r;
Fpqr—Fraction of returned product p with quality level q feasible for recovery options r 0 ≤ Fpqr ≤ 1;
BUYpsq—Buy-back price of product type p in segment s in quality q;
SELLpsr—Sales price of product type p in segment s for recovery option r;
COSTpqr—Cost of collecting and recovering product type p in quality q for recovery option r.
Decision variables are optimized for a single product per product type and reflect the decision to apply a certain recovery option or not. In the objective function, we calculate the profit, footprint, and reuse + recycling (recovery) rate per product.
Xpr—Boolean indicating if product type p is allocated to recovery option r (multiple options possible) ∀p.
Margin ∑q ∑s∑r Fpqr × Xpr * (SELLpsr − BUYpsq − COSTpqr)
Recovery quota t1 = ∑q ∑s∑r=A,B,C) Fpqr × Xpr and t2 = ∑q ∑s∑r=D Fpqr × Xpr
Subject to (formal model)
As mentioned, the Booleans are set manually to see the impact of individual as well as combined options.
Table 3 shows fifteen possible recovery strategies where one, two, three or four options are applied out of the set A, B, C, D. For example, strategy #1 only applies recycling option D, strategy #15 applies all options.
Fixing the Booleans per strategy means, in the mathematical sense, that this is not an optimization model, but we do make sure that all return products are recovered and no single recovery option can be applied to more than 100% of the return flow by constraint (2) and (3), respectively.
4. Results
In
Section 4.1, we present the best recovery strategies out of 15, with results expressed in CO
2 eq reduced (delta) per product, percentage of reuse and recycling (combined recovery), and a normalized currency. Because there is uncertainty, both in the data obtained and due to volatility in the market, we have performed an extensive sensitivity analysis presented in
Section 4.2 (scenarios).
Please note that p.p. is used throughout the following Section to mean ‘per product’.
4.1. Best Recovery Strategies and Cross-Sections
4.1.1. Monitors
For monitors, there are three recovery strategies considered good or even optimal, as shown in
Table 4. However, there is no single combination of recovery options that has the best value across all criteria. Strategy #14 has the best environmental results but a negative margin (loss) due to repair costs. Strategy #5 has the highest margin but a relatively low delta in carbon emissions because no recycling (D) is applied. Moreover, it does not meet the recovery targets set by the EU. The most feasible strategy appears to be #8, with a small economic benefit, a 100% recovery rate, and a 44% carbon reduction. However, it is difficult to fully align economic and environmental objectives for monitors.
Drilling down into the results for different market segments provides new insights into the viability of the recovery options. We start with the margin p.p. for premium, medium, and lower segment products in
Table 5.
Clearly, premium products are highly profitable for reuse, medium segments need well-managed pricing (as demonstrated in the scenario modeling set out in the Results Section), and low segments are not economically viable for reuse.
Table 5 shows that for medium-quality returns (level 2), recycling is the most economically viable option (D). Reuse is not profitable due to high recovery costs, except for parts reuse for premium segments products.
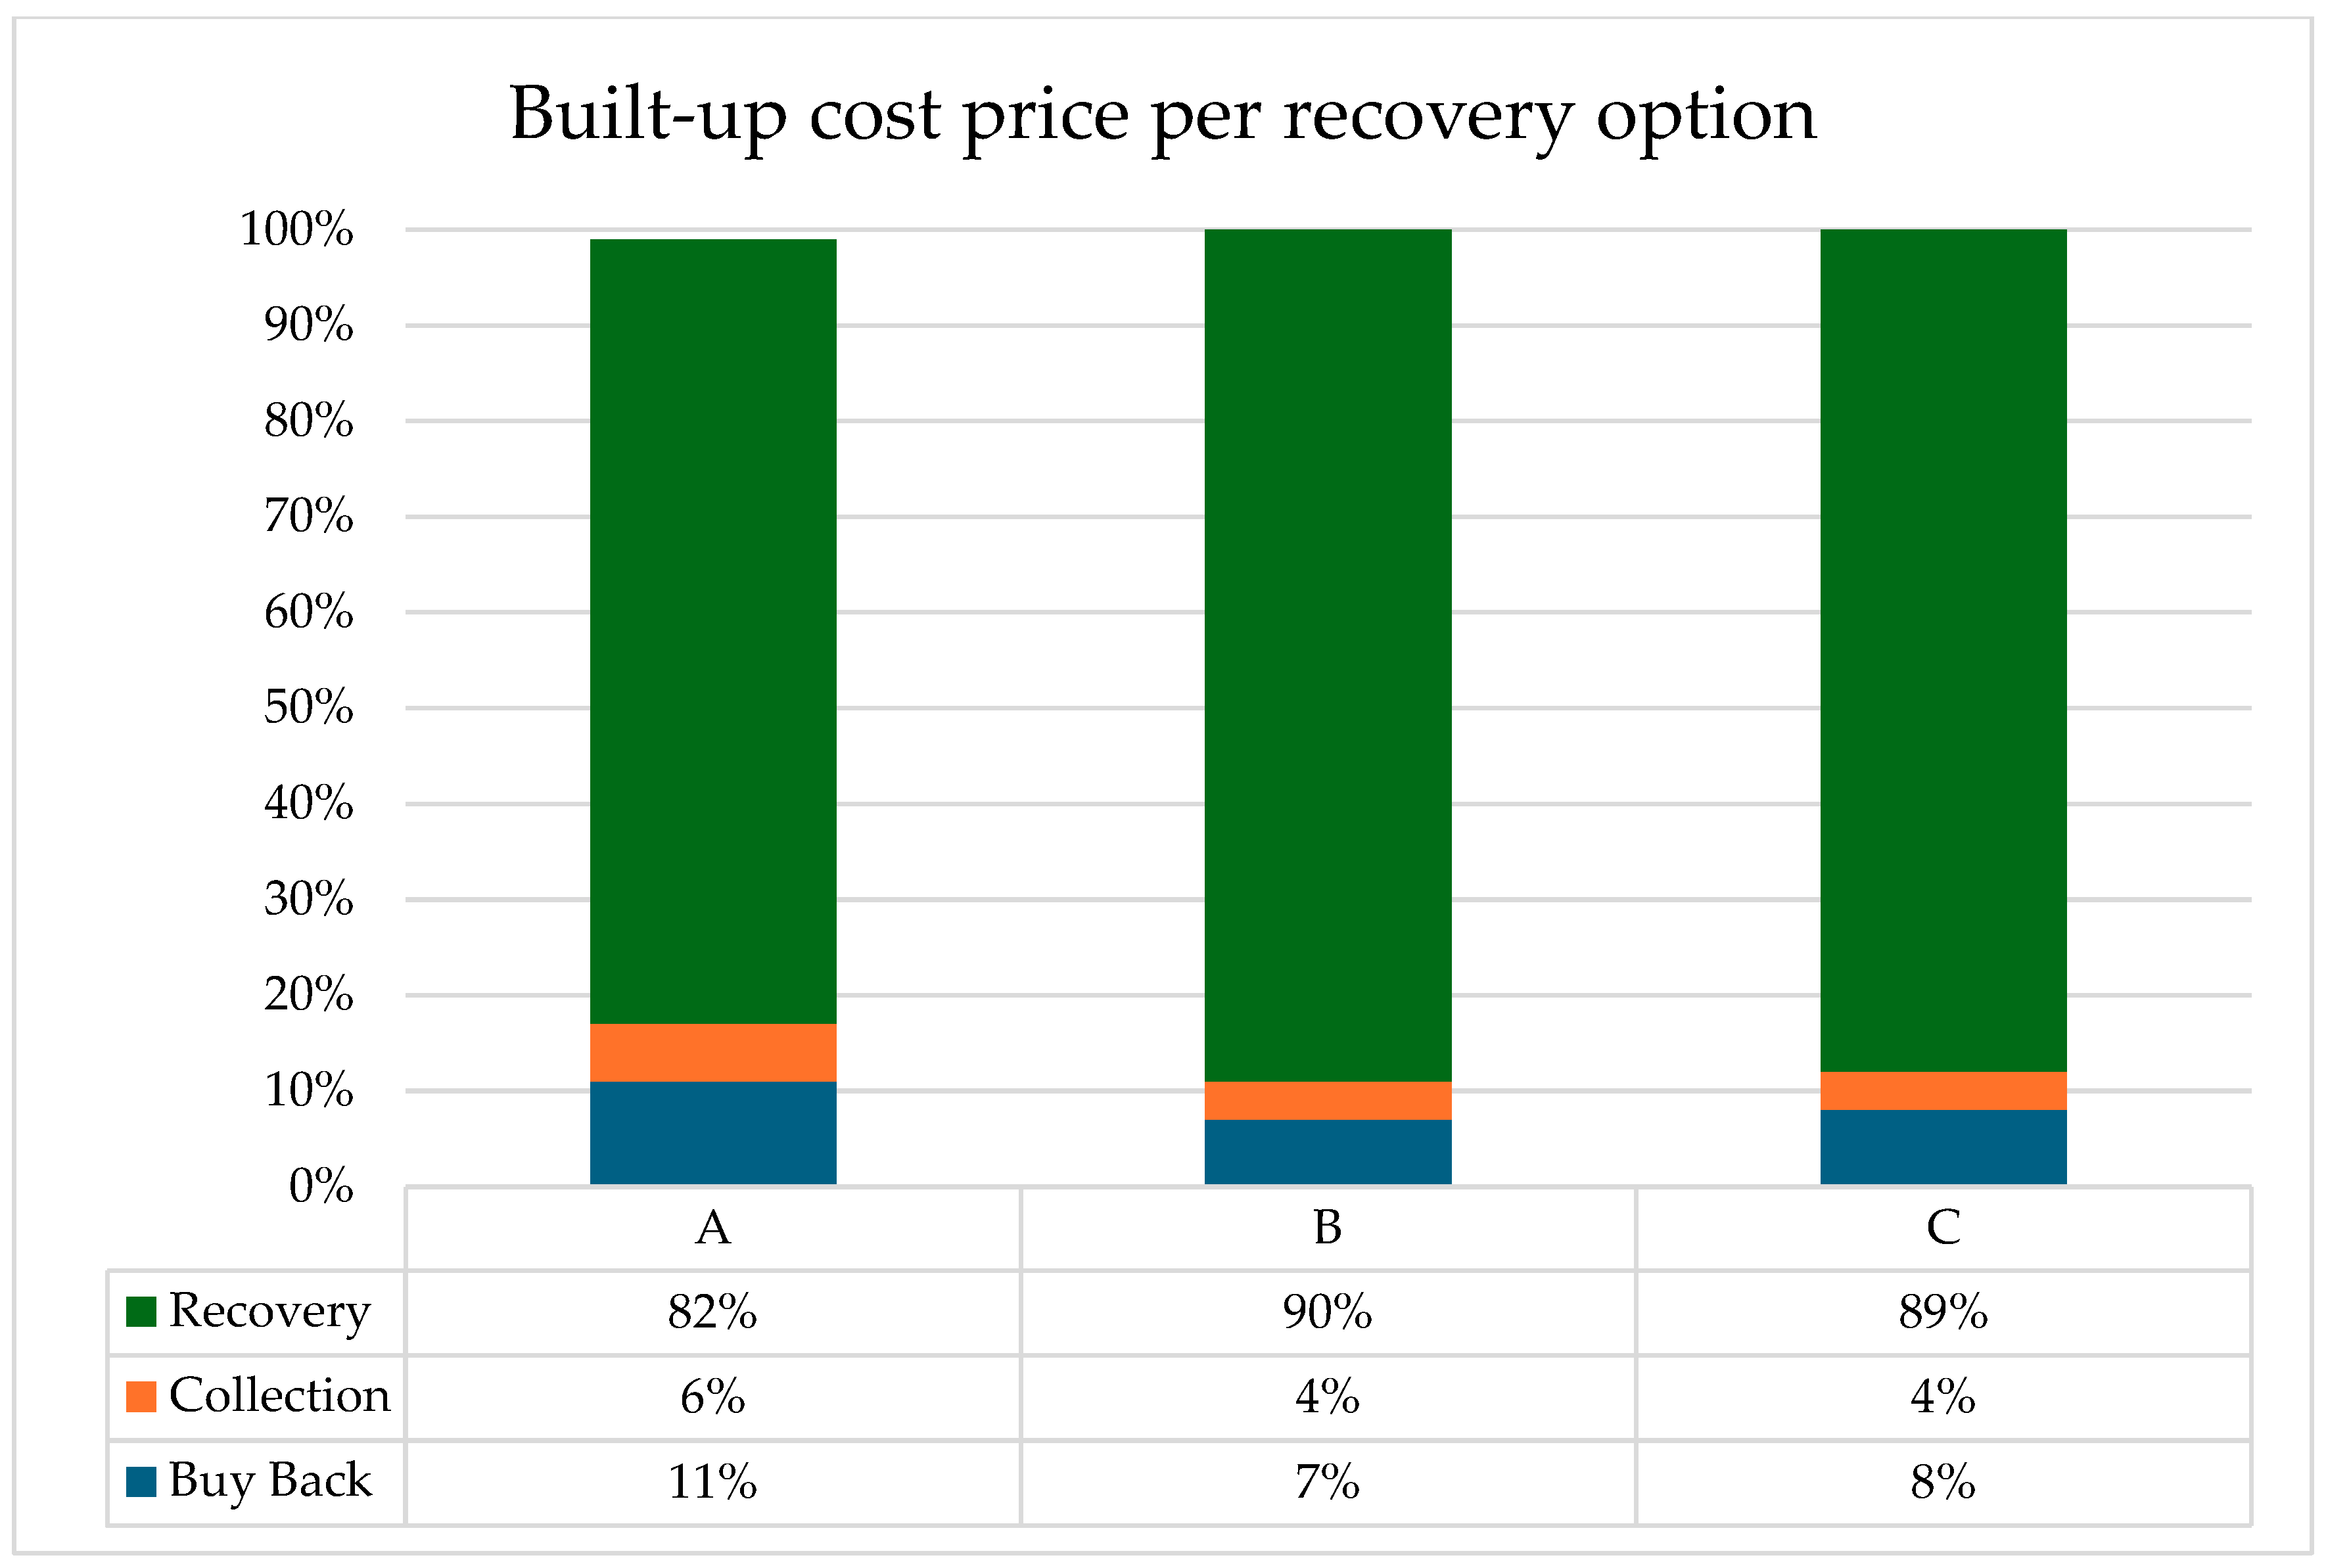
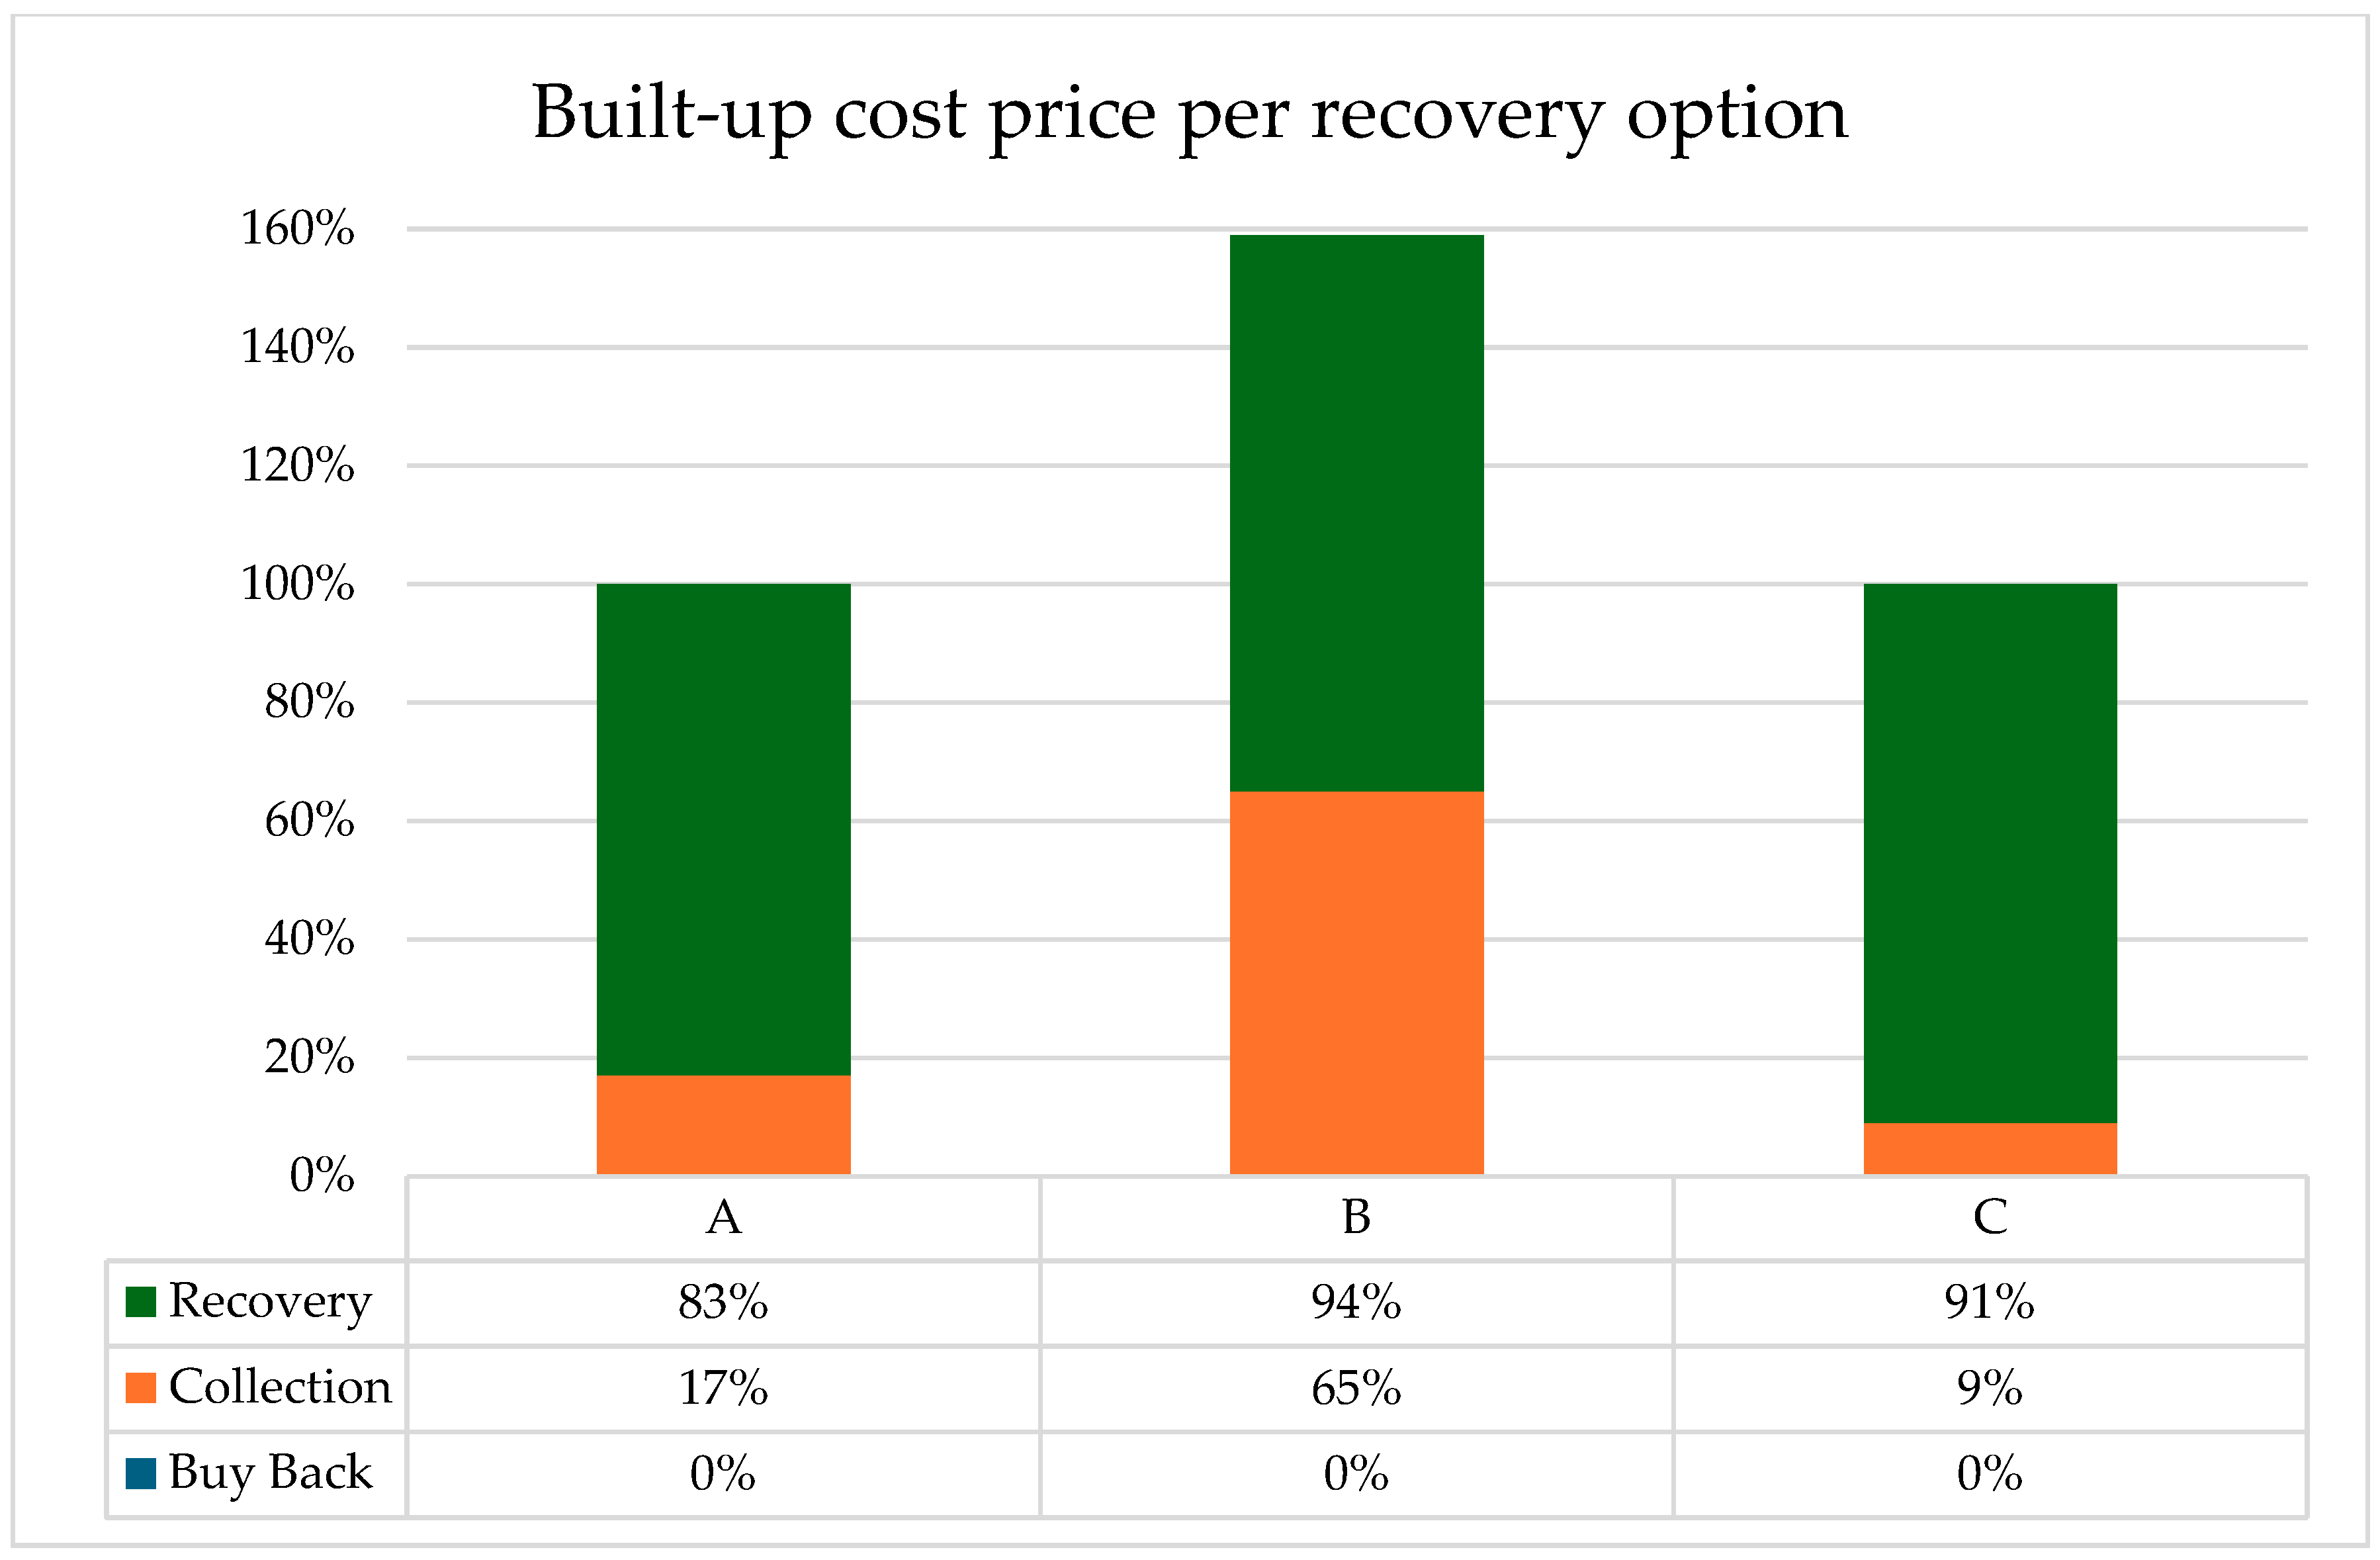
Section 4.2 of this article presents scenarios to show how a lower cost of recovery could make reuse profitable in some cases where it is currently not viable. To this end, we present the cost structure in
Figure 3 for reuse options A (quality level 1), B, and C (both quality level 2). Even in the most viable case (A), recovery costs are still relatively high.
Lowering recovery cost is potentially a profitable solution yet may be difficult to implement in practice.
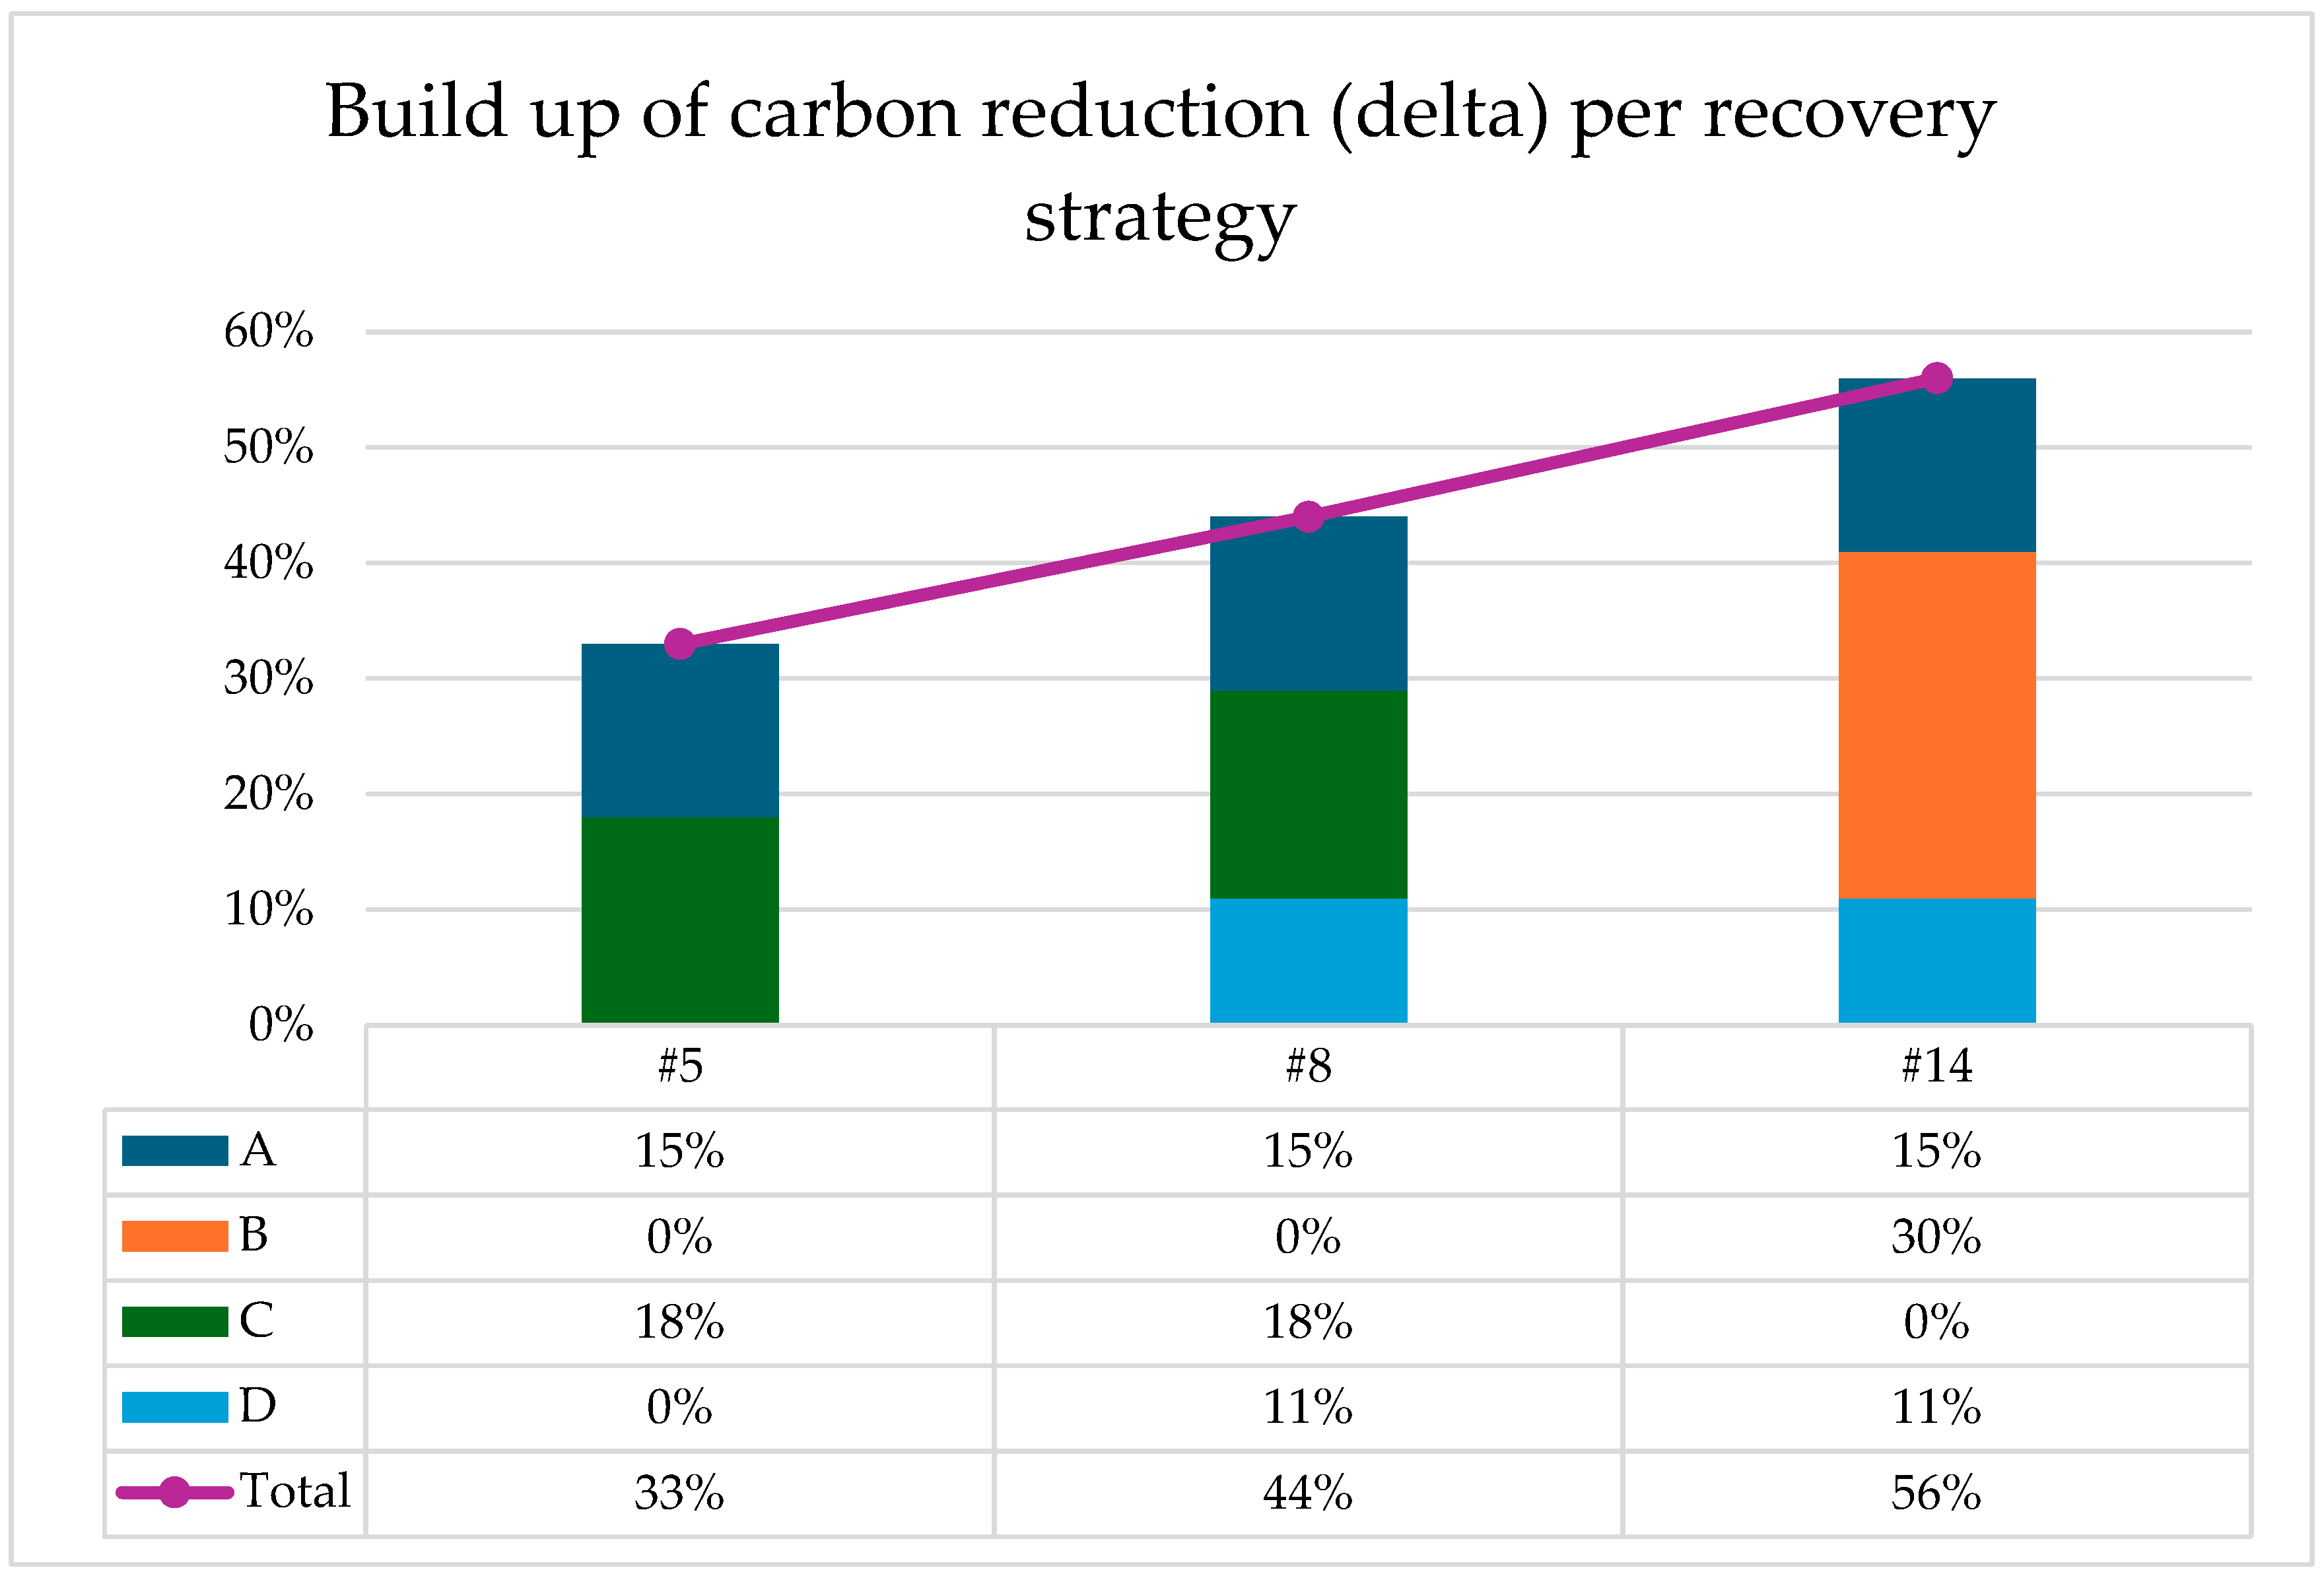
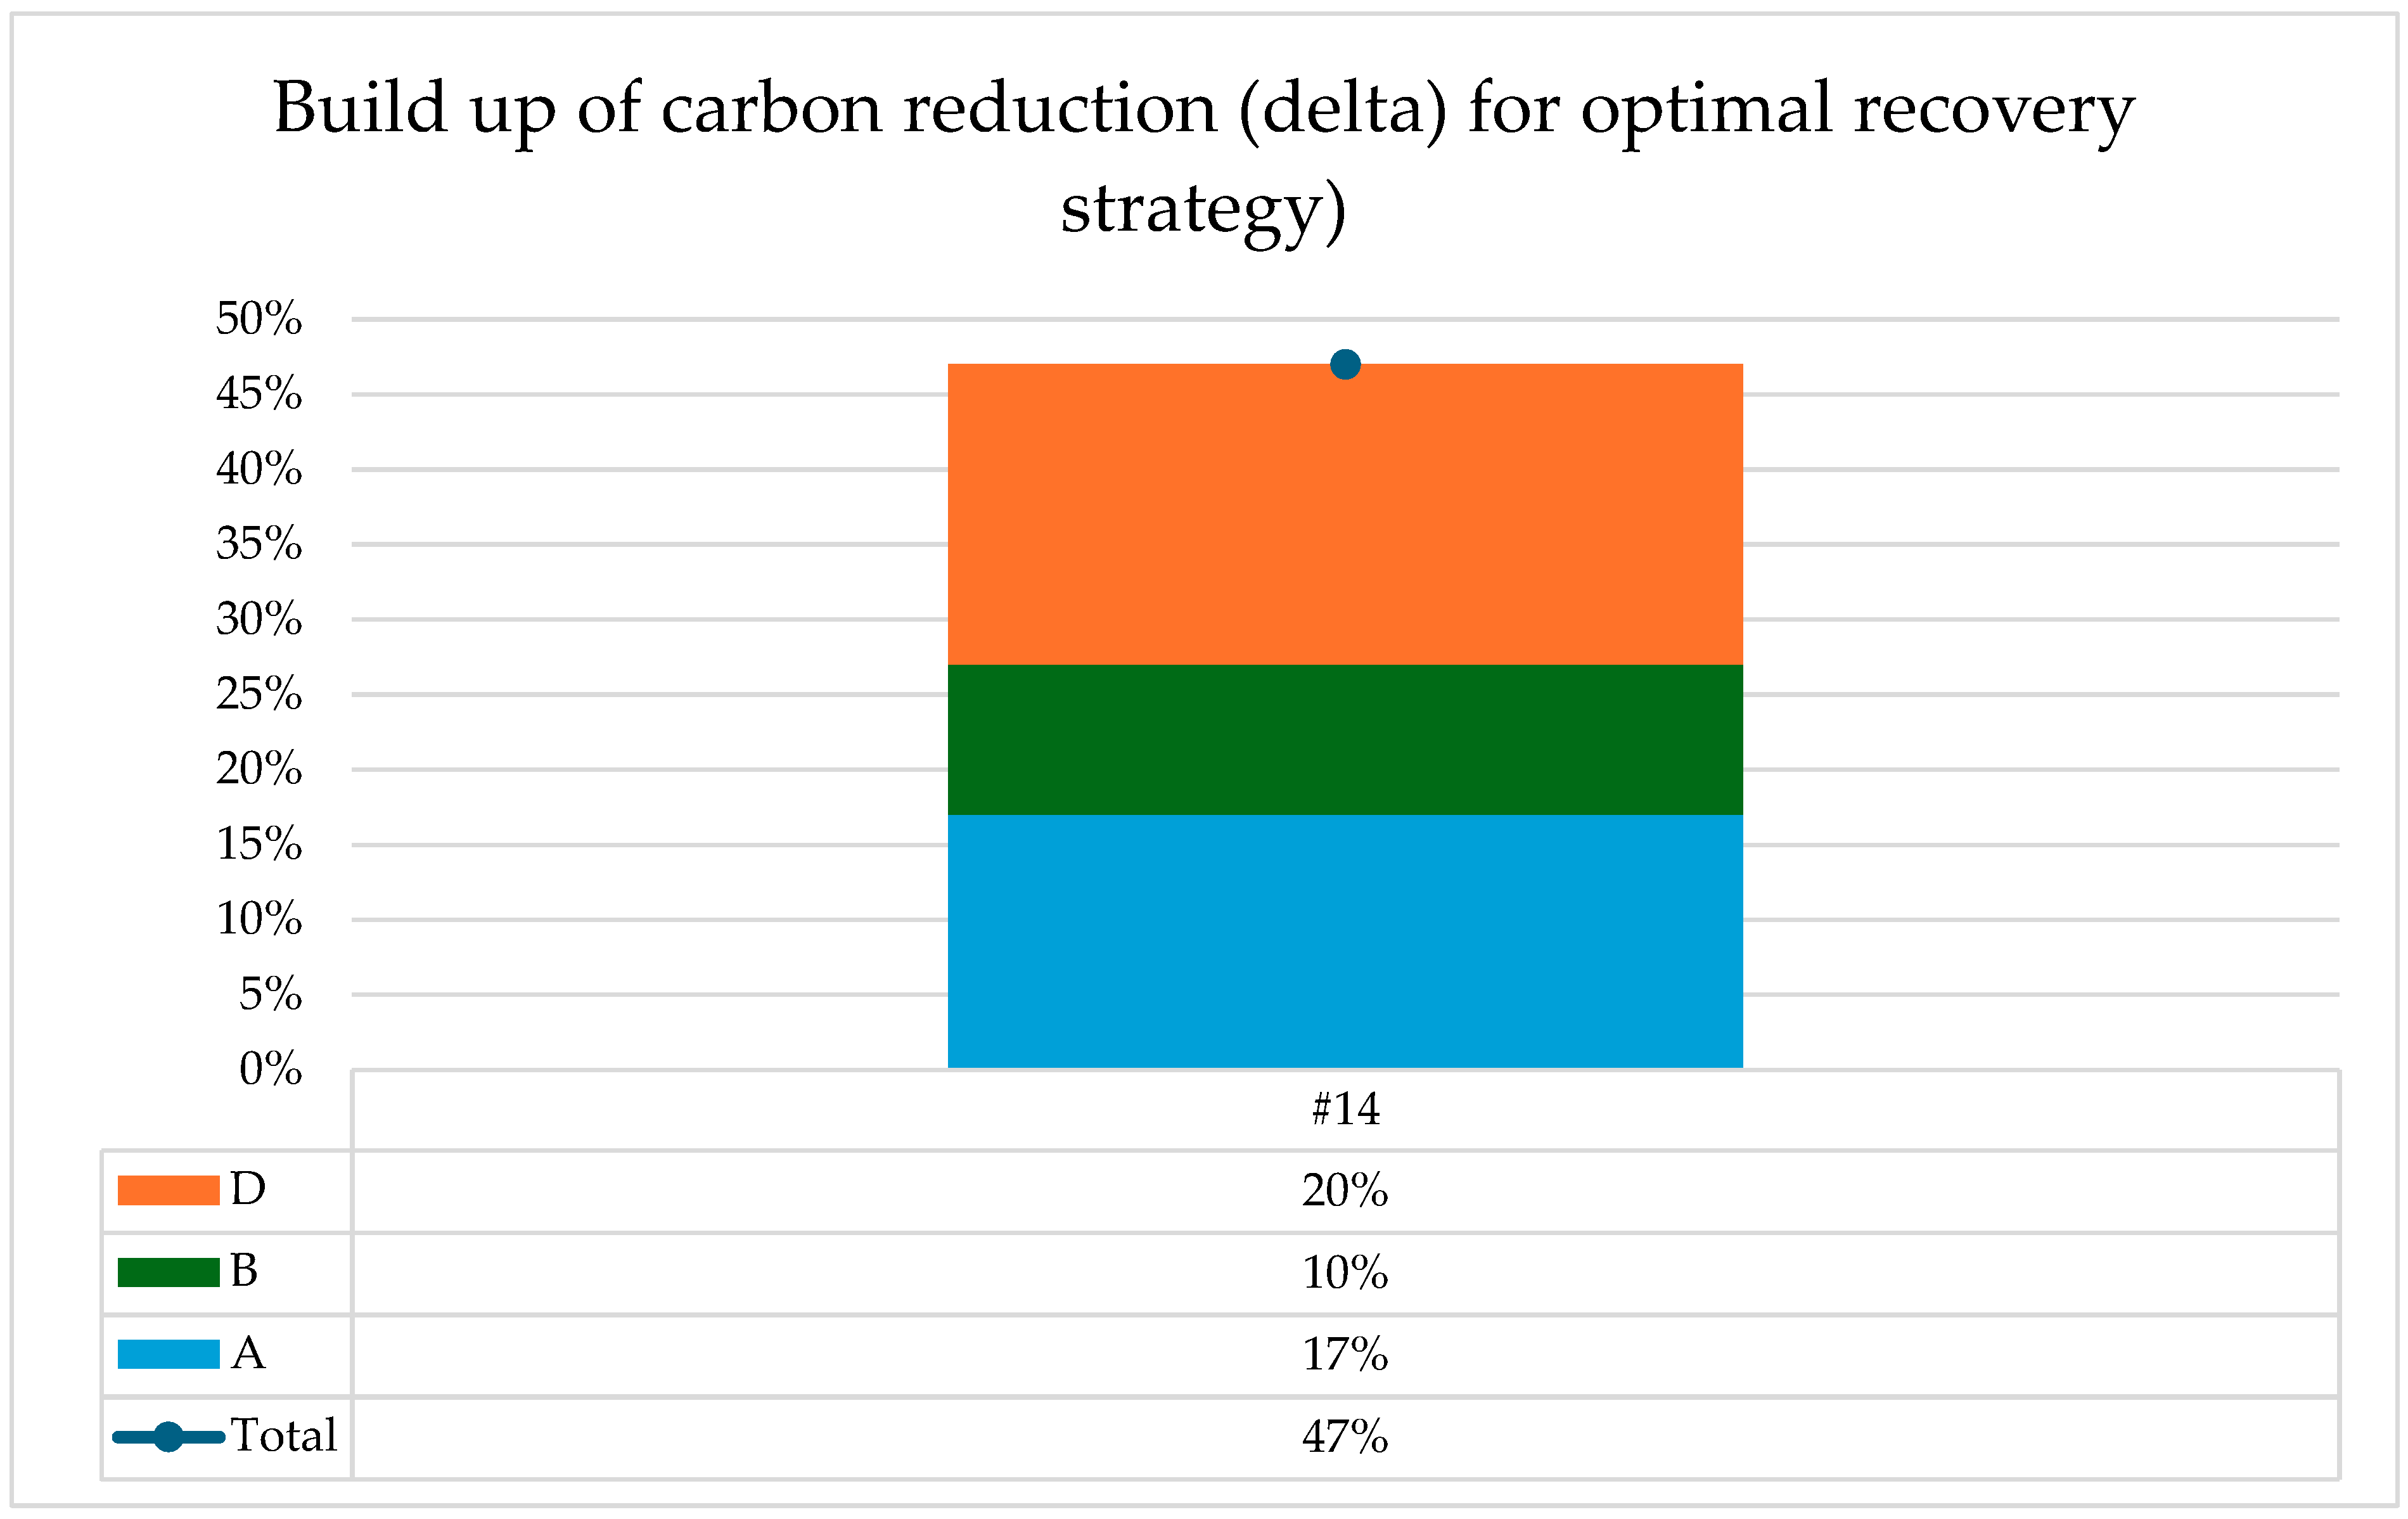
Section 4.2 presents scenarios in which volumes for the different recovery options are varied, while 4.3 considers the energy implications related to production and recovery within different locations. Reuse (A) has a relatively low volume share, yet it provides a significant part of the half reduction in carbon emissions. Reuse (A) and repair (B) together in strategy #14 provide 44% of the total 56% in carbon delta. So, it seems logical to try to increase the reuse volumes, but this is constrained by return quality and the viability of reuse at quality level 2.
Figure 4 shows how the carbon reduction for different recovery strategies compared to the new one is built up.
4.1.2. Printers
For printers, there is more synergy between economic and environmental objectives, as
Table 6 shows. Recovery strategy #7 has by far the highest margin and a carbon reduction that comes close to #14 and #15. There is less repair but more recycling. Reuse is limited to A, as options B and C are not profitable.
A drill down per market segment in
Table 7 shows that reuse A, the most advanced form of reuse, should be limited to premium and perhaps medium segments. Lower segments as well as other reuse options are not viable because the sales price is zero (read: no markets), and only costs are incurred. This goes for both return quality level 1 and level 2. Although the premium segments are profitable, the margins are still relatively low. In the scenarios, we therefore calculate the impact of the pricing of reuse option A, combined with increasing its volumes of return quality level 1. The results show that this is impractical for return quality level 2, as it is not viable.
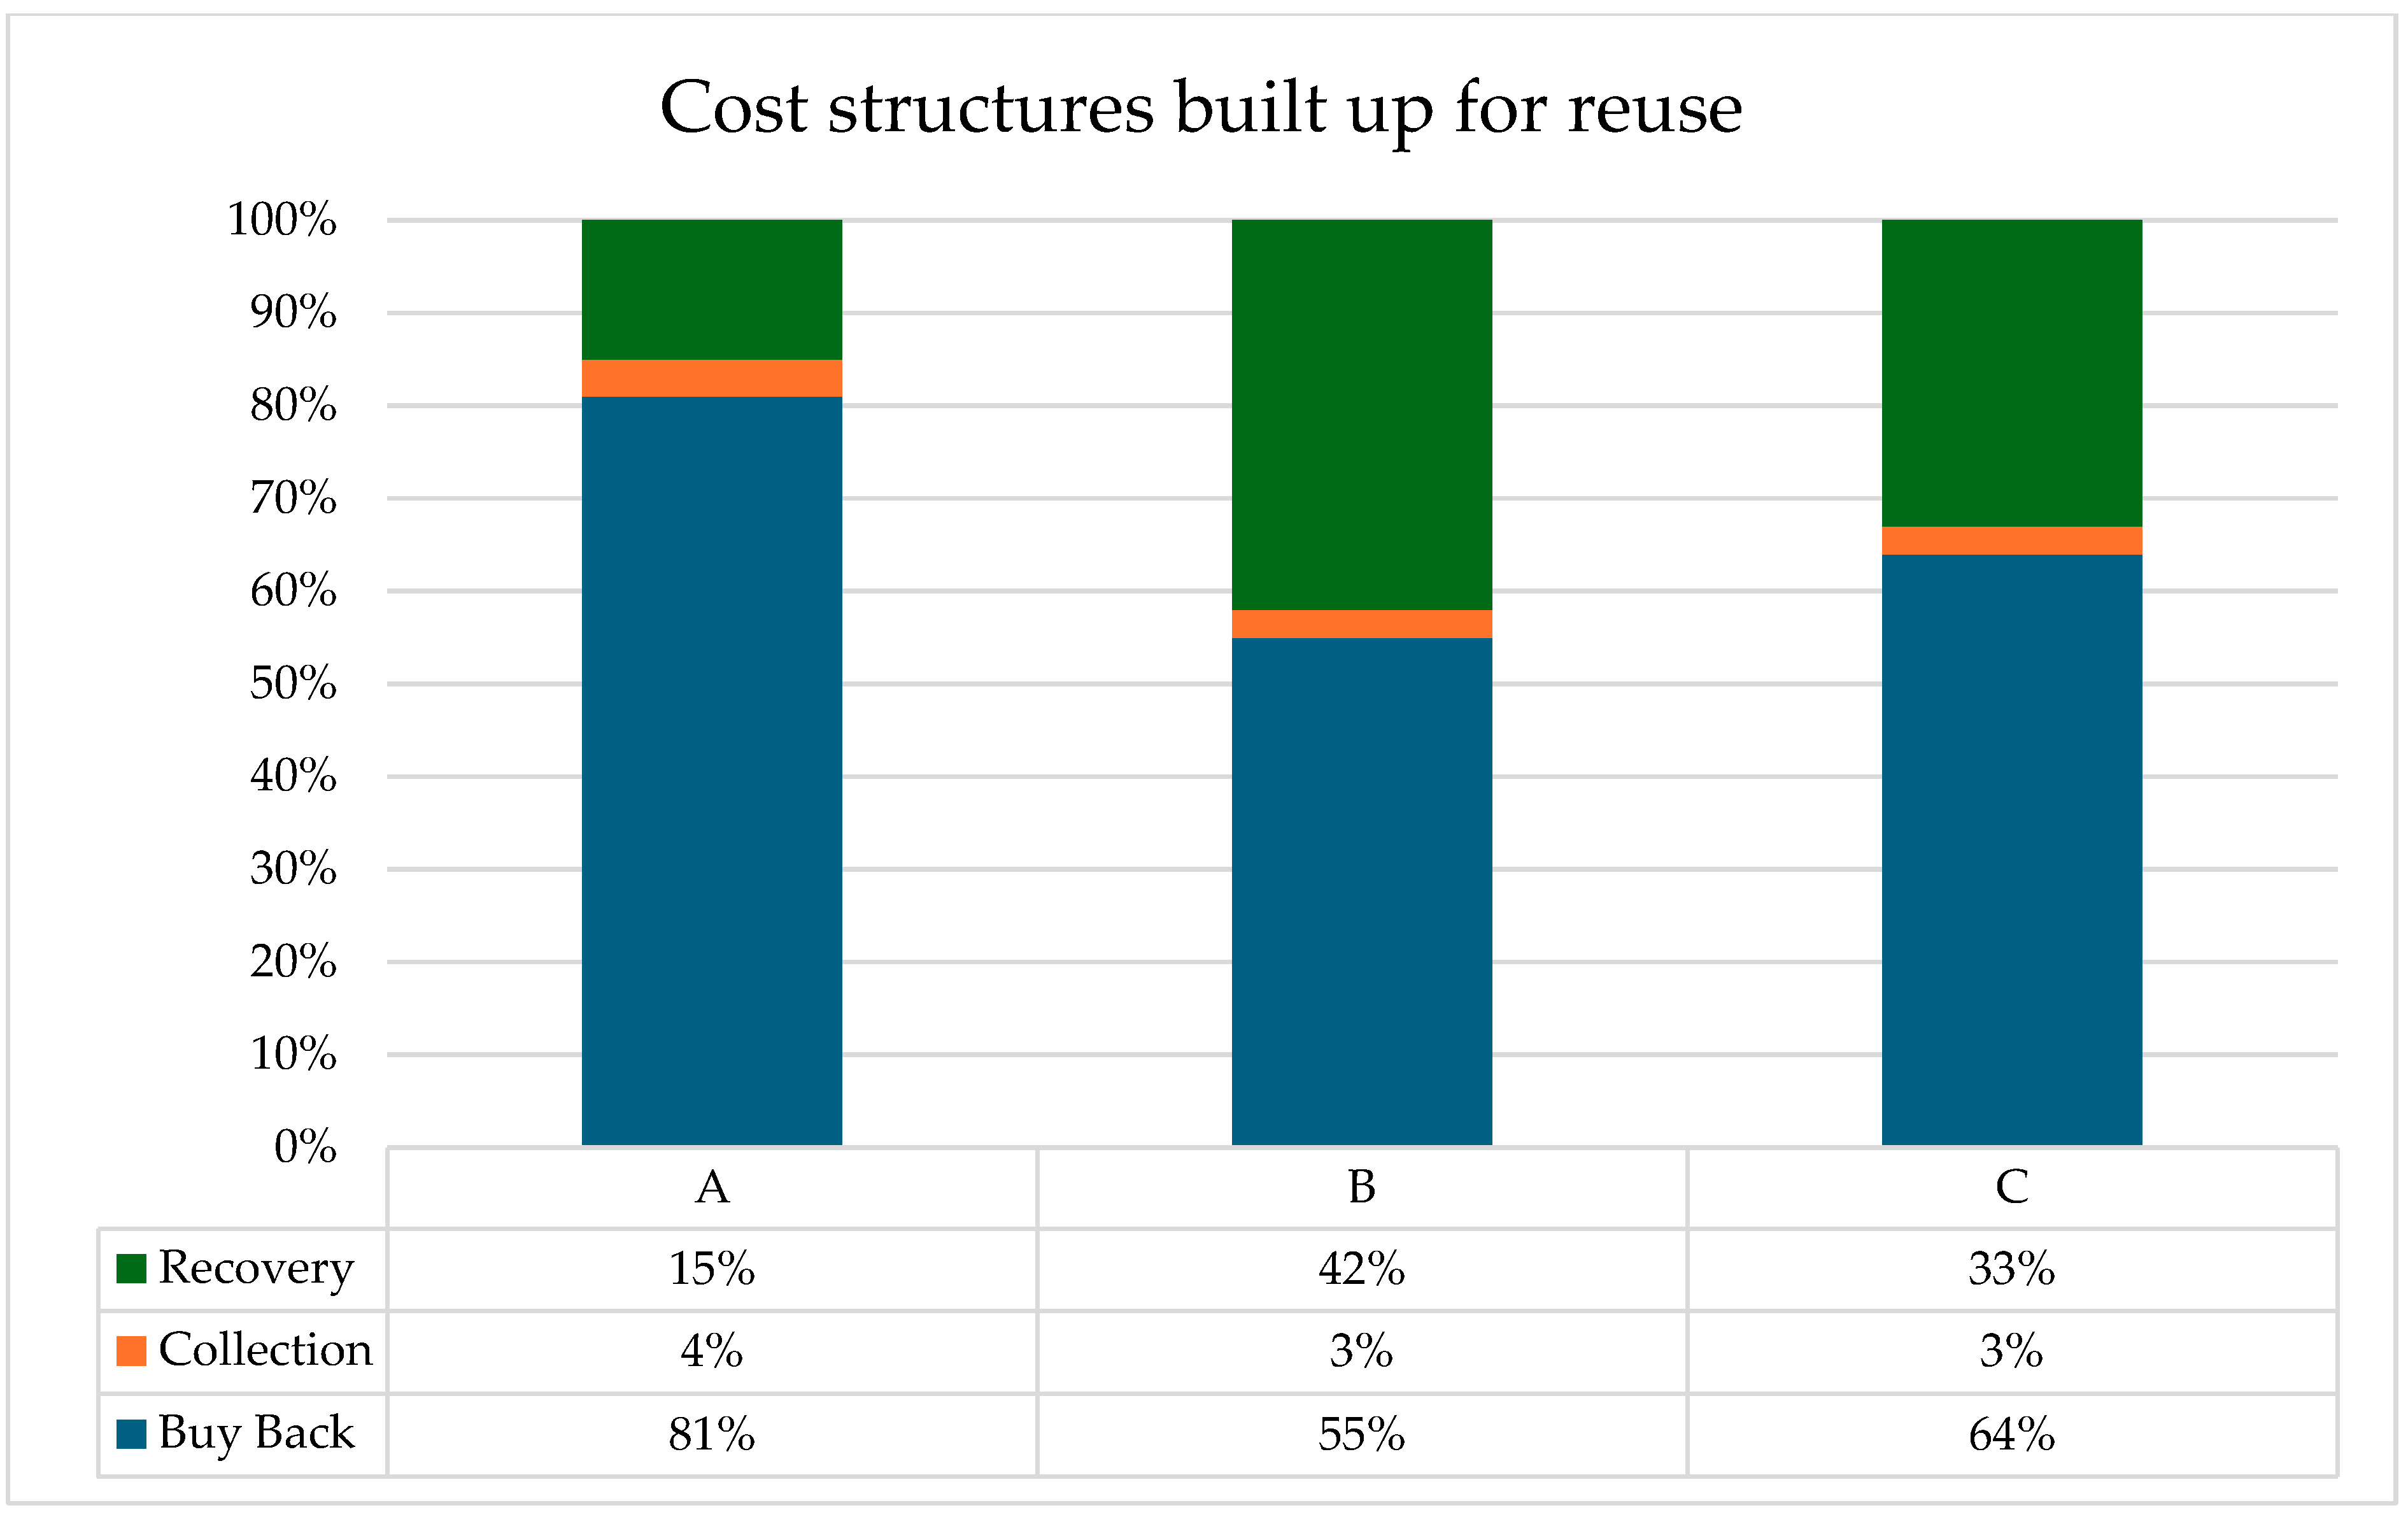
If we look at the cost build up of reuse options A (quality level 1), B, and C (quality level 2), the recovery cost proves to be the major cost component; see
Figure 5. So again, it is advisable to see if recovery costs can be lowered for reuse options, yet this may be hard to realize in practice with relatively low volumes.
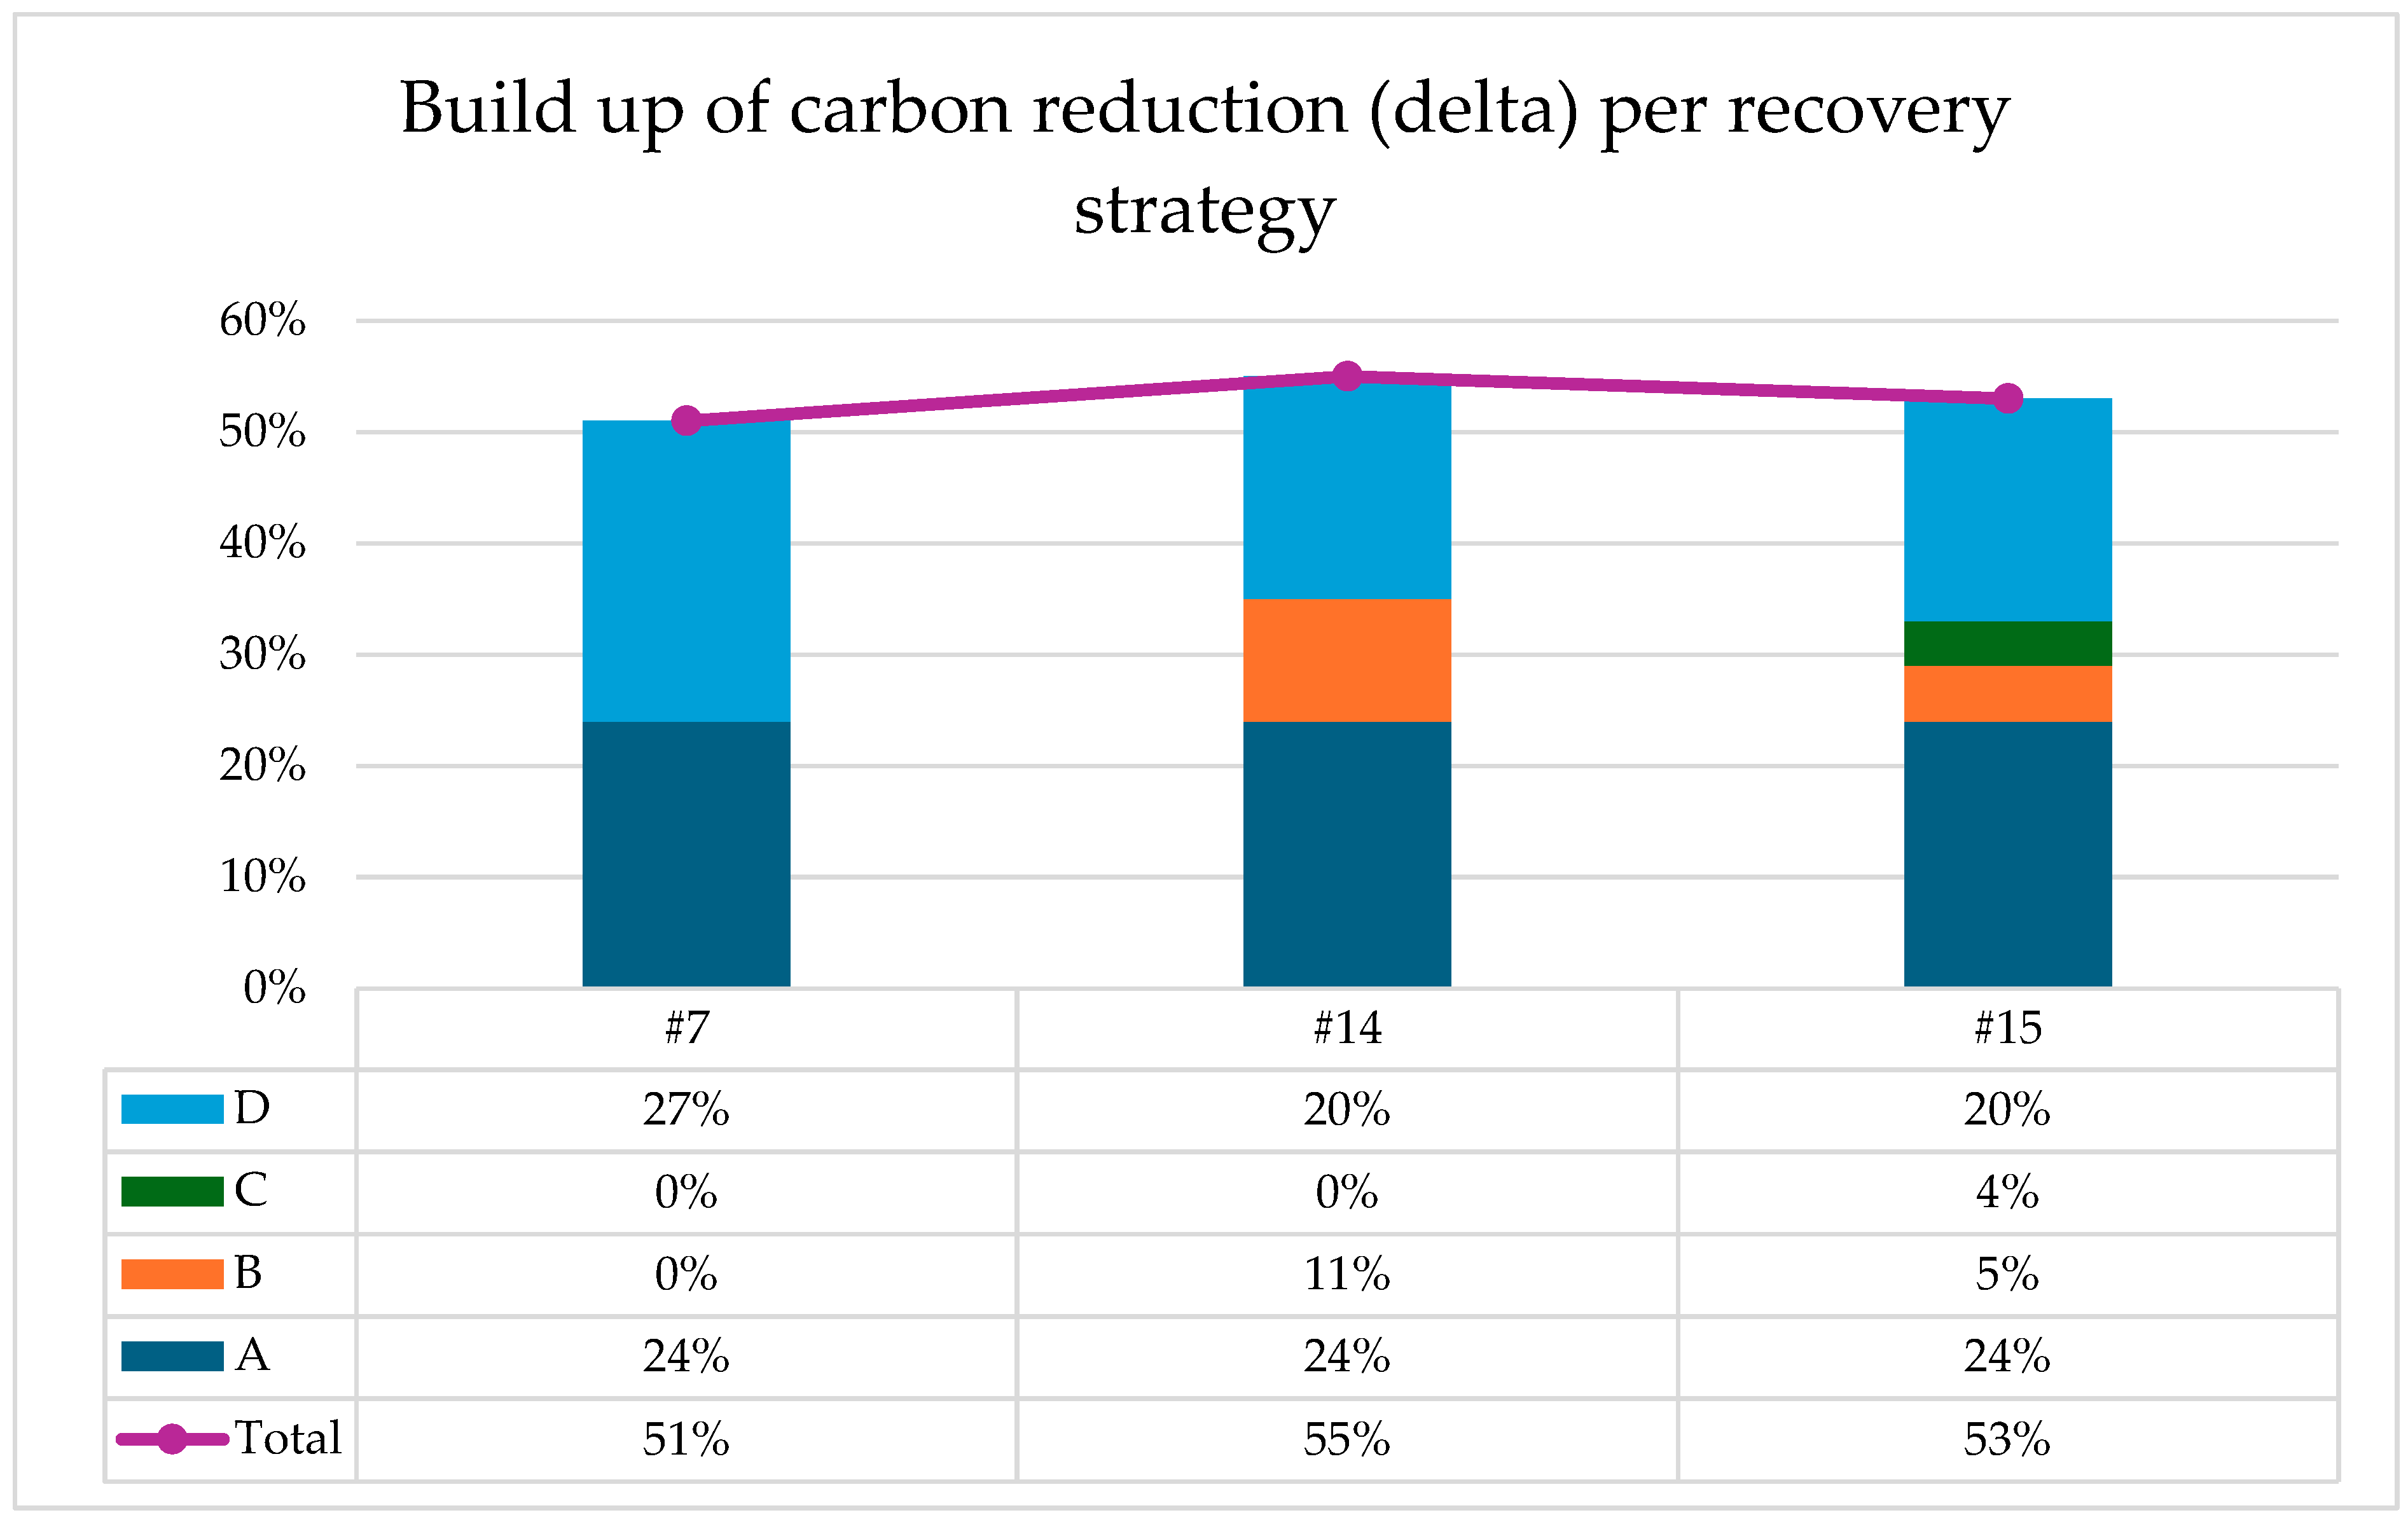
Similarly to monitors, reuse A has a relatively low volume share for printers, but still, it provides half the reduction in the carbon emissions in
Figure 6. Options A and B together in strategy #14 provide 35% of the total 55%, and in #15 A, B, and C, provide 33% of the total 53%. Therefore, it seems logical again to try to increase the reuse volumes in the scenarios later on in
Section 4.2. We also study the impact of the energy mix in
Section 4.3.
4.1.3. Laptops
For the laptop, there is much synergy between economic and environmental objectives, as
Table 8 shows. This goes hand in hand with a relatively high reuse rate. Recovery strategy #14 is best, but #15 is almost equally as good. Recovery quotas are high as well as carbon reductions.
A drill down per segment in
Table 9 shows that reuse option A is always profitable, even for low market segments, which is quite exceptional. Options B and C are viable for premium and medium segments; however, prices need to be managed carefully, so we will study an additional scenario in
Section 4.2.
Drilling down for return quality level 2, we can see below that this is not viable for any recovery option. This indicates that these waste products should be recycled.
The cost build up shows the importance of buy-back cost, contrary to the first two products, see
Figure 7. Still, recovery costs are significant, so both cost components are subjected to further scenarios in
Section 4.2.
And again, finally, the carbon reduction. For the most part, this is due to the reuse options. Also here, we will investigate scenarios where reuse is increased in
Figure 8. Again, for the most part, this is due to the reuse options. Also here, we will investigate scenarios where reuse is increased and the energy mix is varied.
4.1.4. Desktops
For desktops, clearly the best recovery strategy is #14, both economically and environmentally; see
Table 10. The level of reuse is surprisingly low, due to a limited volume of return quality levels 1 and 2. So one scenario to be studied in
Section 4.2. is increasing return level quality, thereby enabling reuse option A.
Drill down in
Table 11 shows that both premium and medium products can be reused by options A, B, and C, although for return quality level 2, options B and C have low margins. Therefore, we study scenarios with varying sales prices. It should be noted that reuse markets for desktops could be niche with limited volume, but data were not available to validate that assumption.
A drill down on return quality level 2 shows that reuse A for premium products is still quite viable. All the other options are not viable due to too high recovery costs. Again, it is worthwhile to explore (niche) markets for this kind of high-level reuse.
The build up of the cost structure in
Figure 9 shows that buy-back prices are the highest cost component, in particular for high-level reuse A. Therefore, we investigate in
Section 4.2. what the impact is of varying buy-back prices.
Recovery strategy #14 results in a reasonable 47% reduction in the carbon footprint; see
Figure 10. However, as the amount of reuse is relatively small, there is room for further improvement. We will analyze scenarios with increased reuse in
Section 4.2. This is parts reuse C, assuming that product reuse markets are limited, and volumes cannot go up without price erosion. Also, the impact of the energy mix will be investigated for this product.
4.2. Scenarios
4.2.1. Monitors
First, we vary the sales price for medium-segment products with return quality level 1, as the margin for this product is relatively low compared to premium products.
Table 12 shows that the pricing risk is low, and only when prices drop by 40% or more does it become critical. Note that columns 3, 4, 5, and 6 represent the total margin depending on actual reuse rates. The impact of the sales volume on the total margin is linear; in the base case, the rate is 22%, but obviously, scaling up is beneficial, which requires more returns in quality level 1.
We do the same exercise for parts reuse C for return quality level 2, premium products in
Table 13. Again, we see that pricing is important but relatively straightforward. The main limitation is the return quality and hence the maximum volume feasible for this reuse option. Also, increasing the volumes of return quality level 2 might be interesting, as level 3 can only be recycled.
In a similar fashion, we can also analyze the impacts of recovery costs, as they represent quite a high percentage of the total cost price in
Table 14. Below, we show the margins per product for reuse options A, B, and C for return quality levels 1, 2, and 3, respectively. For reuse A and C, results will further improve, and reuse option B remains not viable even with a 20% cost cut. The question remains—what is a realistic percentage—as recovery costs are related to material costs but also labor costs.
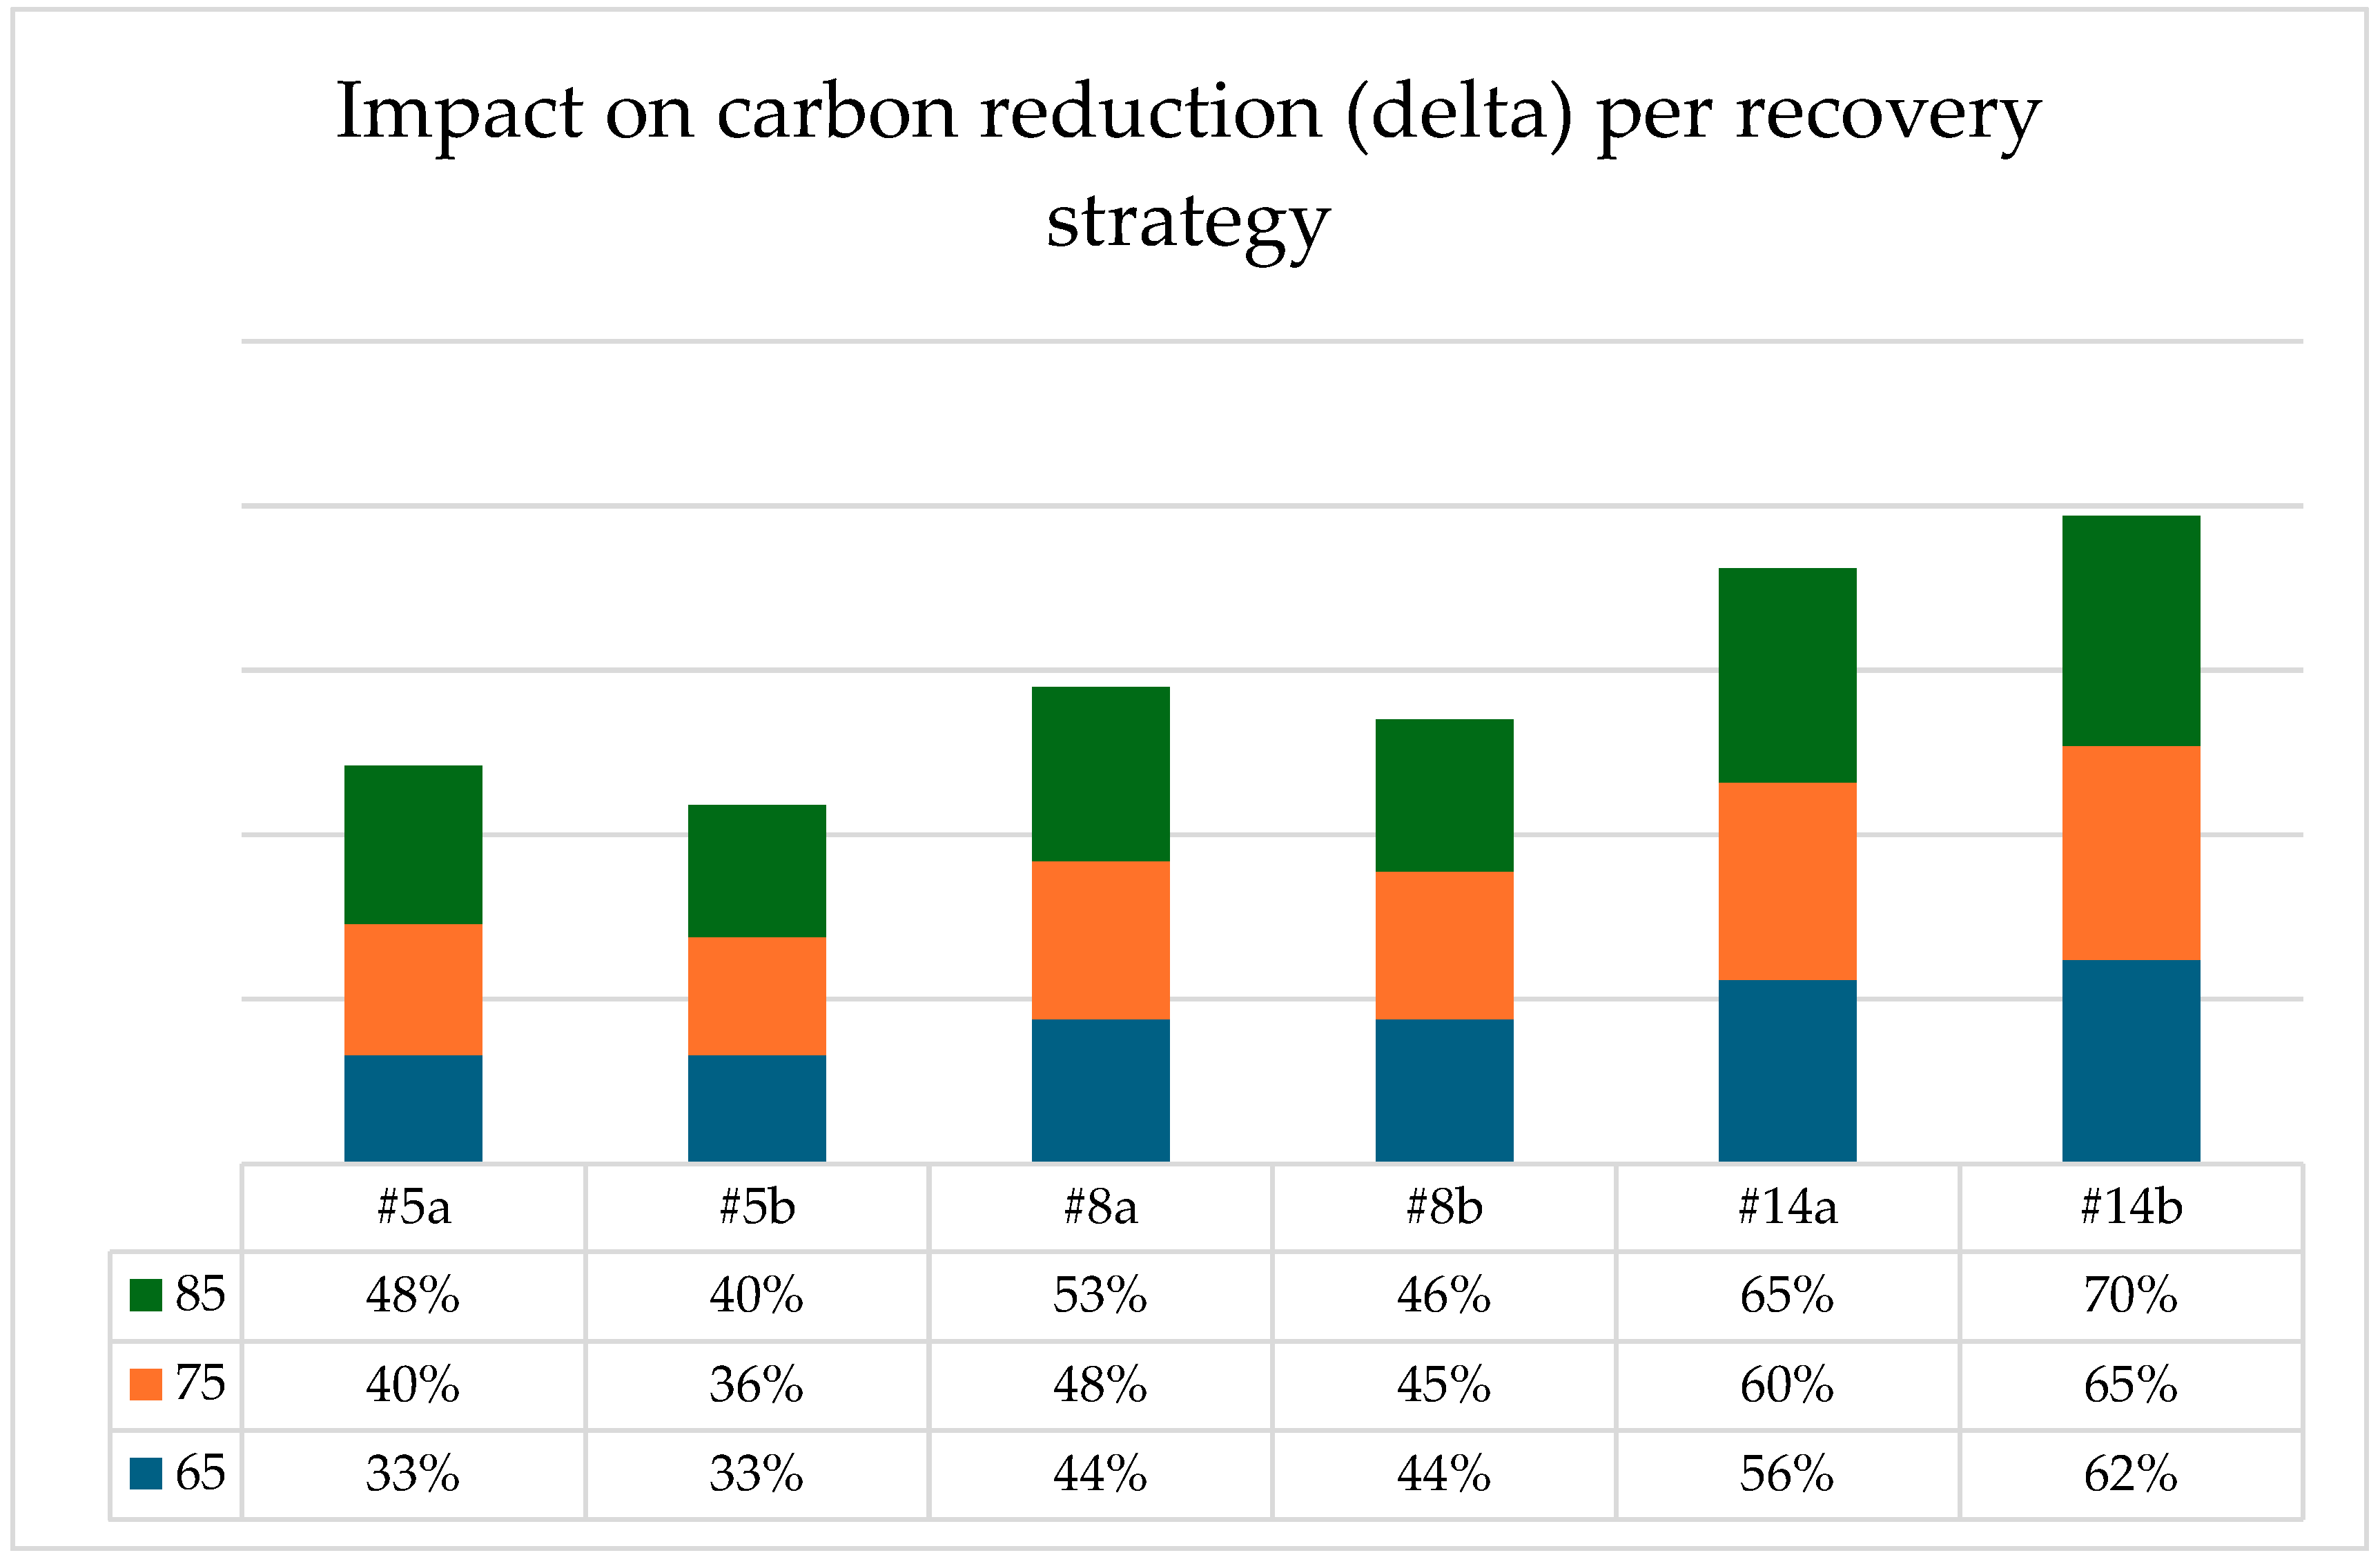
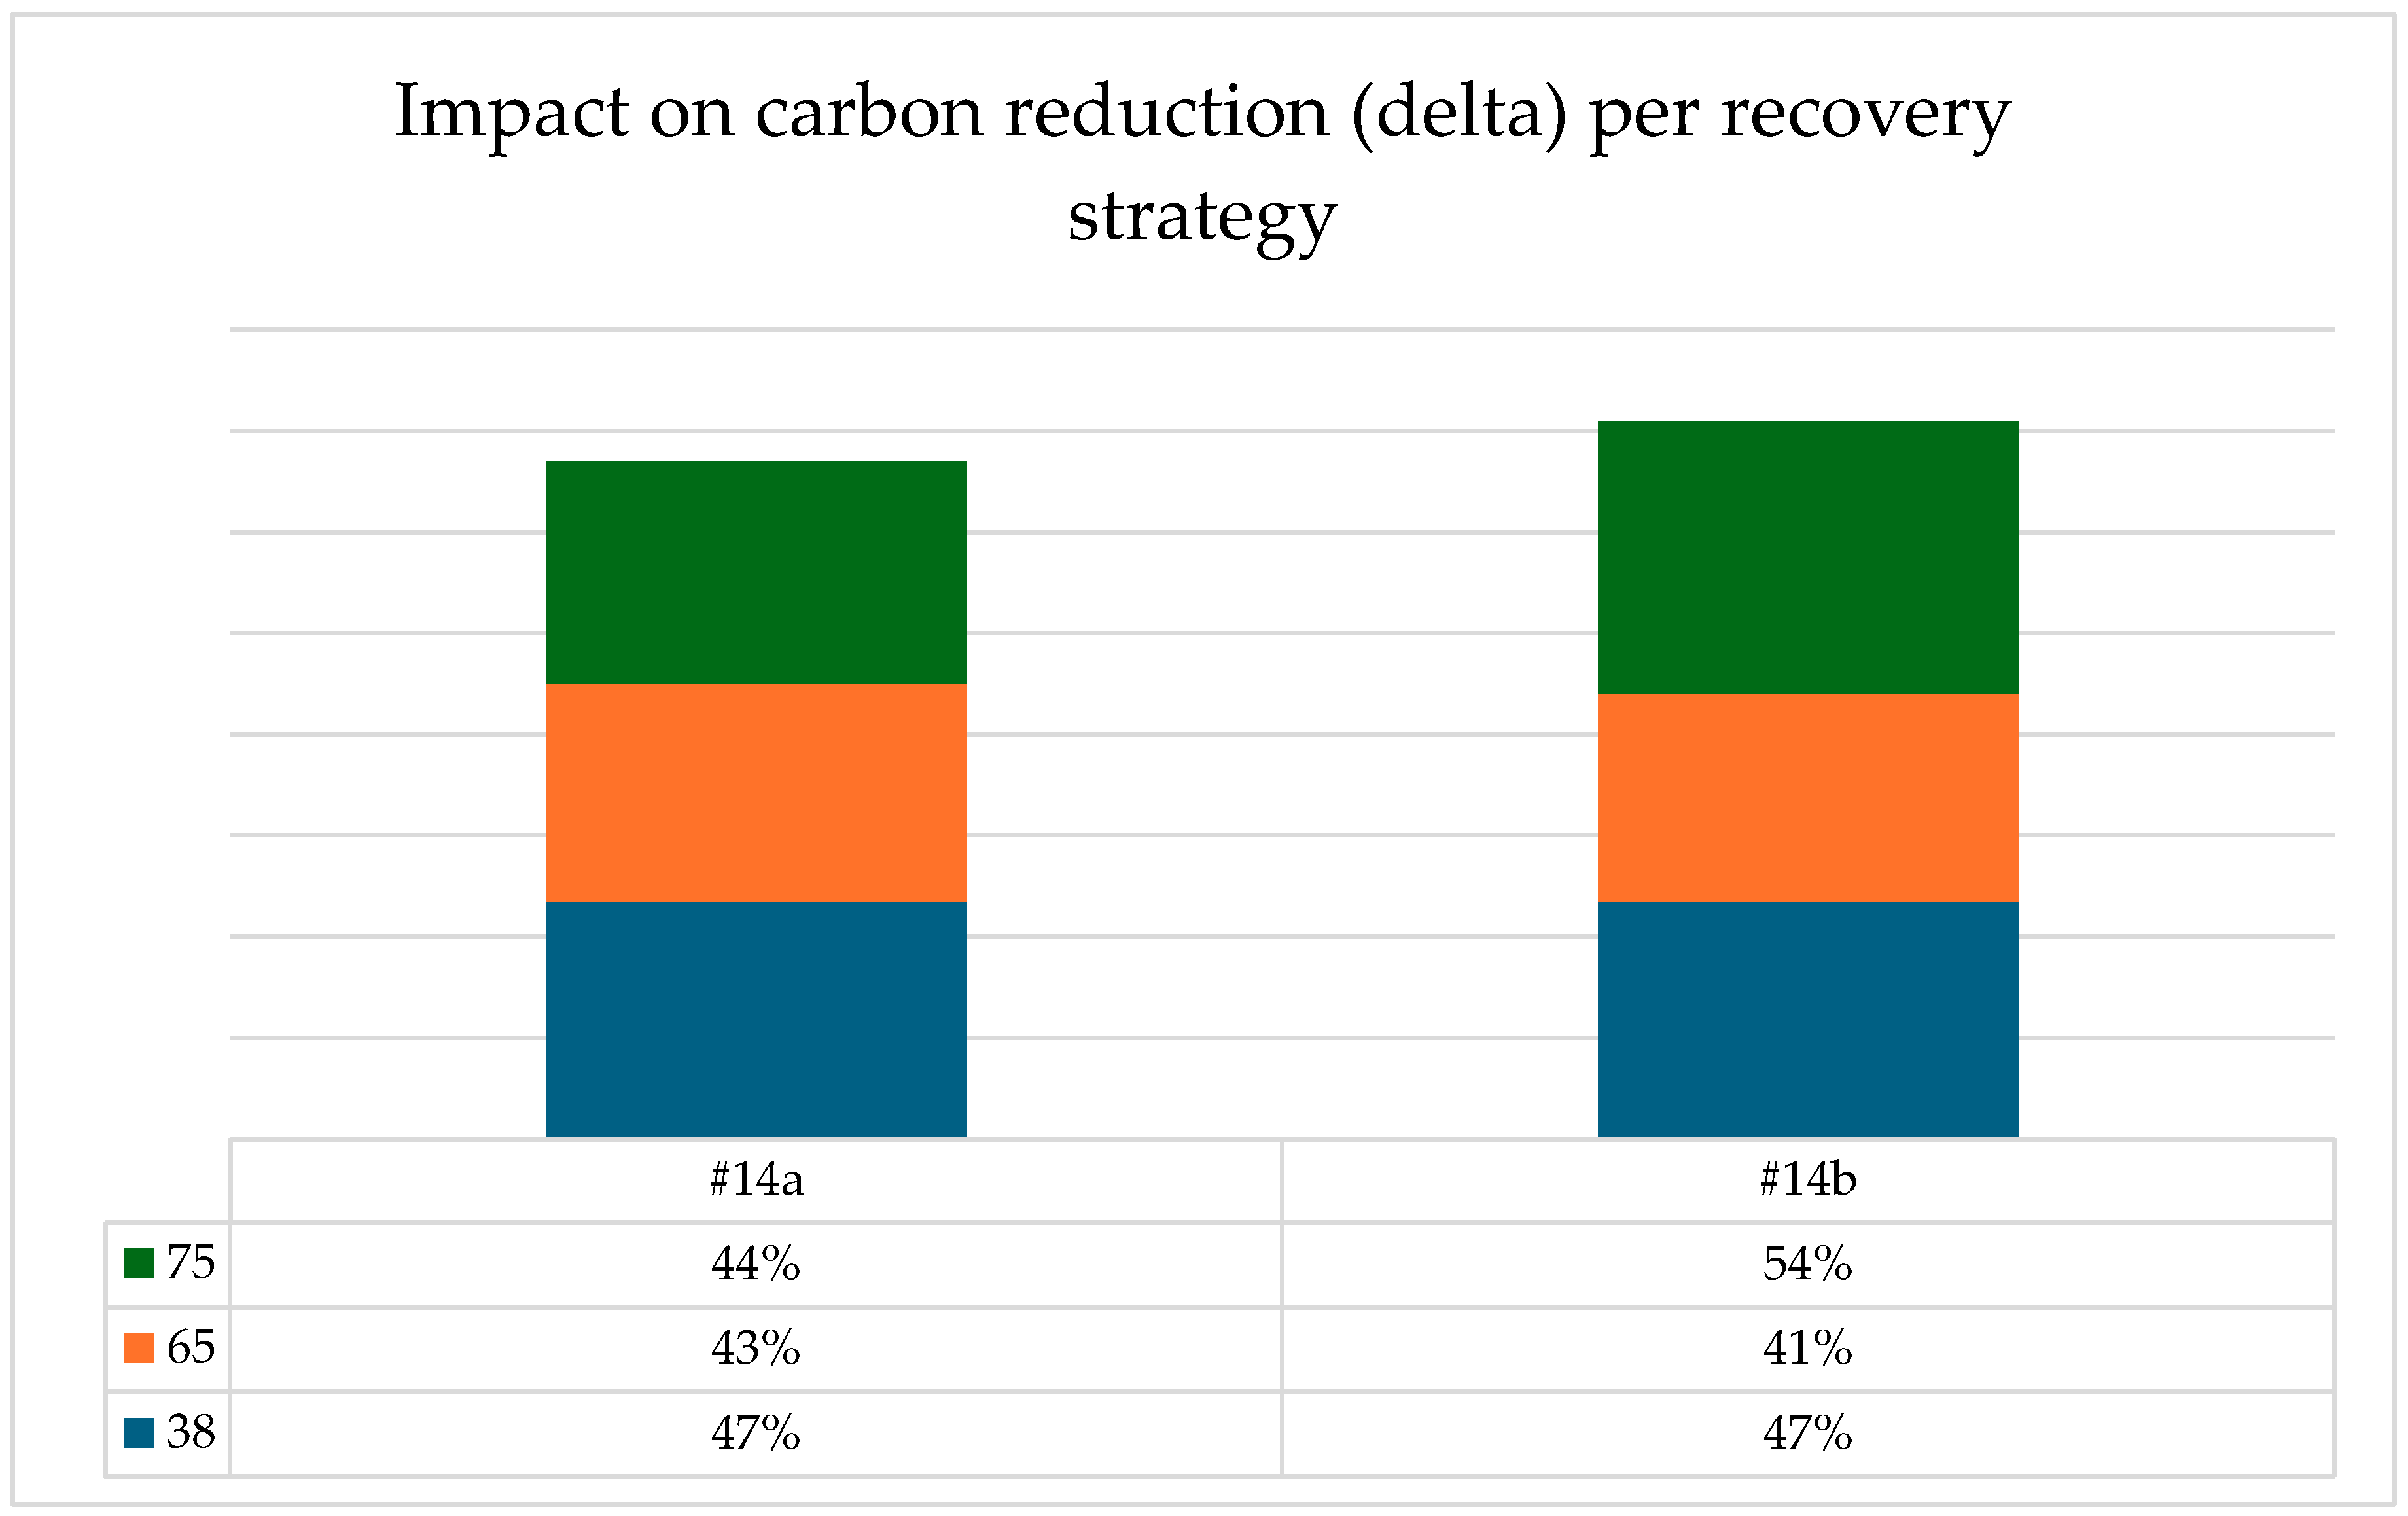
Based on these findings, we return to the best three recovery strategies. The
Figure 11 and
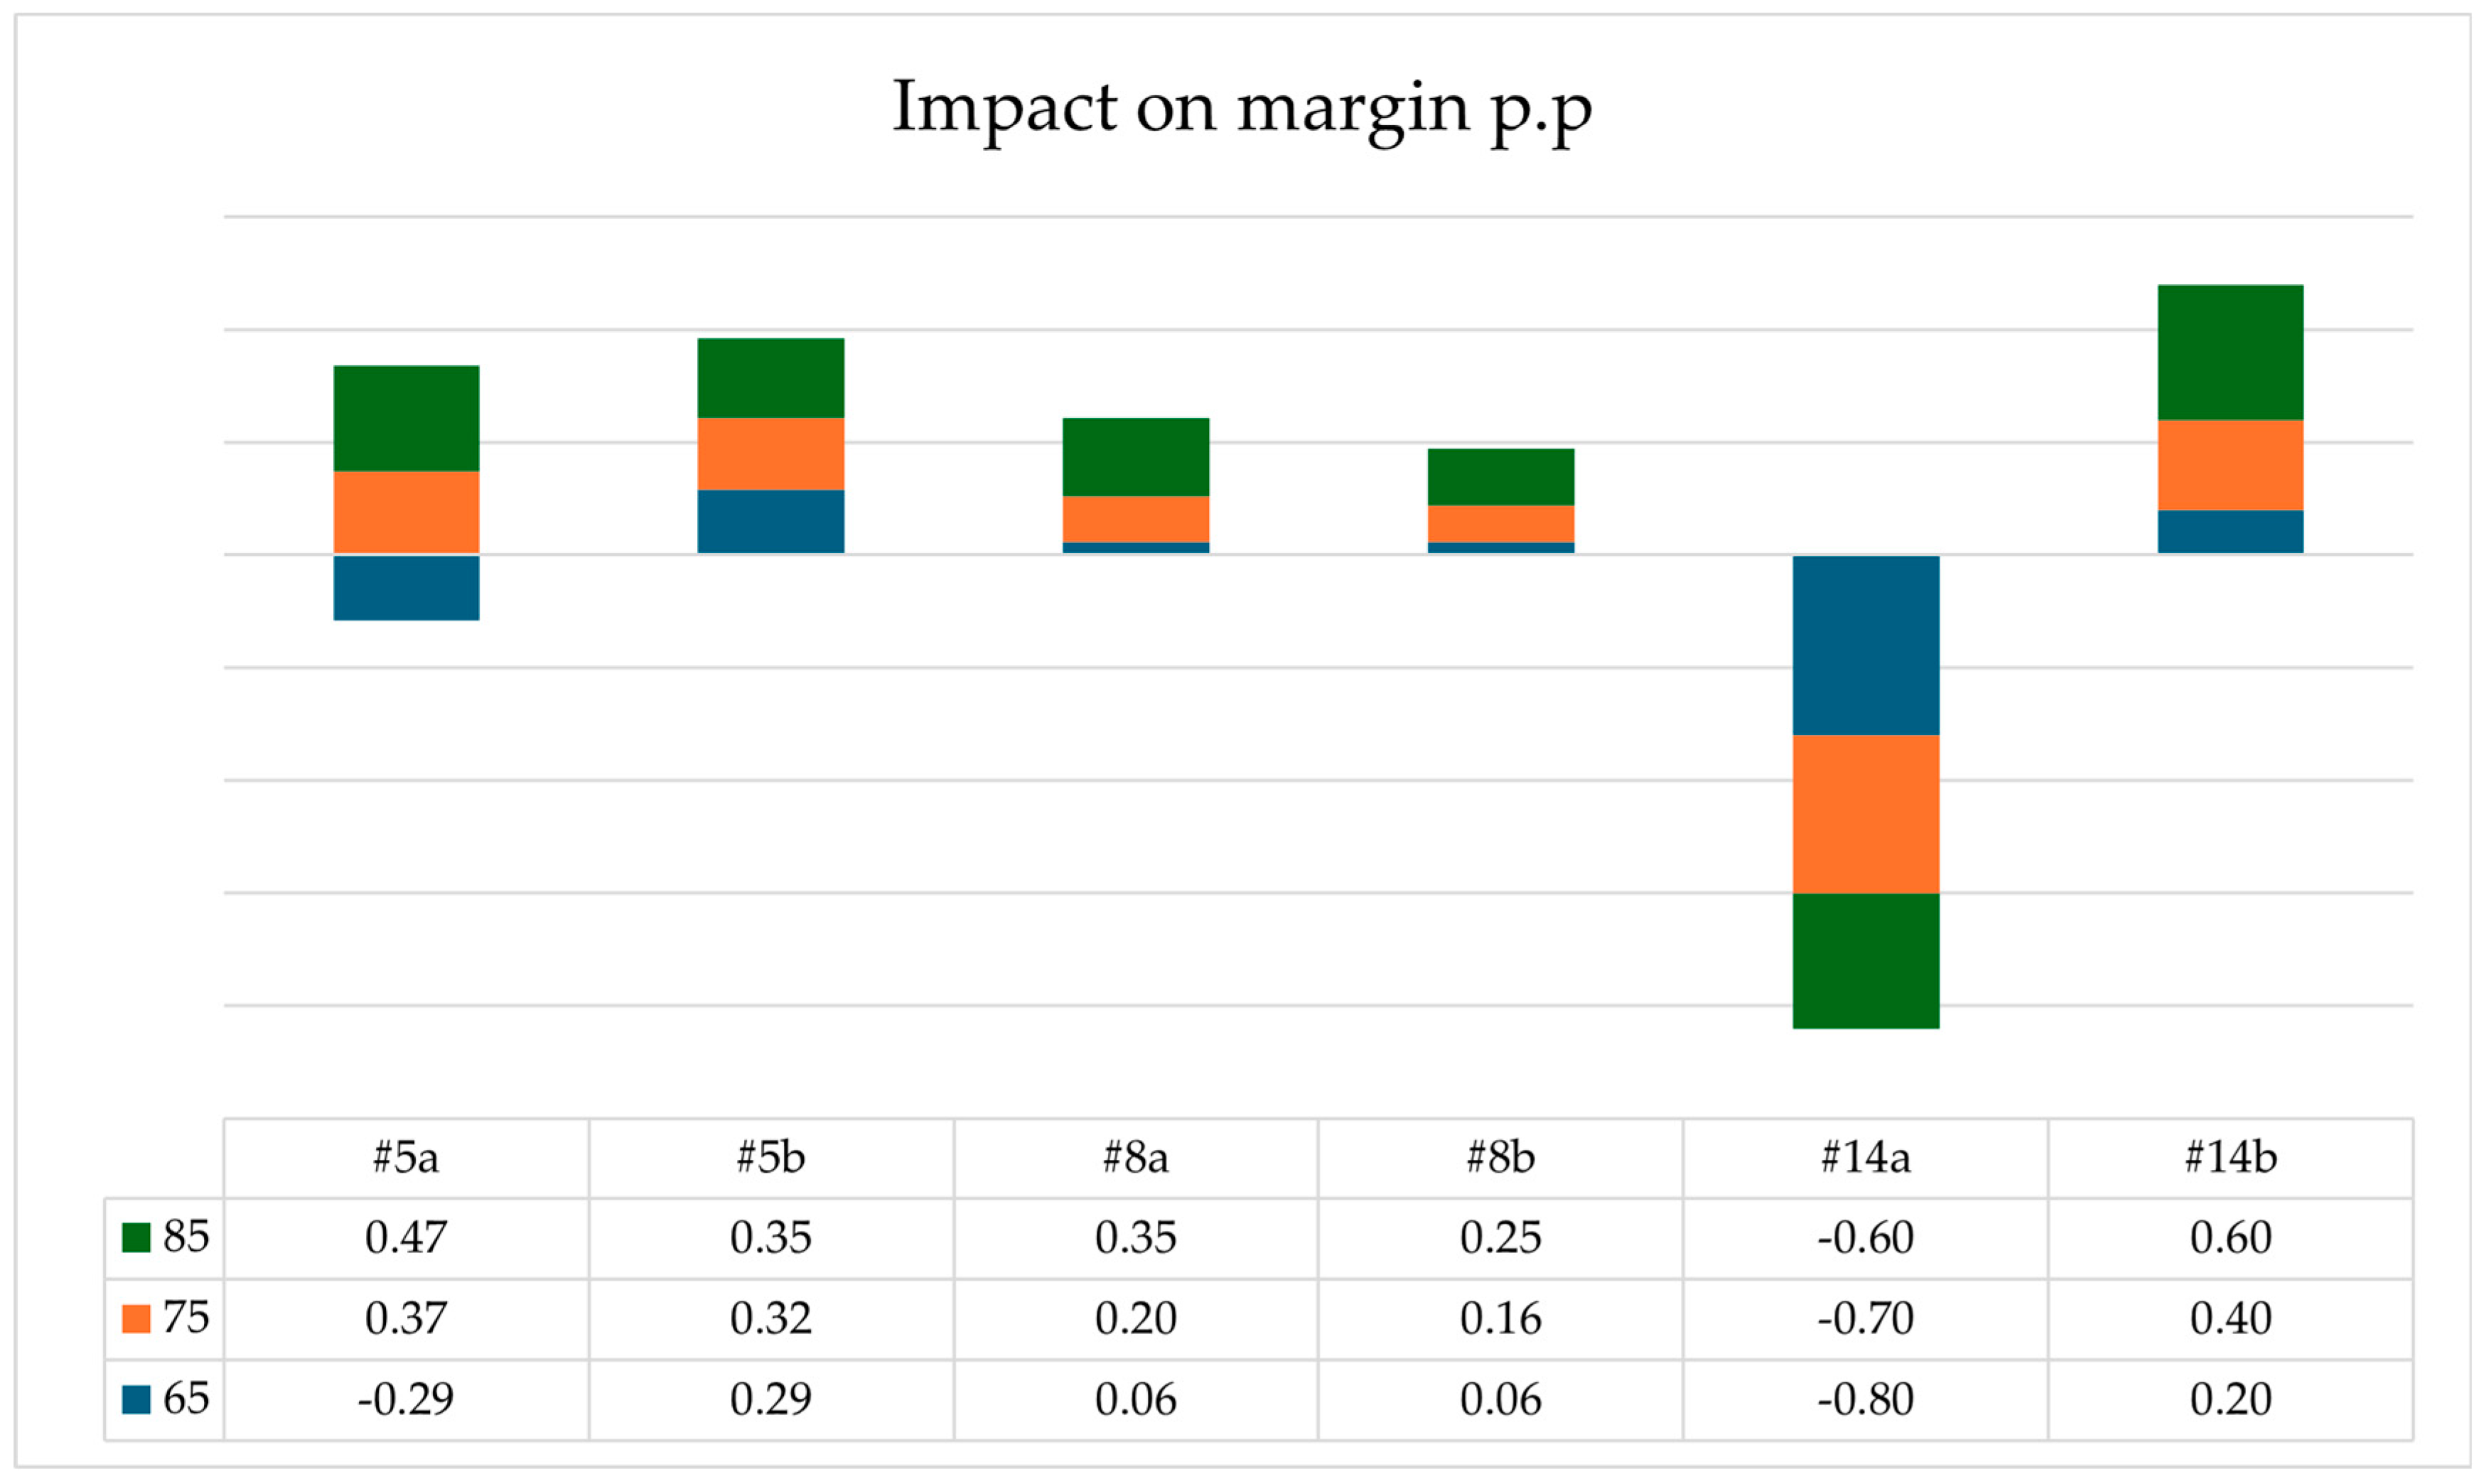
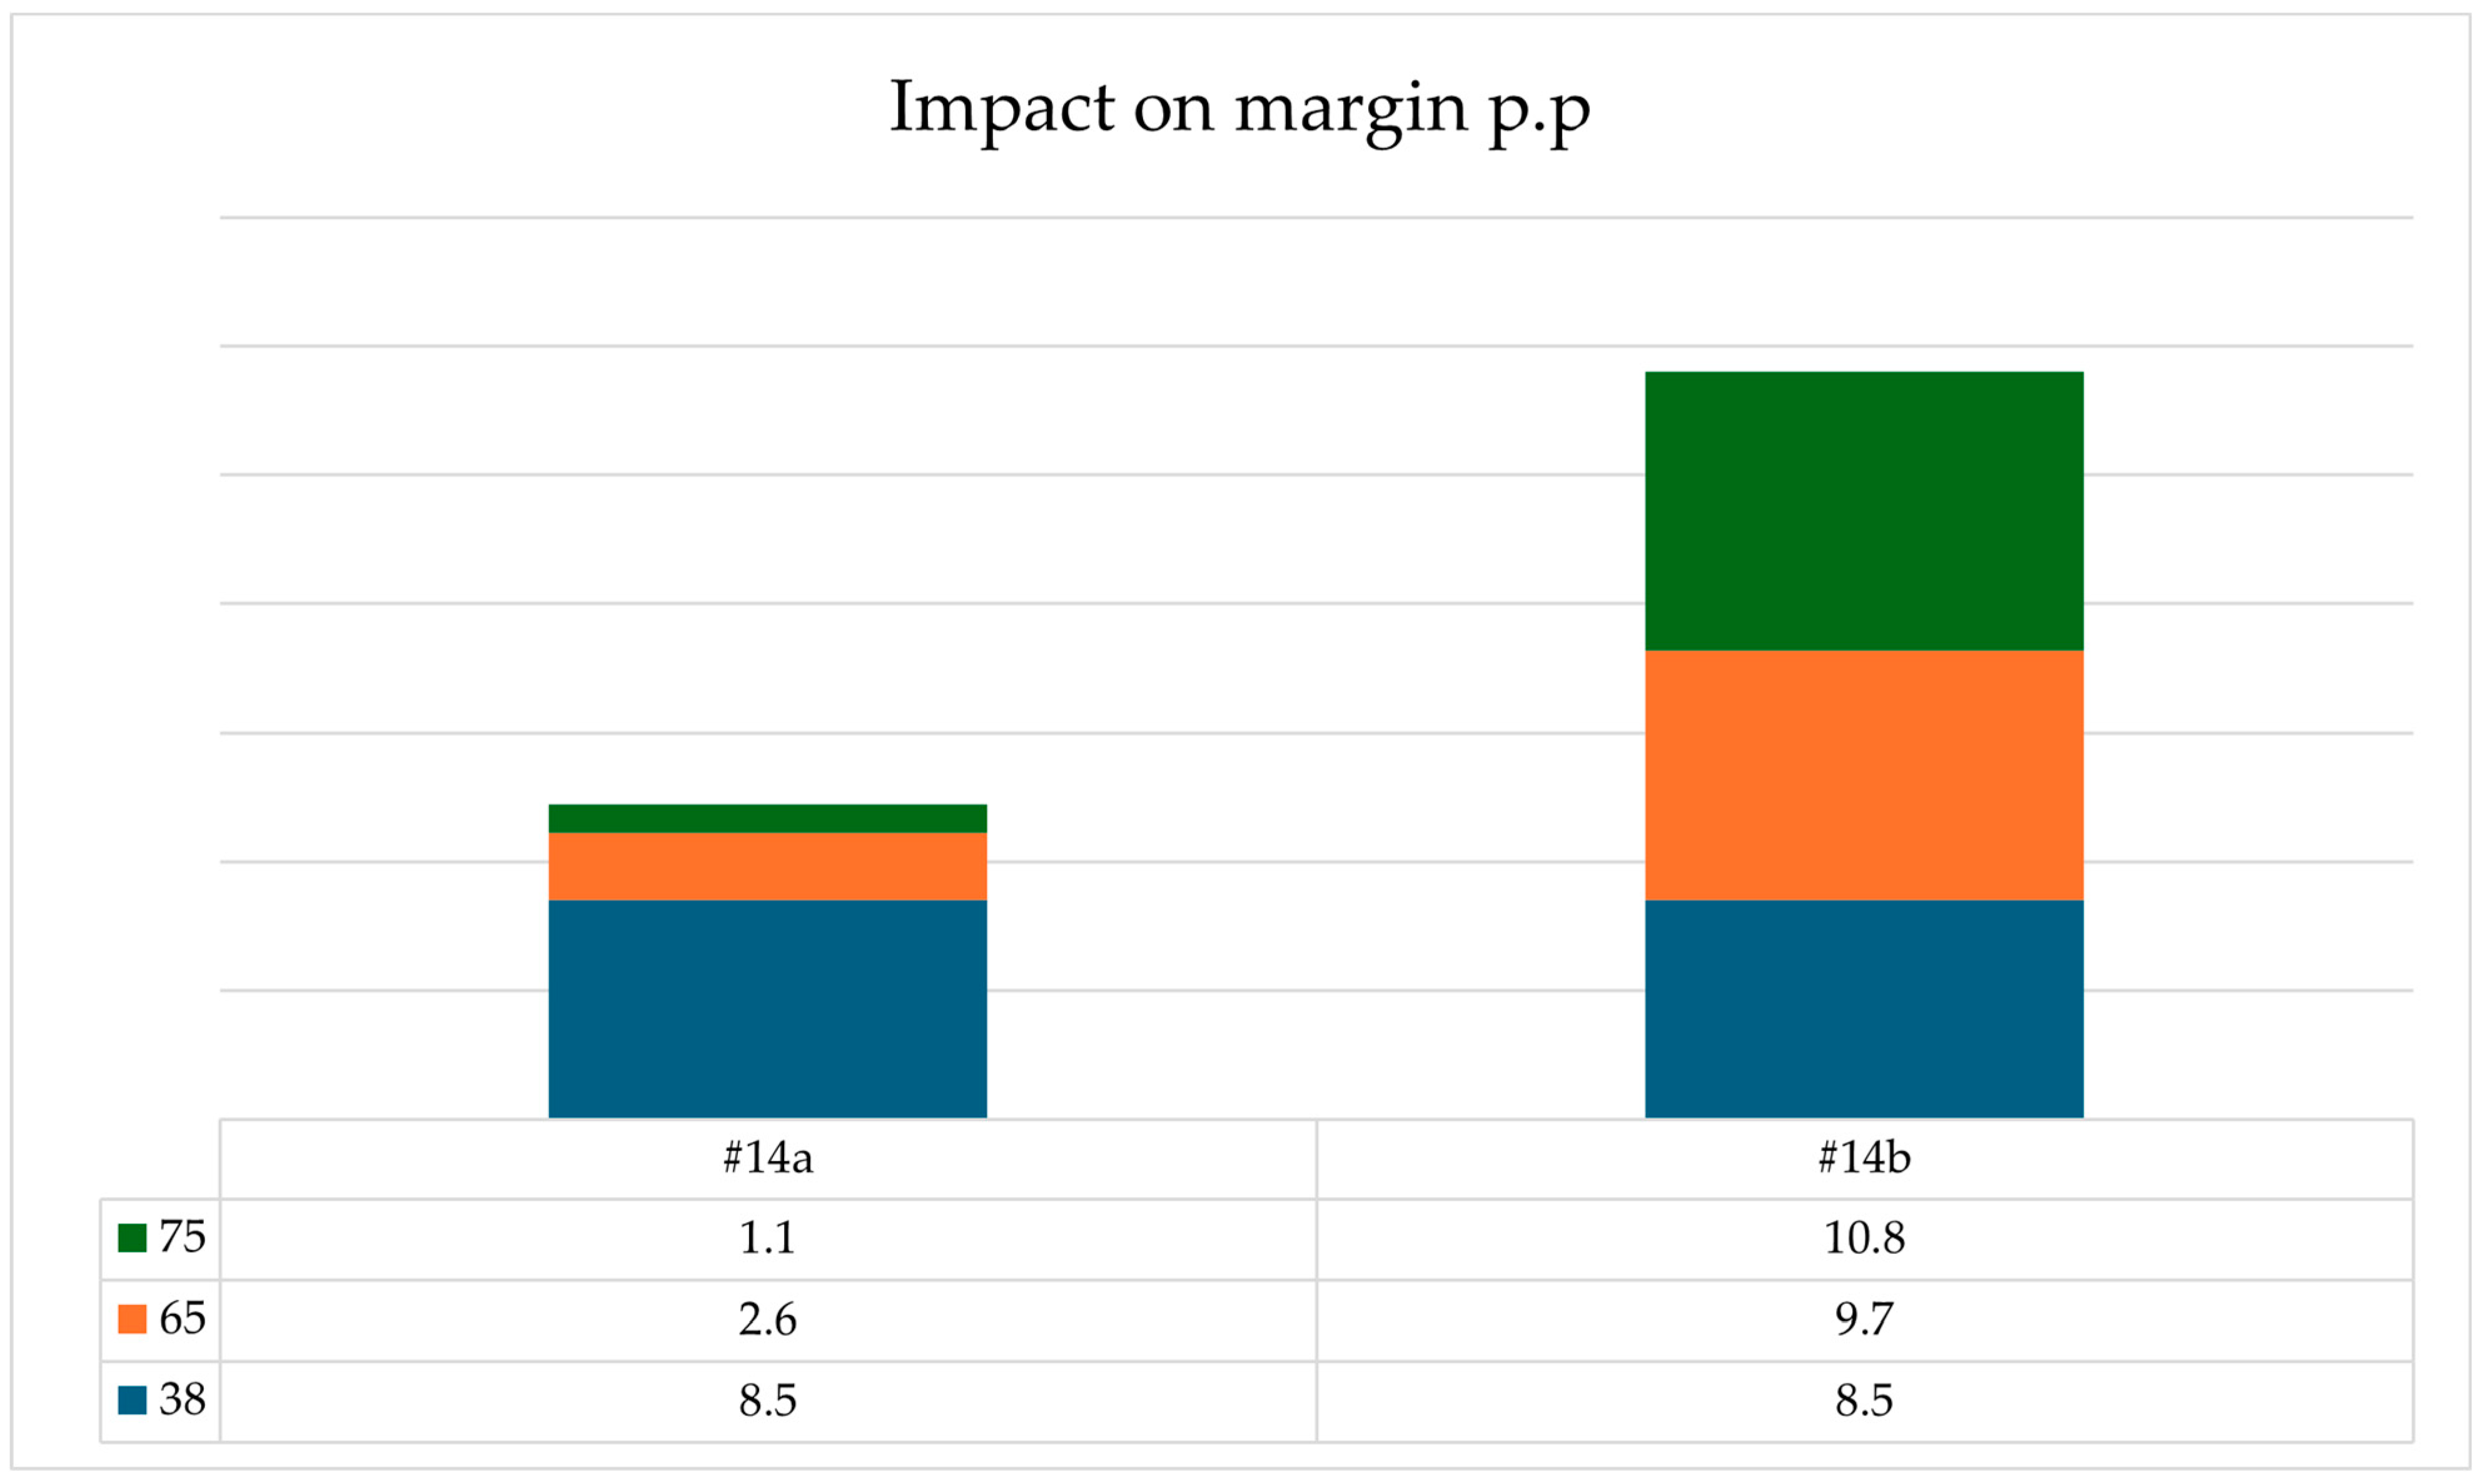
Figure 12 describe the impact on the carbon reduction (delta) and the margin per product. Obviously, a lot of variations can be made, and we limited the analysis to two additional versions of #5, #8, and #14. For all strategies, it is assumed that the current reuse rate is 65% and is increased in two steps of 10%. Reuse rates are complemented with recycling for recovery strategies #8 and #14, making the total recovery rate 100%.
Figure 11 shows the results of the original recovery strategies as well as #5a—A and B up; #5b—C up; #8a—A and B up; #8b—C up; #14a—B up; #14b—A up; B = 0. It shows that carbon emissions significantly benefit from reuse.
Figure 12 shows the profits of the same adapted recovery strategies. Contrary to carbon reduction, results are mixed because reuse option B is not viable.
4.2.2. Printers
We again start off with varying sales prices for the medium segment in
Table 15, as this is currently not viable. To ensure profitability, in fact, prices should be raised.
We have also investigated the impact of varying prices for parts reuse return level 2 premium products, but the losses remain too large, so this is not a viable option. More promising is the potential impact of lowering the recovery cost, as shown in
Table 16. However, this turns out not to be a beneficial option for return quality level q2, and not really necessary for q1. However, if sales prices are under pressure, it may be necessary to lower the cost to achieve a viable outcome.
Based on these findings, we revert to the three best recovery strategies calculated in
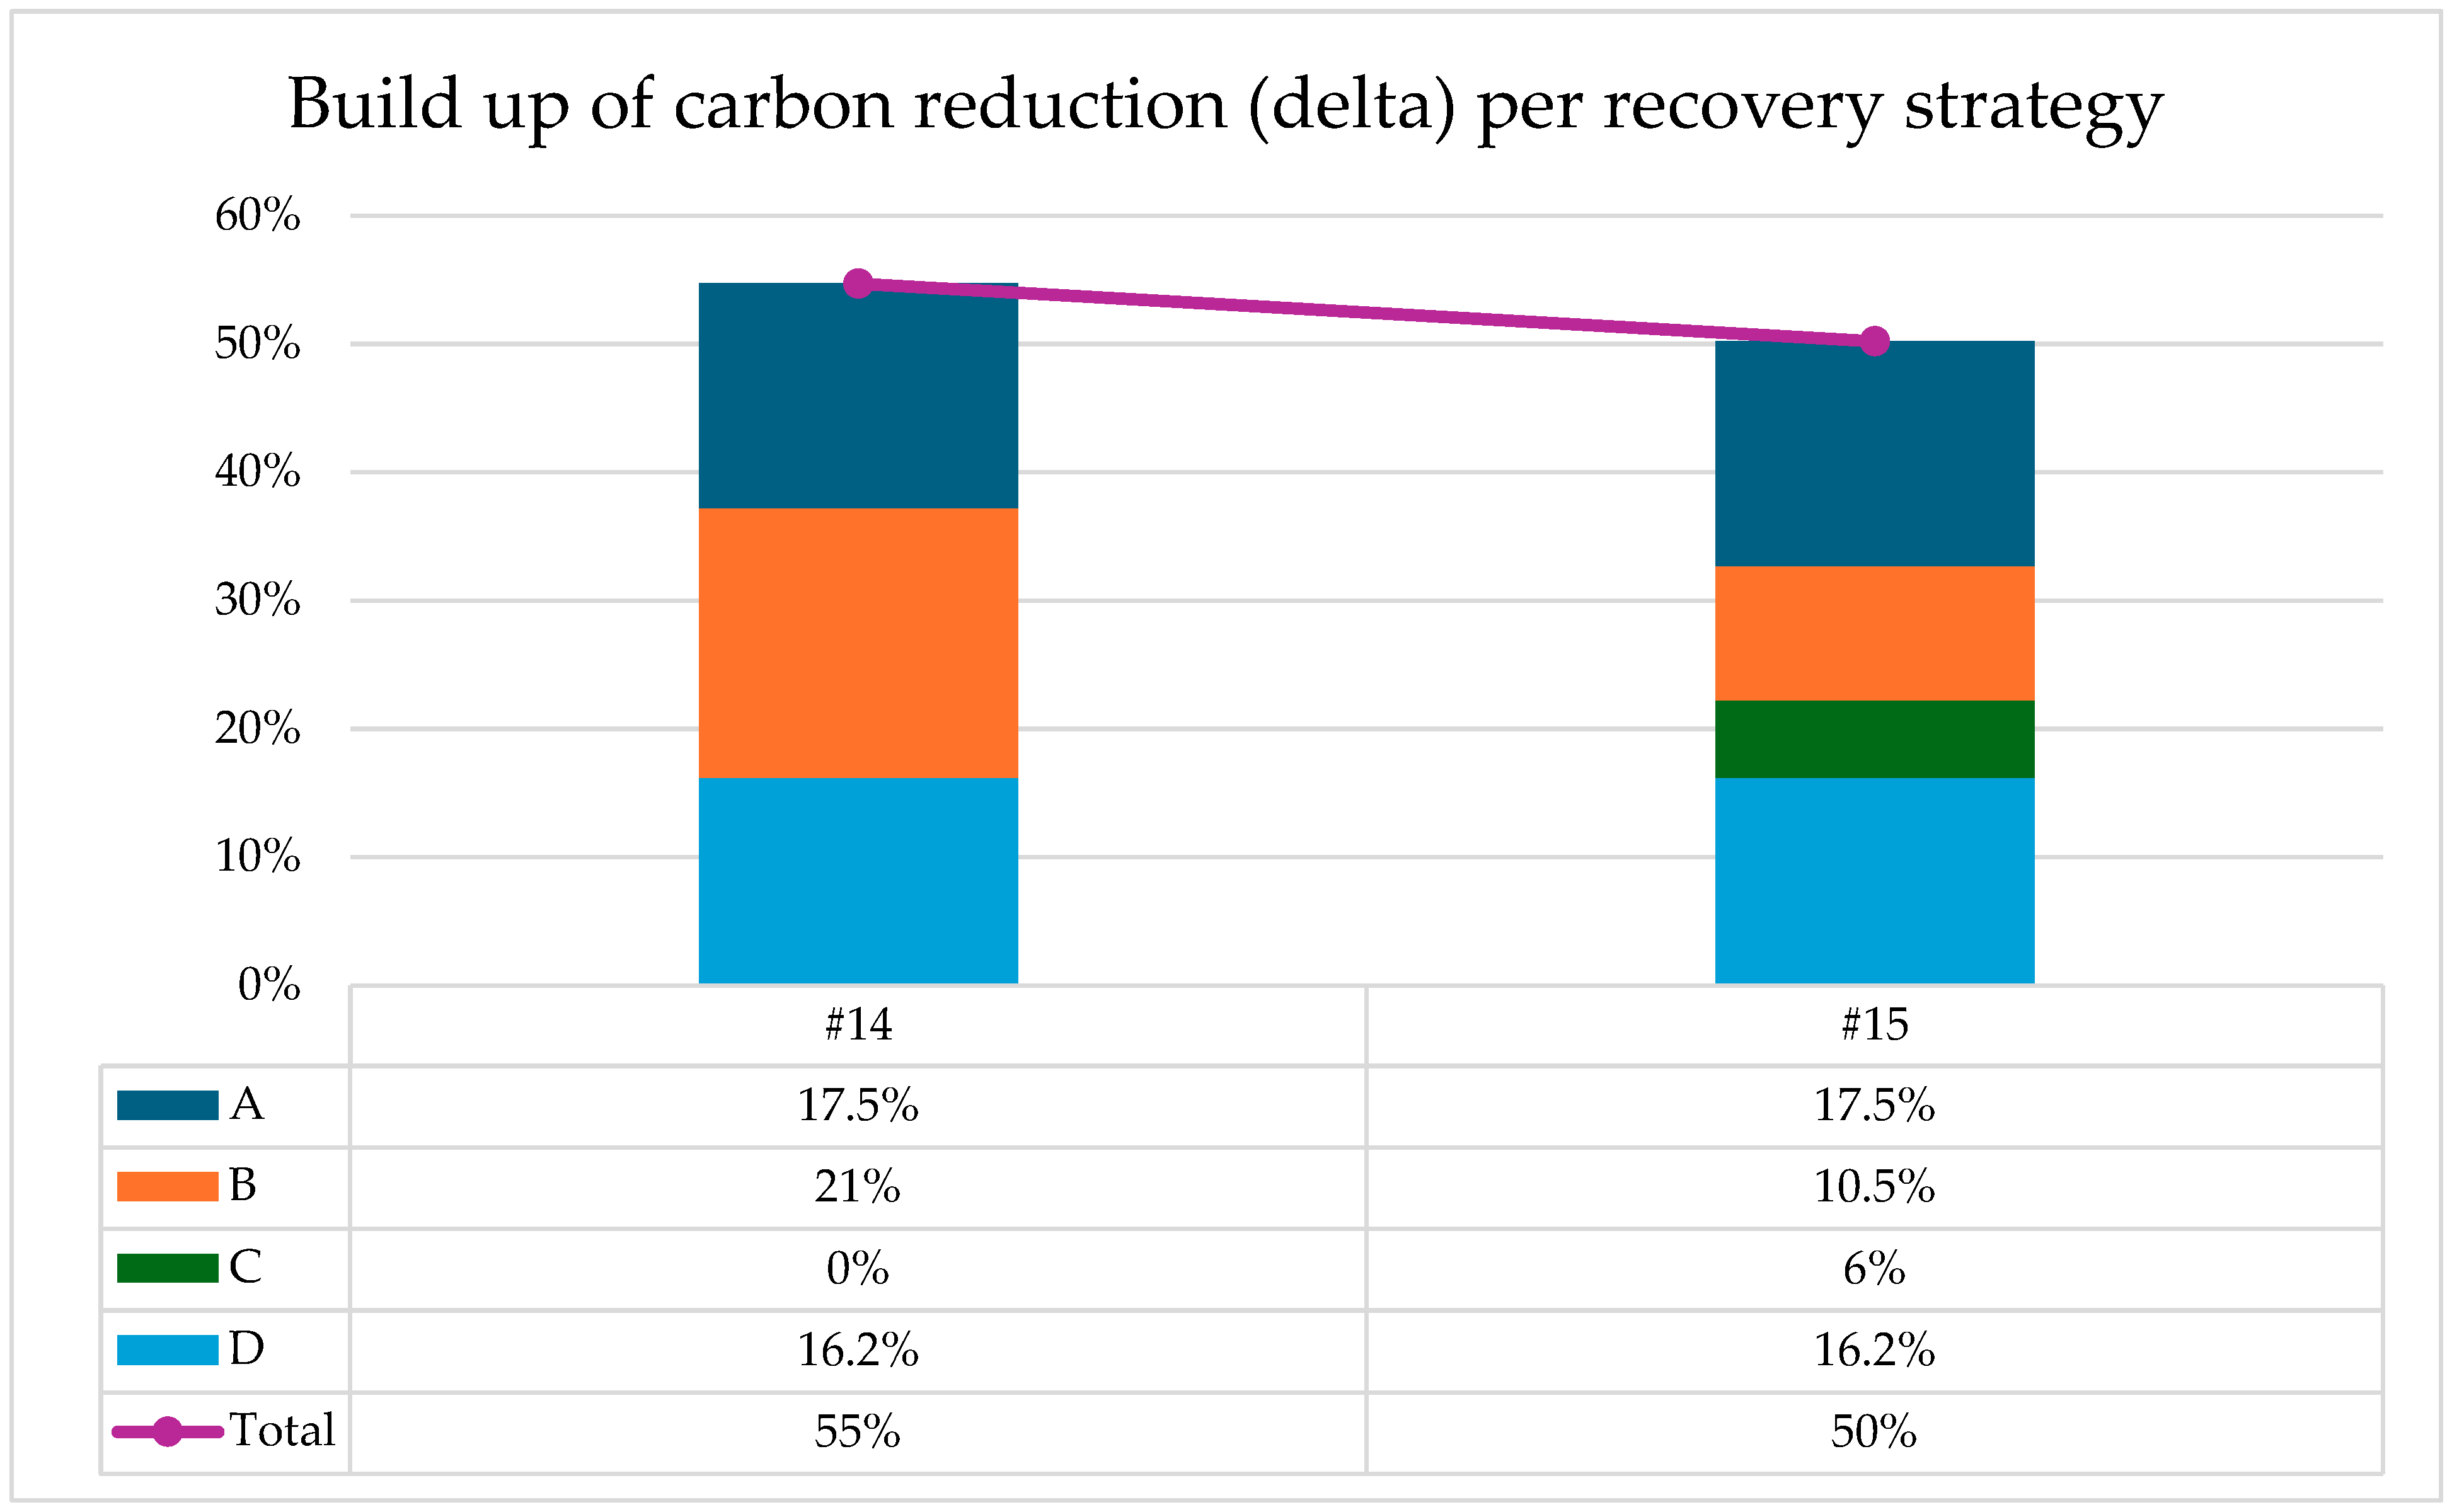
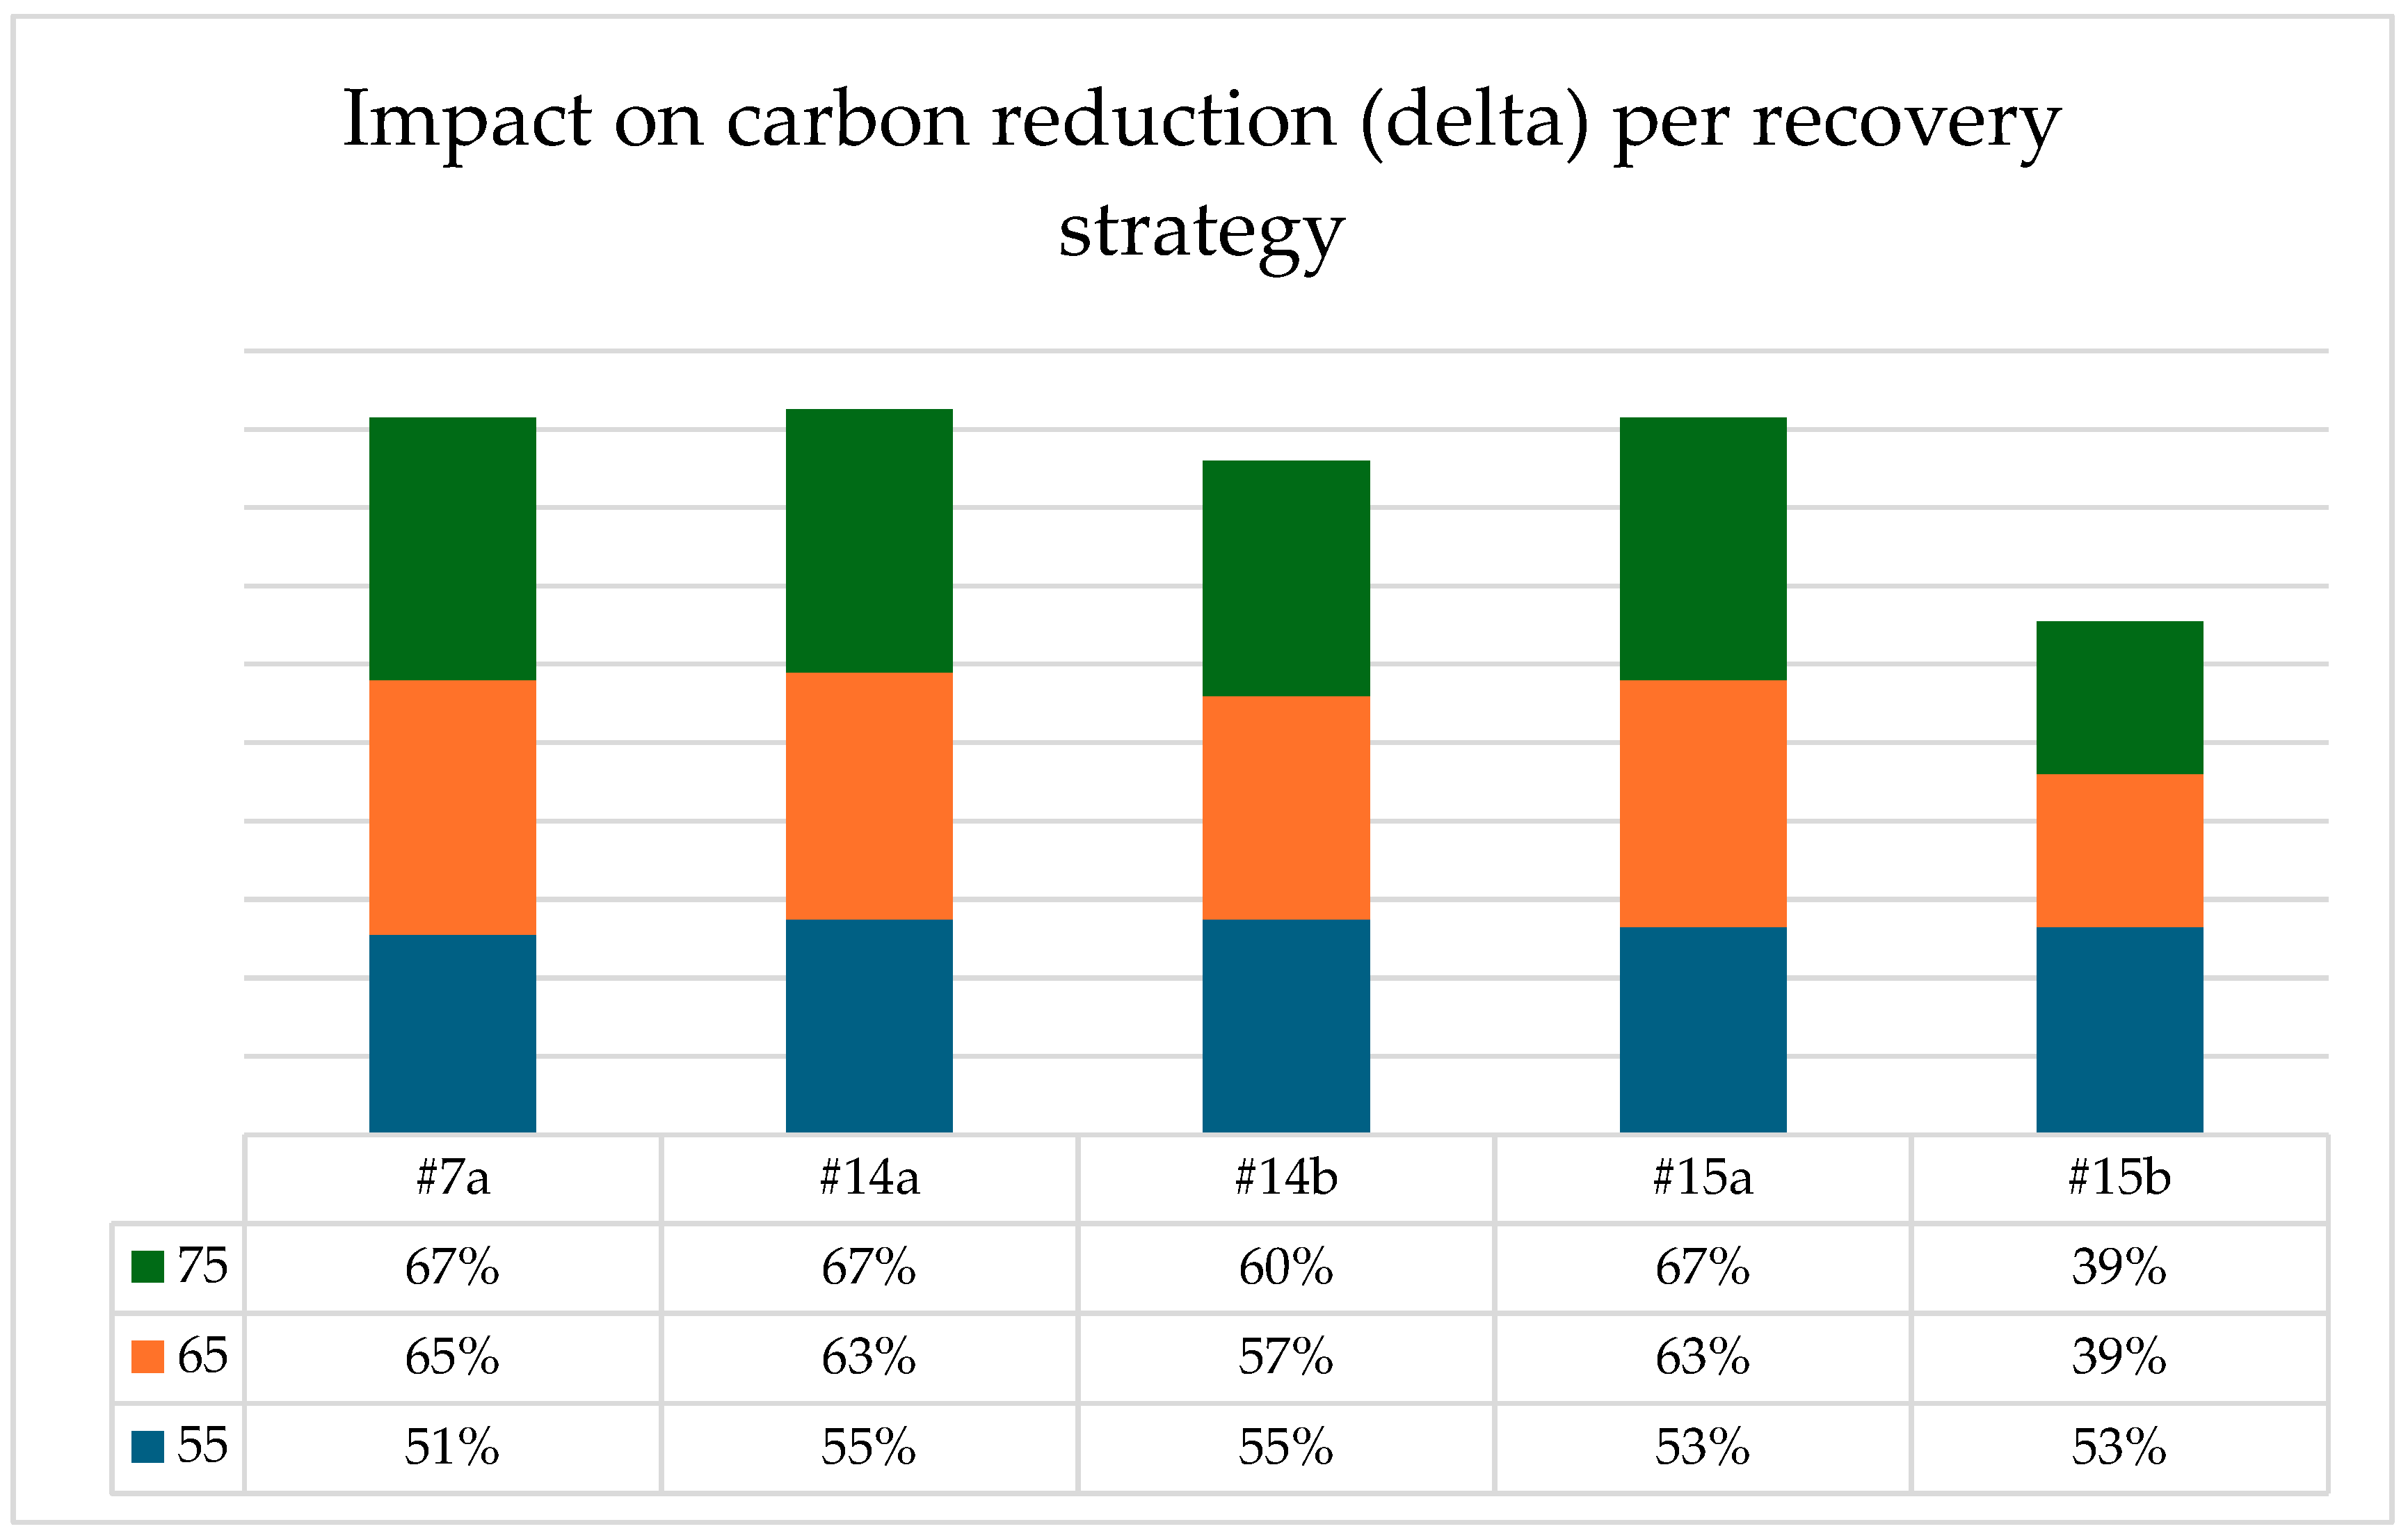
Section 4.1 and look at the impact of increasing different forms of reuse A, B, and C. We do so for alternative strategies 7a—product reuse A up; 14a—product reuse A up; 14b—product repair B up; 15a—product reuse A up; 15b—parts reuse C up.
Figure 13 shows the carbon footprint reduction, and
Figure 14 shows changes in the profit margin. For all three strategies, it is shown that increasing product reuse A improves both economic and environmental performance. The other two reuse options barely contribute to better economic results and have a lower footprint reduction as opposed to the newly built products.
4.2.3. Laptops
Based on the results of
Section 4.1, we decide to investigate the following three scenarios. We start with varying the price of parts reuse C, return quality level 2, combined with increasing the volume of this recovery option. Contrary to the first two products, this appears profitable, yet pricing could be an issue. The results, however, are quite robust, as
Table 17 shows. So pricing is important but does not really pose a risk.
Next, another contrast with the previous products is that buying prices can be significant, and hence an important factor is overall viability. There we analyze the buy-back price impact again, combined with increased reuse rates for A, return quality level 1. The results in
Table 18 show that this remains a very viable option, even if buy-back prices go up by 40%.
Finally, an analysis of the recovery cost shows
Table 19 that it is interesting to try but the impact is relatively small.
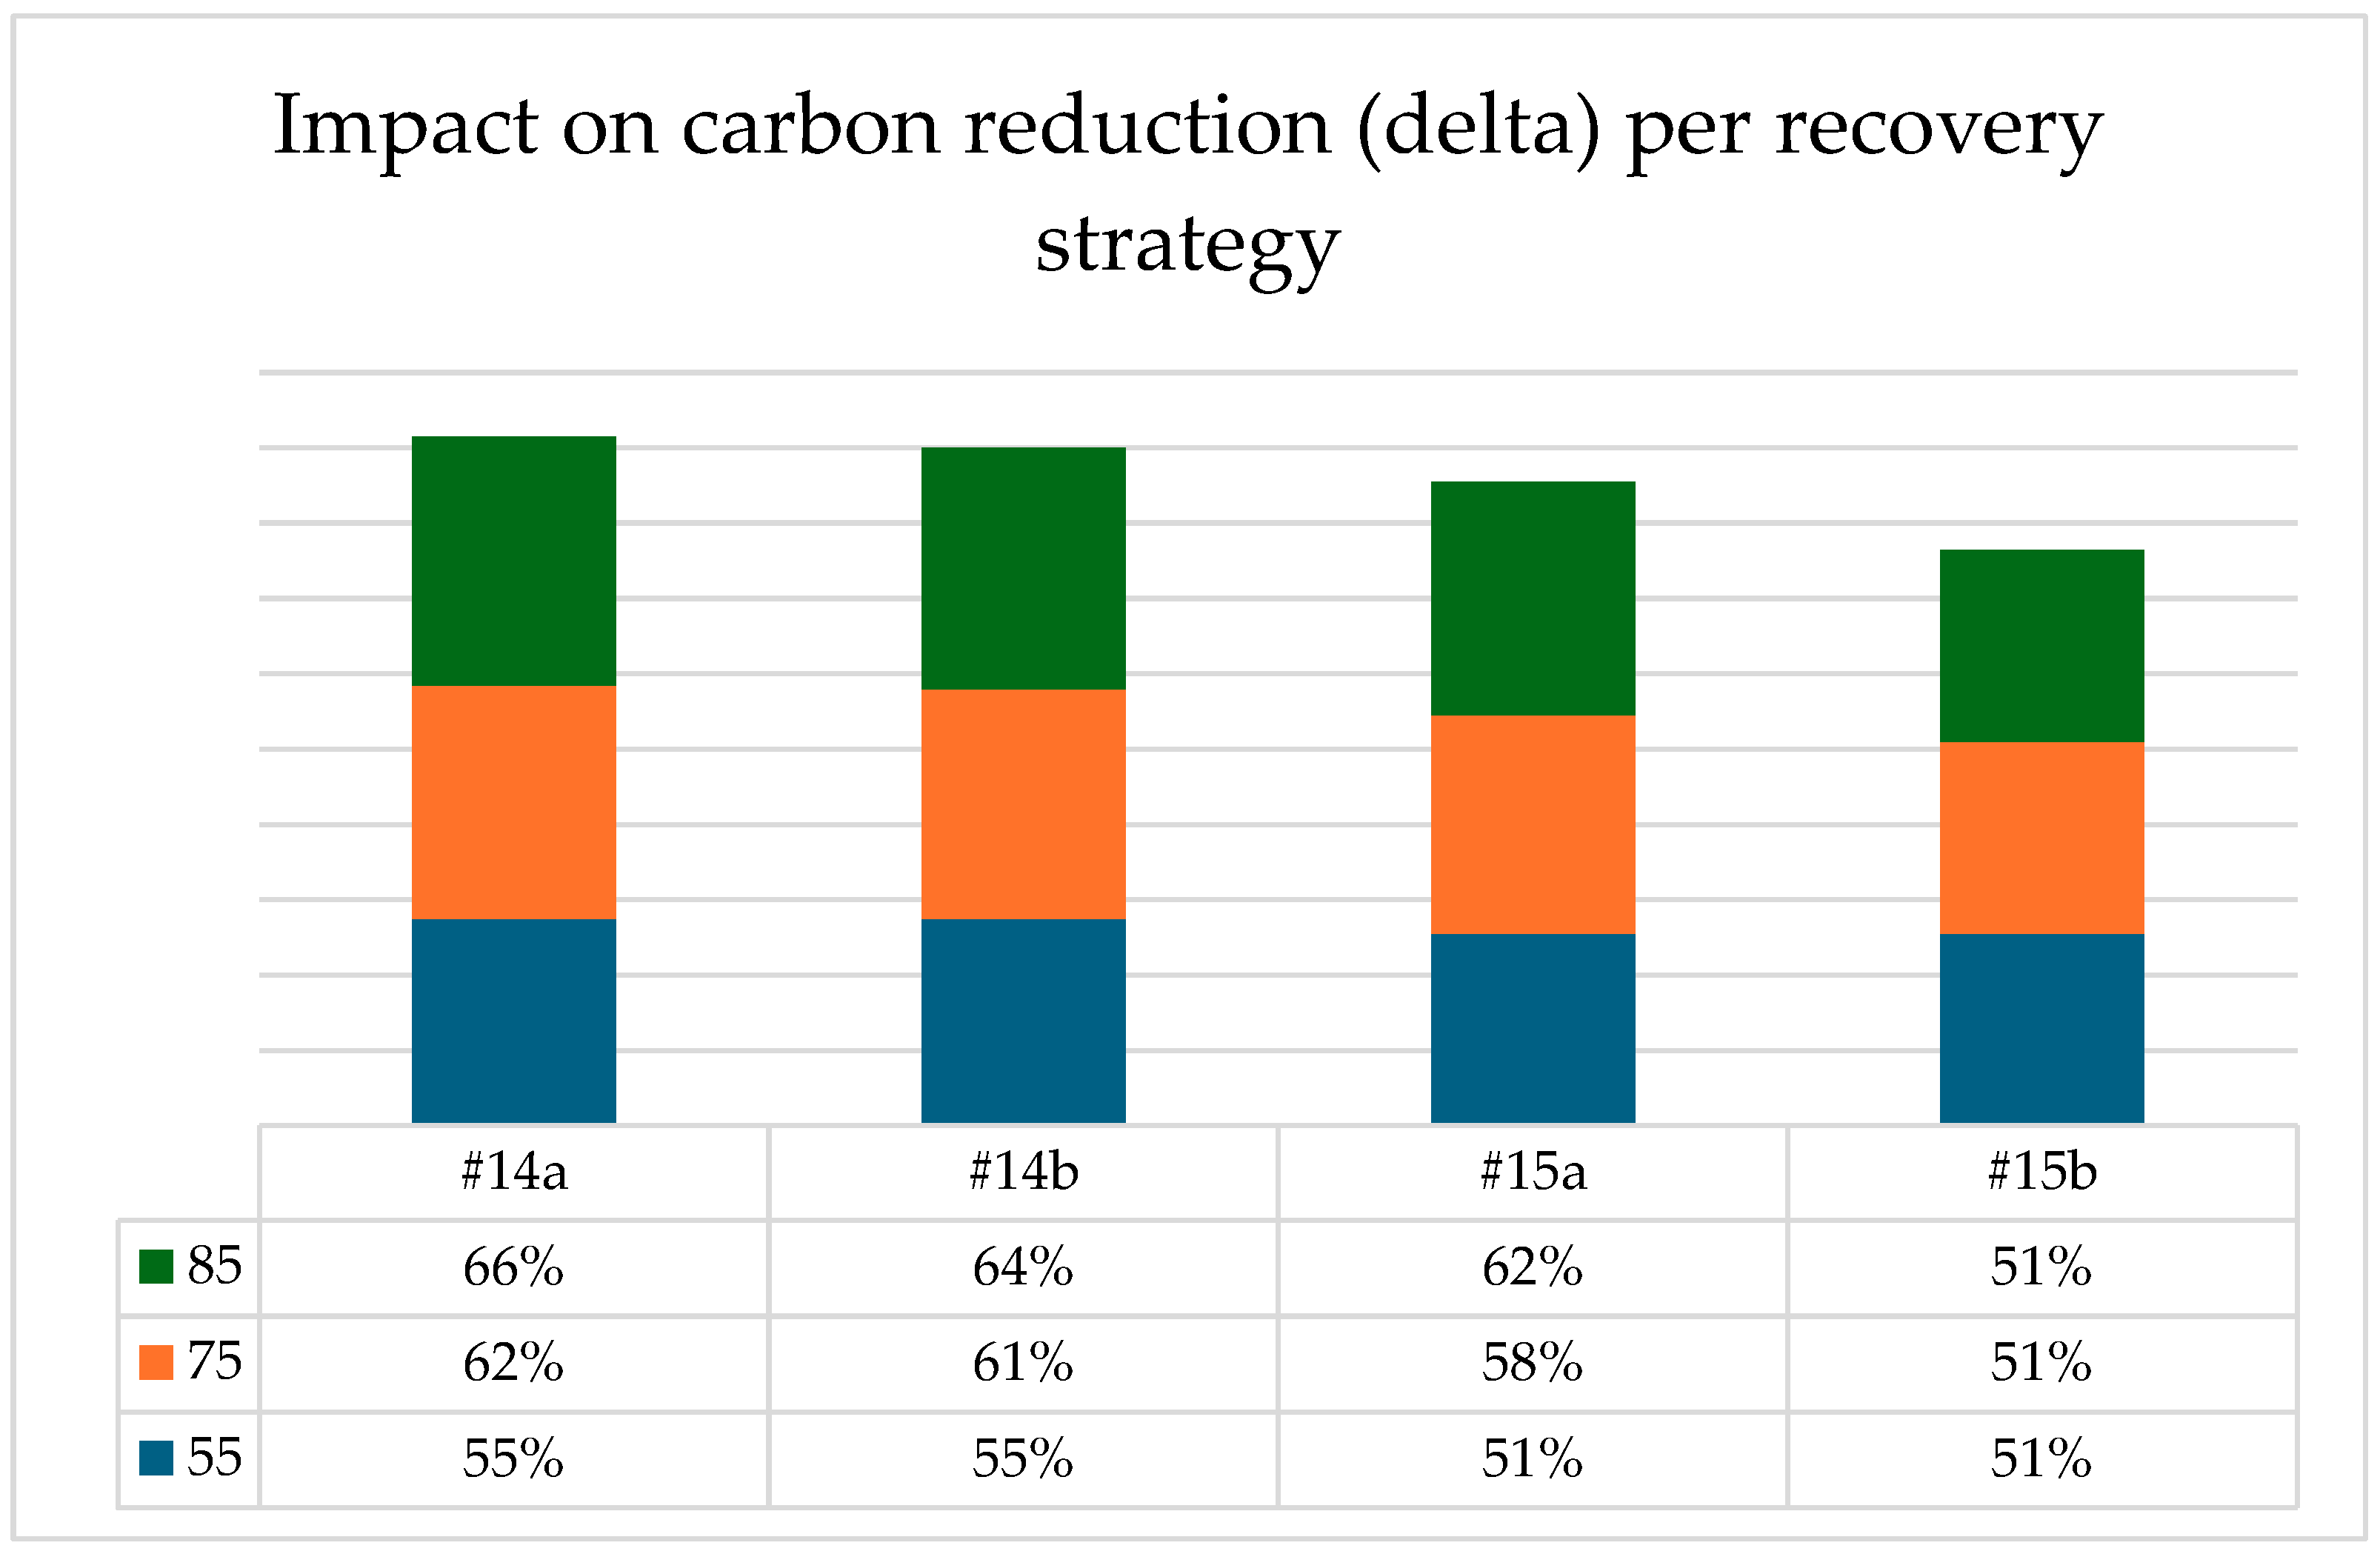
And again, we revert to the best recovery strategies. We conclude that all reuse options have potential for upscaling, where product reuse A has the highest potential, but obviously only for high-quality returns q1. We calculate alternative recovery strategies 14a—A up; 14b—B up; 15a—A up; 15b—C up. Carbon reductions are found in
Figure 15, and changes in profits are in
Figure 16. Again, we do this for different recovery rates. We see that both economically and environmentally, #14a is superior.
4.2.4. Desktops
Product reuse A is quite beneficial, even with lowered prices, but parts reuse C is less robust.
Table 20 below shows that prices should not drop too much; in fact, they should aim for an increase. So pricing is essential for this recovery option, but depends on markets and the specification of the product.
Also, for desktops, buy-back prices are important, but there is a limit to what can be paid, namely 50 per unit, which at the time of research was the market price. Even for medium-segment high-quality returns, as can be found in
Table 21, the impact of recovery cost proves relatively small. Therefore, we will not analyze this scenario further.
Finally, we revert to the best recovery strategy #14 and try to improve it. Unfortunately, this can only be performed for return quality level 1, because the losses for return quality level 2 are too large.
Figure 17 (carbon footprint) and
Figure 18 (profit) show again the results for recovery strategy #14a—C up and medium-segment return quality q1 and #14b—B up for return quality q1. Again, for different recovery rates, repair B and C options compete with reuse A on the highest return quality level. Still, assuming reuse A is a niche market with limited volumes, it is interesting to add options B and C to the recovery strategy, where B has the best results.
4.3. Energy Mix
Due to modeling assumptions and a lack of data, we cannot calculate the impact of the energy mix for all four products separately, let alone analyze this in more depth. Below are the overall results in
Table 22 that show the delta between new production and recovery for different combinations of locations. For example, if production is performed in China and recovery (for reuse option A in this example) in Europe, carbon emissions are reduced by 88%. On the one hand, we see major differences in carbon emissions, where Europe clearly has the cleanest energy. China and Australia show similar values. On the other hand, recovery has a lower carbon footprint in every possible combination, with a minimum of 25%.
5. Discussion and Conclusions
This article presents a model that optimizes recovery strategies for four types of IT equipment collected by the City of Melbourne municipal e-waste collection. The main findings are as follows: (i) Product reuse has a lot of potential, but currently, only for premium brands and provided that the returned products are of good quality. If not, recovery costs are too high and/or market demand is too low. (ii) Environmental footprints are reduced in almost all scenarios, so economic viability is the main bottleneck in applying (more) reuse. (iii) Eco-design and circular business models may pave the way to reduce costs and increase market acceptance. In the meantime, we rely on material recycling to fully close the loop. We elaborate below.
Reuse (A) for premium segments is always profitable and reduces the carbon footprint significantly for return quality level 1. It is surprising to see that high-end desktops are also profitable for reuse (even medium segments). This is probably a market for very specific applications, like graphical tools, gaming, or music (e.g., Apple). Note that laptops and desktops need to be bought back actively from the market, whereas printer and monitor device product types can be obtained for free. Currently, reuse is still only a small part of the market, and those devices that are widely available originate from scaled return systems and demonstrate very little or no previous use (e.g., open-box returns). The household product disposals seen in this study are small in quantity and varied (models, condition, and specifications), making it difficult to build on economies of scale and efficiencies for reducing reuse operating costs. Part of the problem is dealing with this type of uncertainty.
Some additional niche markets exist for repair B with return quality level 1 for medium segments and 2 for high-end products (desktops/laptops), and occasionally parts reuse C return quality level 1 and 2 in premium segments. However, this latter option is competing with A and B on return quality level 1 and hence not recommended. Furthermore, the (selling) price cannot drop by much, since margins will become too low. Given the mixed results and the relatively low volumes, they may be hard to implement in practice. Lowering repair costs is recommended, as Australia labor costs are relatively high compared to developing countries, where often new products are manufactured.
Roughly half the products collected have return quality level 3 and are only feasible for recycling D. In addition, reuse A, B, and C are not profitable for lower-segment products, which means that between 50% and 75% are likely to be recycled. This means that 10–15% of the total products returned could be reused in a viable way. Material recycling is needed to meet environmental objectives. Although the delta compared to virgin materials is less than for the reuse options, it also contributes to carbon reduction. Moreover, after reuse, there is always a possibility to recycle in another loop, yet the opposite is not possible.
Economic and environmental objectives can both be achieved in reasonable balance, and the exception is the monitor devices in lower segments and/or low return quality because material recycling has negative margins for this product.
Carbon emissions in the (closed loop) supply can be significantly reduced (compared to newly built) for all recovery options, but the user phase is not considered in this research. The impact of the energy mix still shows that the reduction is even stronger when recovery is performed with clean energy in well-developed economies as opposed to manufacturing newly built products in developing economies with less clean energy, like the economies where traditionally, brands manufacture their equipment. On the other hand, it is desirable that new production is performed with clean energy. In that case the reduction remains the same. Although a reduction in carbon emissions varies strongly per region, it is always positive and therefore generalizable. The results with respect to reuse A are consistent and economically convincing, so it is plausible that it will apply in other cases as well, in particular because recovery costs are relatively high in Australia compared to developing economies. Yet the types, condition, and some other metrics seen from Australia yield mixed results in other reuse strategies. As mentioned, applying recycling to the majority of equipment seems to be the most applicable option.
With future policy measures like eco-design and the circularity of products and materials becoming increasingly valued, this study provides evidence to support actions that encourage the following operations and design incentives that promote reuse:
Collecting discarded products earlier and safely into qualified operators that promote resale. Devices would be newer and in better condition and less susceptible to the informal salvaging of parts.
Incentivizing modular product design for esthetic parts replacement that is prone to wear or damage to make used devices more attractive to the secondhand market. Device functional specifications (i.e., internal characteristics) impact both cost and performance, whereas poor visual esthetics may immediately deter potential users (therefore zero value of the product), regardless of the technical features.
Greater consistency in asset management and refurbishment operations that builds confidence in the market in buying used parts and products. This could be standards, certification, or a similar industry quality mark that aligns market activities like repair, refurbishment, and resale. The purpose is to boost market confidence, and subsequently, improve user demand for used products versus buying cheaper and often poorer quality new products.
The limitations of the research include the specific context in Australia, which particularly affects parameters on cost, footprint (energy mix), and market prices. On the other hand, relative carbon reduction effects (% wise) are huge, and despite the differences between continents, one can safely conclude that circularity reduces climate change. The model is also generic yet limited to linear functions. Economies of scale can be investigated in future research, as well as fixed operations and investment costs. Last but not least, collection is not considered in this paper but is often the weak link between the customer and the recovery system.
Further research could investigate how the scaling of repair and reuse operations could positively impact costs, making it more viable; however, there need to be both a good feedstock, supply and end markets to push more volume through. Also, recovery costs are the highest or second highest cost components for reuse. For premium and medium products, this would require eco-design focused on high-level reuse. In line with that, new business models may make it easier for customers to buy/lease/rent this type of equipment (because of improved quality perception) and return it in good condition and in time. For lower-segment products, eco-design should aim for efficient material recycling. However, some may argue that low-quality IT equipment should no longer be produced at all. Other market factors to be considered in the future are the seasonal impact on items recovered, logistical issues like location, e.g., affluence of area, transport damage, testing locations inspection procedure, and so on. Other topics for further research include market cannibalization between new-built products and reused ones, the footprint of the user phase, the impact of the collection rate, life cycle reuse (how long do reused products stay in the market), the removal of information and data during the refurbishment, proactive buy-back policies, redesigning, and/or integrating EPR policies.


