Abstract
Background: Brazil’s bioethanol supply chain is vital for global energy security and climate action but remains vulnerable to climate disruptions, market volatility, and conflicting stakeholder interests. While resilience strategies exist, they often overlook the potential of circular economy (CE) principles. Methods: This study proposes an integrated decision-support framework that combines Strategic Options Development and Analysis (SODA), the Composition of Probabilistic Preferences (CPP), and the Rank-Order Centroid (ROC) method to prioritize CE strategies under uncertainty. The approach incorporates stakeholder input and probabilistic modeling to evaluate 20 alternatives across 10 criteria. Results: The analysis identified climate risk modeling, biogas utilization, and blockchain-enabled traceability as the most effective strategies for improving supply chain resilience. The model demonstrated strong robustness, maintaining 95% consistency in rankings under varied decision-making scenarios. Conclusions: This research presents a novel, structured method for supporting complex decisions in uncertain environments. By integrating CE principles and group decision-making tools, the study offers valuable guidance for policymakers and industry leaders seeking to build more resilient and sustainable bioethanol supply chains.
1. Introduction
As the global demand for cleaner and more sustainable energy intensifies, policymakers and industry leaders prioritize the development and adoption of greener fuels, renewable energy sources, and cleaner technologies [1]. This shift is driven by the volatility of oil prices, the progressive depletion of fossil fuel reserves, and the environmental externalities associated with conventional energy systems [2]. Within the transportation sector, biofuels represent the predominant form of bioenergy production worldwide [3]. These fuels can either fully substitute or be blended with fossil fuels at concentrations of up to 10% without requiring significant modifications to vehicle engines [4].
A diverse range of biofuels is derived from biomass feedstocks, including bioethanol, biodiesel, bio-oil, and biogas. First-generation biofuels are produced primarily from food crops rich in sugars and starch, such as corn and sugarcane [5]. In contrast, second-generation biofuels are derived from non-food biomass sources, including agricultural residues and forestry by-products [3]. Despite their reliance on non-edible raw materials, second-generation biofuels involve more complex and costly production processes. Consequently, in countries such as Brazil and the United States, the production of first-generation biofuels remains predominant, utilizing sugarcane and corn, respectively [1].
Beyond its role as a biofuel, bioethanol is widely known for its applications in the healthcare sector (e.g., antiseptics) and various industries (e.g., pharmaceuticals and cosmetics) [1]. Depending on the feedstock, bioethanol can achieve up to an 80% reduction in greenhouse gas emissions compared to conventional fossil fuels [6]. However, the emerging biofuel industry faces significant uncertainties, including operational risks related to biomass supply and quality, fluctuating biofuel demand, variable costs and prices, and environmental concerns [7]. Additionally, the industry is susceptible to potential disruptions caused by natural or human-induced disasters [4,5,8]. A key objective of supply chain risk management is to mitigate the impact of disruptive events and uncertainties that could critically affect the overall performance of supply chains [9].
Within this global framework, Brazil emerges as a strategic actor. As the world’s second-largest ethanol producer, behind only the United States, Brazil primarily relies on sugarcane as its feedstock. Advances in sugarcane breeding and favorable climatic conditions have driven record productivity, with the 2023/24 harvest reaching 705.2 million metric tons, surpassing initial estimates [10]. The country’s ethanol industry benefits from high energy efficiency, an abundance of arable land, and optimal growing conditions, ensuring both economic competitiveness and environmental viability [11]. Moreover, bioethanol is instrumental in the global transition to a low-carbon economy, supporting efforts to mitigate greenhouse gas emissions and reduce dependence on fossil fuels [12,13].
The potential of bioethanol as a renewable energy source is widely recognized, especially in light of the growing demand for solutions that balance energy security and environmental sustainability [11]. In Brazil, its adoption as a biofuel for flex-fuel vehicles has been driven by public policies since its introduction in 2003, alongside fiscal incentives that have supported sectoral growth [13]. Furthermore, technological advancements such as the development of second-generation (2G) ethanol production further strengthen its strategic role in the transition to a low-carbon economy [1].
Despite these advantages, the Brazilian ethanol supply chain faces significant and persistent challenges, including market uncertainties, climate variability, and logistical constraints. Addressing these issues requires robust decision-support methodologies that enhance supply chain resilience and operational efficiency [14]. Circular economy (CE) principles offer a promising framework for improving resource efficiency, waste valorization, and supply chain robustness, thereby mitigating the vulnerabilities inherent in ethanol production and distribution [15,16,17].
To address these challenges, structured decision-making approaches have been widely explored. Recent research has employed Multi-Criteria Decision-Making (MCDM) models into this context. For instance, Vyas and Yadav [18] utilized a hybrid Analytical Hierarchy Process (AHP) within a Pythagorean fuzzy environment, combined with the Weighted Aggregated Sum Product Assessment (WASPAS) approach, to develop a framework that identifies key enablers and performance metrics for circular supply chains in Indian manufacturing companies. Similarly, Bello and Mbhele [19] integrated Fuzzy-AHP to assess stakeholders’ decision-making activities concerning sustainable practices. Additionally, Wang et al. [20] applied a game theory-based model to determine optimal price, green decision, and supply chain profit in different scenarios. Probabilistic decision models have also been employed to optimize resource allocation and mitigate operational risks in sustainable supply chains. For instance, Wang and Su [21] applied a very flexible sine cosine Weibull distribution (SCVF-Weibull) and performed simulation studies that explored a range of combinations of parameter values to evaluate probability distributions in financial and supply chain management. However, these methods often struggle to reconcile the diverse preferences and conflicting interests of multiple stakeholders within the ethanol supply chain.
According to Karuppiah et al. [22], environmental regulations and the need for resilient supply chains have driven the adoption of circular economy (CE) practices, with digitalization playing a key role. Using Delphi, Fermatean Fuzzy sets, AHP, and DEMATEL methods, the study identified critical success factors—such as smart work environments and data reliability—and strategies like data-driven optimization to support supply chain 4.0. It also emphasized how integrating CE principles into digital strategies can enhance sustainability in the Indian electronics industry. Moreover, although the CE framework has gained traction across various industries, there is still a limited body of research that effectively integrates circular strategies with supply chain resilience models, particularly in the bioethanol sector. As pointed out by [23,24], many renewable energy supply chains are still vulnerable to disruption and lack the circular mechanisms necessary to reinforce their resilience. The material cycles proposed by CE can only be effectively closed if renewable energy production systems—including bioethanol—also adopt circular strategies to withstand external shocks [25].
Moreover, Koppiahraj et al. [26] identified and evaluated sustainability assessment (SA) methods and critical factors of sustainable manufacturing (SM) by combining expert input and literature review. Using Fuzzy AHP and Fuzzy MULTIMOORA, the authors ranked 10 SA methods based on 20 critical SM factors, with validation through a case study in India’s leather processing industry. Results show the Index of Social Progress and Social Life Cycle Assessment as the top SA methods, while key SM factors include alternative raw materials, methane mitigation, and re-utilization. Furthermore, complex decision-making problems in supply chain management often involve multiple stakeholders, uncertain alternatives, and conflicting criteria. In this regard, Problem Structuring Methods (PSMs) and Group Decision-Making (GDM) models are essential to adequately capture and reconcile different perspectives. While some studies address these dimensions in the context of fuels and biofuels [27,28], there is a notable gap in models that combine probabilistic reasoning, circular economy, and group decision making in the specific context of Brazil’s sugarcane-based ethanol sector.
The present study seeks to address that gap by proposing an innovative group decision-support framework that integrates Strategic Options Development and Analysis (SODA), the Composition of Probabilistic Preferences (CPP), and the Rank-Order Centroid (ROC) method to evaluate and rank circular strategies for supply chain resilience under uncertainty. This combination allows for a transparent, structured, and stakeholder-oriented analysis of complex trade-offs in the ethanol supply chain.
In this sense, the objectives of this research are threefold:
- To structure and evaluate circular strategies through stakeholder engagement using SODA;
- To develop and apply CPP-ROC for integrating stakeholder preferences and modeling uncertainty in group decision making;
- To provide robust and actionable insights for policymakers and managers in the ethanol industry, supporting Brazil’s transition toward a more circular and resilient bioeconomy.
The paper is structured into six sections. The first section introduces the topic. The second section reviews the relevant literature. The third section outlines the proposed approach, detailing the application for adaptation of the cited methods to achieve the study’s objectives. The fourth and fifth sections present the results and discussion, respectively. Lastly, the sixth section offers the concluding remarks.
2. Literature Review
2.1. Vulnerabilities in Biofuel Supply Chains
Biofuel supply chains face complex operational environments shaped by uncertainty, resource dependence, and environmental pressures. Several studies have emphasized the inherent vulnerability of biofuel networks due to factors such as climate variability, biomass availability, and logistical constraints [4,5,8]. These vulnerabilities can compromise supply reliability and increase systemic risk across upstream and downstream segments of the supply chain.
The literature on Biofuel Supply Chain Networks (BSCNs) addresses these issues by exploring risk-aware network design and resilience strategies. For instance, Wang et al. and Machado and Abreu discussed how fluctuations in input prices, transport limitations, and infrastructure gaps can lead to cascading effects throughout the ethanol production chain [11,20]. These risks are further compounded in tropical agriculture, where biomass yields and harvesting windows are increasingly affected by extreme weather events [1,2].
In this context, resilience becomes a critical capability for biofuel supply chains. It enables systems to absorb shocks, maintain function, and recover quickly. However, the literature also shows that resilience is rarely treated in conjunction with long-term sustainability—a gap that becomes even more relevant when circular strategies are considered [29,30].
2.2. Resilient Biofuel Supply Chain Design
The optimal design of a biofuel supply chain network (BSCN) must manage flows from feedstock acquisition to biofuel distribution while incorporating disruptions and uncertainties [23]. A resilient system is better equipped to handle variability, reduce vulnerability, and sustain performance during shocks [8]. The literature offers models for improving supply chain resilience (SCR) in networks based on diverse feedstocks, such as lignocellulosic biomass [4,5,8,31,32], municipal waste [29], palm oil [23], and sugarcane [1,2]. Importantly, resilience and sustainability must be addressed together. While resilience emphasizes recovery and robustness, sustainability seeks long-term environmental and social impact mitigation. Integrating both is essential for designing efficient and adaptive BSCNs [29,30].
2.3. Circular Economy Applications in Bioenergy Systems
The circular economy (CE) provides a systemic framework to reduce resource dependency and promote regenerative flows. Its relevance in biofuel production lies in the valorization of waste, optimization of inputs, and reduction in environmental impacts [15,16,17]. CE-based strategies, such as closed-loop processes, biogas generation, and use of agricultural residues, have been proposed to enhance both sustainability and resilience in agro-industrial supply chains [15,16]. However, as noted by Costa et al. [23] and Suryawanshi and Dutta [24], there remains a lack of integration between CE principles and resilience planning in renewable energy supply chains. The successful closure of material loops in CE depends on the ability of production and distribution systems to withstand disruptions—a connection not yet fully explored in the biofuel literature [25].
2.4. Decision Models for Sustainable and Resilient Supply Chains
Various structured approaches support complex planning under uncertainty. Multi-Criteria Decision-Making (MCDM) methods evaluate alternatives with conflicting objectives. Vyas and Yadav [18] used a hybrid AHP-WASPAS model in a Fuzzy environment for circular supply chains in India, while Bello and Mbhele [19] applied Fuzzy-AHP to assess sustainability trade-offs in rice farming. Game theory approaches can also optimize green decisions and supply chain profits [20].
Probabilistic modeling captures uncertainty and subjectivity. Wang and Su [21] modeled parameter combinations using a sine cosine Weibull distribution in supply chain and financial contexts. These models often lack integration with group dynamics and decision-maker heterogeneity, particularly in biofuel contexts with diverse stakeholders [22].
Although studies have addressed aspects of CE, supply chain resilience, and MCDM, few works offer integrated decision models that combine these dimensions in a group setting under uncertainty. Moreover, there is no known application of such integration tailored specifically to the Brazilian sugarcane-based ethanol supply chain, where decision makers operate under real trade-offs between economic, environmental, and social objectives.
This study aims to address that gap by proposing a novel decision-support model that integrates Strategic Options Development and Analysis (SODA), the Composition of Probabilistic Preferences (CPP), and the Rank-Order Centroid (ROC) technique [26,27,28,33]. This combination enables stakeholder-driven evaluation of circular strategies for ethanol supply chain resilience, incorporating both group preferences and uncertainty into the decision process.
3. Proposed Approach
3.1. Theoretical Basis and Method Selection
The selection of SODA, CPP, and ROC is grounded in their collective ability to support participatory decision making under uncertainty, with a high degree of flexibility, transparency, and stakeholder engagement.
SODA is a problem-structuring method that facilitates the articulation of mental models among decision makers through cognitive mapping [34]. It is particularly suitable for complex environments with multiple actors and qualitative dimensions—such as the ethanol supply chain—where shared understanding and negotiation of objectives are crucial.
CPP (Composition of Probabilistic Preferences) enables the integration of individual preferences using probability distributions over criteria weights rather than fixed deterministic values. This is especially valuable in real-world decision environments where stakeholders express uncertain, subjective, or imprecise judgments [35].
ROC (Rank-Order Centroid) is a weighting method that simplifies the translation of ordinal preferences into quantitative weights with minimal cognitive burden on decision makers [36]. Compared to techniques such as AHP or pairwise comparisons, ROC reduces inconsistency risks and is more scalable when many criteria are involved.
The integration of these three methods offers distinct advantages. First, it promotes participatory and transparent decision making, as stakeholders are actively engaged from the problem structuring phase to the final evaluation. Second, the model naturally accommodates uncertainty, allowing for hesitation and ambiguity in stakeholder input through probabilistic modeling. Third, it imposes a low cognitive load on decision makers, who are only required to provide ordinal rankings—unlike AHP or Delphi approaches that rely on intensive pairwise comparisons. Finally, the framework is methodologically flexible and scalable, enabling future expansions in the number of decision makers, criteria, or alternative scenarios without significant increases in model complexity. These strengths make the approach especially suitable for multi-actor environments such as the bioethanol supply chain, where decisions must be both technically grounded and socially legitimate [18,19,20,21,22].
3.2. Methodological Phases
The proposed approach in this study comprises four distinct phases, systematically structured to guide the research process, as illustrated in Figure 1. A detailed explanation of each phase is provided in the following sections.
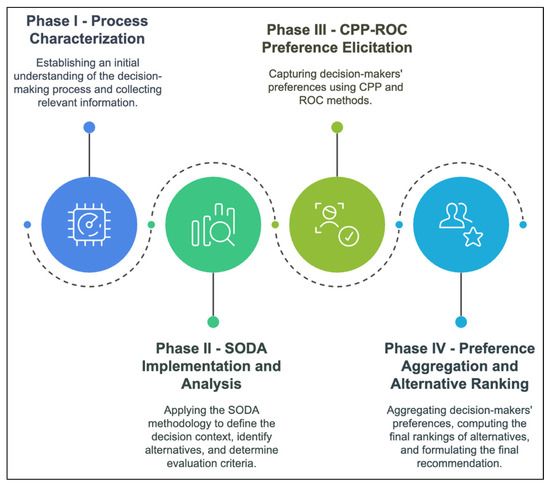
Figure 1.
Proposed Approach.
3.3. Phase I—Process Characterization
The first phase aims to establish a comprehensive understanding of the decision-making process and gather all relevant information. This involves defining the decision context (e.g., problematic and multicriteria method definition), identifying key actors (e.g., decision makers and analyst), delineating the problem scope, and outlining the main objectives.
Stakeholder engagement is crucial at this stage to incorporate diverse perspectives and concerns, particularly when addressing conflicting objectives and inherent uncertainties of the decision-making process. In most real-world problems, stakeholders possess varying priorities and preferences, which may lead to trade-offs between competing goals. These conflicting objectives must be carefully analyzed to achieve a balanced and acceptable solution for the group.
To establish a robust foundation for the decision-making model, both qualitative and quantitative data are collected. Qualitative data, obtained through unstructured interviews help capture subjective aspects of the problem, such as stakeholder perceptions, perspectives, and concerns. This type of data is crucial for understanding the contextual nuances that influence decision making. On the other hand, quantitative data, gathered from shop-floor historical records, provide objective metrics that enhance the reliability of the decision framework. Combining these two types of data allows for a comprehensive assessment.
By the end of this phase, there is a clear understanding of the problem, setting the stage for effectively structuring the decision-making process.
3.4. Phase II—SODA Implementation and Analysis
The second phase involves the application of Strategic Options Development and Analysis (SODA) [34]. The implementation of SODA follows a structured sequence of steps.
Initially, planning meetings are conducted with decision makers (DMs) and the analysts to outline the problem context and expected outcomes. Subsequently, the DMs develop a group cognitive map collaboratively with the support of the analyst [37].
According to Eden and Ackermann, cognitive maps consist of hierarchical constructs interconnected by directional links, which reflect the value systems and perceptions of the DMs regarding the problem under investigation [34]. These constructs are derived from Primary Elements of Evaluation (PEA), which represent fundamental perspectives of the DMs. Each construct is complemented by a negative pole, symbolizing an opposing viewpoint or consequence, forming a comprehensive conceptual framework.
The analyst consolidates individual perspectives into a global map that encapsulates the collective perspectives of all DMs [35]. This global map is iteratively refined through workshops, ensuring its accuracy and representativeness [36]. The resulting global map is subjected to an analytical framework based on the categorization of six types of constructs [35,38]:
- Tail constructs: represent the root causes of the problem situation, characterized by the absence of incoming arrows;
- Head constructs: denote goals, outcomes, or consequences that arise from preceding constructs, characterized by the absence of outgoing arrows;
- Implosions: constructs influenced by multiple preceding constructs, meaning a significant effect with broad-reaching implications;
- Explosions: constructs exerting influence over multiple subsequent constructs, indicating a major causal factor;
- Dominants: constructs exhibiting the highest number of both incoming and outgoing connections, indicating key leverage points for addressing the problem.
The next analytical step involves defining alternatives and attributes through strategic map evaluation. Dominant and explosion constructs are used to identify alternatives and criteria, respectively, while other constructs provide deeper implications into the problem context.
The DMs, with analyst support, create an evaluation matrix of criteria versus alternatives and their consequences. This matrix is statistically tested to find the best-fitting probability distribution. Concurrently, DMs use a Likert scale to assess preferences, resulting in another matrix. Based on the statistical test results, normalization of the DMs’ matrix values may be required.
3.5. Phase III—CPP-ROC Preference Elicitation
In this phase, we introduce a novel method for group decision making, namely the CPP-ROC for Group Decision-Making method, which follows a structured multi-step approach to ensure a rigorous and well-founded decision process. This method integrates the Composition of Probabilistic Preferences (CPP) [39] with the Rank-Order Centroid (ROC) procedure [40], combining probabilistic modeling with a systematic weighting approach to effectively capture decision makers’ preferences and their attitudes toward risk.
Decision makers first provide ranked preferences for each evaluation criterion, which are then used in the ROC method to derive priority weights (see Section 3.5.1). The CPP method is applied to model probabilistic preferences, incorporating uncertainty into the decision-making process (see Section 3.5.2). The result is a structured representation of individual preferences that will be used in the aggregation and ranking phases (see Section 3.6.1 and Section 3.6.2). All the notation used is presented in Table 1.

Table 1.
Notations Used.
3.5.1. Step 1: Elicitation of Weights Using the Rank-Order Centroid (ROC) Method
The objective is to determine the weights of the criteria denoted by for each decision maker.
The procedure is as follows:
- Ranking of criteria: Each decision maker ranks the criteria in order of importance. Let denote the rank of criterion , where is the most important, and is the least important, as in Equation (1):
- Calculation using ROC: the ROC method calculates the weight for each criterion and decision maker separately, as in Equation (2):
This ensures the following in Equation (3):
The outcome is that weights for each criterion are assigned, reflecting their relative importance in the decision-making process.
3.5.2. Step 2: Calculation of Probabilities for Each Alternative
The objective is as follows: Let be the set of alternatives. We aim to compute the probabilities that an alternative is the best Equation (4) or the worst Equation (5) for each decision maker and for each criterion.
The procedure is as follows:
- Probability of being the best :
- Probability of being the worst :
The outcome is that the probabilities and are computed for each alternative and decision maker .
3.6. Phase IV—Preference Aggregation and Alternative Ranking
The final phase involves aggregating individual preferences (see Section 3.6.1) and generating the final ranking of alternatives (see Section 3.6.2). First, the individual preference weights obtained in the previous phase are combined with the probabilities using the Additive Scoring System (ASS) proposed by Raiffa [41], which is an appropriate aggregation method that ensures fairness and accounts for group consensus. Next, the DMs select their decision profiles from Table 2. The CPP method is then applied to compute overall probabilistic preferences for each alternative, allowing for a ranking that considers both preference intensity and uncertainty.
Table 2.
Decision profiles. Source: Adapted from [42].
3.6.1. Step 1: Aggregation of Preferences Using CPP-ROC
The objective is to aggregate the preferences of multiple decision makers into overall probabilities for each alternative, incorporating the criteria weights as in Equations (6) and (7).
The procedure is as follows:
- Aggregated probability of being the best ():
- Aggregated probability of being the worst ():
The outcome is that each alternative is assigned two aggregated probabilities:
- indicates its overall chance of being the best;
- indicates its overall chance of being the worst.
In the Choice Problematic, where one wants to select just one alternative within the entire set of alternatives, the alternative with the highest aggregated probability of being the best () will be selected as the final alternative to be recommended, as in Equation (8):
The outcome for the Choice Problematic is the selection of alternative with the highest aggregated probability of being the best according to the decision makers’ preferences and, similarly, the possibility that the alternative with the lowest aggregated probability of being the worst () will be selected as the final alternative to be recommended, as in Equation (9):
The outcome for the Choice Problematic is the selection of alternative with the lowest aggregated probability of being the worst according to the decision makers’ preferences.
3.6.2. Step 2: Ranking of Alternatives Based on Aggregated Probabilities and Decision Profiles
The objective is to generate a ranking of alternatives (Ranking Problematic) based on the aggregated probabilities rather than selecting a single final alternative, incorporating the decision profiles adopted by decision makers as in Table 2.
The procedure is as follows:
- Profiles of decision makers: After calculating and , we may compute the following decision profiles (Equations (10)–(13)) for each alternative based on what the decision makers have chosen from Table 1:
- ○
- Optimistic/progressive (OP):
- ○
- Optimistic/conservative (OC):
- ○
- Pessimistic/progressive (PPe):
- ○
- Pessimistic/conservative (PC):
- Aggregating decision profiles: Once the profiles are computed, we aggregate them across criteria as in Equations (14)–(17):
- Ranking of alternatives: The alternatives are then ranked based on each of the profiles. For instance, ranking based on would give us Equation (18):where represents the alternative with the highest optimistic/progressive evaluation. Similarly, alternatives can be ranked based on , , and depending on the decision maker’s risk preference.
The outcome is that a ranking of alternatives is generated based on different decision profiles, reflecting multiple perspectives of risk and preference.
After this, a sensitivity analysis is conducted to examine how variations in criteria affect the ranking, ensuring robustness in the final decision. Finally, the decision makers receive a structured recommendation, along with insights into the trade-offs between alternatives, supporting an informed and justifiable decision-making process.
4. Results
4.1. Phase I—Process Characterization
This phase aimed to establish a structured understanding of the ethanol supply chain, identifying key stakeholders and operational dynamics. The analysis revealed two decision makers (DM) and one analyst. DM1, representing the focal company of the ethanol supply chain, prioritizes operational efficiency, cost reduction, and competitive advantage, whereas DM2, as the farmers’ association representative, emphasizes sustainability, benefits for small producers, and agricultural stability.
The DMs were characterized by having a compensatory rationality, indicating that a weak evaluation in one criterion for one alternative could be compensated by a good evaluation in another criterion. Moreover, given the inherent uncertainties in evaluating CE strategies to strengthen the resilience of the ethanol supply chain, the CPP-ROC for Group Decision-Making method was selected as the most appropriate approach.
A detailed supply chain characterization was conducted to capture the dependencies and challenges associated with implementing CE strategies. This characterization included an assessment of material flows, economic dependencies, and environmental constraints that impact decision making.
The operations of biofuel supply chains can be categorized into three main segments. The upstream segment encompasses all activities from biomass production to its delivery to biorefineries, including cultivation, harvesting, collection, pre-processing, and storage. The midstream segment refers exclusively to the conversion of biomass into biofuel within biorefineries. Finally, the downstream segment involves the storage and distribution of biofuel to end customers [2,4].
Figure 2 summarizes the sugarcane-based ethanol process at the company studied, which includes the following:
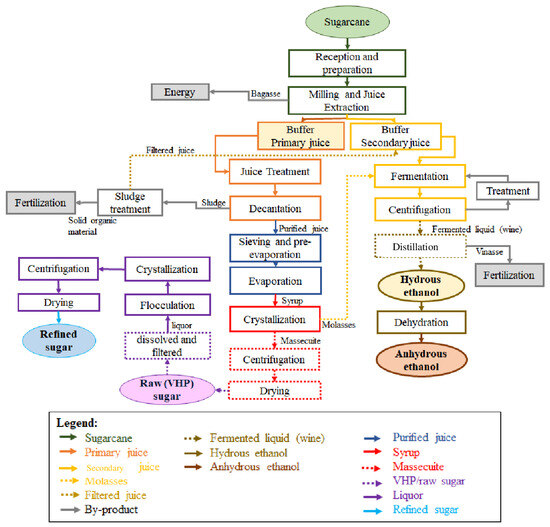
Figure 2.
Sugarcane-based ethanol process.
Reception and preparation of raw materials: The production process begins with the reception of sugarcane at the industry. Depending on the type of harvest, the preparation differs. Sugarcane harvested mechanically is sent directly to the milling process. However, manually harvested sugarcane undergoes a washing stage to remove foreign matter such as sand, ash, and other impurities before further processing.
Milling and juice extraction: Once prepared, the sugarcane is washed, chopped, and crushed by mills to extract the juice. The fibrous residue, referred to as bagasse, is separated and utilized as a fuel source for boilers. The initial pressing of sugarcane in the first mill produces the primary juice, which exhibits a higher sucrose concentration and is mainly utilized in sugar production. From the second mill onward, the process yields mixed (or secondary) juice, characterized by a reduced sucrose content. To enhance juice extraction efficiency, soaking water is added in the final mill and progressively transferred back to the previous mills until reaching the second mill. The mixed juice is then directed to the distillery for ethanol production.
Juice treatment, purification, and evaporation: The extracted juice contains impurities that must be removed before further processing. This is achieved through filtration, heating, and the addition of sulfur dioxide (SO2), which neutralizes acidity and facilitates the removal of non-sugar components. Once purified, the juice undergoes evaporation to concentrate it into a syrup, which serves as the base for sugar crystallization.
Raw sugar production: The concentrated syrup is seeded with sugar crystals and cooled under control to promote crystallization. The resulting mixture, known as massecuite, is subjected to centrifugation, which separates the sugar crystals from the remaining liquid (molasses). Molasses can be further processed for ethanol production. The crystallized mass obtained from centrifugation is called very-high-polarization (VHP) sugar, a raw sugar type with a high sucrose content that is used as a precursor for refined sugar. The raw sugar is then dried to reduce moisture and stored before undergoing further refining processes.
Sugar-refining production: Raw sugar is dissolved and filtered to remove any remaining impurities. The resulting liquor is clarified through flocculation, achieved by adding phosphoric acid. This step removes residual impurities before pH neutralization using saccharate. Subsequently, the sugar undergoes re-crystallization, yielding high-purity white sugar. The refined sugar is then dried, sieved for uniform granulation, and packaged for commercial distribution.
Ethanol production: Ethanol is produced from secondary juice, molasses, and filtrated juice through fermentation using Saccharomyces cerevisiae yeast. During fermentation, sugars are converted into ethanol and carbon dioxide. The fermented liquid, or wine, is separated from yeast via centrifugation. The yeast is treated for reuse in subsequent fermentation cycles, while the wine proceeds to distillation. Distillation isolates ethanol from water and impurities, producing hydrous ethanol. This ethanol can be further dehydrated to yield anhydrous ethanol, which is suitable for fuel applications.
By-products and sustainability: Several by-products of sugarcane processing contribute to sustainability. Bagasse is repurposed for energy generation, typically fueling boilers to support industrial operations. Vinasse, a by-product of ethanol distillation, is rich in organic matter and minerals, making it an effective fertilizer for sugarcane fields.
4.2. Phase II—SODA Implementation and Analysis
This section describes the cognitive mapping process conducted using the Strategic Options Development and Analysis (SODA) methodology. The Decision Explorer Application version 3.4.0/2015, developed by Banxia Software version 3.4.0/2015 (https://banxia.com/downloads/, accessed on 15 January 2025), was employed to construct and analyze the global cognitive map.
The cognitive mapping process was conducted jointly with both decision makers (DMs) in collaborative workshops. These workshops aimed to develop a shared understanding of CE strategies relevant to strengthening the resilience of the ethanol supply chain. The map was refined iteratively until both DMs were satisfied with the representation of their perspectives and priorities.
DM1 represents the focal company within the sugarcane supply chain, responsible for ethanol and sugar production, with a primary focus on operational efficiency, regulatory compliance, and economic feasibility. DM2 represents the sugarcane farmers’ association in the region, advocating for sustainable farming practices, environmental responsibility, and fair economic returns for producers.
The guiding question for the cognitive mapping process was “What circular strategies are relevant for making the ethanol supply chain resilient?”
During the workshops, both decision makers contributed to defining Primary Elements of Evaluation (PEAs) that encapsulated essential concepts for achieving circularity and resilience in ethanol production. These EPAs were refined through discussions and structured to ensure their alignment with the decision-making process. The final EPAs identified were the following:
- Optimization of resource efficiency;
- Water reuse;
- Enhancement of waste valorization;
- By-product recovery;
- Adoption of renewable energy;
- Clean technologies;
- Economic feasibility;
- Investment in circular strategies;
- Strong partnerships;
- Capacity building;
- Workforce training.
Each EPA was further elaborated into conceptual constructs with contrasting poles to ensure clarity. Some examples include the following:
- Optimization of resource efficiency … inefficient resource utilization;
- Water reuse … excessive water consumption;
- Enhancement of waste valorization … unexploited waste streams;
- By-product recovery … disposal of by-products;
- Adoption of renewable energy … reliance on fossil-based processes;
- Clean technologies … outdated and polluting technologies;
- Economic feasibility … unviable cost structures;
- Investment in circular strategies … lack of financial commitment;
- Strong partnerships … fragmented stakeholder relationships;
- Capacity building … lack of technical knowledge;
- Workforce training … insufficient skill development.
In these constructs, the “…” symbol represents “instead of” to highlight the contrasting poles effectively. Then, the analyst asked more questions about each construct to the DMs regarding how each construct could contribute to the resilience of ethanol supply chain, developing more constructs until the DMs felt satisfied by the context representation with their perspective in the cognitive map.
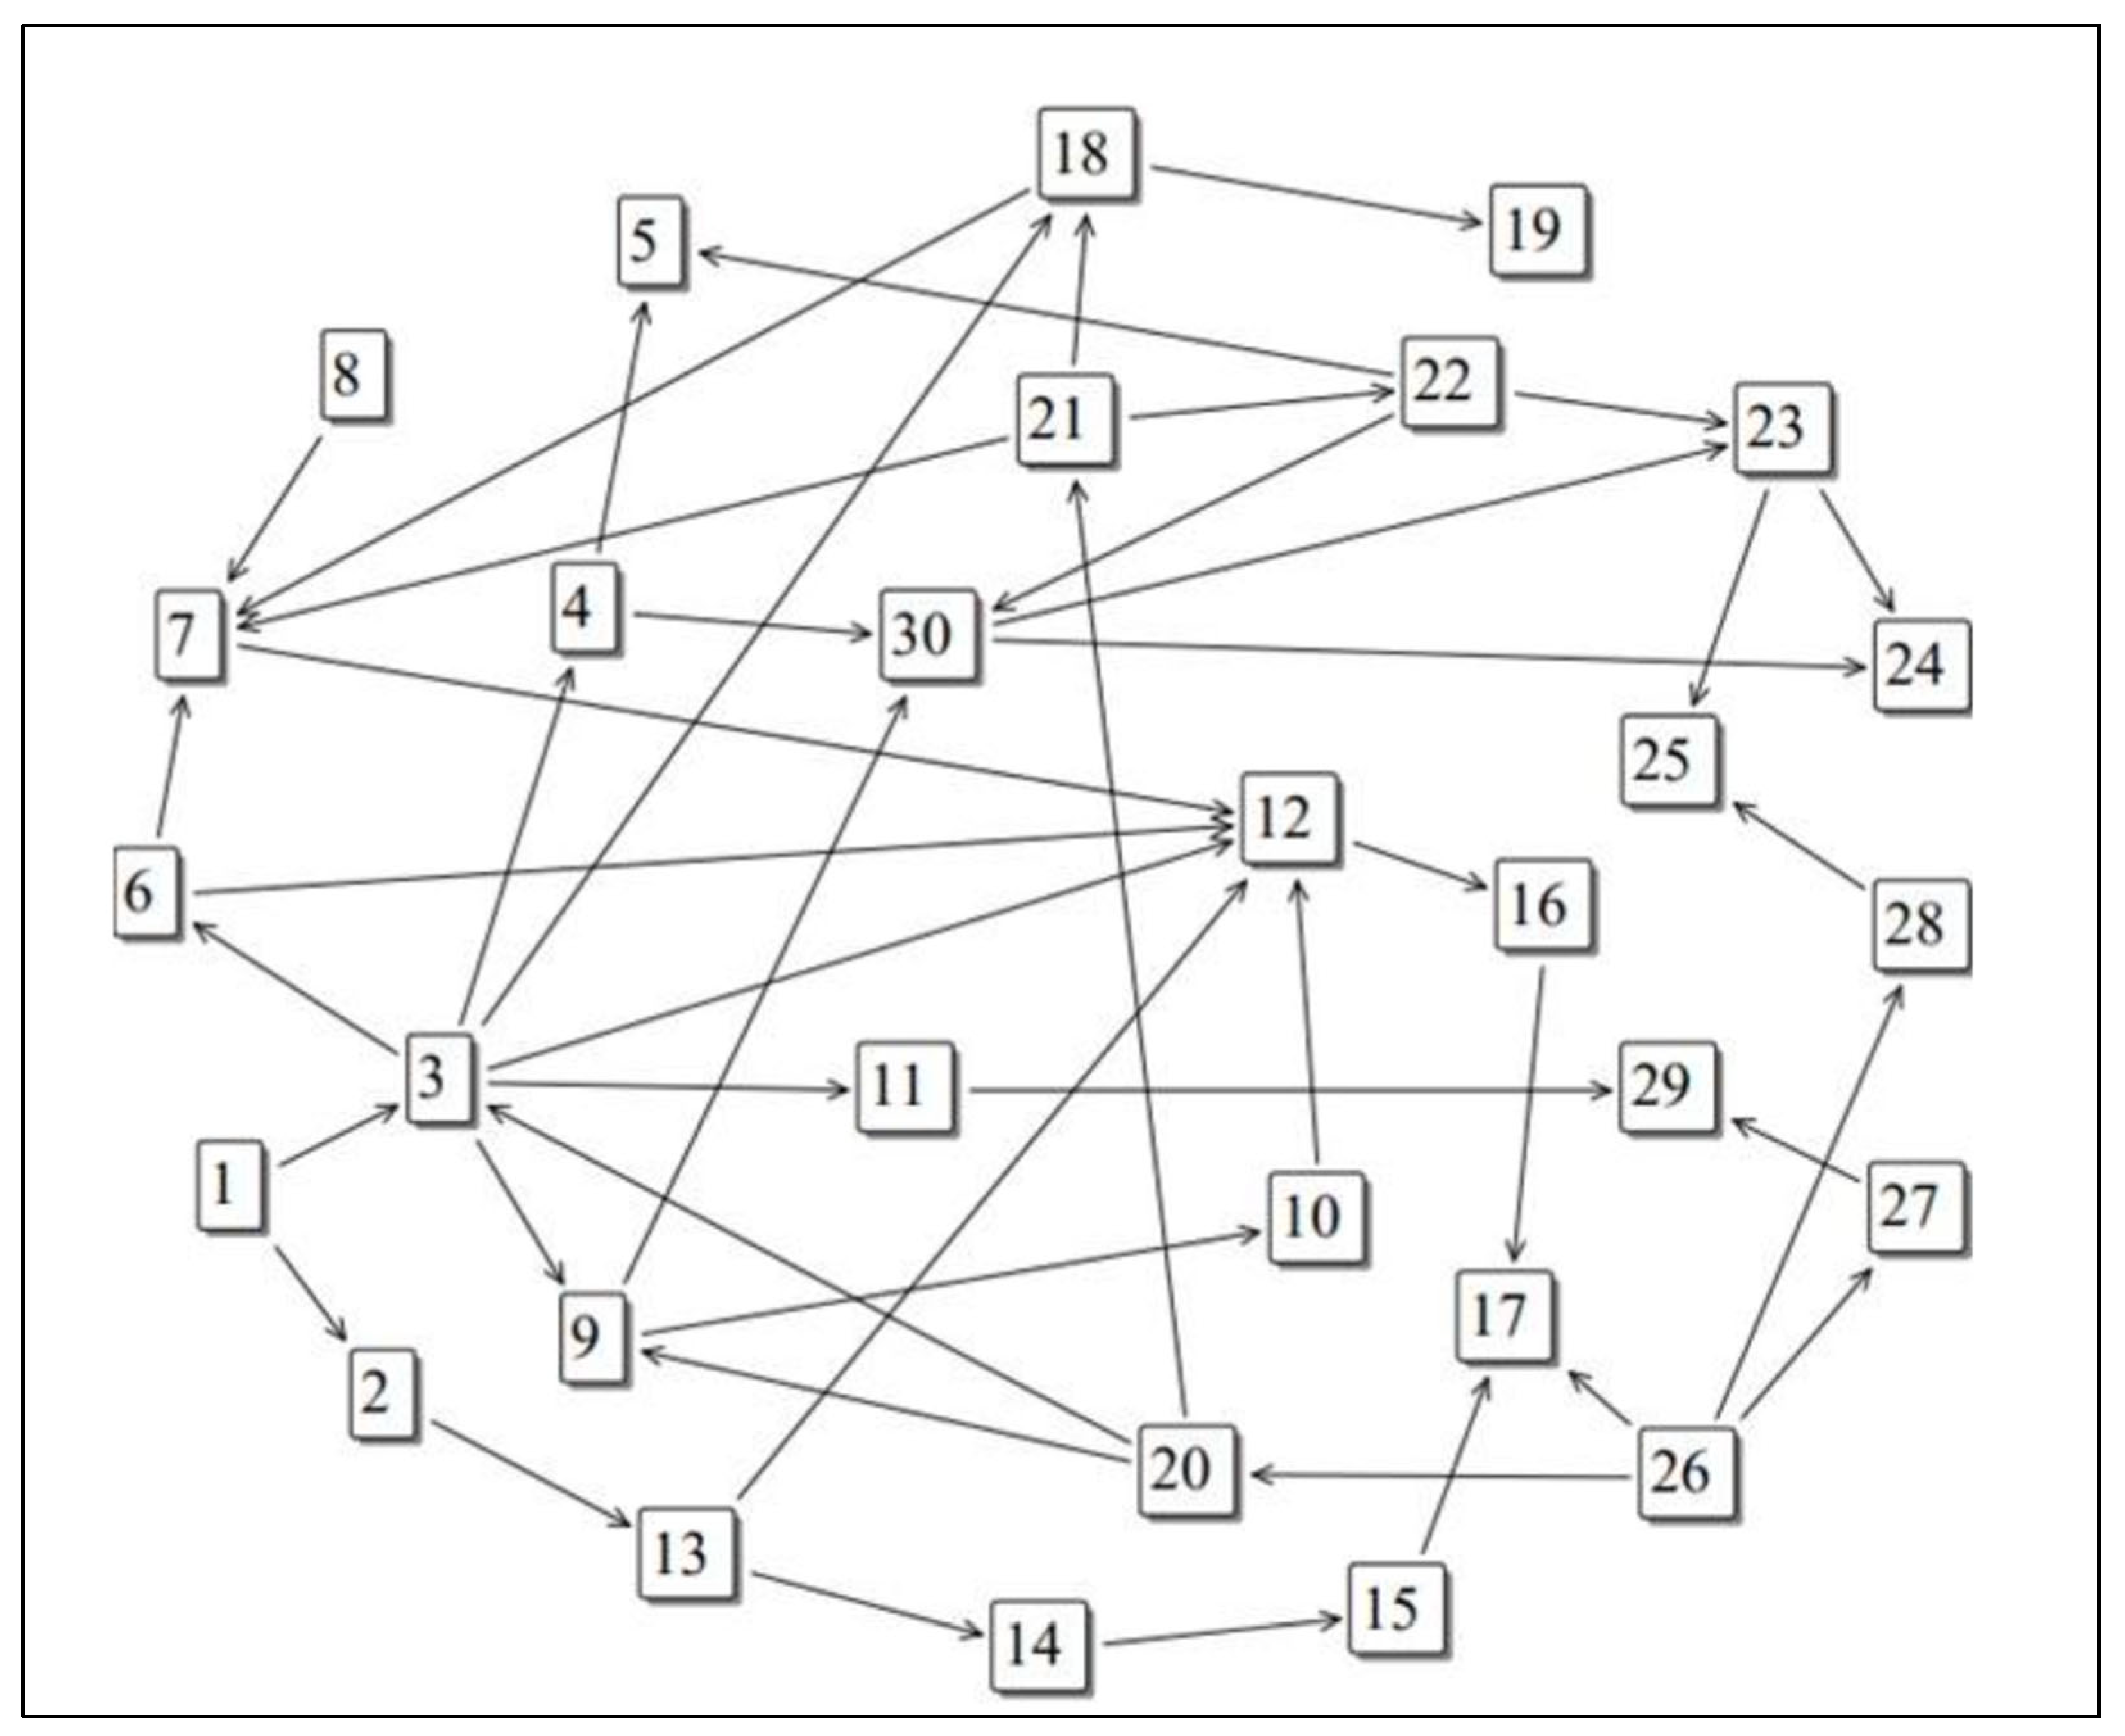
The hierarchy of these concepts was established through iterative discussions, where DMs identified causal relationships between them and used arrows to represent how each construct influenced the others. For instance, improving “Optimization of resource efficiency … inefficient resource utilization” was linked to “Economic feasibility … unviable cost structures”. The final global cognitive map encapsulated a holistic representation of the interdependencies between CE strategies and supply chain resilience in ethanol production (see Figure 3). A detailed description of each construct is presented in Table 3.
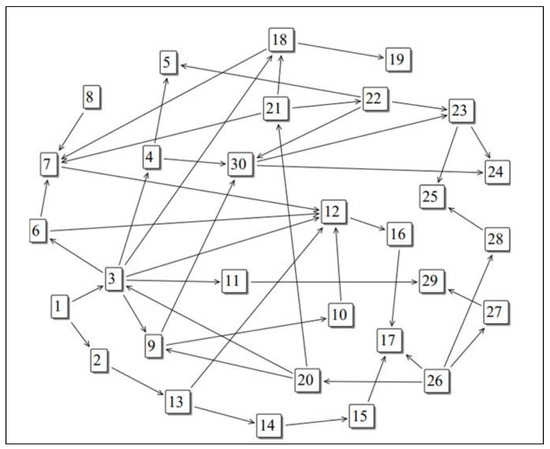
Figure 3.
Simplified version of the final global cognitive map.
Table 3.
Description of constructs and their classification.
This structured mapping provided a robust foundation for defining decision criteria and evaluating strategic alternatives within the group decision-making process. The Decision Explorer Software classified the constructs according to the definitions in Section 3.2, and the results are also presented in Table 3.
The constructs 3, 7, 9, 12, 18, 20, 21, 22, 23, 26, and 30 were classified as dominant. Subsequently, they were analyzed one by one, two by two, collectively, and exhaustively until we generated the list of alternatives that is shown in Table 4.
Table 4.
Description of Alternatives.
The constructs 3, 20, 21, 22, and 26 were classified as explosions. After that, they were analyzed one by one, two by two, collectively, and exhaustively with other constructs and their relationships with dominant constructs until we generated the list of criteria that is shown in Table 5.
Table 5.
Description of Criteria.
The other criteria were used to understand the whole context of the decision-making process and the DMs’ perspectives on it. The DMs gave positive feedback about the alternatives and criteria generated.
Moreover, the analyst elaborated an evaluation matrix of alternatives vs. criteria with evaluations for each alternative on each criterion based on market research and experts’ opinions, as is shown in Table 6.
Table 6.
Evaluation Matrix.
Simultaneously, DM1 and DM2 individually stated their preferences over the consequences for the alternative of each criterion in Table 6. For this purpose, the DMs have used a Likert scale of five points (1 = very poor, 2 = poor, 3 = neutral, 4 = good, and 5 = excellent) to assess their preferences. This assessment resulted in Table 7 for DM1 and DM2.
Table 7.
DMs’ preferences in Likert scale.
After this, we conducted a Kolmogorov–Smirnov (K-S) test using Table 6 to test its adherence to different probability distributions. The results are shown in Table 8.
Table 8.
Kolmogorov–Smirnov Test Results for Goodness-of-Fit Analysis.
The results in Table 8 indicate that both the Beta-PERT and Triangular distributions provide the best fit for most criteria, with p-values consistently above 0.05, thereby failing to reject H0. However, the Normal and Lognormal distributions show a poor fit across multiple criteria, with most p-values < 0.05, suggesting that they do not adequately capture the empirical data structure. These findings justify the use of the Beta-PERT or Triangular distributions in modeling the uncertainty of decision-making criteria within this study. We opted to use the Triangular distribution for modeling purposes. Moreover, we normalized the matrixes to encapsulate the Triangular distribution characteristics using Equation (19).
The results of the normalization process are shown in Table 9 for both DM1 and DM2.
Table 9.
Normalized values of Table 7.
After this, the CPP-ROC Preference Elicitation phase was conducted.
4.3. Phase III—CPP-ROC Preference Elicitation
The DMs made a ranking of their criteria using Equation (1), and with this information, we calculated the ROC weights by Equation (2), ensuring Equation (3). The results are shown in Table 10.
Table 10.
CPP-ROC weights.
It is important to mention that the DMs were able to assign a complete ranking of their criteria, with no indifference relationships between them.
Finally, in this phase, we calculated the probabilities of each alternative being the best and worst, as defined in Equations (4) and (5), respectively. These probabilities were used in Phase IV—preference aggregation and alternative ranking.
4.4. Phase IV—Preference Aggregation and Alternative Ranking
Initially, the aggregated probabilities of being the best and worst alternatives were calculated for each alternative using Equations (6) and (7). Next, since the problem involved ranking alternatives, the decision makers (DMs) defined their decision profiles based on Table 3.
Both DMs selected the pessimistic/progressive profile, and Equation (12) was then applied to calculate the values for each alternative. Subsequently, the decision profiles were aggregated by calculating the values using Equation (16), and finally, Equation (18) was used to generate the ranking of the alternatives. The final ranking is presented in Table 11.
Table 11.
Final ranking of alternatives.
Moreover, a sensitivity analysis was performed on the obtained ranking by generating variation scenarios for the ROC weights. The weights were individually altered by −5%, −10%, −15%, and −20% as well as +5%, +10%, +15%, and +20%. The results indicated ranking reversals only between alternatives ranked 12th and 13th and between ranks 17th and 18th in scenarios of −15%, −20%, +15%, and +20%.
The model’s robustness was assessed and found to be 95%, demonstrating its reliability and justifying the recommendation of the results to decision makers (DMs). Finally, the DMs provided positive feedback and expressed satisfaction with both the final ranking of alternatives and the developed model.
5. Discussion
The findings of this study provide valuable implications into the evaluation of CE strategies for enhancing the resilience of the ethanol supply chain. By integrating the perspectives of key stakeholders—representing both the focal company and sugarcane producers—the decision-making process accounted for multiple and sometimes conflicting priorities.
The application of Strategic Options Development and Analysis (SODA) significantly contributed to the development of resilient strategies for the ethanol supply chain. By promoting a structured and participatory approach, SODA enabled decision makers to collaboratively construct a shared cognitive map, fostering a deeper understanding of interdependencies and aligning perspectives in strategy formulation [43,44]. Guided by an analyst, all participants engaged in a structured mapping process that facilitated constructive discussions and ensured that diverse viewpoints were considered, exploring layers of each other’s thinking that often could not be easily accessed [45].
Furthermore, the joint construction of cognitive maps under SODA enhanced confidence in the final strategic output. Decision makers felt represented and recognized that the global map was built upon collective insights rather than individual preferences. This inclusive approach minimized resistance and increased acceptance of the final model, reinforcing the importance of participatory decision making [46,47]. Ultimately, SODA’s structured cognitive mapping approach played a vital role in strengthening commitment and coherence in strategies aimed at enhancing the ethanol supply chain’s resilience [48].
The proposal of the CPP-ROC for individual decision making for the choice and ranking problematic and its extension for the Group Decision-Making method facilitated a structured and compensatory evaluation, ensuring that trade-offs between economic feasibility, environmental sustainability, and operational efficiency were systematically addressed in the ranking of resilient strategies for the supply chain [49].
Unlike traditional MCDM approaches, such as the ones proposed by Monika and Gunjan [10] or Bello and Mbhele [19], which rely on deterministic or Fuzzy logic to structure sustainability decisions, the CPP-ROC method integrates probabilistic modeling of preferences. This offers greater transparency and flexibility in capturing uncertainty, especially relevant when reconciling conflicting stakeholder interests—a central aspect of the Brazilian ethanol supply chain.
The Triangular distribution was preferred in the CPP-ROC for Group Decision-Making model due to its simplicity, ease of parameter estimation, and computational efficiency. Unlike Beta-PERT, which requires an additional shape parameter and is computationally heavier, the Triangular distribution only needs a minimum, most likely, and maximum value—making it more intuitive for DMs in group settings. Empirical tests showed that both distributions fit the data well (p-value > 0.05), but Triangular offers clearer interpretability, facilitating DMs discussions. Additionally, its piecewise linear structure ensures fast sampling in simulations, making it a pragmatic choice when balancing empirical validity, efficiency, and transparency [50].
Additionally, our findings reinforce and operationalize earlier theoretical insights. Costa et al. [23] highlighted the critical role of climate adaptation in sugarcane systems, and Suryawanshi and Dutta [24] emphasized the potential of waste valorization and traceability in circular systems. However, unlike these studies, our approach enables the prioritization of such strategies using an integrated decision model under uncertainty—filling a methodological gap noted in the CE and supply chain literature.
The analysis of the final ranking of alternatives highlights how the criteria prioritized by the decision makers (DMs) influenced the hierarchy of strategies for strengthening the resilience of the ethanol supply chain. The top-ranked alternative (A14—Climate risk modeling) suggests that both decision makers recognized climate resilience as a critical factor for the sustainability of ethanol production, emphasizing the need to use artificial intelligence to predict climate impacts and adapt agricultural and industrial operations. The strong prioritization of this alternative can be attributed to the fact that DM2, representing farmers, directly faces climate change challenges, while DM1, as the focal company, also seeks to mitigate operational risks resulting from extreme weather events [51].
The second position was occupied by A12—Biogas use, reflecting a convergence of interests between decision makers regarding the reduction of dependence on fossil fuels and the use of waste as an energy source [52]. This result reinforces alignment with strategies for decarbonizing production, which is relevant both for the economic and regulatory feasibility advocated by DM1 and for the environmental sustainability promoted by DM2.
This finding resonates with broader CE literature, such as that of Suryawanshi and Dutta [24], who recognized the dual role of biogas in energy transition and waste valorization—although our study uniquely positions it in a multi-stakeholder ranking context with explicit trade-off modeling.
In third place, A17—Blockchain traceability indicates that transparency in the supply chain and traceability of inputs and products are strategic aspects valued by the DMs, possibly due to increasing market demands for environmental and social certifications, which can add value to sustainable ethanol [53]. The presence of A16—Environmental certifications in fourth place reinforces this argument, highlighting the concern with differentiating ethanol in the international market through the acquisition of environmental certifications [54]. This aspect is particularly relevant for DM1, which can gain competitive advantages by accessing more demanding markets.
In fifth place, A9—Waste reduction signals the importance given to resource efficiency and waste minimization, aligning with the CE logic and being a beneficial strategy for both rural producers and the industry [55]. In the middle of the ranking, alternatives such as A5—Efficient irrigation, A2—Reuse of by-products, and A6—Genetic improvement appear, which, although important, may have been considered as having a more localized impact or being of a short-term priority [56]. The intermediate classification of these alternatives may indicate that, while they bring environmental and productivity benefits, their implementation may be perceived as more complex or costly, reducing their attractiveness from the decision-makers’ perspective [57].
The lower-ranked alternatives, such as A20—Education and training, A19—Microdistilleries, and A4—Logistics optimization, suggest that aspects related to workforce training and the structuring of decentralized production models were not perceived as priorities by the DMs since these alternatives are already being put into practice so the ethanol supply chain complies with the Brazilian legislation of ethanol production [58,59].
The sensitivity analysis conducted showed that the model is robust, being assertive in 95% of the simulations made with the variations of the criteria weights [60]. This result implies that both the proposition of the new method and the development of the model introduced a few inconsistencies into the decision-making process.
Furthermore, while studies such as Wang and Su [21] have provided valuable probabilistic modeling in supply chain contexts, our study advances this line by linking probabilistic reasoning with participatory modeling and stakeholder-based trade-offs. This reinforces the practical decision support capacity of the proposed model—something not commonly addressed in the current CE literature.
These results underscore the critical importance of strategic planning that effectively balances economic efficiency, technological innovation, and environmental sustainability [61,62,63,64]. The emphasis on climate risk modeling, biogas use, and blockchain traceability suggests that strategic planning can not only enhance long-term resilience and competitiveness but also mitigate climate vulnerabilities and promote the value of sustainable ethanol in the global market. The adoption of these alternatives can play a pivotal role in transitioning the Brazilian ethanol supply chain to a more circular and resilient model, ensuring its sustainability and adaptability in the face of future challenges.
6. Conclusions
This study successfully developed a structured decision-making framework to prioritize circular strategies for enhancing the resilience of the ethanol supply chain. By integrating Strategic Options Development and Analysis (SODA) with the CPP-ROC for Group Decision-Making method, the approach balances multiple criteria and stakeholder preferences, ensuring a probabilistic and mathematically consistent evaluation of alternatives.
The prioritization of strategies such as climate risk modeling, biogas utilization, and blockchain-based traceability underscores the sector’s increasing alignment with sustainability goals, waste valorization, and transparency across the supply chain. Conversely, the lower ranking of alternatives such as microdistilleries and decentralized models reflects the pragmatic prioritization of immediate operational concerns over long-term capacity-building efforts.
From a theoretical standpoint, this research contributes to the relatively underexplored literature on bioethanol supply chain resilience—particularly in the Brazilian context—by introducing a structured, participatory, and probabilistic decision-support model. The integration of economic, environmental, social, and operational dimensions in a single framework demonstrates the potential of circular economy (CE) strategies to address complex supply chain challenges. Furthermore, the group CPP-ROC method advances multi-criteria decision making by incorporating uncertainty in a transparent and flexible way, making it a promising tool for real-world decision scenarios.
From a managerial perspective, the results offer valuable guidance to ethanol supply chain actors by identifying high-impact solutions, such as climate adaptation, renewable energy integration, and digital traceability. The probabilistic ranking produced by the model enables scenario-based planning and supports more adaptive, risk-aware decision-making in dynamic environments.
Socially, this study highlights the role of CE strategies in reducing environmental impact, improving resource efficiency, and enhancing the sustainability profile of ethanol. The prominence of environmental certifications among the prioritized alternatives also points to the industry’s growing attention to global competitiveness and alignment with sustainability standards.
Nonetheless, this study has some inherent limitations. The model was applied to a specific sectoral and geographic context—the northeast region of Brazilian sugarcane-based ethanol supply chain—which may influence the transferability of findings to other industries or regions. In addition, while the method is robust, it relies on structured elicitation processes and the lack of an integrated computational tool with an intuitive interface could help to make the decision-making process faster.
Future research may explore several directions. One avenue includes adapting and applying this framework in other bioeconomy sectors or in different countries, allowing comparative analysis across supply chain typologies. Another promising direction lies in the development of digital platforms or decision support systems that could automate the group CPP-ROC process and make it more accessible for broader managerial use. The integration of real-time data, scenario simulations, or artificial intelligence could also enhance the framework’s responsiveness and strategic applicability.
In conclusion, the findings reinforce the importance of adopting a holistic, structured approach to CE strategy implementation—one that leverages participatory decision making, embraces uncertainty, and aligns operational priorities with long-term sustainability goals.
Implications for Policy and Practice
This study offers several implications for both public policy and supply chain management practice. From a policy perspective, the high prioritization of strategies such as climate risk modeling, biogas utilization, and blockchain traceability suggests the need for regulatory frameworks that incentivize technological innovation, climate adaptation, and transparency across the ethanol sector.
First, policymakers should consider integrating climate intelligence systems into national bioenergy planning tools, enabling producers to access climate forecasts and risk maps to support adaptive decision making. The inclusion of artificial intelligence in agricultural zoning tools could be an effective mechanism to promote resilience in sugarcane-based ethanol production.
Second, to promote circularity, public incentives and credit lines could be targeted toward the adoption of biogas technologies—particularly among small- and medium-sized producers. Facilitating the recovery of energy from agro-industrial waste can reduce fossil fuel dependency and contribute to national decarbonization targets.
Third, the advancement of blockchain traceability systems could be supported through digital infrastructure policies and data standardization efforts. Certification programs linked to traceability tools would help ethanol producers meet environmental and social compliance criteria, opening access to premium international markets.
On the practical side, companies in the ethanol supply chain are encouraged to adopt multi-criteria, stakeholder-driven decision-making frameworks, such as the CPP-ROC model proposed in this study. This allows firms to transparently evaluate trade-offs between environmental, economic, and operational objectives—fostering accountability and collective commitment to sustainability goals.
The participatory nature of the model also suggests its potential for use in territorial planning and inter-organizational agreements, especially where coordination among producers, processors, and regulators is essential for systemic transformation.
Author Contributions
Conceptualization, E.d.S.S., H.C.P. and V.N.; Methodology, E.d.S.S., W.D.O.S. and M.E.F.; Validation, E.d.S.S., W.D.O.S. and M.E.F.; Formal analysis, E.d.S.S., W.D.O.S. and M.E.F.; Investigation, P.C.M. and V.N.; Writing—review & editing, W.D.O.S. and M.E.F., P.C.M. and R.d.O.M. All authors have read and agreed to the published version of the manuscript.
Funding
This research was funded by Coordenação de Aperfeiçoamento de Pessoal de Nível Superior (CAPES) under the Grant Code 001 and Conselho Nacional de Desenvolvimento Científico e Tecnológico.
Data Availability Statement
The original data presented in this study are openly available in the paper.
Conflicts of Interest
The authors declare no conflicts of interest.
References
- Bathrinath, S.; Abuthakir, N.; Koppiahraj, K.; Saravanasankar, S.; Rajpradeesh, T.; Manikandan, R. An initiative towards sustainability in the petroleum industry: A review. Mater. Today Proc. 2021, 46, 7798–7802. [Google Scholar] [CrossRef]
- Gilani, H.; Sahebi, H.; Oliveira, F. Sustainable Sugarcane-to-Bioethanol Supply Chain Network Design: A Robust Possibilistic Programming Model. Appl. Energy 2020, 278, 115653. [Google Scholar] [CrossRef]
- Ho, D.P.; Ngo, H.H.; Guo, W. A Mini Review on Renewable Sources for Biofuel. Bioresour. Technol. 2014, 169, 742–749. [Google Scholar] [CrossRef]
- Mousavi Ahranjani, P.; Ghaderi, S.F.; Azadeh, A.; Babazadeh, R. Robust Design of a Sustainable and Resilient Bioethanol Supply Chain under Operational and Disruption Risks. Clean Technol. Environ. Policy 2020, 22, 119–151. [Google Scholar] [CrossRef]
- Kim, J.; Realff, M.J.; Lee, J.H. Optimal Design and Global Sensitivity Analysis of Biomass Supply Chain Networks for Biofuels under Uncertainty. Comput. Chem. Eng. 2011, 35, 1738–1751. [Google Scholar] [CrossRef]
- Muktham, R.; Bhargava, S.; Bankupalli, S.; Ball, A.S. A Review on 1st and 2nd Generation Bioethanol Production-Recent Progress. J. Sustain. Bioenergy Syst. 2016, 6, 72–92. [Google Scholar] [CrossRef]
- Tordecilla, R.D.; Juan, A.A.; Montoya-Torres, J.R.; Quintero-Araujo, C.L.; Panadero, J. Simulation-Optimization Methods for Designing and Assessing Resilient Supply Chain Networks under Uncertainty Scenarios: A Review. Simul. Model. Pract. Theory 2021, 106, 102166. [Google Scholar] [CrossRef]
- Maheshwari, P.; Singla, S.; Shastri, Y. Resiliency Optimization of Biomass to Biofuel Supply Chain Incorporating Regional Biomass Pre-Processing Depots. Biomass Bioenergy 2017, 97, 116–131. [Google Scholar] [CrossRef]
- Zhao, S.; You, F. Resilient Supply Chain Design and Operations with Decision-dependent Uncertainty Using a Data-driven Robust Optimization Approach. AIChE J. 2019, 65, 1006–1021. [Google Scholar] [CrossRef]
- Foreign Agricultural Service. Brazil: Biofuels Annual; U.S. Department of Agriculture: Washington, DC, USA, 2024.
- Machado, R.L.; Abreu, M.R. Multi-Objective Optimization of the First and Second-Generation Ethanol Supply Chain in Brazil Using the Water-Energy-Food-Land Nexus Approach. Renew. Sustain. Energy Rev. 2024, 193, 114299. [Google Scholar] [CrossRef]
- Carvajal, J.; Sarache, W.; Costa, Y. Economic Justice in the Design of a Sugarcane-Derived Biofuel Supply Chain: A Fair Profit Distribution Approach. Logistics 2024, 8, 122. [Google Scholar] [CrossRef]
- Benites-Lazaro, L.L.; Mello-Théry, N.A.; Lahsen, M. Business Storytelling about Energy and Climate Change: The Case of Brazil’s Ethanol Industry. Energy Res. Soc. Sci. 2017, 31, 77–85. [Google Scholar] [CrossRef]
- Hashemi-Tabatabaei, M.; Amiri, M.; Keshavarz-Ghorabaee, M. Gresilient Supplier Evaluation and Selection under Uncertainty Using a Novel Streamlined Full Consistency Method. Logistics 2024, 8, 90. [Google Scholar] [CrossRef]
- Donner, M.; Gohier, R.; De Vries, H. A New Circular Business Model Typology for Creating Value from Agro-Waste. Sci. Total Environ. 2020, 716, 137065. [Google Scholar] [CrossRef]
- Antikainen, M.; Valkokari, K. A Framework for Sustainable Circular Business Model Innovation. Technol. Innov. Manag. Rev. 2016, 6, 5–12. [Google Scholar] [CrossRef]
- Oliveira, M.; Cocozza, A.; Zucaro, A.; Santagata, R.; Ulgiati, S. Circular Economy in the Agro-Industry: Integrated Environmental Assessment of Dairy Products. Renew. Sustain. Energy Rev. 2021, 148, 111314. [Google Scholar] [CrossRef]
- Vyas, M.; Yadav, G. Leveraging Enablers and Performance Metrics for Building Industrial Circular Supply Chain: A Hybrid Multi-Criteria Decision-Making Approach. Circ. Econ. Sustain. 2025, 5, 209–230. [Google Scholar] [CrossRef]
- Bello, A.O.; Mbhele, T.P. A Fuzzy-AHP Multi-Criteria Decision-Making Approach for a Sustainable Supply Chain of Rice Farming Stakeholders in Edu-Patigi LGA, Kwara State, Nigeria. Sustainability 2024, 16, 1751. [Google Scholar] [CrossRef]
- Wang, J.; Chang, J.; Wu, Y. The Optimal Production Decision of Competing Supply Chains When Considering Green Degree: A Game-Theoretic Approach. Sustainability 2020, 12, 7413. [Google Scholar] [CrossRef]
- Wang, L.; Su, X. Carbon Reduction Decision-Making in the Supply Chain Considering Carbon Allowances and Bidirectional Option Trading Mode of Carbon Emission Rights. Energy Rep. 2025, 13, 2678–2696. [Google Scholar] [CrossRef]
- Koppiahraj, K.; Virmani, N.; Sindhwani, R. Toward a sustainable future: Integrating circular economy in the digitally advanced supply chain. J. Bus. Ind. Mark. 2024, 39, 2605–2619. [Google Scholar] [CrossRef]
- Costa, Y.; Duarte, A.; Sarache, W. A Decisional Simulation-Optimization Framework for Sustainable Facility Location of a Biodiesel Plant in Colombia. J. Clean. Prod. 2017, 167, 174–191. [Google Scholar] [CrossRef]
- Suryawanshi, P.; Dutta, P. Optimization Models for Supply Chains under Risk, Uncertainty, and Resilience: A State-of-the-Art Review and Future Research Directions. Transp. Res. Part E Logist. Transp. Rev. 2022, 157, 102553. [Google Scholar] [CrossRef]
- Contreras-Lisperguer, R.; Muñoz-Cerón, E.; Aguilera, J.; De La Casa, J. A Set of Principles for Applying Circular Economy to the PV Industry: Modeling a Closed-Loop Material Cycle System for Crystalline Photovoltaic Panels. Sustain. Prod. Consum. 2021, 28, 164–179. [Google Scholar] [CrossRef]
- Koppiahraj, K.; Bathrinath, S.; Venkatesh, V.G.; Mani, V.; Shi, Y. Optimal sustainability assessment method selection: A practitioner perspective. Ann. Oper. Res. 2023, 324, 629–662. [Google Scholar] [CrossRef]
- Santos, D.S.; Ianda, T.F.; De Carvalho, P.P.S.; De Camargo, P.L.T.; Dos Santos, F.C.G.; Alzate, C.A.C.; Pessoa, F.L.P.; De Araújo Kalid, R. Multi-Purpose Biorefineries and Their Social Impacts: A Systematic Literature Review. Environ. Dev. Sustain. 2023, 26, 10865–10925. [Google Scholar] [CrossRef]
- Santos, D.S.; Primo, R.G.B.; De Araújo Lima, A.P.H.G.; Schramm, V.B.; Rodrigues, Y.V.S.; Belderrain, M.C.N.; Pessoa, F.L.P.; De Araújo Kalid, R.; Callefi, M.H.B.M. Evaluation of the Social Impacts of Small- and Medium-Sized Biorefineries in the Southern Coast Territory of Bahia Considering the Selection of Technologies for Bioactives: An MCDA Model. Environ. Dev. Sustain. 2023, 26, 13117–13137. [Google Scholar] [CrossRef]
- Salehi, S.; Zare Mehrjerdi, Y.; Sadegheih, A.; Hosseini-Nasab, H. Designing a Resilient and Sustainable Biomass Supply Chain Network through the Optimization Approach under Uncertainty and the Disruption. J. Clean. Prod. 2022, 359, 131741. [Google Scholar] [CrossRef]
- Safari, L.; Sadjadi, S.J.; Sobhani, F.M. Resilient and Sustainable Supply Chain Design and Planning under Supply Disruption Risk Using a Multi-Objective Scenario-Based Robust Optimization Model. Environ. Dev. Sustain. 2023, 26, 27485–27527. [Google Scholar] [CrossRef]
- Ebadian, M.; Sowlati, T.; Sokhansanj, S.; Townley-Smith, L.; Stumborg, M. Modeling and Analysing Storage Systems in Agricultural Biomass Supply Chain for Cellulosic Ethanol Production. Appl. Energy 2013, 102, 840–849. [Google Scholar] [CrossRef]
- Soren, A.; Shastri, Y. Resilient Design of Biomass to Energy System Considering Uncertainty in Biomass Supply. Comput. Chem. Eng. 2019, 131, 106593. [Google Scholar] [CrossRef]
- Payer, R.C.; Quelhas, O.L.G.; Bergiante, N.C.R. Framework to Supporting Monitoring the Circular Economy in the Context of Industry 5.0: A Proposal Considering Circularity Indicators, Digital Transformation, and Sustainability. J. Clean. Prod. 2024, 466, 142850. [Google Scholar] [CrossRef]
- Eden, C.; Ackermann, F. Cognitive Mapping Expert Views for Policy Analysis in the Public Sector. Eur. J. Oper. Res. 2004, 152, 615–630. [Google Scholar] [CrossRef]
- Georgiou, I. A Graph-Theoretic Perspective on the Links-to-Concepts Ratio Expected in Cognitive Maps. Eur. J. Oper. Res. 2009, 197, 834–836. [Google Scholar] [CrossRef]
- Medeiros, D.F.K.L.; Urtiga, M.M.; Morais, D.C. Integrative Negotiation Model to Support Water Resources Management. J. Clean. Prod. 2017, 150, 148–163. [Google Scholar] [CrossRef]
- Guarnieri, P.; Camara E Silva, L.; Vieira, B. How to Assess Reverse Logistics of E-Waste Considering a Multicriteria Perspective? A Model Proposition. Logistics 2020, 4, 25. [Google Scholar] [CrossRef]
- Georgiou, I. Messing about in Transformations: Structured Systemic Planning for Systemic Solutions to Systemic Problems. Eur. J. Oper. Res. 2012, 223, 392–406. [Google Scholar] [CrossRef]
- Sant’Anna, A.P. Aleatorização e Composição de Medidas de Preferência. Pesqui. Oper. 2002, 22, 87–103. [Google Scholar] [CrossRef]
- Barron, F.H.; Bruce, E. Barrett Decision Quality Using Ranked Attribute Weights. Manag. Sci. 1996, 42, 1515–1523. [Google Scholar] [CrossRef]
- Young, H.P.; Raiffa, H. The Art and Science of Negotiation. J. Policy Anal. Manag. 1983, 3, 152. [Google Scholar] [CrossRef]
- Sant’, A.P.; Anna, N.A.; Conde, F.Q. Probabilistic Comparison of Call Centres in a Group Decision Process. Int. J. Manag. Decis. Mak. 2011, 11, 417. [Google Scholar] [CrossRef]
- Abuabara, L.; Paucar-Caceres, A. Surveying Applications of Strategic Options Development and Analysis (SODA) from 1989 to 2018. Eur. J. Oper. Res. 2021, 292, 1051–1065. [Google Scholar] [CrossRef]
- Collins, A.J.; Thaviphoke, Y.; Tako, A.A. Using Strategic Options Development and Analysis (SODA) to Understand the Simulation Accessibility Problem. J. Oper. Res. Soc. 2023, 74, 2143–2164. [Google Scholar] [CrossRef]
- Cunha, A.A.R.; Morais, D.C. Analysing the Use of Cognitive Maps in an Experiment on a Group Decision Process. J. Oper. Res. Soc. 2016, 67, 1459–1468. [Google Scholar] [CrossRef]
- Karagoz, A.B.; Reagh, Z.M.; Kool, W. The Construction and Use of Cognitive Maps in Model-Based Control. J. Exp. Psychol. Gen. 2024, 153, 372–385. [Google Scholar] [CrossRef]
- Georgiou, I. Cognitive Mapping and Strategic Options Development and Analysis (SODA). In Wiley Encyclopedia of Operations Research and Management Science; Wiley: Hoboken, NJ, USA, 2011; ISBN 978-0-470-40063-0. [Google Scholar]
- Cunha, A.; Morais, D. Problem Structuring Methods in Group Decision Making: A Comparative Study of Their Application. Oper. Res. Int. J. 2019, 19, 1081–1100. [Google Scholar] [CrossRef]
- Gavião, L.O.; Sant’Anna, A.P.; Lima, G.B.A.; Garcia, P.A.D.A. Composition of Probabilistic Preferences in Multicriteria Problems with Variables Measured in Likert Scales and Fitted by Empirical Distributions. Standards 2023, 3, 268–282. [Google Scholar] [CrossRef]
- Johnson, D. The Triangular Distribution as a Proxy for the Beta Distribution in Risk Analysis. J. R. Stat. Soc. D 1997, 46, 387–398. [Google Scholar] [CrossRef]
- Yang, M.; Chen, L.; Wang, J.; Msigwa, G.; Osman, A.I.; Fawzy, S.; Rooney, D.W.; Yap, P.-S. Circular Economy Strategies for Combating Climate Change and Other Environmental Issues. Environ. Chem. Lett. 2023, 21, 55–80. [Google Scholar] [CrossRef]
- Li, J.; Xiao, F.; Zhang, L.; Amirkhanian, S.N. Life Cycle Assessment and Life Cycle Cost Analysis of Recycled Solid Waste Materials in Highway Pavement: A Review. J. Clean. Prod. 2019, 233, 1182–1206. [Google Scholar] [CrossRef]
- Fontana, M.E.; Vidal, R.; Marques, P.C.; Silva, W.D.O. Priority model for critical success factors in reverse flow inventory management. Int. J. Inventory Res. 2023, 6, 116. [Google Scholar] [CrossRef]
- Sanches, R.A.; Rocha, R.; Duarte, A.Y.S. Proposal for Producing New Fabric Through the Use of Fabric Scraps Discarded by Ibitinga Clothing Manufacturers: A Brazilian Example of Circular Economy. In Advances in Design, Music and Arts II; Raposo, D., Neves, J., Silva, R., Correia Castilho, L., Dias, R., Eds.; Springer Series in Design and Innovation; Springer International Publishing: Cham, Switzerland, 2023; Volume 25, pp. 328–341. ISBN 978-3-031-09658-7. [Google Scholar]
- Zhu, Y.; Zhang, Y.; Luo, D.; Chong, Z.; Li, E.; Kong, X. A Review of Municipal Solid Waste in China: Characteristics, Compositions, Influential Factors and Treatment Technologies. Environ. Dev. Sustain. 2021, 23, 6603–6622. [Google Scholar] [CrossRef]
- Cucciniello, R.; Cespi, D. Recycling within the Chemical Industry: The Circular Economy Era. Recycling 2018, 3, 22. [Google Scholar] [CrossRef]
- Wang, N.; Guo, Z.; Meng, F.; Wang, H.; Yin, J.; Liu, Y. The Circular Economy and Carbon Footprint: A Systematic Accounting for Typical Coal-Fuelled Power Industrial Parks. J. Clean. Prod. 2019, 229, 1262–1273. [Google Scholar] [CrossRef]
- Isabella, G.; Yu, A.S.O.; Silva, A.M.D.; Pegetti, A.L. Another Driver of the Brazilian Fuel Ethanol Supply Chain: The Consumers’ Preferences. Rev. Adm. 2017, 52, 304–316. [Google Scholar] [CrossRef]
- Vaccaro, G.L.R.; Longhi, A.; Moutinho, M.H.C.; Scavarda, A.; Lopes, C.M.; Dos Reis, A.N.; Nunes, F.; Azevedo, D. Interrelationship among Actors in Ethanol Production Chain as a Competitive and Sustainable Factor: The Case of Associative Production and Family-Farming in Southern Brazil. J. Clean. Prod. 2018, 196, 1239–1255. [Google Scholar] [CrossRef]
- Ahn, B.S. Compatible Weighting Method with Rank Order Centroid: Maximum Entropy Ordered Weighted Averaging Approach. Eur. J. Oper. Res. 2011, 212, 552–559. [Google Scholar] [CrossRef]
- Brandão, S.C.G.; Fontana, M.E.; Silva, W.D.O.; da Silva, G.L. Drivers and barriers of sustainability-oriented innovations in Brazilian denim treatment facilities: An expert-driven decision support. Humanit. Soc. Sci. Commun. 2025, 12, 679. [Google Scholar] [CrossRef]
- Rosa, A.; Silva, W.; Fontana, M.; Levino, N.; Guarnieri, P. A GIS-based multi-criteria approach for identifying areas vulnerable to subsidence in the world’s largest ongoing urban socio-environmental mining disaster. Extr. Ind. Soc. 2024, 19, 101500. [Google Scholar] [CrossRef]
- Oliveira Silva, W.D.; Fontana, M.E.; Belarmino, H.L.; Levino, N.; Marques, P.C. Resilience Optimization in Disruption-Prone Sustainable Reverse Supply Chains for Lead-Acid Battery Waste Management in Brazil: A Stochastic Model for Public and Private Policy Formulation. Socio-Econ. Plan. Sci. 2024, 95, 102027. [Google Scholar] [CrossRef]
- Silva, C.P.L.; Lima, M.; Silva, W.D.O.; Levino, N. Water-Path Game: Transformando crianças em guardiãs ambientais com jogo interativo sobre a preservação de águas urbanas. Rev. Tecnol. Gestão Sustentável 2024, 3, 159–172. [Google Scholar] [CrossRef]


Disclaimer/Publisher’s Note: The statements, opinions and data contained in all publications are solely those of the individual author(s) and contributor(s) and not of MDPI and/or the editor(s). MDPI and/or the editor(s) disclaim responsibility for any injury to people or property resulting from any ideas, methods, instructions or products referred to in the content. |
© 2025 by the authors. Licensee MDPI, Basel, Switzerland. This article is an open access article distributed under the terms and conditions of the Creative Commons Attribution (CC BY) license (https://creativecommons.org/licenses/by/4.0/).