Abstract
Background: Defining the optimal fleet portfolio is a crucial process in airline planning. The published efforts in literature provide ways to anticipate the disruption effects on the passenger demand; however, the proposed solution in this paper provides visibility on the impact of sustainable disruption and the way an airline can resist it. Methods: This paper proposes a two-stage methodology to find the best portfolio for airline operational requirements under the impact of disruption. The first stage considers optimization for normal airline operations under a specific fleet portfolio using an Integer Linear Programming (ILP) model. The second stage of the analysis is a mapping for the scenario-based methodology to find a way out for an airline subjected to some given disruption in operations. Results: The result of the two-stage analysis shall define the best fleet portfolio to withstand sustained disruptions by mapping the results in a disruption funnel and showing the impact of the supply and demand gap on the airline’s sustainable profitability. Conclusions: This paper provides a novel, practical way of evaluating strategic decisions to choose the best fleet portfolio and make airlines rely on the mapping of the disruption funnel to modify their network while increasing supply chain resilience.
1. Introduction
Planning for an airline fleet is a multi-dimensional task that requires long-term visibility of the operational circumstances. One of the pillars of the fleet planning process is the fleet assignment decision. In this study, the Fleet Assignment Model is a key element in the decision-making process of fleet acquisition. Starting from the existing flight schedule of an airline and the passenger demand data, the analysis can provide an initial evaluation of the airline’s performance under normal operating conditions. Another pillar of the fleet planning process is the resilience of the fleet performance against sustainable disruption events. A sort of potential sustained disruption can be the loss of passenger demand, economic recession, pandemics, geopolitical situations causing a severe impact on the supply chain, and so many other causes of economic and trading interruptions.
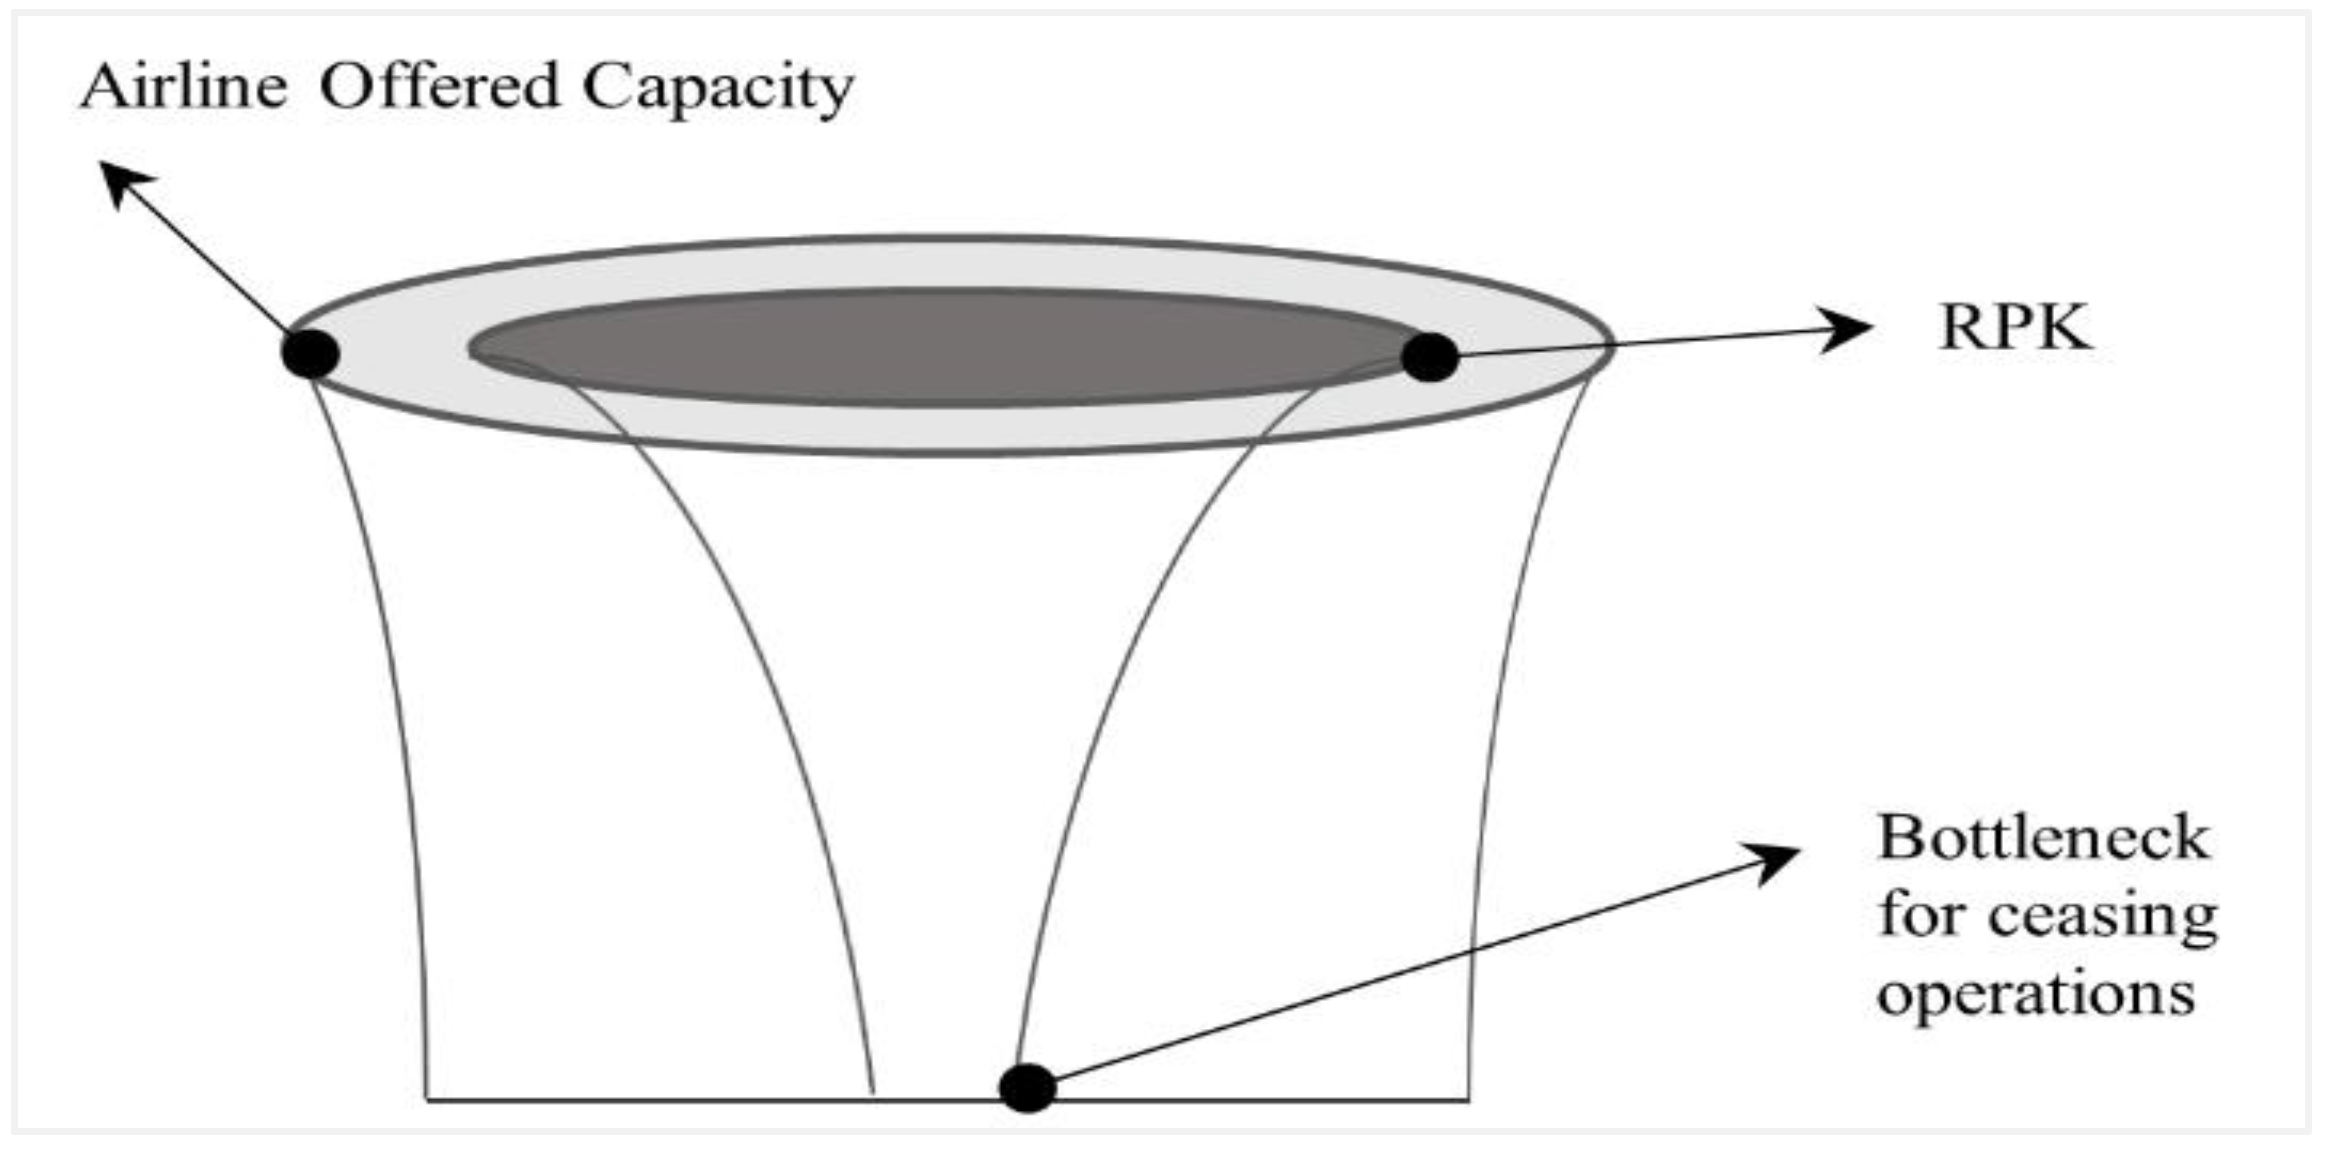
In recent years, several airlines filed for bankruptcy due to the continuous interruptions in their operations. Once the level of disruption cannot be resisted by the airline resilience system, a total collapse of the operation can be easily expected. Supply chain management is one of the key causes of an airline’s collapse. If the demand is much higher than the supply, the airline is expected to have a higher tendency to lose potential revenues; the opposite scenario is also crucial where the demand is much less than the supply; in this case, the airline is investing in assets that will not contribute to the profitability profiles of the airline, they will just be a burden on the airline fleet asset planning process. The gap between the supply and demand in the airline will be evaluated through an approach called “the disruption funnel”, which was introduced previously in 2022 by Elhamy et al. [1] as a part of the troubleshooting of the impact of sustained disruption on the airline profitability, as shown in Figure 1. The analysis takes place over two phases. The first phase is to find the best fleet mix that can optimize the profitability of the airline in normal operations. The second phase is mapping the gap between supply and demand in different cases of network planning to avoid potential disruptions that may impact the airline’s profitability. That mapping is a multi-dimensional action that includes the capacity of the operation, described as the offered seats and flight distances, along with the demand, described as the passenger demand and required flight distances.
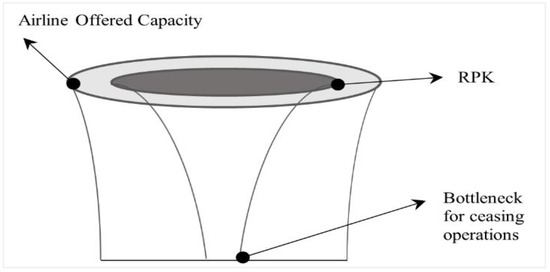
Figure 1.
Illustration of the disruption funnel (dark grey is demand, light grey is supply).
The solution of the Fleet Assignment Model (FAM), which is used to solve the problem in the first phase, has been tackled several times in many research publications. Optimization of the fleet assignment using Integer Linear Programming (ILP) is a good starting point for evaluating fleet efficiency and compatibility with scheduled operations. A set of operational constraints, like the range of the proposed fleet and its capacity, have been taken into consideration. The objective is to optimize the profit margin of the operation due to an optimized fleet assignment for the flights. That assignment is just the first stage of this study, showing an ideal utilization for the proposed fleet on the airline’s strategic operations.
The second phase of the analysis is to map the performance of the airline for the different scenarios of network planning, which will be formulated through a “disruption funnel” that fits the multi-dimensional analysis that is required during this phase. The key factors in the mapping will be the capacity and the demand of the air carrier. The gap between both parameters indicates the strength of the strategic decision. Load factor and profit values are also parameters that are required to be demonstrated on the same mapping. Taking the load factor into consideration is an important contribution to this paper. The capacity offered by the airline is not only the number of seats; it also needs to consider the flight distance offered by the airline. A similar argument must be applied to the demand, as it is not only the number of seats sold, but it includes the flight distance in the same way. The inclusion of the flight distance parameters is one of the most important factors affecting the evaluation of the airline’s performance. An airline that claims a strong operation portfolio by offering a large number of seats in a domestic market does not have the same attraction and profitability profile as an airline offering the same number of seats in a long-haul operational segment.
Upon COVID-19, the Air Madagascar board decided to store its fleet assets, and the World Bank had to step in to boost the financial situation of the flag carrier. Air Madagascar had very diverse and heterogeneous fleet types, from regional jets to super Jambo B747s. When COVID hit, and the passenger flow decreased, the airline could not achieve the required load factor that fit in with the profitability margin, and they had to cease operations. Another example is the low-cost European carrier Flyr, which had its inaugural flight in 2021 and could not sustain the quick changes in the global supply chain industry and ran out of cash flow quickly. Viva Air, an airline in Latin America, faced the same challenge and filed for bankruptcy at the beginning of 2023. The way out for Viva Air was a proposal from Avianca for acquisition and reorganization. That was not the first time an airline faced severe consequences for its operational model and network planning. Aero-México, Avianca, and LATAM Group faced the same challenge and could be saved either as a national flag carrier receiving subsidy from the government or by consolidation with other operators and monetary support. The stories of bankruptcy and airline struggles have been going on throughout history, even with much older similar cases like Freddie Laker and People’s Express and the most world’s shocking case of Pan Am Airways, which was the flag carrier of the USA and ceased flight operations in 1991.
The airline fleet planning challenge is a top–down view where the visibility of the problem factors needs to be clear at a high level without digging into the operational details. Sustainable disruption in this research is considered the main factor affecting the success or bankruptcy of the air carrier. In other words, any delay in the daily operations will not be considered in this problem. The proposed approach to model the fleet planning problem is the scenario-based analysis for airline dynamics and network planning. In case of sustainable disruption, the airline stakeholders and decision board need to decide either to get rid of specific fleet types, consolidate the network with another airline, or even choose to keep only one segment of the operation in the airline network. This can be explained by the example of operating only long-haul operations or short-haul operations and keeping the wide-body (WB) fleet types and selling the single-aisle (SA) types. All those decisions can have an aggressive impact on the performance of the airline and may lead to immediate bankruptcy if any of the decisions go wrong.
2. Review of Related Literature
In 2022, Elhamy et al. [1] introduced the disruption funnel through a regression model to find out what the main parameters that may affect the disruption funnel are. The aim was to find the impact of the supply chain management and operational influence on the profitability and cost analysis of airlines. Elhamy correlated the cost and the industry demand, defined in terms of Revenue Passenger Kilometer (RPK), as a main variable and measure for airline performance. This is aligned with the formulation of the first phase used in this paper, where the passenger demand corresponds to the RPK, and the cost factor corresponds to the supply factor of the airline ecosystem. Those correlations provided a background of the usage of the disruption funnel in this paper.
Multi-phase airline fleet planning problems have been tackled in different ways to furnish the required solution. In 2017, the three-stage analysis proposed by Repko and Santos [2] was defined in terms of periods so that the solution in each phase is typically a solution for the operational period or season. They suggested a scenario tree with three different probability assumptions for loss of passenger demand as they formulated the problem in three different period nodes with different fleet mix decisions. They used Mixed Integer Linear Programming (MILP) for each stage to make comparisons between them.
That was followed by the publication of Cadarso et al. [3], who formulated the strategic and tactical decision of fleet management through two-stage stochastic modeling, again by using Mixed Integer Linear Programming (MILP) for three period nodes for the strategic phase with fleet mix decisions and two stochastic tactical planning periods for the winter and summer schedules for the aircraft assignment problem. In 2022, Şafak et al. [4] followed Cadarso’s approach and used two-stage stochastic modeling for the strategic planning of an airline by using the aircraft leasing model only. Şafak tackled the non-linearity in the problem of fuel burn and used stochastic Mixed Integer Linear Programming (MILP) to solve the problem.
Similar publications were introduced by S. Ahmed et al. [5] in 2003 to address a multi-period investment model for capacity expansion under the consideration of uncertainty using a scenario tree approach to model the evolution of uncertain demand and cost parameters. Also, the intermodal fleet planning framework was proposed by A. Baykasoğlu et al. in 2019 [6] for multiple decision-making levels. In 2020, Birolini et al. [7] proposed a methodological integration between demand generation and allocation of a multilevel aggregate nested logit formulation to choose the best length of flights based on the demand of passengers.
Birolini’s approach to finding the best fleet mix and optimized network operations was followed by his publication in 2021, where Birolini et al. [8] tackled the problem of airline network planning with supply and demand interactions (ANPSD) to optimize network operations through the appropriate selection of fleet frequencies and fleet mixes. In 2021, Birolini et al. [9] continued the same search to improve demand stimulations and tackle the supply and demand problem by proposing a mixed integer nonlinear flight scheduling and fleet assignment optimization model. Birolini was following the proposals that had been published by Hsiao and Hansen in 2011 [10] and Jamili in 2017 [11]. Their aim was to find a suitable methodology for demand generation and scheduling adjustment to attract more demand. In 2016, Dong et al. [12] tried to solve the same dilemma by integrating flight scheduling with the Fleet Assignment Model, in which Jamili and Dong used heuristic modeling.
A case study for TAP Airlines was carried out by Carreira et al. in 2017 [13] with a two-phase analysis where they analyzed the forecasted demand in an optimization model, and hence, that was followed by a set of scenarios for the demand fluctuation. The study included the decision that needed to be made between applying the investment to buy the fleet assets or choosing to go with the leasing option. Carreira had the objective of minimizing the discounted cost of the buy and lease, and the forecasted demand was generated through a regression model. The optimization problem in his research was solved using Stochastic Mixed Integer Linear Programming (SMILP) to solve the long-haul fleet planning problem.
In 2010, Marazzo et al. [14] tested the correlation of the Gross Domestic Product (GDP) and the Revenue Passenger Kilometers (RPK) to discover if the integrated non-stationary variables present a stationary linear combination. The other main pillar of the supply chain supply and demand cycle is the supply, which can be defined as the seats offered in the market by the airline that fly at the same distances as the demand. This factor of the Available Seat Kilometer (ASK) is an important parameter for studying the impact of offering adequate capacity on the recovery of the supply chain resilience. The distance to be covered by the offered capacity was discussed in 2016 by Fuellhart et al. [15], who studied the effect of geographical sectors of the US air transport system on demand considering the departure frequency, passenger levels, and the available seats for 10 years of economic unevenness.
The fleet assignment problem was tackled in many publications over several years, and some of those publications considered the uncertainty in the planning and operational aspects along with the trials of the authors to solve the problem in a multi-phase framework. In 2023, Liu et al. [16] solved the Fleet Assignment Model to optimize the profitability of the airline while considering the impact of the fuel price and passenger demand fluctuations using a two-phase stochastic programming model. The first phase is to assign the aircraft families to the flights, and the second one is to determine specific aircraft deployment.
In 2013, Cadarso et al. [17] solved the Fleet Assignment Model, which was integrated into the fleet planning challenge under consideration of the direct and connected flights. The objective was to maximize the profit of the operation under consideration of the passenger satisfaction index. Cadarso wanted to maximize profit and minimize misconnected passengers at the same time, hence keeping the passengers loyal to the airline and avoiding passenger demand loss. Cadarso optimized the solution and integrated it with the robustness of the flight schedule.
Constantijn et al. in 2020 [18] solved the fleet assignment problem as an intermediate stage within the process of strategic fleet planning. He assumed an uncertain passenger demand spectrum and modeled it using the Ornstein–Uhlenbeck process for long-term demand combined with the Markov chain. He used the grey topological Markov chain for the demand forecast. With the multi-period planning, Constantijn et al. could formulate the Fleet Assignment Model and solve it, then generate different scenarios through Monte Carlo simulation to find the best Return On Investment (ROI) for the different proposed fleet mix. The output of the study was the profit of the operation with an uncertainty spectrum after considering a set of scenarios with specific capital investment for the input of fleet mixes. The publication of Constantijn et al. is the closest methodology to this research study in terms of the fleet asset planning multi-phase scenario-based simulation.
In 2007, Kohl et al. [19] initiated a research review of the different perspectives of disruption management, tackling the challenges of airlines by considering another dimension for proactive decision-making in the planning phase, either through robust planning by having a slack built into the plan or by planning for alternative scenarios. The latter is a similar approach to what is used in this research paper. Following Kohl’s demonstrative review, in 2021, Hassan et al. published [20] another review of the practical challenges of airline disruption management. Santos considered the operational circumstances of an airline and was able to map the available proposals in the literature for operational recovery. Santos et al. expanded their line of research in 2023 [21] to fleet planning under uncertain events like loss of demand or fluctuations in fuel prices. Santos used machine learning through multi-stage probabilistic fleet planning to consider a set of future scenarios.
The previous literature and publications focused on anticipating the change in passenger demand in case of sustainable disruption. However, when disruption hits, all measures of demand fail to practically sustain the profitability of the airline, and in many cases, the airline has to step back from business. Additionally, during the phase of the strategic decision to choose the best fleet portfolio, the airline receives offers from the aircraft manufacturers with performance measures and forecasts for future operational indicators. The proposed figures from the manufacturers do not include the impact of disrupted operations, and it becomes difficult for the airline to integrate those figures with advanced mathematical models such as stochastic analysis, grey theory, the Ornstein–Uhlenbeck process, and more complicated methodologies. Hence, the proposed approach in this paper provides a practical and visual way to anticipate the available solutions of the airline to get out of the subject disruption. The “disruption funnel” provides visibility on the possible network changes ahead of time in the strategic planning phase to avoid possible bankruptcy.
3. Problem Description
The fleet planning process in this paper consists of two stages. The first stage is the selection of the best fleet types and composition to optimize the operational profit of the airline. The output of this stage is the best fleet portfolio that can achieve the optimum profit for the airline. The second stage is a scenario-based analysis where some disruption events may impact passenger demand and operations. At this stage, the selected portfolio from stage one may not be the best option for the airline, as while it might perfectly fit the airline operations with no disruptions, it might send the airline into bankruptcy if the operations become dramatically disrupted. At the end of this study, the decision should be in the frame of the less harmful option for the airline, even if it impacts the profit streams of normal operations.
To anticipate the best fleet portfolio that has the best resilience system against disruption, the proposed fleet mix will be tested with specific scenarios of network planning and fleet operational policy. If the passenger demand decreases, the aircraft will take off with lower cabin utilization, leading to a lower load factor. In this case, the airline would be investing in a bigger capacity fleet that may not be needed in case of disruption. That gap between the demand of the passengers and the capacity offered by the airline is the main driver of this research. Once the gap between supply and demand increases over a specific value, the profitability of the airline will be impacted, and hence, it may lead to a cessation of operations. The purpose of this paper is to find the best fleet portfolio that can withstand and resist a potential disruption of operational conditions. That selected fleet mix is expected to have a lower impact on profitability in case of disruption either by maintaining positive profit values for the airline or by reducing the impact of the disruption and leaving some options for the airline board of directors to negotiate some consolidation with other airlines or alliances.
The fleet mix is the starting point for all the analyses undertaken in this paper. Starting with a suggestion for a specific fleet mix, the Fleet Assignment Model (FAM) is solved using Integer Linear Programming (ILP). The results denote the allocation of the available fleet types to the scheduled flights. The constraints framing the problem are set to be as realistic as possible to make the model very close to practical airline operations. Upon the completion of the FAM solution, a different fleet mix is used again on the same model to extract another set of solutions, and the same process continues. The selection of the best fleet mix for the airline depends on the maximum profit methodology. The selection of the best fleet mix, in this case, depends on the current situation of the passenger demand and the economic cycle.
Given a potential disruption, the different scenarios of shrinking the operational network to only one segment, such as domestic operations only or international networks solely, will be a viable option for deciding an escape route for the airline from the disruption that may impact its profitability. Furthermore, selecting only the regional fleet types or single-aisle or wide-body fleet types is one of the main factors under study in this publication. After mapping all possible scenarios and fleet mixes using the disruption funnel, the outcome should be the selection of the least vulnerable fleet portfolio. In this research, the demand for passengers is assumed to be constant in all scenarios, so the comparison can only be based on the impact of the airline network planning and the fleet operational policy. Some airlines have their network focused on long-haul operations only, while others operate regional flights only. In this research, a mixed operation network is introduced with a big spectrum of network operations and fleet types, and this will be discretized in the disruption funnel and scenarios to choose the best fleet portfolio that will provide the best escape route in case of sustainable disruption.
An impactful factor for the selection criteria of the fleet types and fleet mix is the value of the asset and the contract agreement through which the airline will obtain its fleet, either leased or owned. Accordingly, the economic impact of the fleet valuation at the time of planning is a critical factor that needs to be added to the objective function of the model. With time, the value of the asset will depreciate, and consequently, the incremental value of the asset will decrease with time, leaving more EBIT for the airline. The value of the aircraft in the model is amortized over the market asset value. When the flight schedule used in this research has a span of only one day, the aircraft value will be amortized to one day and deducted from the profit of the daily operation. Hence, the same methodology is applied at any period. Typically, the airline schedule is released either per season or per quarter. In this case, the aircraft value in the model is the value of the lease or the value of the amortized asset, including the purchasing value, age of the aircraft, and interest over the years, as explained by Vasigh et al. in 2010 [22] and 2022 [23]. Vasigh listed the factors and impact of volatile markets on the value of aircraft and the financial implications of aircraft financing and amortization.
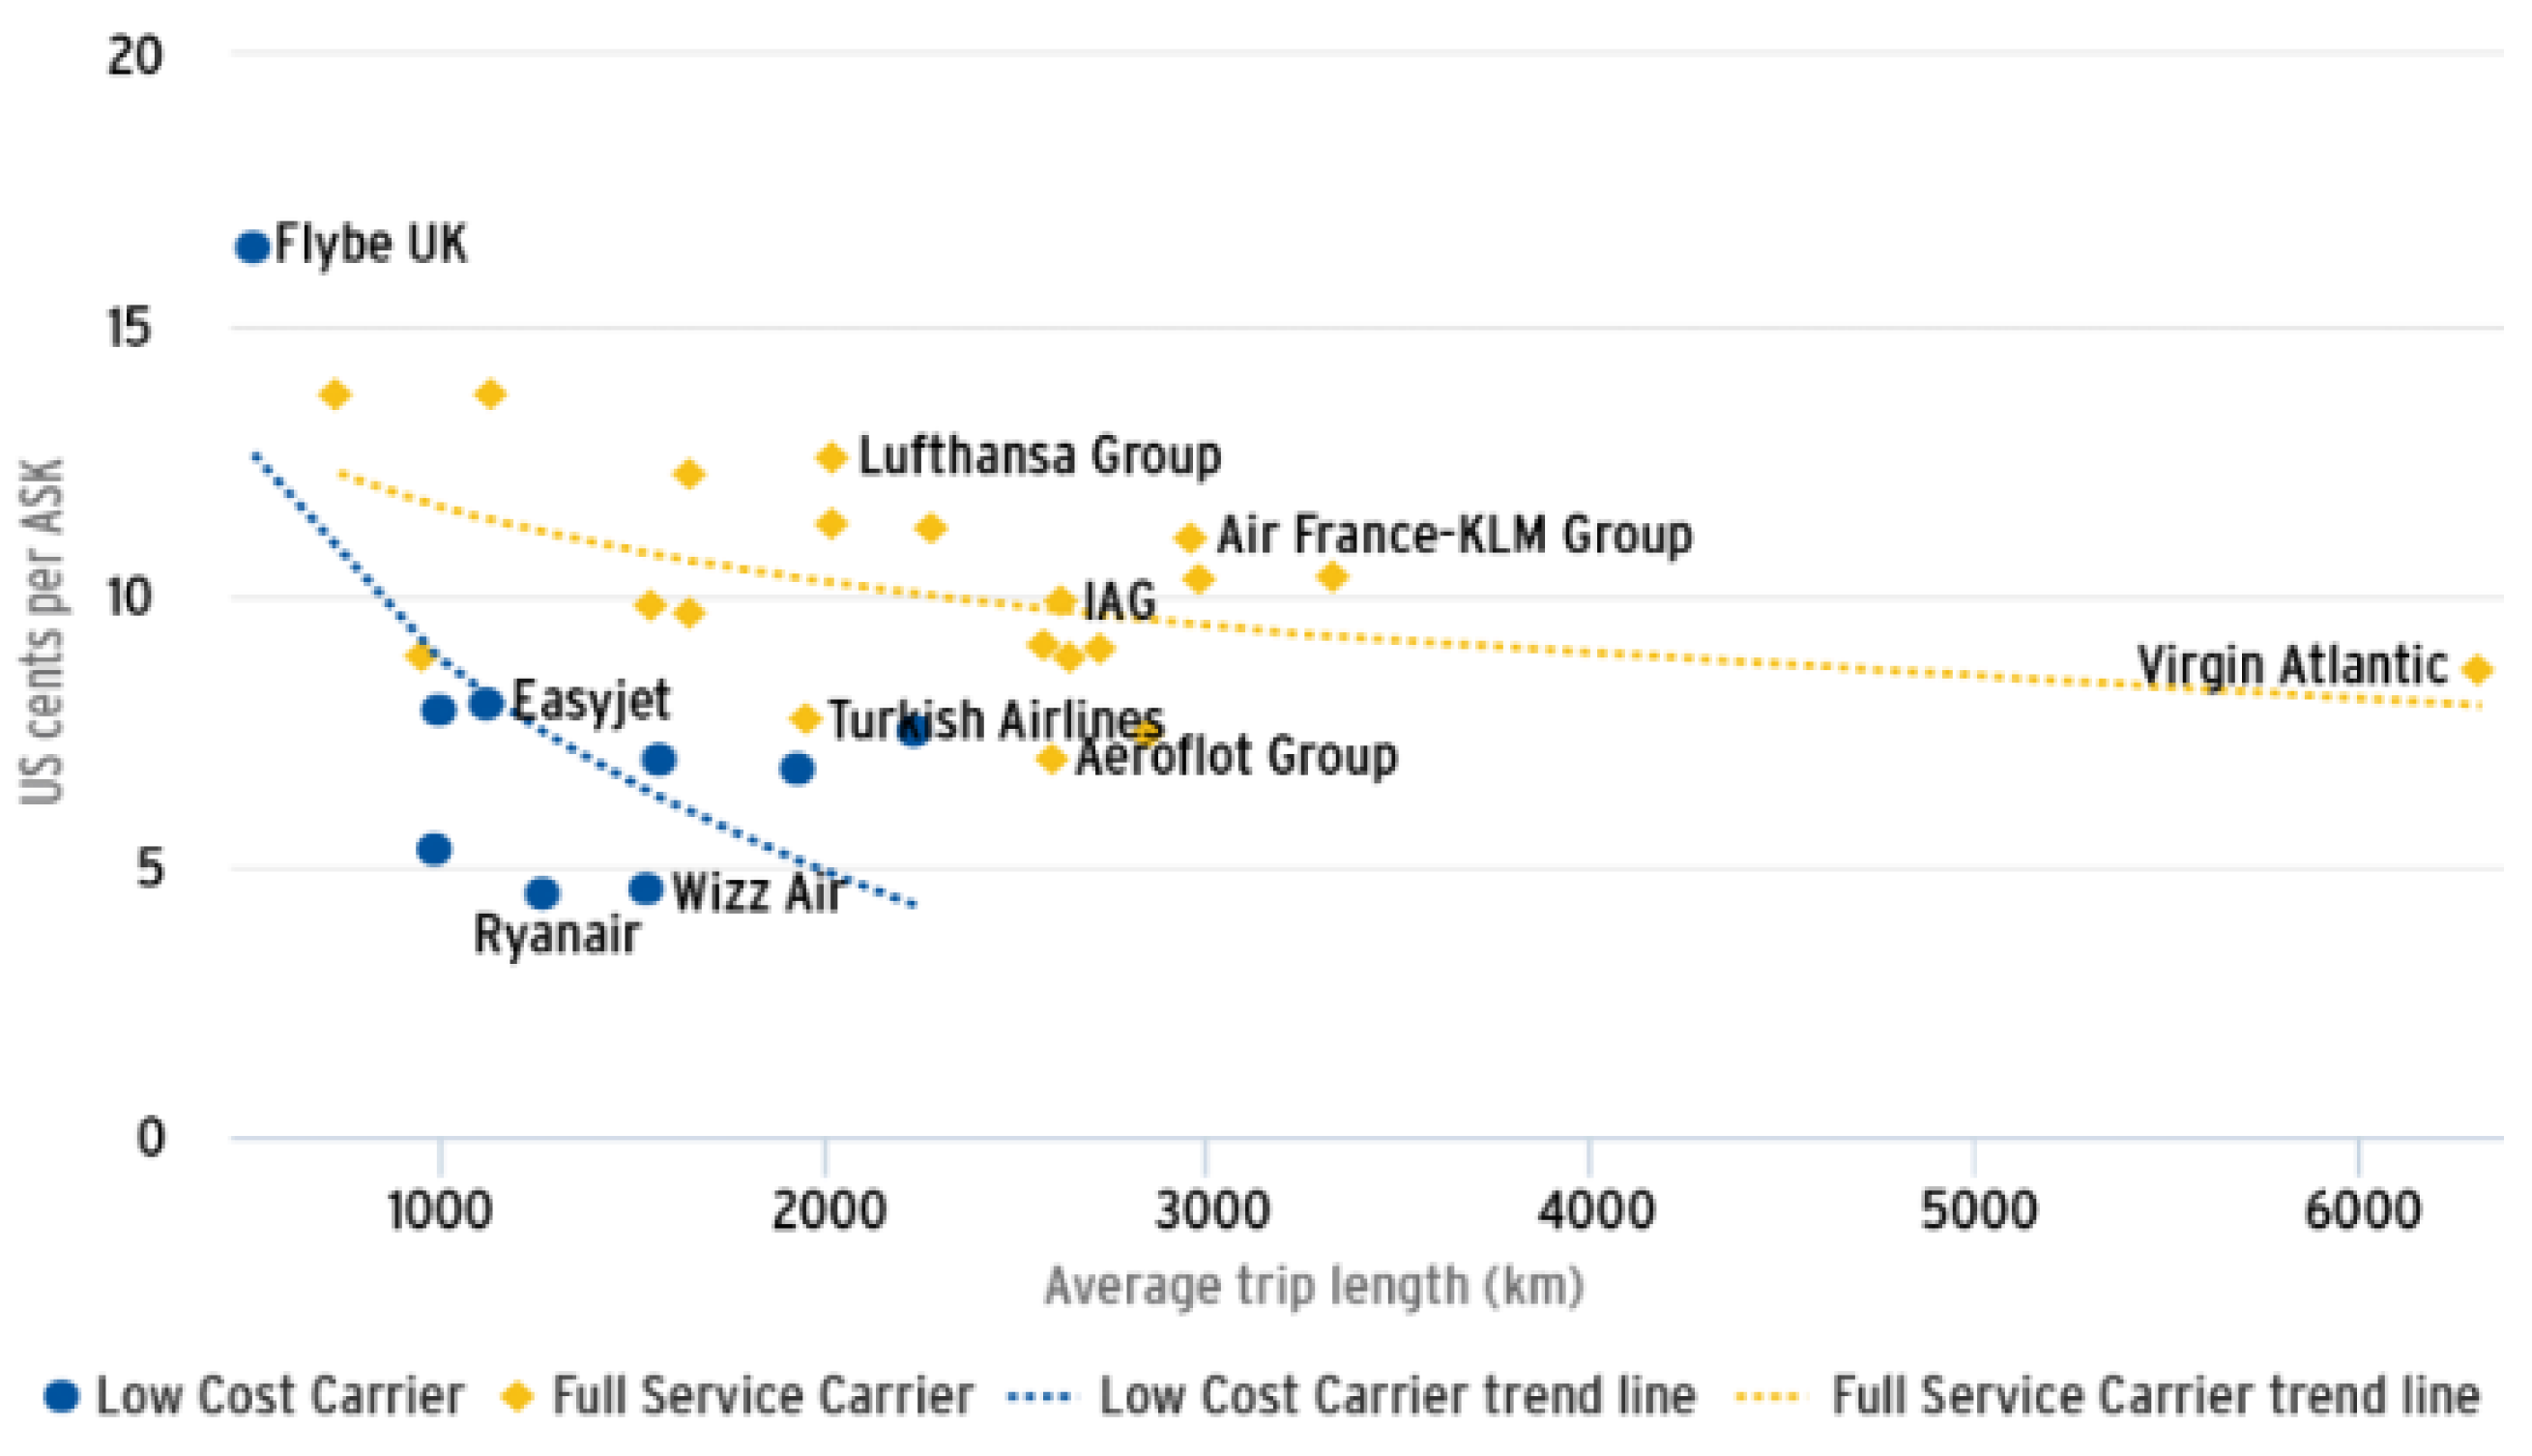
Each scheduled flight in the airline operation has a specific demand profile that may change in case of sustaining a disruption. Some of those flights are subjected to high passenger demand, and some others are high-spending flights, where passengers are expected to pay higher airfares than other flights regardless of the flight distance. All of this will impact the revenue stream of the airline. Another important factor is the cost of operation, which differs from the different operation schemes of the airline. When operating a wide-body (WB) fleet type with a large number of seats, the cost of operation is high; however, the incremental unit cost can be relatively low on longer flights. In this case, it is recommended that the airline planning sector assign the bigger aircraft on longer routes and avoid the shorter ones. The incremental unit parameter of cost is called Cost per Available Seat Kilometer (CASK), and it differs depending on the type of operation. Following the performance indicators of the airlines published by the CAPA Centre for Aviation, which is affiliated with the Aviation Week Network, the incremental unit cost, “CASK”, of the airline operations decreases with the distance traveled by aircraft, as shown in Figure 2 and published by CAPA Centre for Aviation [24].
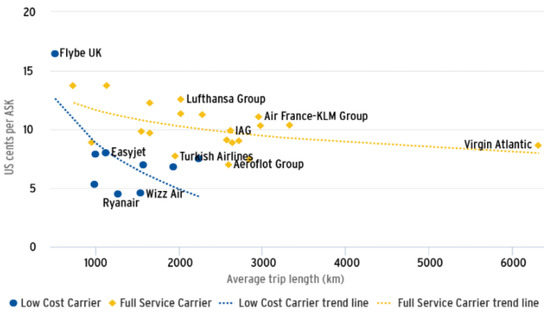
Figure 2.
Change of the unit Cost per Available Seat Kilometer (CASK) with traveling distance. Source: CAPA [24].
Furthermore, the category of the airline and strategic planning policy, Full-Service Carrier (FSC) or Low-Cost Carrier (LCC), defines the cost units and the operational margins. As shown in Figure 1, the Low-Cost Carriers (LCCs) always have lower incremental costs of operation regardless of the capital cost of the fleet asset. This comes from the fact that low-cost air carriers avoid a lot of overhead expenses like the in-flight services, entertainment connectivity features for the passengers, the insurance on the passengers and their belongings, and many other factors that Full-Service Carriers (FSCs) consider in their planning. This is why the LCCs can compete very well in the market with lower CASK and then lower airfares. However, the LCC has more of a possibility of filing for bankruptcy as all their operational margins are on the border.
In this paper, airline operations are categorized into domestic and international flights. The fleet available to be assigned on the scheduled flights is limited to narrow-body (single-aisle) and wide-body fleet types. Achieving maximum profit values for the airline comes with minimizing the operating cost in times of sustainable disruption or increasing the revenue streams. At this point, it is very important to define the cost and revenue units. The cost depends on the capacity of the supply in the market; this capacity can be identified by the availability of the seats and the distance flown by the fleet, and it is called “Available Seat Kilometer” (ASK). The incremental cost is calculated for each available seat supplied in the market and for each kilometer. On the other hand, the CASK includes the operational cost and any other dependencies of the operation at the outstations. Accordingly, the CASK is affected by the fleet type and flight distance to reach the destination airport. That incremental unit cost (CASK) does not change dramatically based on the route; it is more dependent on the fleet type. As shown in Figure 1, the longer the distance for the scheduled flights, the lower the incremental unit cost.
The question now is what happens with the demand and revenue, especially when the distance is long, the flight becomes more expensive, and the demand may not be enough to cover the total cost of the flight due to some kind of sustained disruption. To correlate the supply of seats in the market with the demand, another important parameter is defined as the number of passengers that are generating revenue for the airlines per flight distance. One of the most reliable metrics in the aviation industry is the “Revenue Passenger Kilometer” (RPK), which indicates the utilization of the available capacity provided by airline operations. Following the statistics released by the World Bank (WB) [25] and the International Monetary Fund (IMF) [26], the RPK is related to the Global Domestic Product (GDP), which describes the strength of the national economy. The global aviation industry represents around 3.5% of the Global Domestic Product (GDP) [27], and the International Air Transport Association (IATA) often publishes statistics about the correlation of the RPK and GDP in the recovery schemes of sustainable disruption events [28].
The contribution of this work is based on the illustrated concept that the supply chain management of the airline depends on the supply and demand schemes represented by the Available Seat Kilometer (ASK) and the Revenue Passenger Kilometer (RPK), respectively. The gap between both parameters will be mapped in the disruption funnel with the different scenarios related to fleet assets and network planning.
4. The Proposed Methodology
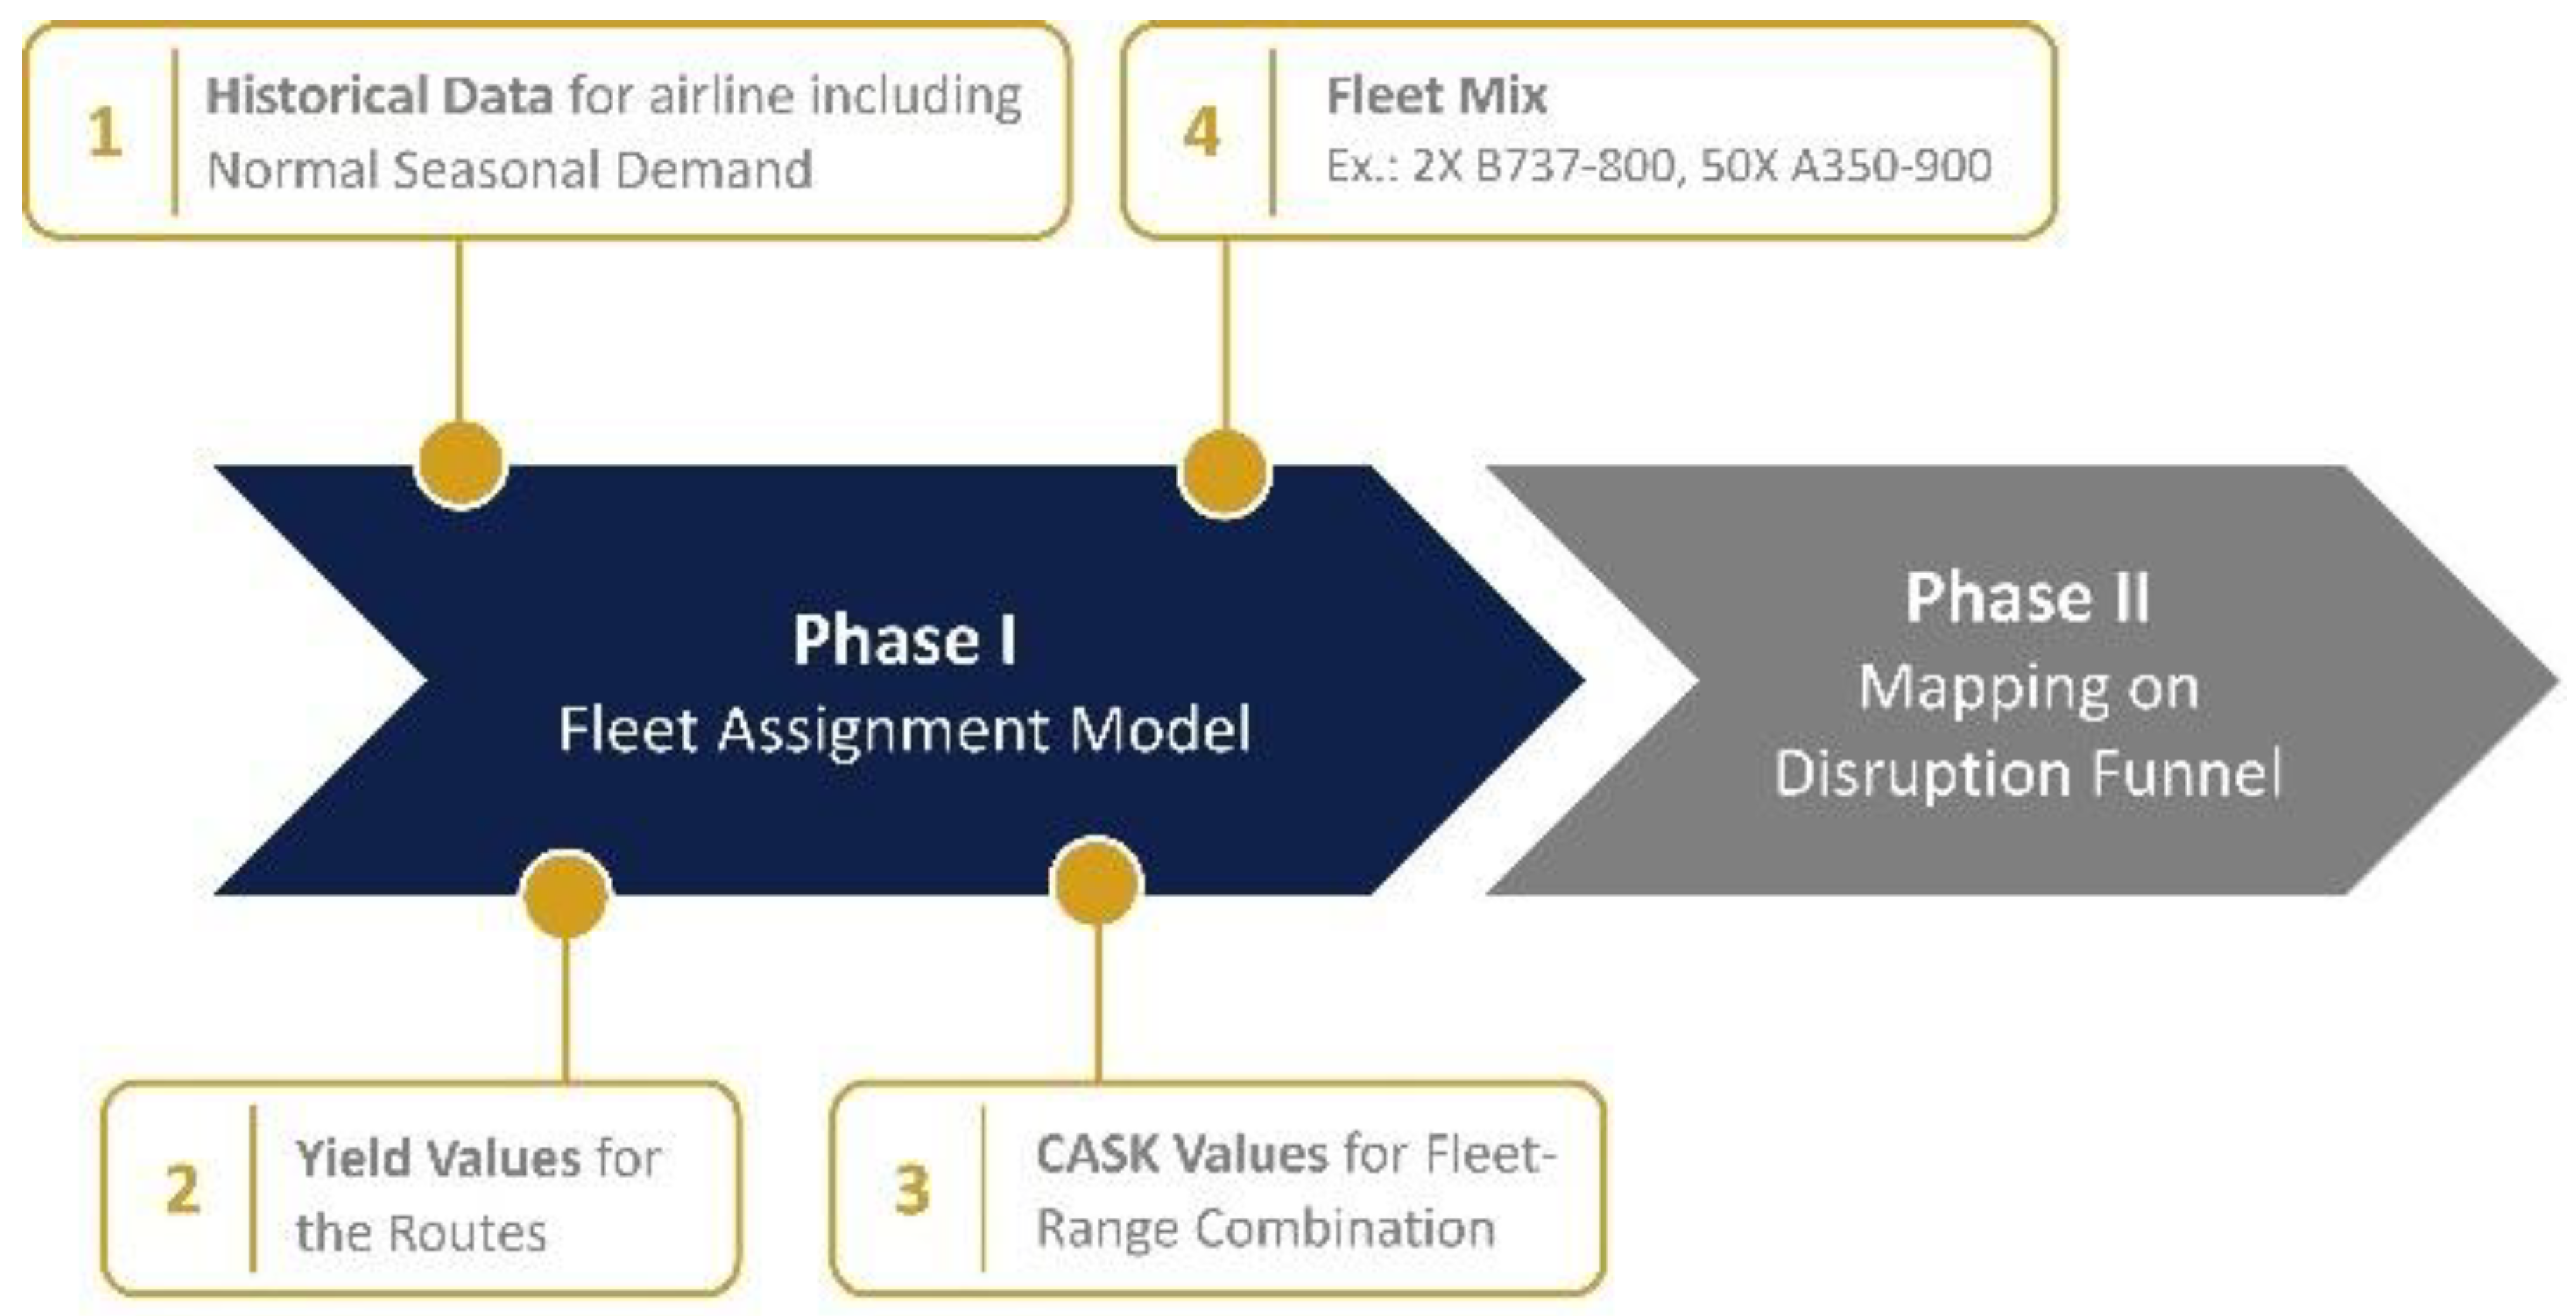
Figure 3 illustrates the proposed methodology in this paper. The starting point of the solution is to decide on a specific fleet mix based on the ability of the airline to invest. All airlines have scheduled replacement of their fleet and expansion plans for the network operations. Based on this fact and what the airline is willing to pay, the fleet mix is chosen as an input to the first stage of the solution. The first phase is the Fleet Assignment Model (FAM), which is designed to obtain the best-assigned fleet types to fulfill the requirements of the airline and its flight schedule, and the second stage is the scenario-based phase that includes all the different network variations and based on which it will be decided what is the best fleet mix for the operation. The proposed solution methodology emphasizes the importance of mapping the different scenarios on the disruption funnel introduced previously in 2022 by Elhamy et al. [1].
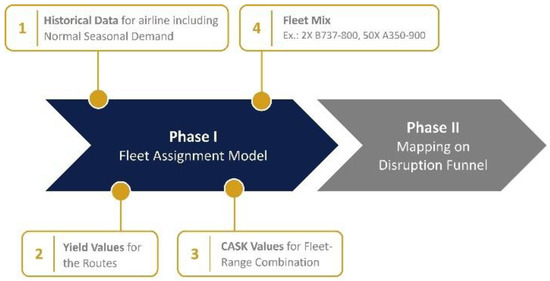
Figure 3.
Workflow of the suggested methodology with the underlying models.
Stage I proposes a solution for the Fleet Assignment Model (FAM) under different fleet portfolios to find the optimum profit value for the strategic plan. In stage II, some scenarios will be set to test the robustness of the first part and show the way out of the airline from the possible sustainable disruption events that influence the decision of the fleet planning process. At this stage, some different operations, like short-haul and long-haul operations, will be tested to complement the picture of the most robust solution for the fleet portfolio. Stage II is the troubleshooting phase of the possible disruption events that may affect the airline operation. For instance, if the airline network is impacted by geopolitical conflicts, in this case, some of the routes will be suspended, and the airline will be forced to avoid those routes and re-organize its network. Accordingly, the airline will ground or sell some of its aircraft from specific fleet types. Stage II provides visibility on the impact of the fleet selection before the decision of the fleet acquisition.
By sectoring the airline operations into short-haul and long-haul operations, the performance metrics described in terms of the operating cost and RPK shall give an insight into the difference between the two range sectors. The fleet asset value is considered one of the most expensive factors for the airline to fulfill its operational requirements. For the airline to be able to prioritize the utilization of its fleet assets in the disrupted operations, it is also important to perform another sectoring for the utilization of the narrow-body and wide-body fleet. By the end of this study, different sectors of the operational distance and the fleet types shall reveal the significant factors affecting each type of operation to be a reference in the disrupted operations.
5. Stage I: The Fleet Assignment Model
Several publications have proposed solutions to the problem and models of the Fleet Assignment Model (FAM) in different ways. Some used Integer Linear Programming (ILP) to solve the problem, and this is the same methodology used in this paper where it was necessary to include major parameters in the model that represent the competition in the revenue streams and the strength of the airline toward passenger demand and cost control. Some other publications used a greedy leg-based heuristic approach and a network itinerary-based approach. Fleet Assignment Models at American Airlines have led to a 1.4% improvement in operating margins, as Abara published in 1989 [29]. Furthermore, Fleet Assignment Models have contributed to the achievement of annual savings at Delta Airlines of USD 100 million, as per Wiper et al., 1994 [30]. A similar publication by Rushmeier and Kontogiorgis [31] in 1997 indicated that annual savings of USD 15 million for American Airlines are also attributable to the use of a fleet assignment optimizer.
With the continuous need to optimize the profitability of the airlines and minimize the cost in normal operating conditions, the constraints become more critical and limit the assignment process. In this research, the maximum profit analogy was used as a main objective for the Fleet Assignment Model (FAM). Each flight segment in the flight schedule is discretized separately with specific passenger demand and operational cost units. Each flight sector shall be tracked separately to ensure that the passenger demographic and route specificities are respected. It is important to recognize that the cost and performance indicators of each flight segment in the flight schedule have their own unit cost and unit revenue. The location of each flight segment in the schedule decides the cost of the flight, passenger demand, and airline overheads.
Before describing the different elements of the Fleet Assignment Model, it is important to define some economic parameters used for airline revenue and cost analysis as performance indicators. Those parameters are listed herein after as they are used by the airline network planning team and commercial sector of the airline to define the profitability of the network in the case of the Full-Service Carriers or the profitability of the sector in the case of the Low-Cost Carriers.
The Revenue Passenger Kilometer (RPK) is the demand factor of the airline supply chain cycle. Based on the airline standard, the demand factor is not only the number of passengers, but it is a means to measure the network performance by transporting those passengers to specific distances. Hence, RPK is equal to the number of passengers multiplied by the traveling distance, as expressed in Equation (1). The other part of the supply chain cycle is the supply, which is represented by the seats offered by the airline covering the same distances that the passengers would request. That supply factor is expressed in Equation (2) as the Available Seat Kilometer (ASK).
The unit revenue in the airline supply chain cycle is called “Yield” and can be calculated by dividing the total revenue coming from selling the flight tickets by the demand (RPK), as shown in Equation (3). This provides visibility on the unit revenue coming from each paying passenger per kilometer. The yield value decreases with longer flights and more passengers on board. On the other hand, the yield value is high in the case of specific routes with high-spending passenger demographics. The revenue stream of the airline operation comes from multiplying the yield by the RPK, as listed in the first term of the objective function in Equation (6).
The cost factor is expressed in terms of a unit cost defined as the Cost per Available Seat Kilometer (CASK). That unit cost is highly dependent on the fleet type and the distance. The longer the flight distance, the lower the CASK, as expressed in Equation (4). The load factor (LF) defined in Equation (5) shows the utilization of the aircraft cabin in terms of percentage. The load factor is the paying passengers over the available seats on board. It is indeed expected that the CASK value differs from one airline to another based on the type of operation. For Low-Cost Carriers (LCC), the CASK is expected to have a lower value than the one generated by the Full-Service Carrier (FSC), as illustrated in Figure 2. Including this value in the problem, either in the objective function or the constraints, makes the problem more general, allowing it to fit any type of operation.
In what follows, the Fleet Assignment Model (FAM) used in stage I will be listed with the objective function to optimize and maximize the profit values for the operation and the constraints that will keep the problem realistic.
Objective Function
Constraints
Equation (6) illustrates the objective function of the Fleet Assignment Model to maximize the profit. The revenue stream for the airline in this paper is expressed in terms of the Revenue Passenger Kilometer (RPK), which represents the value of the passenger demand traveling the specific distance of each flight, as expressed in Equation (1). Multiplying the yield value by the RPK will lead to the revenue value of the flight. The cost part of the equation is defined by two parameters. The first one is the contribution of the unit cost, which depends on the fleet type, its capacity, and the distance of the flight. The second part of the airline’s cost is the overhead of the investment resulting from adding more aircraft to cover more airline operations, either by leasing or buying a new fleet.
The first part of the objective function is the expected revenue that is equal to the yield allocated for each route multiplied by the RPK. Using RPK in this equation is more viable due to the correlation between the RPK and the national GDP, as described previously. This can be defined as the revenue passengers Xi multiplied by the distance to be covered by each flight Di. The value of the yield for each route is a predefined parameter in the model, as the industry standard, where it is a major parameter used to define the viability of the route operation within the network.
The second part of the objective function is the sum of the operating costs of the flights, which are assigned to the different fleet types. It depends on the seating capacity of each fleet type and the type of flight, whether it is a short-haul or long-haul flight. Basically, this parameter denotes the capacity that an airline is offering in the market, and it can be compared easily with the demand for those seats.
The third part of the equation is the capital cost of the investment, the cost of the aircraft prorated to 52 weeks per year. With a schedule of one week of operation, the cost of the capital for that week is deducted for each fleet type in the equation.
Equation (7) is the coverage constraint that forces each flight to be covered by only one fleet type. Equation (8) is the balance constraint that ensures the effectiveness of the inbound and outbound flights from each airport. Through this constraint, the number of outbound flights from any airport does not exceed the number of inbound flights plus the number of aircraft that were grounded already at the same airport. In previous research published by Cadarso et al. in 2013 [17], the authors chose to control the balance constraint through the equality sign instead of using the minimum value of available grounded aircraft. In fact, that caused an infeasible solution to the problem and provided an inaccurate number of aircraft needed for the solution. This is because of the impractical assumption that Cadarso used, as all the inbound and outbound flights have to match their numbers. Cadarso et al., in the same model, added a specific equation to complement their suggested balance constraint. As this paper seeks practicality in the modeling and mapping, Cadarso’s assumption of balanced inbound and outbound flights has been relaxed and replaced with Equation (8), which makes the model fit a broader range of flight schedules.
The fleet size constraint of the model is defined and listed in Equation (9), where the number of aircraft grounded overnight in each airport is less than or equal to the number of aircraft available in that fleet type. The number of available aircraft in each fleet type shall be selected by the fleet mix as an input to the Fleet Assignment Model, as discussed previously.
Equations (10) and (11) represent the range and seating capacity constraints, respectively, and avoid any spill in passenger demand. In this work, the spill passenger is not considered, as it is meant to be for long-term planning and not for the operational short-term level. All the chosen fleet types in this work are expected to fulfill the passenger demand and the network operations of the airline. It is assumed that there is no passenger spill in the network. Hence, the assigned aircraft on each flight is expected to fulfill the distance and capacity limitation with no consideration for extra spill cost in case the aircraft capacity is not enough for the demand. If the aircraft cannot accommodate the required number of passengers requested on each route, the Fleet Assignment Model (FAM) will automatically select another fleet type. The same implementation is valid on the flight range where the assigned fleet type must be able to fulfill the range of the selected flight. Finally, Equation (12) is the non-negativity constraint.
Now that the full Integer Linear Programming (ILP) Model has been explained, it is convenient to start the second phase of the methodology with specific scenarios to highlight the response of the airline under the different fleet selections. The prescribed Fleet Assignment Model shall be repeated for each network design and fleet selection. The results of all the runs shall be mapped afterward in the disruption funnel, where selected measures and key performance indicators need to be highlighted to provide good visibility on the decision. In the following section, a description of the scenario selection criteria and the measures of the disruption funnel will be explained.
6. Stage II: The Disruption Funnel Mapping and Analysis
At this stage, the optimized objective function and profit coming out of the Fleet Assignment Model can be vulnerable to some sustainable disruption events like loss of routes, loss of fleet, war zones, geopolitical conflicts, or any other disruption category that may severely impact the airline operation and its profitability. The possible operations shall be mapped using the “Disruption Funnel”, where shrinking the operations may lead to a bottleneck. This can be expressed in terms of Revenue per Passenger Kilometer (RPK), which can be correlated to the Global Domestic Product (GDP) based on the statistics of the international economic growth statistics.
To wrap up the relationship between the supply and the demand in the airline operation, the supply is the Available Seat Kilometer (ASK), and the demand is the Revenue Passenger Kilometer (RPK). The difference between them denotes the profit allowance and survival of the airline operation in times of sustainable disruption. It is intended to prove that the gap between the gap between the supply and demand in the airline supply chain cycle will impact the profitability of the airline. With different scenarios, the gap between ASK and RPK is expected to change, and hence, the profit value will also change until it approaches a negative value, and the operation becomes really critical to sustain. After that bottleneck in the operation, usually, the airline will have to step back from the market and find an escape route, either by consolidating the operations with another airline or selling some of its assets to pump cashflow into the business, or the worst case is to cease operations and file for bankruptcy.
In this section, our intention is to map the RPK and ASK in the disruption funnel over several scenarios of the operation. For instance, operating single-aisle aircraft on short-haul operations shall create a different response on the profit margin from operating a wide-body aircraft on the same types of flights. Many scenarios will be put in place to try different setups for the operational scheme and start the mapping process of the results for RPK and ASK, along with the load factor and the profit margin on the disruption funnel. As illustrated in Figure 1, the divergent cone of operation is the limit needed by the airline to have a safe operation. Whenever this distance between the two borders of the funnel shrinks, it means that the operational profit margin is critical, and on the border, until it reaches a certain point, the airline’s operational economic performance will not sustain the business.
For each scenario in the mapping of the disruption funnel, some parameters are calculated, such as the average load factor, profit margin, RPK, ASK, the gap between the RPK and ASK, and the utilization of the aircraft invested capital. The aircraft capital cost value is amortized to the period of the flight schedule, which means that the capital value is known per day and per week. However, after the simulation and optimization of the best fleet portfolio selection, the flights utilize only specific hours from each aircraft, which will lead to grounding hours. In such a case, the airline is investing in buying newer or bigger aircraft, for instance, that are not needed and not utilized properly. This shall be illustrated and mapped in the disruption funnel to understand the full picture of the strategic investment and profitability analysis.
The advantage of using the disruption funnel in such an analysis is the scalability of the fleet planning problem. It might be useful to analyze many scenarios, including the impact of more complicated disruptions. Passenger demographics, cost of fuel, and total loss of operational routes are all examples of scenarios that will impact the fleet planning process and make the mapping even harder. With such a big scale of the problem after including so many scenarios, the advantage of the disruption funnel is that it can digest some comparative parameters, and each proposed fleet mix will only take one demonstration circle from the funnel. However, the drawback that may occur when including so many parameters and scenarios is drawing multiple circles of the funnel together at the same levels of the fleet mix. For instance, an airline could illustrate the mapping of the disruption funnel while changing the network planning due to a war zone and, at the same time, anticipate the loss of passengers and the increase in fuel. Practically, this is a very difficult scenario to happen altogether. However, in such a case, the optimum way to map those scenarios is to illustrate three circles together at the same level of each fleet mix, which may not provide the best visual output.
7. The Proposed Model Implementation
A dataset with a published flight schedule for an airline was used in this study; a sample of the data is listed in Table 1. The data are captured from some public sources of the flight schedule for a Full-Service Carrier (FSC) airline. Some of the data parameters were assumed, such as the passenger demand and yield values; however, the missing data were benchmarked with other available public data published by the US Department of Transportation and other reliable sources listed in the references and explained in the following part. Each flight has a time and a distance based on the origin and destination of the flight. The time is used for the calculations of the fleet utilization to track how many hours per day each fleet has been assigned to the flights; the time needed to cross a flight differs from the direction of the flight, either from east to west or opposite to that, based on the jet stream. The distance is the unchanged parameter for each flight that is used for the calculation of the supply and demand, which are defined as ASK and RPK, respectively. The number of passengers, “pax”, represents the average flow of passengers per flight. The yield value is the competitive parameter for each route based on the average airfare proposed by the airlines competing on that route. The data for yield and passenger demographic categories listed in the “spending category” were referenced as average values based on the Department of Transportation (DoT) [32] and the Bureau of Transportation Statistics (BTS) [33]. The segmentation of the data used for this paper depends on the “flight category” and the category of fleet types listed in Table 2. The parameters used are dependent on flight distances, such as yield, CASK, RPK, ASK, and load factor.

Table 1.
Sample of flight data parameters of the airline.

Table 2.
Performance parameters for the considered fleet types.
With 16,000 flights in the schedule of three months, the parameters are segmented into two flight ranges, domestic and international flights, operated by four different fleet types. Table 2 shows the performance parameters of the fleet types used in this work. The fleet types are divided into two main categories, which are the single-aisle fleet (SA), also defined as regional jets, and the wide-body fleet (WB), as per the industry nomenclature. The value of the unit cost is described as the Cost per Available Seat Kilometer (CASK), and it depends on several factors, including flight hours, fuel burn, capacity, and the range of the aircraft. In the table, two different values of the unit cost are selected. Based on the performance of each fleet type on several routes, the CASK will differ. The longer the route, the lower the CASK. This is shown in Table 2, where the value of the CASK is lower in the case of international flight coverage than the domestic flight allocation.
Each fleet type has its own fuel burn rate that typically affects carbon emissions and contributes to the sustainability analysis performed and analyzed in the Section 8. That factor is a key decision parameter for many airlines. Currently, the International Civil Aviation Organization (ICAO) is formulating serious measures for carbon emissions, and the restrictions are becoming more tough on the aviation industry. Considering the measures of ICAO, some of the airspaces around the world may be restricted for airlines that do not comply with the regulations. The fuel used in that analysis is assumed to be Jet A1 with pure kerosene. This type of fuel produces around 3.16 kg of CO2 for each kg. of fuel burned.
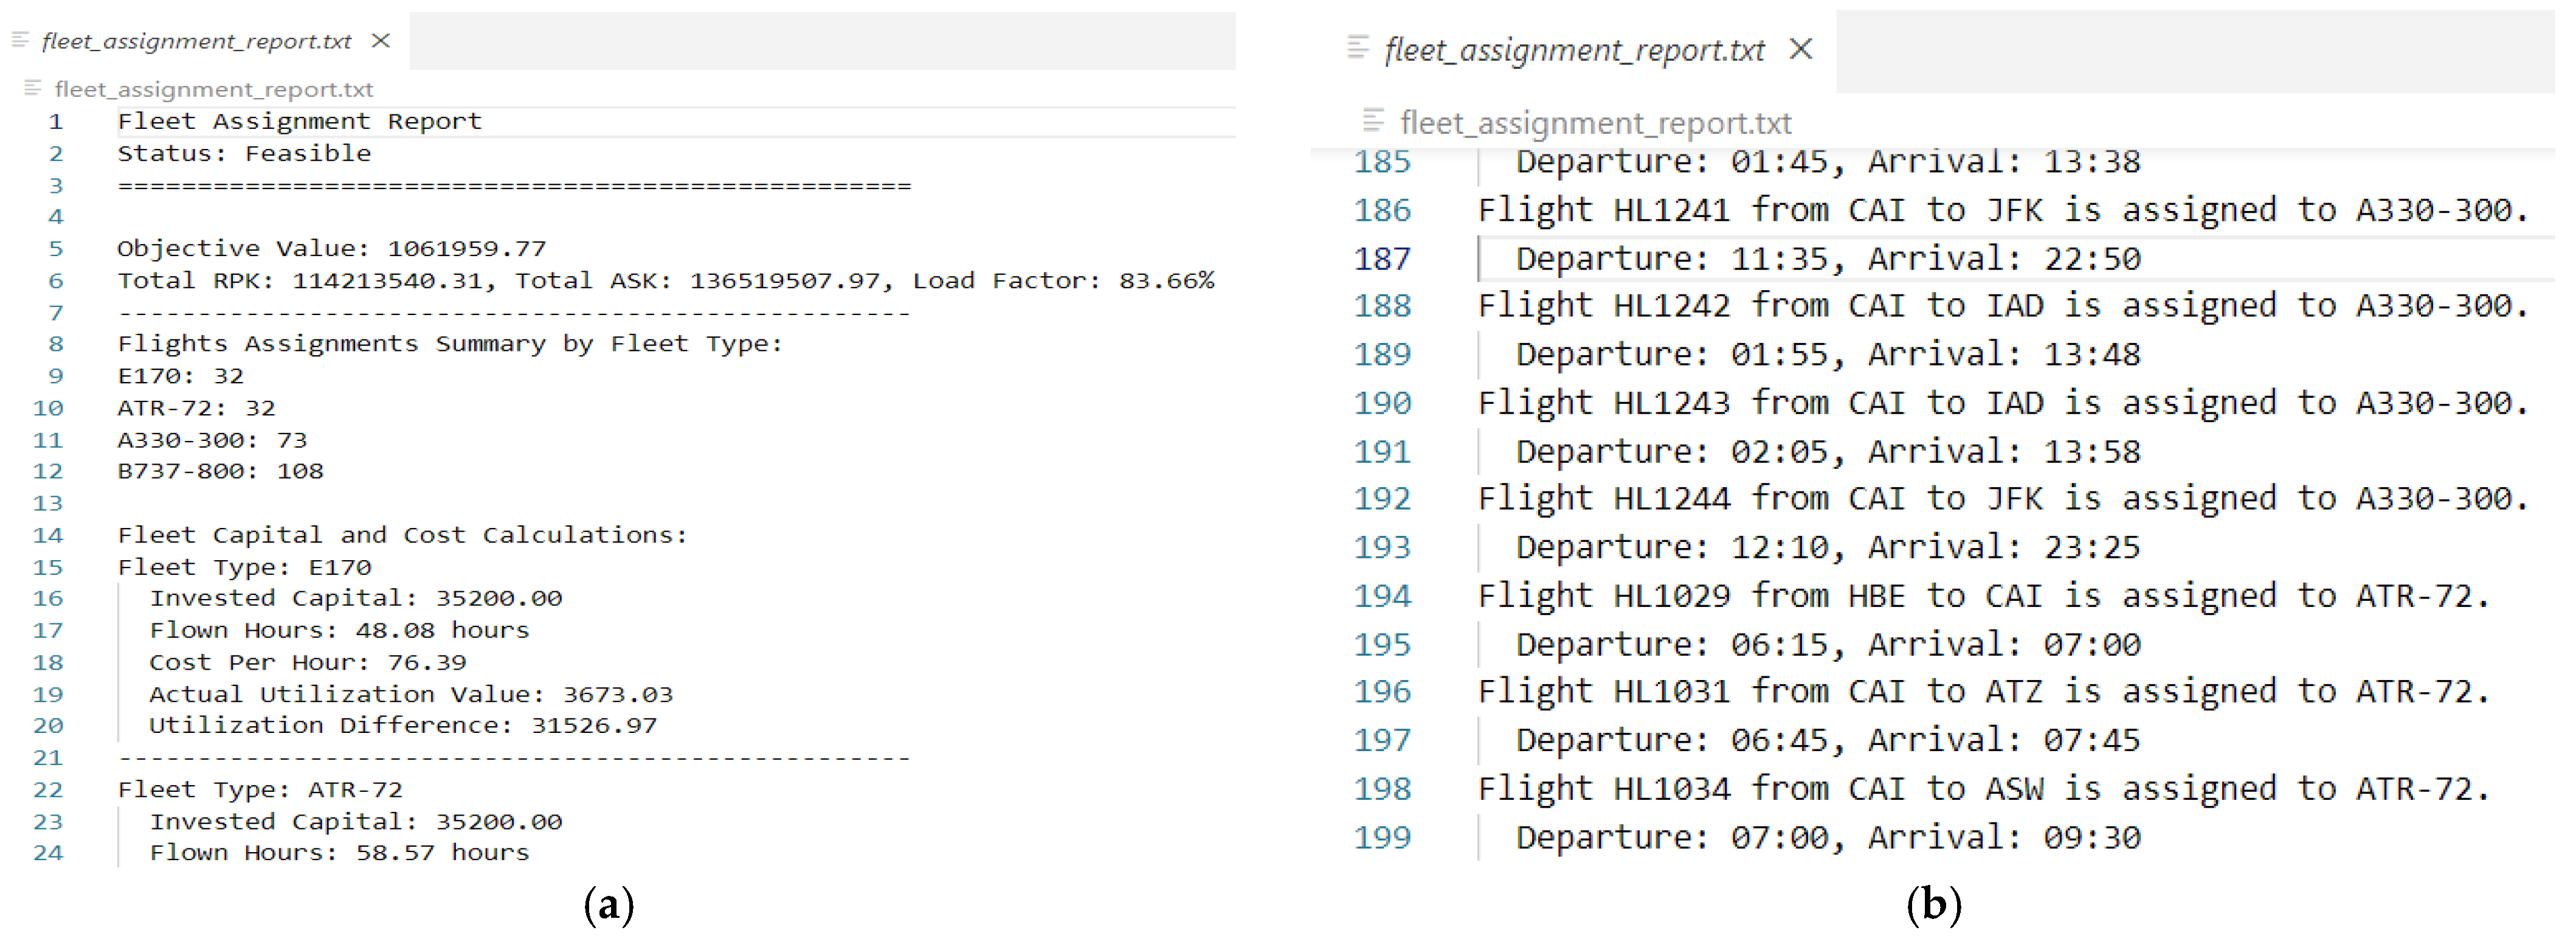
The inputs for phase I of the Fleet Assignment Model (FAM) are all the data listed in Table 1 and Table 2, along with the number of aircraft in each fleet portfolio. The results from that phase are the performance indicators of the model after optimization, as captured in Figure 4. The output is the flight assignments to the existing fleet types, the number of overnight grounded aircraft of each fleet type at every airport, the profit objective function, RPK, ASK, load factor, cost of capital invested in adding the fleet, and the utilization of the fleet. All results shown belong to only one day of operation as a sample of the results out of the system. The listed results and key performance indicators coming out of phase I will represent the inputs for phase II in the mapping of the disruption funnel. Based on that mapping, the gap between the supply and demand will reveal the critical spectrum of operation for the airline, which shall be obvious. After examining the results in the mapping, the airline delegates will be able to decide which strategic decision to take for the fleet acquisition and the flight category to keep resisting potential sustained disruption events.
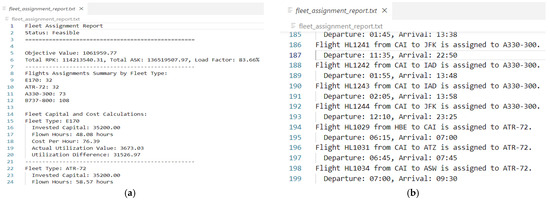
Figure 4.
Phase I output report showing the performance indicators and the assignments: (a) feasibility of the problem with the supply and demand and investment parameters; (b) flight assignments to fleet types.
By examining the selected data for three months, the results show that the CASK decreases with the distance covered by the flights, which means that the fleet is more effective in terms of hourly performance whenever the flight is longer. This is aligned with the propulsion theory of the high bypass turbo-fan engines installed on most civil aircraft. The aircraft burns the maximum amount of fuel in the take-off phase due to the higher temperatures and air density close to the ground. Once the aircraft starts to become airborne and increases the altitude, the fuel consumption starts to decrease, and the flight becomes more effective.
RASK is the lowest unit revenue that the yield can reach. The lower the yield, the lower the airfare the airline can utilize to compete in the market. That means that the yield inside the aircraft cabin may vary from one airline to another. For each seat class inside the aircraft, there is a yield. The first class and business seats, for instance, have higher yields than the economy class as the airfare value offered to the premium class passengers is significantly higher than the fare offered to the economy class travelers. Aligning with the same concept, RASK also becomes higher in the premium seat classes.
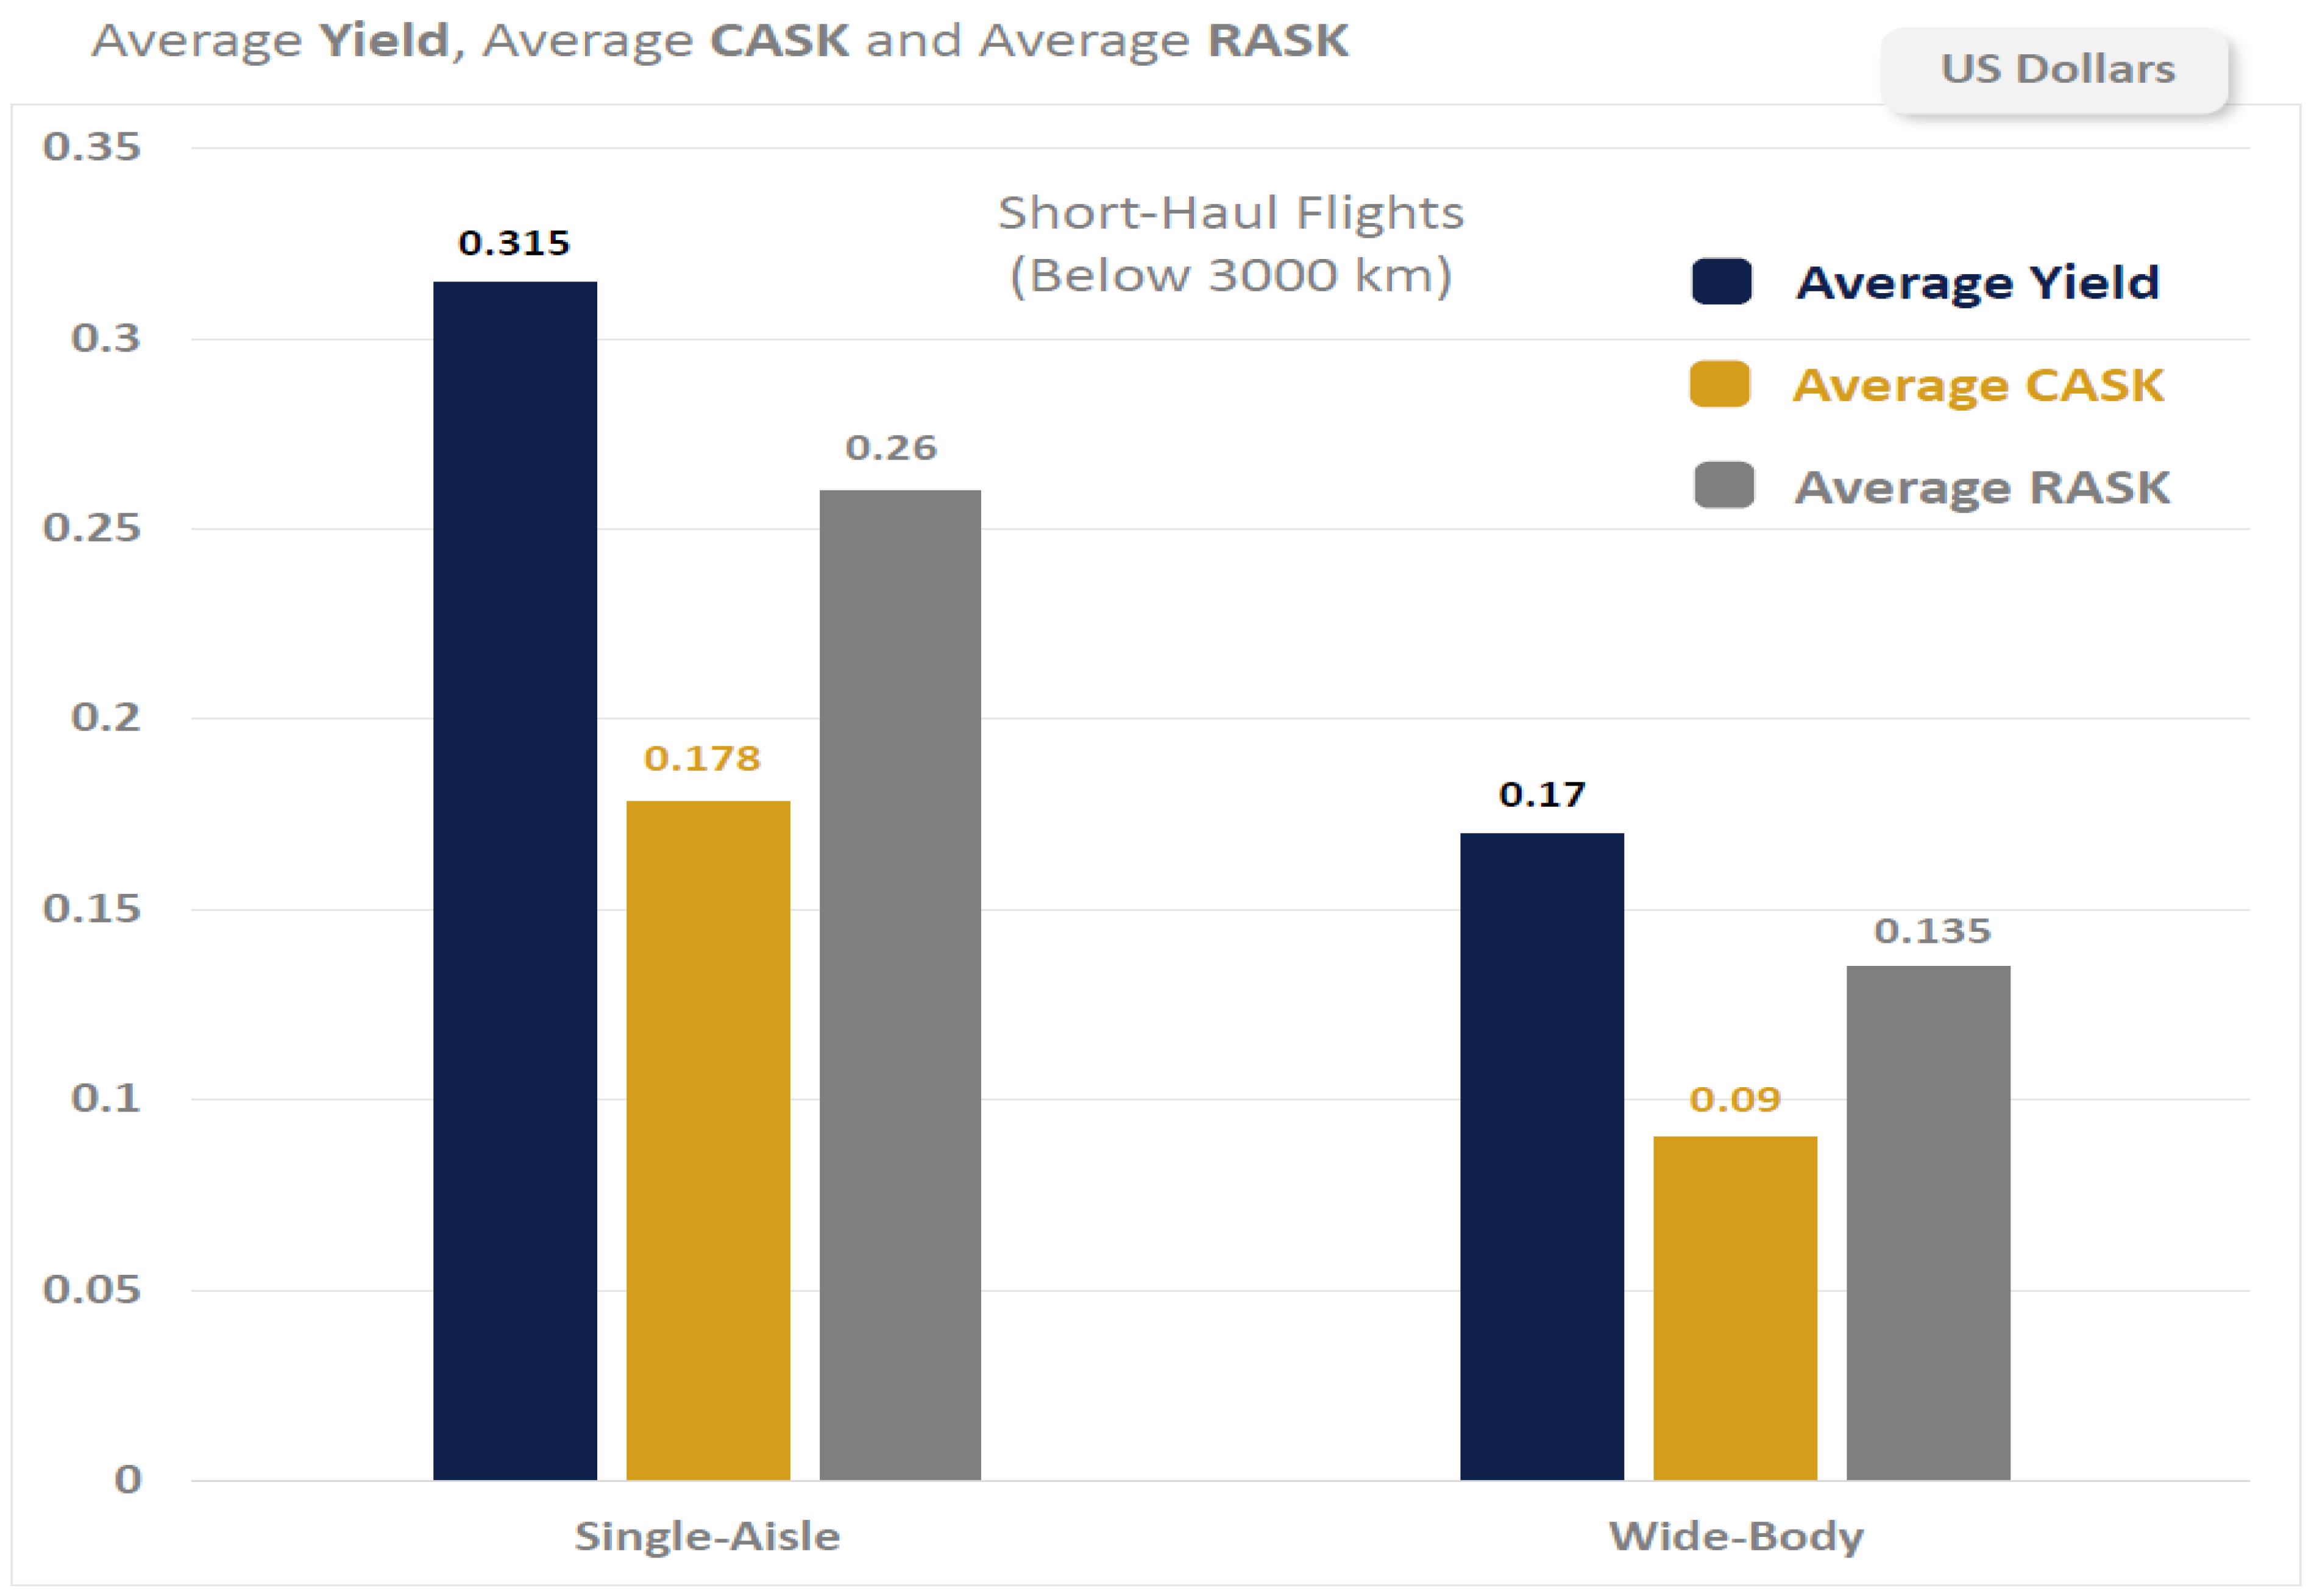
To wrap up the relationship between the three KPIs (RASK, CASK, yield), it is worth mentioning that yield is only dependent on the route and distance covered by the flight, whereas RASK and CASK depend on the selected fleet type. Each route has a target yield specified by the airlines based on the average fare value and the passenger demographic; if it is attracting a high-spending demographic, the airfare should be higher than other lower-profile routes. The yield needs to fall in the average value of the market and competition; otherwise, the passengers will always select the lower fare.
By comparing the performance of the two categories of fleet (single-aisle and wide-body) using the main three KPIs (CASK, RASK, and yield), Figure 5 shows the difference in performance for the short-haul operations. The unit cost CASK and RASK have lower levels when utilizing the wide-body fleet types, whereas the available seats onboard are higher for that fleet category. In this case, the unit cost is not only smaller on the wide-body fleet, but the unit revenue is also smaller, which makes the preference hard to define. The way forward to discovering which fleet category is performing better in terms of profitability is to extract the profit values after the optimization of the Fleet Assignment Model for each combination of and under the different scenarios of airline network planning.
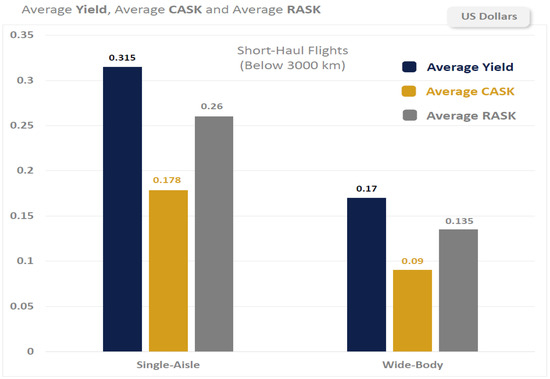
Figure 5.
Comparison between Yield, CASK and RASK for single-aisle and wide-body fleets.
In case of a sustainable disruption, it is expected that there will be a loss of demand on specific sectors and routes of the airline, and hence, the RPK defining the demand will drop accordingly, and the yield will increase far away from the RASK. In such a case, the airline has to raise the airfare value to compensate for the higher yield inside the same cabin configuration to maintain the profit. The dilemma appears when a recession accompanies the disruption, and the passengers may not be able to afford higher fares. A potential solution for that situation is to find the best fleet–flight combination that will fulfill the profitability requirements without an increase in the fare. This is why, in the scenarios proposed in that implementation scheme, the yield values for all routes are assumed to be constant, so the comparison can reveal the trend of profitability profile and the gap between supply and demand.
The proposed solution for the disrupted operations is to allocate a set of scenarios and combinations for the fleet mix, single-aisle and wide-body combinations, and the types of operations in terms of the distance of the flight and the route type. With each combination, the Fleet Assignment Model will be solved, and the results will be mapped on the disruption funnel. Allocating the results in different scenarios will show the least damaged combinations and the best fleet portfolio that can be assigned on selected routes to guarantee the profitability of the airline in case of sustainable disruption, loss of demand, or recession and the loss of purchasing power.
Table 3 shows the different scenarios used in this model. The airline performs a set of flights as a combination of domestic and international flights. The airline already has a policy of multi-fleet operation, which gives the airline the chance to operate in different sectors with a big range of distances and passenger demands. The fleet types of the Embraer 170 and ATR 72 are used for domestic flights, and the two other fleet types, B737-800 and A330-300, have the capability to cover higher flight ranges and offer higher capacity in the aircraft cabin. The first two fleet mixes used in the strategic plan are considered combinations of SA and WB fleet types to cover the entire spectrum of the flights in the schedule. Each fleet mix consists of a number of aircraft from each fleet type. The percentages of the proposed number of aircraft from each fleet type are written in Table 3 along with the number. This shows some emphasis on specific fleet types and will make it easier to understand which fleet types are dominating the performance and providing better results after the mapping in the disruption funnel. For instance, fleet mix 3 emphasizes the fleet of A330-300 over the B737-800 for international flights, whereas the opposite appears in fleet mix 4.

Table 3.
Scenarios for the disruption funnel mapping.
In case of sustainable disruption, the airline is expected to withdraw from some routes or get rid of some fleet types due to the loss of demand and possible recession, as described earlier. Fleet mixes 3 and 4 consist of wide-body fleet types, which are introduced to cover only international flights that have more than 1000 km of flight distance. Fleet mixes 5 and 6 are meant to cover only domestic flights that are less than 1000 km, with the regional jets defined as single-aisle fleet types. Mapping all of those combinations shall lead to the results that show the least vulnerable fleet mix with the best resilience system against disruption.
8. Results and Discussion
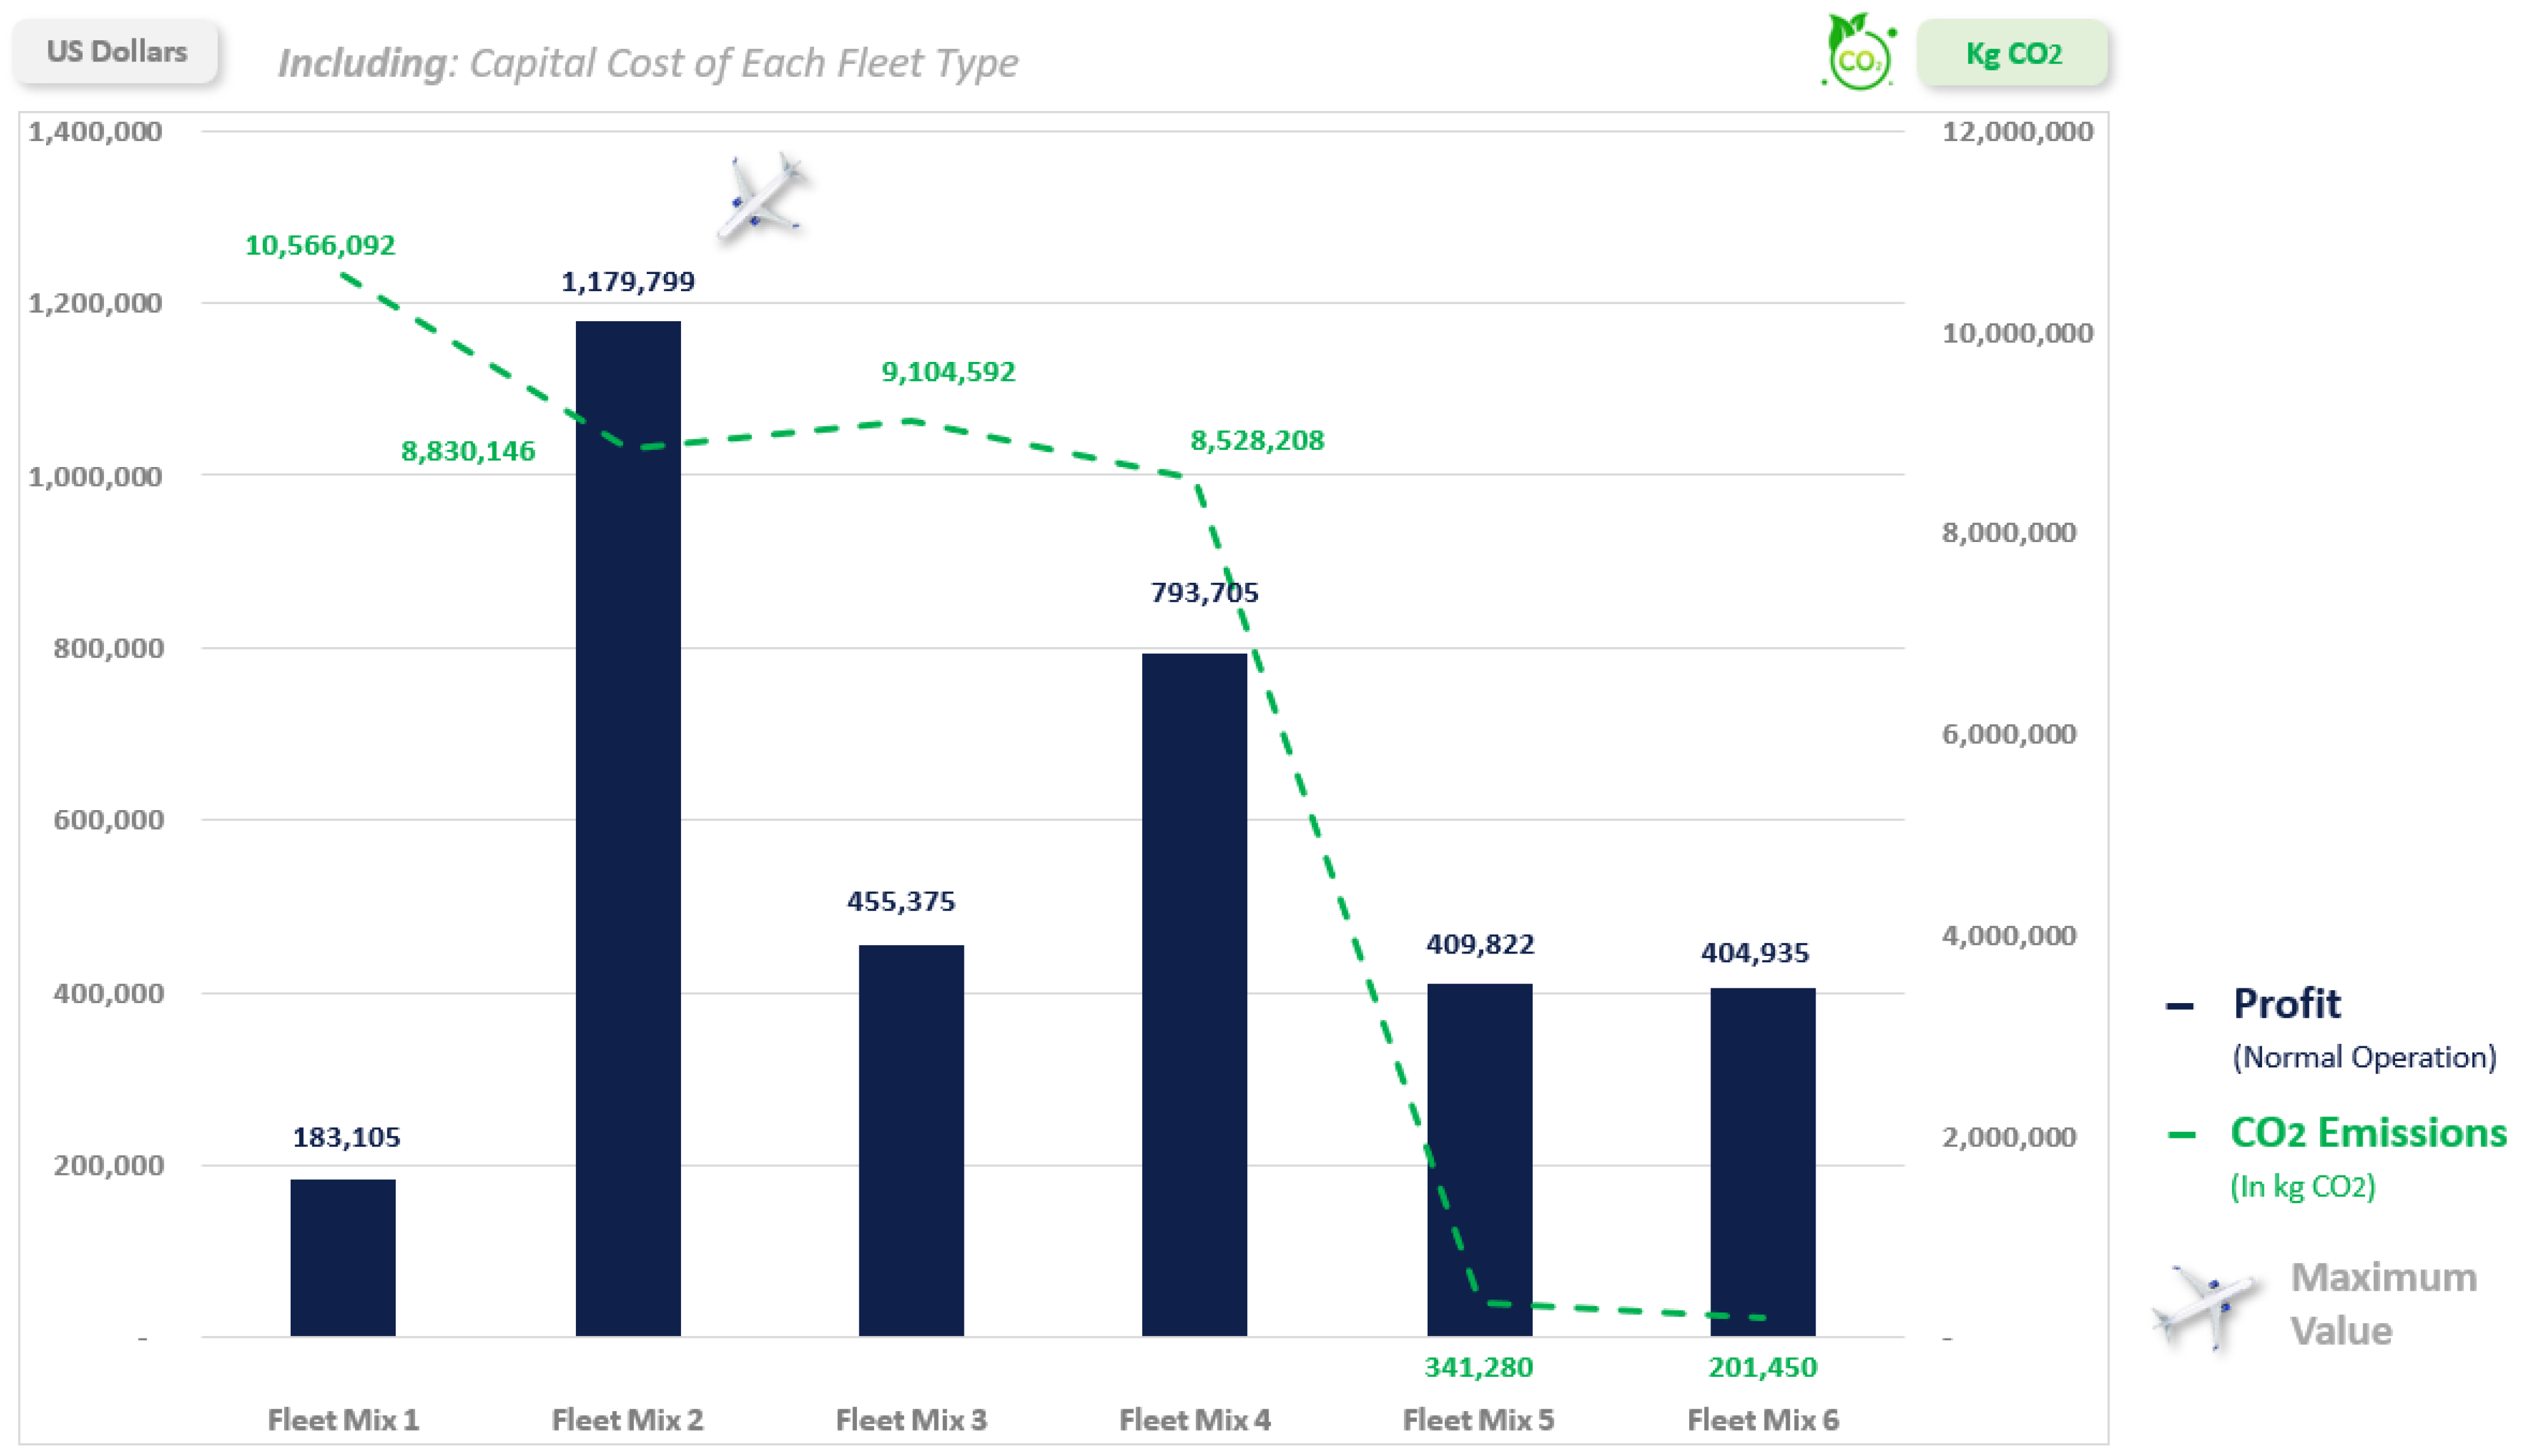
Figure 6 shows the different values of profit, the vertical bars, as an output from the Fleet Assignment Model (FAM) under the fleet mix and scenarios listed in Table 3. It is obvious that the profit value differs from one fleet mix to the other. The highest profit value comes from fleet mix 2, with the biggest emphasis on the B737-800. When utilizing the majority of the fleet as A330-300, which is a big aircraft with a lot of seats, there is a risk of not covering all the available seats on board, and hence, the load factor drops, leading to a lower profit margin. Therefore, to cover all flights in the schedule with a high profitability profile, it is recommended to use a fleet mix with a single-aisle emphasis rather than a wide body with a high risk of taking off partially empty. After the analysis of the Fleet Assignment Model and the extraction of the number of flown hours per fleet type, the total amount of fuel burned and, accordingly, the amount of carbon emissions is calculated based on the rate of emissions and the type of fuel Jet A1. The results in Figure 6 show an improvement in the entire network operation, in terms of carbon emissions, for fleet mix 2. Now, it can be confirmed that the second fleet mix is better for the normal operation of the airline.
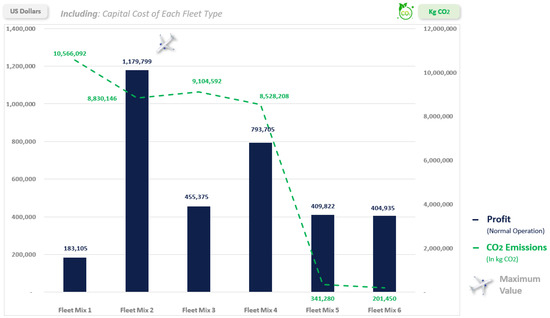
Figure 6.
Optimum profit from FAM under different airline network scenarios.
Shrinking operations to handle only international or domestic flights will impact the airline’s profitability. Looking at the scenarios of fleet mixes 3 and 4, it is obvious that, based on the passenger demand for the airline network, B737-800, again, has domination in the profitability performance. Furthermore, in terms of sustainability, fleet mix 4 has a better carbon emission than fleet mix 3, which makes it a better selection. On the other hand, when operating only domestic flights, the profit value will be much less than in any other scenario, and that is normal due to the lower airfares. The best fleet combination that can be used for that type of domestic operation is the Embraer, although the difference is not that significant between fleet mixes 5 and 6. To complement the picture of the domestic operation, the carbon emissions are still almost equal between fleet mixes 5 and 6, which makes no significant change in the decision. Now, it is important to see all other parameters mapped together in one comprehensive disruption funnel to understand the impact of shrinking the operation on the airline profitability and the vulnerability of the different fleet mix.
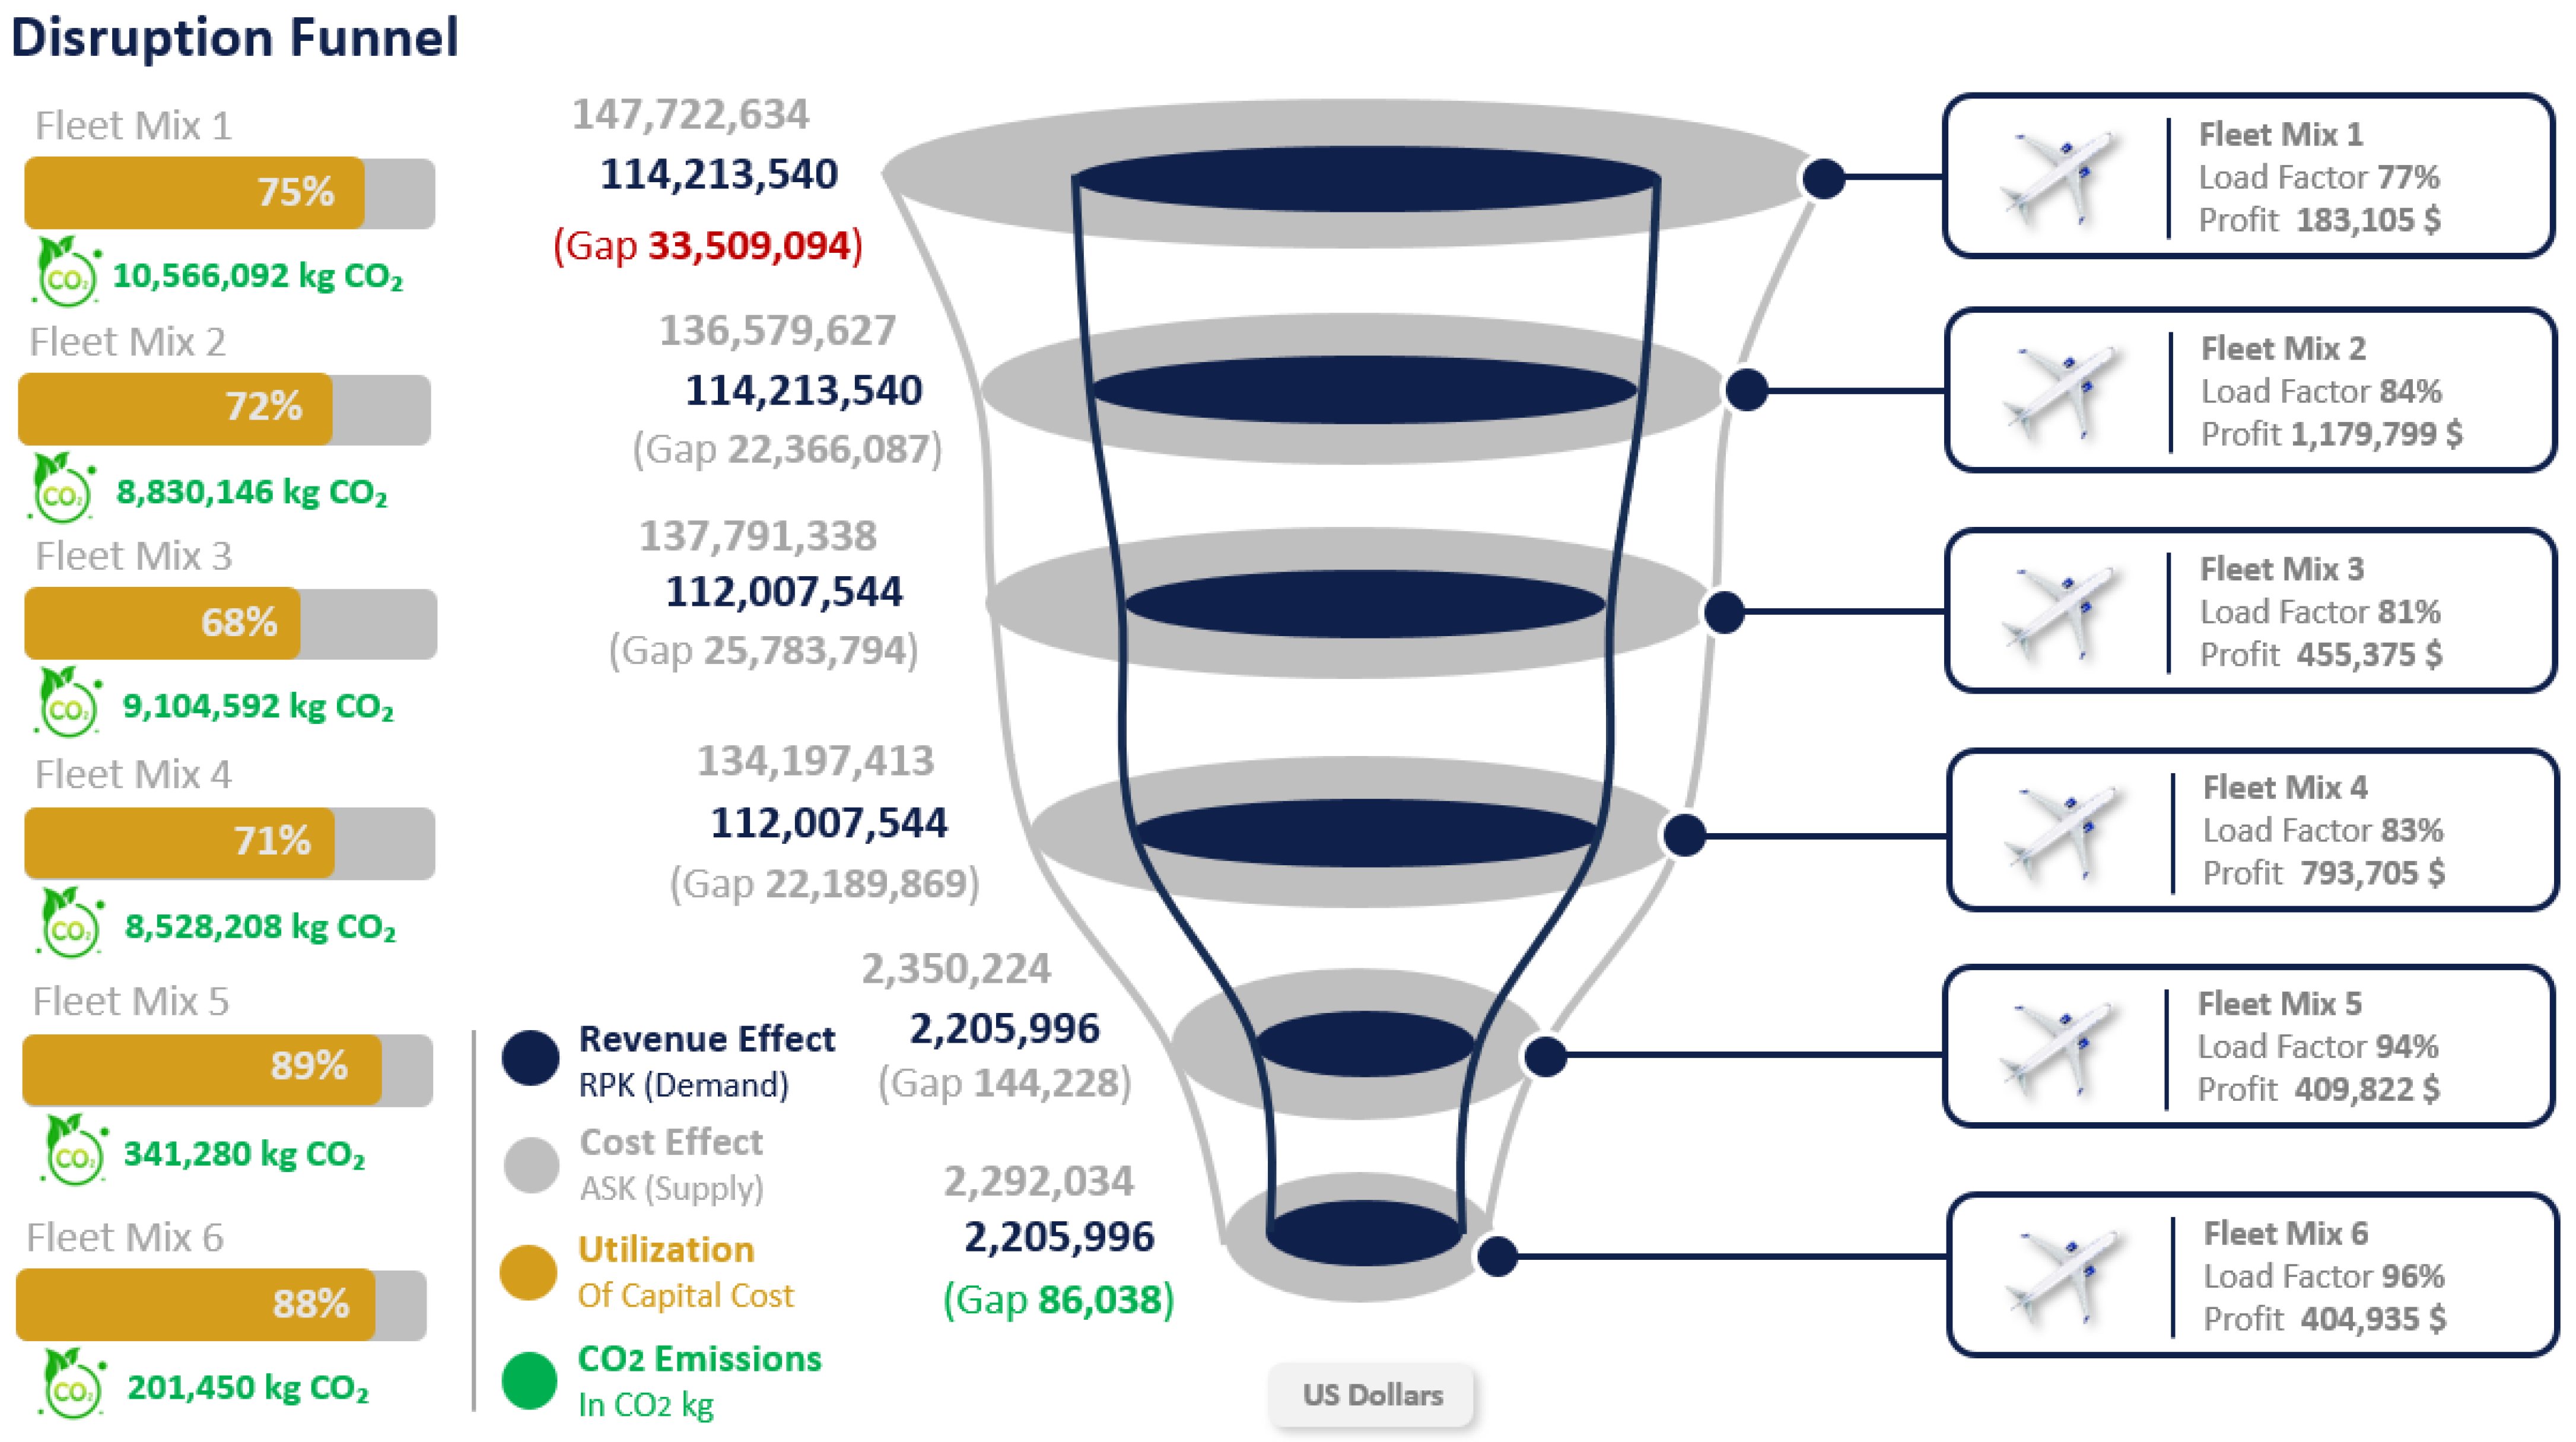
In the disruption funnel illustrated in Figure 7, the results coming from the different fleet mixes are illustrated in order from the first two allocated to cover the entire airline network operations; moving to the middle two fleet mixes, 3 and 4, allocated for the international flights; and then fleet mixes 5 and 6 for the domestic flights. In order, the gap between the demand, identified as Revenue Passenger Kilometer (RPK), and supply, identified as Available Seat Kilometer (ASK), is shown, respectively, beside each fleet mix. The highest gap is on top of the funnel, highlighted in red, and related to fleet mix 1, with a relatively lower value for the profit than fleet mix 2, which covers the entire flight spectrum.
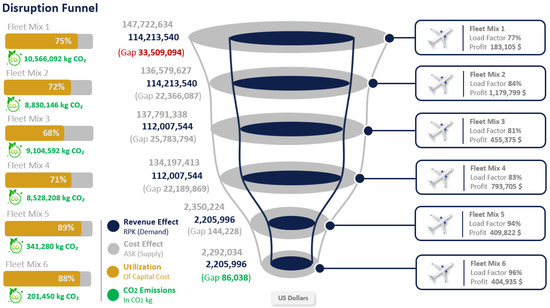
Figure 7.
A disruption funnel showing the different airline network scenarios.
Moving down the funnel, the profit value decreases with the lower number of flights, either international or domestic flights. The gap between supply and demand is at its lowest value at fleet mix 6. However, at this level, the profit value will drop to its lowest level as well. So, the utilization of the fleet is very high, with a load factor of 96%, which is not safe enough for the airline because, in this case, if the demand drops a little bit more, the airline will start a decay curve toward a negative profit. Looking at the left-hand side of Figure 7, the horizontal bars show the utilization of the fleet asset capital value. In other words, how much of the amortized value of the aircraft is used? As an example, if the aircraft capital cost per day is USD 10,000 and the expected utilization of the aircraft is 60% of the day, that means that the value of an hour is 10,000 divided by 24 and multiplied by 0.6. After the assignment of the different fleet types on the scheduled flights, the total utilized hours will be summed and multiplied by the hourly rate and then compared to the invested capital of the aircraft value. Along with each scenario in the network planning and fleet, the amount of carbon emissions is listed based on the type of fuel used and the hourly burn rate of each fleet type.
Having a deeper look at the capital cost utilization gap and the gap between supply and demand, it is recommended to go for fleet mix 4 if a sustained disruption starts to appear in the airline’s demographic network operations. The load factor for that fleet portfolio within the adjusted network is 83%, which is aligned with the industry standard, and the utilization of the capital cost is 71%. The carbon emissions for fleet mix 4 are not very far from fleet mix 2, which covers the entire network operations of the airline. Moving on to domestic flights only is very critical for the airline as the profit is moving deeper down. That being said, the recommendation for that airline is to trade off its profitability in times of sustainable disruption and move toward fleet mix 4 to cover international flights only, especially since the main measures of aircraft capital utilization and carbon emissions did not change dramatically with the change in network planning.
9. Conclusions and Future Work
In the current work, the network planning of the airline was discretized into domestic and international flights, and the demand for flights was considered constant over the years of the planning horizon. The purpose of this study was to implement the disruption funnel for a practical example of an airline and to describe the possibilities that the airline has for its network resilience. The way out of the sustained disruption was described within a set of network operations, fleet portfolio, and constant cost and revenue units. Every fleet mix assigned to operate a specific flight demographic has some performance indicators that define the gap between supply and demand and the efficiency of the strategic decision of the airline when acquiring the different fleet types.
In future work, some extra scenarios will be introduced for mapping in the disruption funnel. The scenarios can be listed as loss of passenger demand, recession and loss of the purchasing power impacting the yield values that the passengers can accommodate, the cost variability and the increase in the cost units due to fuel spikes or geopolitical conflicts, fleet capital value, and the impact of the geopolitical conflicts on the sales and market values of the aircraft capital cost. The passenger demographic will be considered a major factor in the scenario plot. The routes in the future work will be divided into a low-spending demographic, a moderate-spending demographic, and a high-spending demographic, where the passengers on those routes can pay significantly higher airfares than the normal network routes. In case of sustainable disruption, the airline may not only choose the short-haul or long-haul flights to keep in the network but also choose which specific flights can generate more revenue within the same distance. In a nutshell, the scenarios that can be mapped in the disruption funnel can be multi-dimensional, showing the strength of the network and providing better visibility for the vulnerability and strength of the decision-making process.
Author Contributions
Conceptualization, H.A.E. and A.B.E.; Methodology, H.A.E.; Validation, A.B.E.; Writing—original draft preparation, H.A.E.; Writing—review and editing, A.B.E.; Visualization, H.A.E.; Supervision, A.B.E. All authors have read and agreed to the published version of the manuscript.
Funding
This research received no external funding.
Data Availability Statement
Data available in a publicly accessible repository. CASK analysis for airlines: https://centreforaviation.com/analysis/airline-leader/cask-analysis-allows-global-airline-unit-cost-benchmarking-and-strategic-mapping-282263, accessed on 6 December 2023.
Conflicts of Interest
The authors declare no conflict of interest.
Glossary
| Sets | |
| F | Set of fleet types |
| I | Set of flights |
| A | Set of airports |
| T | Set of time nodes indexed by t defined by each airport and event time slot |
| ST | Set of count time at which the fleet is counted |
| ASt,f | Set of arriving flights with fleet type f at the time node t |
| DSt,f | Set of departing flights with fleet type f at the time node t |
| Decision Variables | |
| Zif | Binary decision variable equals 1 if flight i is assigned to fleet type f; otherwise, it equals 0 |
| OVaf | Integer variable indicates the number of aircraft from fleet type f grounded at each airport a |
| Parameters | |
| Yieldi | This variable denotes the unit revenue resulting from each paying passenger per kilometer flown. It denotes the break-even value of the unit revenue correlated to the average passenger fare on flight i |
| CASKif | This variable denotes the unit cost resulting for each seat offered per kilometer flown. The unit cost depends on the performance of fleet type f on flight I, and it depends on the range of flight |
| Di | Distance between origin and destination on each flight i |
| Capf | Seat capacity on each aircraft of fleet type f |
| Xi | Integer variable for the number of passengers in each flight i |
| Nf | Available number of aircraft from fleet type f |
| Yi,t | Arbitrary parameter that takes the value of 1 if there is a flight i flying at the time node t within the set of event time nodes T; otherwise, it is 0 |
| CCf | Aircraft ownership capital cost in fleet type f |
| Rf | Maximum flight range covered by fleet type f |
References
- Elhamy, H.; Eltawil, A.; Gheith, M. The Disruption Funnel: A Model for Fleet Asset Management During Sustainable Disruption. In Proceedings of the 2022 IEEE International Conference on Industrial Engineering and Engineering Management (IEEM), Kuala Lumpur, Malaysia, 7–10 December 2022. IEEM55944.2022.9989571. [Google Scholar]
- Repko, M.; Santos, B. Scenario tree airline fleet planning for demand uncertainty. J. Air Transp. Manag. 2017, 65, 198–208. [Google Scholar] [CrossRef]
- Serrano-Hernandez, A.; Cadarso, L.; Faulin, F. Strategic Multistage Tactical Two-Stage Stochastic Optimization Model for the Airline Fleet Management. Transp. Res. Procedia 2020, 47, 473–480. [Google Scholar] [CrossRef]
- Şafak, Ö.; Çavuş, Ö.; Aktürk, M. A two-stage decision dependent stochastic approach for airline flight network expansion. Transp. Res. Part B Methodol. 2022, 158, 78–101. [Google Scholar] [CrossRef]
- Ahmed, S.; King, A.; Parija, G. A multi-stage stochastic integer programming approach for capacity expansion under uncertainty. J. Glob. Optim. 2003, 26, 3–24. [Google Scholar] [CrossRef]
- Baykasoğlu, A.; Subulan, K.; Taşan, A.; Dudaklı, N. A review of fleet planning problems in single and multimodal transportation systems. J. Transp. A Transp. Sci. 2019, 15, 631–697. [Google Scholar] [CrossRef]
- Birolini, S.; Cattaneo, M.; Malighetti, P.; Morlotti, C. Integrated origin-based demand modeling for air transportation. J. Transp. Res. Part E Logist. Transp. Rev. 2020, 142, 102050. [Google Scholar] [CrossRef]
- Birolini, S.; Jacquillat, A.; Cattaneo, M.; Antunes, A. Airline Network Planning: Mixed-integer non-convex optimization with demand–supply interactions. J. Transp. Res. Part B Methodol. 2021, 154, 100–124. [Google Scholar] [CrossRef]
- Birolini, S.; Antunes, A.; Cattaneo, M.; Malighetti, P.; Paleari, S. Integrated flight scheduling and fleet assignment with improved supply-demand interactions. J. Transp. Res. Part B Methodol. 2021, 149, 162–180. [Google Scholar] [CrossRef]
- Hsiao, C.; Hansen, M. A passenger demand model for air transportation in a hub-and-spoke network. J. Transp. Res. Part E: Logist. Transp. Rev. 2011, 47, 1112–1125. [Google Scholar] [CrossRef]
- Jamili, A. A robust mathematical model and heuristic algorithms for integrated aircraft routing and scheduling, with consideration of fleet assignment problem. J. Air Transp. Manag. 2017, 58, 21–30. [Google Scholar] [CrossRef]
- Dong, Z.; Chuhang, Y.; Lau, H. An integrated flight scheduling and fleet assignment method based on a discrete choice model. J. Comput. Ind. Eng. 2016, 98, 195–210. [Google Scholar] [CrossRef]
- Carreira, J.; Lulli, G.; Antunes, A. The airline long-haul fleet planning problem: The case of TAP service to/from Brazil. Eur. J. Oper. Res. 2017, 263, 639–651. [Google Scholar] [CrossRef]
- Marazzo, M.; Scherre, R.; Fernandes, E. Air transport demand and economic growth in Brazil: A time series analysis. Transp. Res. Part E 2010, 46, 261–269. [Google Scholar] [CrossRef]
- Fuellhart, K.; Ooms, K.; Derudder, B.; O′Connor, K. Patterns of US air transport across the economic unevenness of 2003–2013. J. Maps 2016, 12, 1253–1257. [Google Scholar] [CrossRef][Green Version]
- Liu, M.; Ding, Y.; Sun, L.; Zhang, R.; Dung, Y.; Zhao, Z.; Wang, Y.; Liu, C. Green Airline-Fleet Assignment with Uncertain Passenger Demand and Fuel Price. J. Sustain. 2023, 15, 899. [Google Scholar] [CrossRef]
- Cadarso, L.; Marín, A. Robust passenger-oriented timetable and fleet assignment integration in airline planning. J. Air Transp. Manag. 2013, 26, 44–49. [Google Scholar] [CrossRef]
- Constantijn, A.; Santos, B.; Clarke, J.-P. Portfolio-based airline fleet planning under stochastic demand. Omega 2020, 97, 102101. [Google Scholar]
- Kohl, N.; Larsen, A.; Larsen, J.; Ross, A.; Tiourine, S. Airline disruption management—Perspectives, experiences and outlook. J. Air Transp. Manag. 2007, 13, 149–162. [Google Scholar] [CrossRef]
- Hassan, L.; Santos, B.; Vink, J. Airline disruption management: A literature review and practical challenges. J. Comput. Oper. Res. 2021, 127, 105137. [Google Scholar] [CrossRef]
- Geursen, L.; Santos, B.; Yorke-Smith, N. Fleet planning under demand and fuel price uncertainty using actor–critic reinforcement learning. J. Air Transp. Manag. 2023, 109, 102397. [Google Scholar] [CrossRef]
- Gorjidooz, J.; Vasigh, B. Aircraft Valuation in Dynamic Air Transport Industry. J. Bus. Econ. Res. 2010, 8. [Google Scholar] [CrossRef]
- Vasigh, B.; Azadian, F. Aircraft Valuation in Volatile Market Conditions; Springer: Berlin/Heidelberg, Germany, 2022. [Google Scholar]
- CAPA Center for Aviation. CASK Analysis Allows Global Airline Unit Cost Benchmarking and Strategic Mapping; CAPA: Sydney, Australia, 2016. [Google Scholar]
- The World Bank Publications. Available online: https://data.worldbank.org/indicator/NY.GDP.MKTP.CD?end=2020&locations=US&most_recent_year_desc=true&start=2019&view=chart (accessed on 15 June 2022).
- International Monetary Fund Publications. Available online: https://www.imf.org/en/Publications/WEO (accessed on 15 June 2022).
- International Air Transport Association (IATA). Industry Outlook Upgraded to $25.7 Billion Profit in 2024; Airlines: 2024. Available online: https://www.business-standard.com/industry/news/airline-industry-projected-to-record-25-7-billion-net-profit-in-2024-iata-123120600599_1.html (accessed on 6 December 2023).
- International Air Transport Association (IATA). Air Passenger Market Analysis. Available online: https://iata.org/en/iata-repository/publications/economic-reports/air-passenger-monthly-analysis---dec-2017/ (accessed on 15 December 2017).
- Abara, J. Applying Integer Linear Programming to the Fleet Assignment Problem. Inf. J. Appl. Anal. 1989, 19, 20–28. [Google Scholar] [CrossRef]
- Subramanian, R.; Scheff, R.; Quillinan, J.; Wiper, D. Coldstart: Fleet Assignment at Delta Air Lines. Interfaces 1994, 24, 104–120. [Google Scholar] [CrossRef]
- Rushmeier, R.; Kontogiorg, S. Advances in the Optimization of Airline Fleet Assignment. Transp. Sci. 1997, 31, 159–169. [Google Scholar] [CrossRef]
- Department of Transportation (DoT). Table 6 Domestic Airline Airfare Report—2011–2014 (Excel); US Department of Transportation: Washington, DC, USA, 2015. [Google Scholar]
- Bureaus of Transportation Statistics (BTS). 4Q 2023 Air Fare Tables; Bureau of Transportation Statistics: Washington, DC, USA, 2024. [Google Scholar]
Disclaimer/Publisher’s Note: The statements, opinions and data contained in all publications are solely those of the individual author(s) and contributor(s) and not of MDPI and/or the editor(s). MDPI and/or the editor(s) disclaim responsibility for any injury to people or property resulting from any ideas, methods, instructions or products referred to in the content. |
© 2025 by the authors. Licensee MDPI, Basel, Switzerland. This article is an open access article distributed under the terms and conditions of the Creative Commons Attribution (CC BY) license (https://creativecommons.org/licenses/by/4.0/).

