Article

Assessing Supply Chain Resilience to Mitigate Disruption: The Focus on Cross-Border Suppliers

by
Ruth Banomyong
1,
Narath Bhusiri
1,
Puthipong Julagasigorn
2,* and
Paitoon Varadejsatitwong
1
1
Center of Excellence in Connectivity, Thammasat Business School, Thammasat University, Bangkok 10200, Thailand
2
Hospitality and Tourism Management Department, International College for Sustainability Studies, Srinakharinwirot University, Bangkok 10110, Thailand
*
Author to whom correspondence should be addressed.
Logistics 2025, 9(1), 1; https://doi.org/10.3390/logistics9010001
Submission received: 31 October 2024 / Revised: 28 November 2024 / Accepted: 17 December 2024 / Published: 24 December 2024

Abstract

:
Background: Cross-border suppliers have always been points of disruption, further impacting international trade, businesses, and societies along the chain. Understanding the current resilience capabilities of cross-border suppliers is a stepping-stone to implementing resilience initiatives and policies to mitigate disruptions. However, no guidelines or practical tools exist to help cross-border suppliers conduct a deep-dive analysis of their resilience. Therefore, this paper proposes an assessment tool to guide cross-border suppliers in assessing their resilience capabilities. Methods: The supplier-focused resilience assessment approach was adapted from the Logistics Performance Index concept. The questionnaire and its resilience assessment dimensions were established through a literature review with the support of experienced cross-border professionals. Case study validation was further conducted to demonstrate the tool’s applicability. Results: The assessment evaluation through the Cross-Border Resilience Performance Index facilitates detailed analysis and benchmarking, enabling recommendations for necessary resilience initiatives and policies. Conclusions: This study contributes to the supply chain literature by adding a more practical resilience assessment approach focusing on cross-border suppliers. The Cross-Border Resilience Performance Index is the study’s primary contribution and is novel to the literature. The tool’s advantages include ease of use, replication potential, and its ability to glean comprehensive insights, ultimately improving supplier resilience and supply chain robustness. By implementing more precise initiatives, the tool increases the chances of cross-border suppliers being selected and maintained by buyers, helping them sustain their businesses and better respond to changing conditions to mitigate disruptions.

1. Introduction

A cross-border supply chain comprises a series of value-added activities conducted by stakeholders along the chain, including manufacturers, shippers, suppliers (i.e., including tier-1, tier-2, and so on), distributors, exporters, traders, and service providers of an exporting country as well as buyers (i.e., including importers, firms, enterprises, retailers, markets, and final consumers) of an importing country [1]. Figure 1 illustrates the general structure of the cross-border supply chain.
Cross-border suppliers (or tier-1 suppliers in Figure 1) generally deal with distributing commodities across the border. They have been defined as one of the most vulnerable stakeholders in the chain, which often causes disruptions [2]. Cross-border suppliers, especially in developing countries, lack the competencies, investment funds, and resources to adopt new technologies, strategies, policies, and innovative solutions to boost their resilience. These deficiencies make them susceptible to unprecedented events like disasters, international trade barriers, conflicts, strikes, and political tensions [3]. For instance, labor-intensive suppliers of essential automotive components (e.g., batteries and semiconductors) in China were forced to stop because of COVID-19 safety measures (i.e., lockdowns). Without flexible resources and backup capacities at these suppliers, a shortage of essential components occurred, affecting the global production and supply chain of Volkswagen [4]. The same labor shortages due to lockdowns were also observed in the case of milk suppliers in India, resulting in higher prices for products sold in import markets [5]. Any disturbance can lead to a temporary surge in demand. Sourcing only from suppliers who do not have sufficient spares (e.g., capacities, inventories, and resources) or alternatives (e.g., supply and transportation) can result in bullwhip effects and business losses [6]. This was confirmed by the international transport crisis in March 2011. Many hardwood pulp suppliers relied heavily on the Suez Canal for cost-efficient international transportation. The canal blockage incident disrupted its global supply chain, causing empty shelves of toilet paper in some countries [7]. Due to these challenges, scholars have called for a need to assist cross-border suppliers in anticipating and defending themselves against disruptions [2,8,9].
Many scholars have worked to assist supply chains in better anticipating, preparing, responding to, and recovering from changing operational conditions due to uncertainty within a short timeframe. This is known as supply chain resilience (SCRES) [10]. Achieving SCRES requires stakeholders and supply chains to possess resilience (adaptive/proactive) capabilities such as flexibility, collaboration, and so on [11]. One of the vital steps in building SCRES amidst an economic recession crisis and limited financial investments is to assess and quantify current resilience capabilities [12]. Hence, with a clearer understanding of the current state, more precise mitigation policies and resilience initiatives can be devised, invested in, and implemented to boost and maintain resilience capabilities, build SCRES, and minimize the risk of supply chain disruptions.
However, research focusing on upstream SCRES is limited [13,14], especially studies that examine the context after COVID-19 [15]. Assessing SCRES and resilience capabilities is necessary [12], but research examining how to assess the resilient status of a supply chain is scant [16]. Previous research has commonly performed this assessment using complex models such as simulation techniques, optimization models, and Bayesian and analytical network models. Although numerical assessments can be summarized, employing these methods requires skill, time, effort, and software to develop mathematical programming or analytical models to evaluate and aggregate resilient performances under the predefined assessment dimensions into single measures. These methods are not practical or adaptable.
Brookbanks and Parry [17] recently emphasized the need to understand the resilience of cross-border supply chains. However, as far as the authors are concerned, no guidelines or practical tools exist to help cross-border suppliers conduct a deep-dive analysis of their resilient performances. The overall assessment processes suggested in the literature are difficult to replicate (and extend) by cross-border personnel or other assessors who do not possess comprehensive competencies and skills. Another existing approach is based on qualitative assessment. Although it is deemed easier to conduct the assessments, this type of approach poses challenges for concluding remarks, comparisons, and benchmarking, which lead to ineffectiveness in measuring, investing in, improving, and managing SCRES [12]. Additionally, almost all resilience assessments and recommended resilience initiatives to build SCRES have been viewed from the perspective of enterprises (or buyers in Figure 1) [18]. Additionally, some recommended resilience initiatives used for general supply chains may not be suitable for cross-border suppliers and might even harm their businesses. These initiatives include supply chain localization (or nearshore sourcing strategy) to advise buyers to be more focused on domestic (or local) suppliers, multiple (and multinational) sourcing to diversify sourcing alternatives from different countries, and broader network reconfiguration to expand the supply network across different geographical locations [19,20]. Therefore, a more user-friendly (i.e., practical) approach to directly assess and quantify cross-border supplier resilience capabilities is needed so that precise and effective resilience initiatives can be devised and implemented to enhance and sustain the cross-border supplier resilience capabilities.
This paper aims to develop a more practical tool to directly assess cross-border supplier resilience capabilities. The development of the proposed tool adapts the well-known concept of the Logistics Performance Index (LPI), which enables logisticians to measure qualitative logistics performances quantitatively. The research team worked with cross-border experts to adapt and validate the proposed tool. After identifying strategic resilience capabilities that cross-border suppliers must build from the literature review and consulting with experts, the adapted resilience assessment dimensions were defined. Then, a questionnaire corresponding with the identified resilience capabilities was developed, validated, and further employed to evaluate a case study of Thai cross-border supplier resilience. Selected cross-border supplier workforces were the targeted respondents of the questionnaire. The assessment evaluations of these resilience capabilities through a questionnaire were aggregated from different dimensions into the Cross-Border Resilience Performance Index for further analysis and benchmarking, allowing for the recommendation of necessary resilience initiatives and policies to be implemented. According to Figure 1, measuring cross-border supplier resilience capabilities requires focusing on both the outbound supply chain of the cross-border supplier (i.e., when cross-border supplier tier-1 engages with buyers) and the inbound supply chain of the cross-border supplier (i.e., when cross-border supplier tier-1 engages or procures with other suppliers or manufacturers). The proposed assessment tool can assess and capture both perspectives.
The key advantages of the proposed framework include its user-friendliness, which offers an easy way to quantitatively assess qualitative resilience performance. It can be easily adapted for other supply chains with minor modifications. Key assessment dimensions can be added or removed without affecting the overall analysis, enhancing its practicality. Additionally, the questionnaire gathers information from all workforce levels, from operators to top management, providing a comprehensive view of the organization’s resilience. This holistic approach ensures that the assessment captures a wide range of perspectives within the supplier’s operations. Furthermore, the proposed tool is critical in building resilience capabilities by identifying and eliminating supplier vulnerabilities, thus improving overall SCRES. By implementing more precise initiatives and policies, the tool increases the chances of cross-border suppliers being competitively selected and maintained by buyers, helping them sustain their businesses and better respond to changing conditions.
The organization of the paper is as follows. The next chapter is the literature review, followed by the development of the proposed assessment tool. A validating case study of Thai construction material cross-border suppliers along the Thai–Laos border is conducted to analyze its Cross-Border Resilience Performance Indexes. This is to demonstrate the tool’s applicability and viability. The final chapter summarizes the paper.

2. Literature Review

The first subsection defines SCRES and reviews elements and components related to SCRES. These elements form the foundation for constructing the questionnaire assessment dimensions. The second subsection reviews existing measurements for assessing SCRES and resilience capabilities, highlighting research gaps and emphasizing the need for a more practical assessment tool focused on suppliers.

2.1. SCRES

The SCRES concept is an evolving concept, built on top of traditional supply chain risk management (SCRM) [21]. In SCRM, enterprises are encouraged to mitigate losses and poor performances by analyzing risks and vulnerabilities (i.e., possibilities of affecting supply chains and their performance measures) arising from previous, existing, foreseen, and predefined incidents [22]. This can be achieved through continuous risk management cycle processes. Common risks include supply risk, demand risk, operation process risk, control risk, and so on [23]. Risks can be quantified by considering the likelihood and magnitude of consequences using existing and historical data sets, along with useful assumptions. Mitigation actions can then be proposed to cope with the identified risk scenarios [24].
With increasing unprecedented disruptions, SCRM alone to mitigate identified risks has been proven inadequate [12]. SCRES has come into play to introduce supply chain adaptive capabilities that enable stakeholders to anticipate and prepare their supply chains to cope with any unprecedented incident [25]. Tukamuhabwa et al. [26] comprehensively defined SCRES as follows: “The adaptive capability of a supply chain to prepare for and/or respond to disruptions, to make a timely and cost-effective recovery, and therefore progress to a post-disruption state of operationsideally, a better state than prior to the disruption”.
Adaptive capabilities designed into the supply chain to achieve SCRES have been described in the literature using different terms and terminologies. These include the works of several researchers such as Zhang et al. [2], Chowdhury and Quaddus [11], Agarwal et al. [12], Jain et al. [18], Christopher and Peck [27], and Shekarian and Parast [28], to name but a few. However, according to Tukamuhabwa et al. [26] and Shekarian and Parast [28], to minimize overlap or duplication, adaptive capabilities can be systematically grouped into four strategic categories, including flexibility, redundancy, agility, and collaboration. Other terminologies can be considered subsets of these four capabilities. They can be viewed as enablers (or enabling strategies)—drivers that enable the achievement of the respective capability in different dimensions. Another set of terminologies proposed by scholars can also be seen as a set of implementable initiatives and mitigation policies to boost supply chain resilience capabilities. Table 1 summarizes these supply chain resilience capabilities, key enablers, and resilience initiatives.
Supply chain flexibility is the ability of stakeholders to adapt the supply chain to cope with changing requirements such as demand changes, supply changes, and environmental changes [28]. Flexibility can be achieved by having alternative options (e.g., suppliers, storage locations, and distribution channels), having spare resources (e.g., assets, vehicles, and workforce), and increasing multi-skill/multi-purpose resources and assets [11]. Various key enablers to achieve flexibility include flexible suppliers [27], flexible order fulfillment [21], and flexible transportation and distribution channels [26]. Flexibility results in supply chain readiness and increases supply chain responsiveness during disruptions by quickly adjusting and adapting supply chain configurations [29,34,35].
Supply chain redundancy is the ability to withstand disruptions by using backup (or alternative) resources, suppliers, capacities, and inventories [28]. The concept of supply chain redundancy is similar to supply chain flexibility to some degree [26]. Although possessing alternatives can be costly, supply chain redundancy can result in better responsiveness and recovery from disruptions [36]. Its key enablers include having backup resources, backup suppliers, and diversifying supply networks [27]. It is worth noting that having backups or alternatives in diverse geographical locations can increase redundancy, which leads to stronger SCRES [26].
Supply chain collaboration is the ability to work effectively with other stakeholders towards mutual objectives [28]. In a collaborative approach, stakeholders are required to communicate and share information openly and actively. This improves supply chain visibility and enhances responsiveness [33]. Active communication also helps stakeholders become aware of upcoming disruptions and make timely (or proactive) decisions (i.e., agility) [21]. Other forms of collaboration include resource sharing, process sharing, joint planning decisions, joint solution development, and joint measurement [32,33]. Also, understanding and implementing strategic collaboration with the right partners could further lead to supply chain decision orchestration, alignment, and readiness [18].
Supply chain agility is the ability to respond rapidly to changing requirements [28]. It can be achieved through visibility and velocity [27]. When the supply chain is visible (i.e., information has been known in advance or in real-time), signals of changes and potential disruptions can be detected, allowing stakeholders to respond effectively [26]. Supply chain velocity focuses on mitigating risks and vulnerabilities in the supply chain to increase the speed and responsiveness of delivery during disruptions [27]. Having a business continuity plan (BCP) in place could also assist the supply chain in preventing, responding to, and recovering from potential disruptions [35].

2.2. Existing SCRES Assessments

Previous studies to determine whether the focused supply chains and their stakeholders are resilient have used different approaches. One approach that has widely been applied since the beginning is case study qualitative analysis with semi-structured interviews and discussions. This approach relies heavily on the personal skills, experiences, and competencies of interviewers to analyze the cases, conduct qualitative analysis, and draw conclusions. Recent studies include the work of Fridolfsson and Lapidoth [37], where resilience assessment of a world-leading construction equipment firm was conducted through semi-structured interviews coupled with a secondary data analysis. Pettit et al. [21] also employed a qualitative methodology based on the framework of Pettit et al. [38], using focus groups and case study analysis to assess and improve the resilience of manufacturing and service firms. More qualitative resilience assessments are reviewed in Zhao et al. [39].
Despite their successes in assessing SCRES, qualitative assessments have been criticized by scholars for lacking generalizability and accuracy for comparisons, as they might contain sensitivity and bias [40]. Comparing and benchmarking the resilience of different focused supply chains (and stakeholders) using qualitative assessment is also challenging. Making the comparison of SCRES possible may come at the expense of increased complexity. Resilience assessment must be analyzed, interpreted, and computationally consolidated into a numerical index [12]. Many studies have proposed various complex methods to achieve this purpose, including mathematical models [41,42], simulation techniques [43], graph theoretical approaches [12], and Bayesian and analytical network models [44]. More related studies can be found in the reviews of Aguila and El Maraghy [45].
However, these complex methods are not easily replicated by practitioners, as they require time, energy, effort, and knowledge. Cross-border suppliers do not possess these competencies [3]. Researchers have emphasized the immediate need for easily employable quantitative resilience tools [12,46]. In addition, almost all resilience assessments have been conducted through the lens of buyers [18]. Existing studies have been limited to buyers and dyadic focuses with their immediate suppliers [20]. No study and analysis of cross-border supplier resilience and relationships from both perspectives has been observed. Assessing the current resilience status quo is necessary [12]; however, research examining how to assess the resilience status of supply chains is scant [16], especially regarding the resilience of cross-border supply chains [17]. Therefore, the paper aims to develop a practical tool to assess the current resilience state of cross-border suppliers.

3. Development of the Proposed Tool

The development of the proposed tool adapted the concept of the LPI [47]. Therefore, the first step in the development was to examine how the LPI concept could measure qualitative performance. Then, the proposed tool and its questionnaire assessment were developed. Afterward, the tool was presented to and validated by a group of Thai experts to preliminarily ensure its applicability before conducting the case study, which is described in the next chapter.

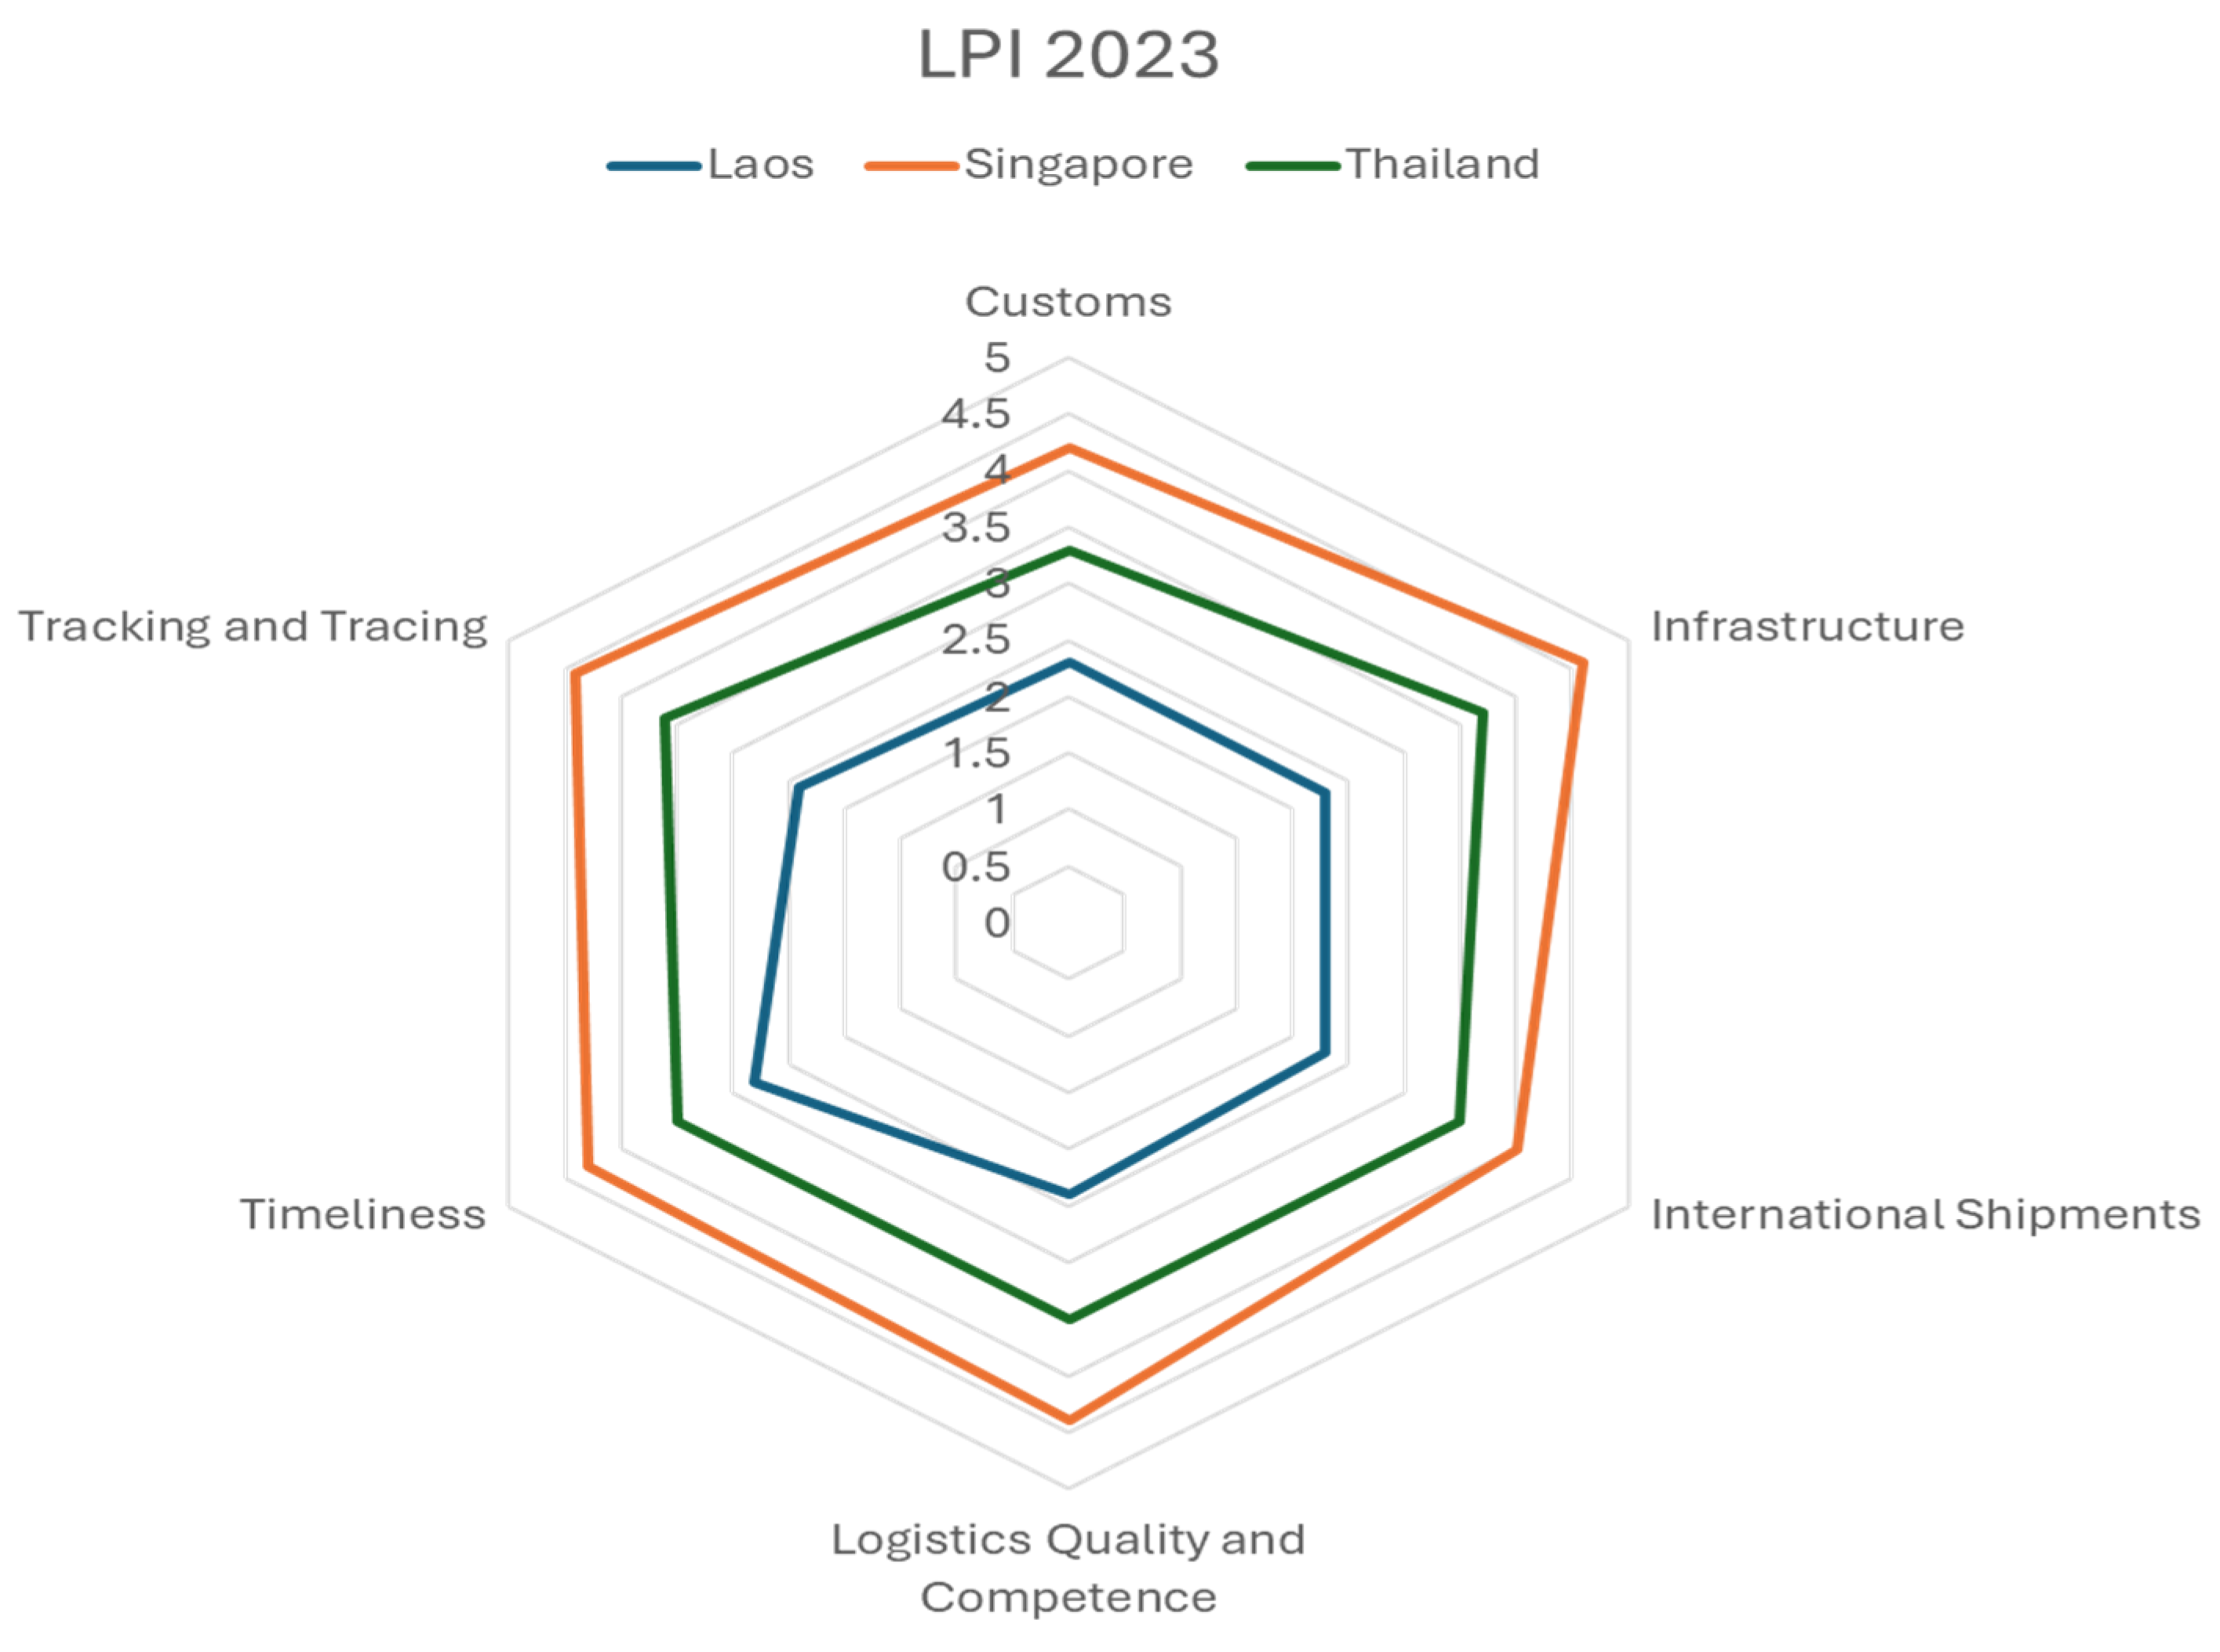
3.1. The LPI as a Reference Tool

The LPI is an interactive benchmarking tool created by the World Bank. The advantage of the LPI is that it provides numerical feedback on the qualitative logistics performances of nearly 160 countries, which is a challenging task in practice. These significant national logistics performances, including customs performance, infrastructure quality, international shipment competitiveness, logistics quality and competence, ease of tracking and tracing, and operational timeliness, cannot be easily assessed and evaluated using basic logistics information such as cost and time [47]. The World Bank conducts the LPI every two years through a questionnaire. The questionnaire is designed to gather and aggregate the evaluations of those from global freight forwarding companies or international logistics operators. Each respondent can evaluate up to eight important import/export markets (or countries) based on the six indicators of national logistics performance. Evaluation scores range from very low (1) to very high (5) or much worsened (1) to much improved (5). In each country, the evaluations are aggregated into each indicator through an average of the scores given by all respondents, coupled with Principal Component Analysis (PCA) to reduce the dimension of the data set [47]. Once the performance index of each logistics indicator in each country is known, the normalized scores of each of the six indicators are multiplied by their component weights and aggregated into the national LPI [48]. Another advantage of the LPI is that its results are presented straightforwardly (as displayed in Figure 2), helping countries understand how well their logistics are performing. It also assists countries in conducting in-depth analysis to identify logistics bottlenecks and areas for improvement [49].

3.2. Development of the Proposed Tool: Questionnaire Assessment

Building SCRES relies heavily on four strategic resilience capabilities that stakeholders must build and maintain, including supply chain flexibility, supply chain redundancy, supply chain collaboration, and supply chain agility. Therefore, using these four resilience capabilities as key indicators (or dimensions) of resilience performance ensures that the assessment captures the actual (or potential) abilities within the supplier’s operations.
However, as summarized in Table 1, each resilience capability is associated with a set of enablers (or enabling strategies) and resilience initiatives that enhance the respective capabilities. These enablers and initiatives can lead to similar or distinct resilience capabilities. This variation arises because resilience capabilities have been proposed and defined differently for specific purposes and contexts. For example, flexibility, agility, and adaptability are interrelated and are often summarized as responding capabilities, used as response measures, while redundancy is considered an absorbing capability, employed to absorb disruptions [15].
In this study, supply chain flexibility and supply chain redundancy were integrated into a single dimension. This integration is based on the rationale that both resilience capabilities are interrelated. In the context of the cross-border supply chain, both resilience capabilities share similar enabling strategies and resilience initiatives. For example, increasing cross-border supply chain flexibility can be achieved by having multiple backup or alternative resources, such as backup sources of supply, backup inventories, backup distribution channels, and backup workforces. These alternative resources are essentially the definition of supply chain redundancy [26]. Achieving supply chain redundancy can, to some extent, enhance supply chain flexibility. The concept of supply chain redundancy can also be viewed as a subset of supply chain flexibility. Therefore, integrating these capabilities helps reduce the complexity of having too many assessment dimensions.
Additionally, supply chain collaboration and supply chain agility were interrelated in our context and can be combined into one dimension. For example, the enabling strategy of supply chain visibility plays a critical role in achieving supply chain agility by providing better visualization and a clearer view of the end-to-end supply chain, which helps detect negative signals and accelerate decision-making [26]. Achieving end-to-end visibility requires initiatives of collaboration and information sharing among stakeholders. Increasing supply chain visibility can enhance both supply chain collaboration and supply chain agility. Therefore, we have also integrated these two capabilities to simplify the assessment.
After the key indicators were identified, a set of sub-indicators, equivalent to a set of resilience enablers described in Section 2, were selected. Table 2 and Table 3 display key indicators and sub-indicators to assess the integrated supply chain flexibility and redundancy capabilities and the integrated supply chain collaboration and agility capabilities, respectively. As mentioned, measuring cross-border resilience capabilities needs to focus on two perspectives of outbound and inbound supply chains of cross-border supplier tier-1.
In Table 2, there are three sub-indicators. The first sub-indicator is flexible supply, which refers to the ability of the supplier tier-1 to source and procure commodities. This capacity ensures that the supplier tier-1 always has alternative commodities or sourcing options available to meet changing requirements, particularly when there is no production at the supplier tier-1. On the other hand, when engaging with the buyer, flexible supply is defined as the supplier’s ability (either existing or potential) to provide flexible supply to the buyer. To provide flexible supply, the supplier tier-1 should possess as follows: (1) an ability to apply (or to assist the buyer in having) an appropriate purchasing portfolio and supplier categorization (note that purchasing portfolio and supplier categorization is the foundation of building appropriate sourcing strategies and upstream SCRES [30], (2) an ability to have (or to provide) an expansion and diversification of locations/sources of supply [26], (3) an ability to have (or to provide) a strengthened partnership with its strategic supplier (or the buyer) and request (or prepare) to have safety stock of important commodities (with additional expenses occurred) to ensure smooth supply [20], and (4) an ability to have (or to provide) a strengthened partnership with its strategic supplier (or the buyer) and request (or provide) for increased supplies at short notice (possessing spare/slack capacity) [47,50].
The next sub-indicator is flexible inbound (or outbound) transport and distribution channels [26]. This capacity ensures that the supplier tier-1 always has (or provides) alternative transport options and distribution channels for constant inbound (or outbound) deliveries. Under this sub-indicator, the supplier tier-1 should possess as follows: (1) an ability of the supplier tier-1 to have (or to provide) a diversification of inbound distribution channels (and/or transport modes), (2) an ability to redeploy and expand own transport resources (i.e., manpower and vehicles) for inbound (or outbound) deliveries, and (3) an ability to have (or to provide) an expansion/diversification of transport outsourcing options.
Another sub-indicator is flexible workforce arrangement [26]. This ensures that supplier tier-1 always has (or provides) flexible and adaptive workforce options including (1) an ability to have (or to provide) a strengthened partnership and request other suppliers (or to be requested by the buyer) to build capacities of workforces to be more productive and multi-skilled and (2) an ability to have (or to provide) a strengthened partnership and request other suppliers (or to be requested by the buyer) to redeploy and expand workforce.
In Table 3, there are also three sub-indicators. The first sub-indicator is supply chain visibility. This is the ability of the supplier tier-1 to have (or to assist in having) efficient tracking performances of its supplier (or for the buyer) [28]. To achieve supply chain visibility, the supplier tier-1 should possess (1) an ability to have (or to provide) information and performances exchanged, shared, received, tracked, and monitored by its suppliers (or for the buyer) and (2) an ability to analyze and evaluate the performance of the supply (or the forecasted demands). The next sub-indicator is relationship orientation. This sub-indicator is related to the ability to have (or assist the buyer in having) precise partnership establishment [30]. After the purchasing portfolio and supplier are categorized, the supplier tier-1 should possess (1) an ability to prioritize its suppliers (or to assist the buyer in prioritizing the supply base) and (2) an ability to have an appropriate establishment of different levels of relationships with other suppliers (or to assist the buyer in establishing appropriate relationships). Last but not least, supply chain communication is the sub-indicator to have (or to provide) proactive, regular, and responsive communication with other suppliers (or the buyer). Also, it includes the ability to have (or to provide) an alignment of communication channels.
After defining the key indicators, sub-indicators, and assessment components, a questionnaire was developed. Each assessment component may have multiple corresponding questions to ensure a thorough evaluation. The questionnaire was designed to progressively capture the resilience capabilities of supplier tier-1 through these questions. An example of how the questionnaire was structured to capture specific resilience aspects is shown in Table 4. It illustrates the questions related to the first assessment component under the flexible supply aspect from the inbound supply chain perspective of the integrated supply chain flexibility and redundancy resilience capabilities. This component is defined as the ability to have (or apply) an appropriate purchasing portfolio and supplier categorization.
An initial yet critical step of supply management that can assist in building SCRES is to categorize and prioritize suppliers and purchased items [30]. Supplier and purchasing portfolio categorization are commonly part of the strategic planning process, which supports effective decision-making to achieve targeted objectives [51]. Categorizing suppliers and purchasing portfolios helps buyers visualize the importance, criticality, strengths, vulnerabilities, and challenges of suppliers (and corresponding markets) during sourcing and procurement. As a result, appropriate sourcing strategies and proactive mitigation action plans can be developed and implemented (in collaboration between critical suppliers and buyers) to better respond to and recover from changing operational conditions [52,53]. The more comprehensive the categorization, the more precise the strategies can be, leading to improved supply chain performance, including resilience [54].
From the perspective of the inbound supply chain, tier-1 suppliers (in the role of buyers) often neglect the implementation of supplier and purchasing portfolio categorization. In some cases, tier-1 suppliers tend to categorize suppliers and purchasing items solely based on financial performance metrics, such as annual consumption values or purchasing volumes. While this type of categorization is better than none, it remains insufficient to ensure the long-term availability of critical commodities. To enhance resilience, tier-1 suppliers must consider the risks and complexities of sourcing when categorizing suppliers and purchasing portfolios [30,31]. The set of corresponding questions in Table 4 can help determine whether the tier-1 supplier has an effective supplier and purchasing portfolio categorization, which can be indirectly converted into a level of resilient performance.
In this questionnaire design, respondents, who were internal personnel of tier-1 suppliers, rated the questions on a scale from very low to very high or from much worsened to much improved, depending on the context. To facilitate calculation and statistical presentation, these ratings were scored from 0 to 2, where 0 represents the lowest performance and 2 represents the highest. The scores were averaged for each assessment component, then aggregated into the sub-indicator resilient performance, and finally consolidated into a resilience index that reflects the resilience capabilities of the tier-1 supplier. It is important to note that in our assessment, all dimensions (i.e., key indicators and sub-indicators) were assigned equal component weights. This structured approach allowed for a quantitative assessment of qualitative aspects of SCRES, providing clear and actionable insights into areas where the tier-1 supplier excelled or required improvement. By evaluating components such as purchasing portfolio and supplier categorization, the tool helps identify both strengths and vulnerabilities in the supply chain, enabling targeted improvements to enhance overall resilience.

3.3. Validation of the Proposed Tool

After developing the proposed tool and its questionnaire, it was presented to and validated by cross-border experts in Thailand, specifically members of the Federation of Thai Industries (FTI). The FTI members are experienced industrial leaders and practitioners from various sectors in Thailand, such as chemicals, automotive, food and beverage, and cement industries, among others. They play a key role in supporting business recovery and enhancing competitiveness by creating policies, programs, and initiatives. Recently, one of their primary focuses has been to strengthen the competitive advantages of Thai cross-border businesses, ensuring they remain attractive choices in the context of the realignment of global supply chains.
A validation session was held on 9 August 2023 in a hybrid focus group with the experts. They were first briefed on the objectives of the study, the concepts behind the resilience assessment, and the detailed development of the tool, including its dimensions and questionnaire. At the end of the presentation, the experts were invited to provide technical feedback on the tool’s applicability. The feedback was then summarized into three key categories: usefulness, practicality, and completeness.
All the experts confirmed that the tool was useful for assessing the resilience of cross-border suppliers. The proposed tool and its underlying concept effectively address the needs on the ground, particularly in the context of the Thai–Laos cross-border trade, where Thai suppliers have a significant influence on the Laos market. Due to the impacts of the COVID-19 pandemic, ongoing global economic concerns, and emerging uncertainties, many buyers, including those in Laos, have opted to diversify their supply chain risks and expand their supply sources. Thai suppliers have requested a need for a practical evaluation tool and guidance on enhancing their resilience in both inbound and outbound supply chains to sustain their businesses under the realignment of global supply chains.
Although the practicality of the tool was well accepted during the workshop, the experts expressed concerns about the completeness of the assessment using the proposed tool. They noted that responses might be limited due to potential misinterpretation of the questions by the cross-border personnel, which could result in inaccurate or incomplete feedback. Moreover, the concept of SCRES is relatively new to Thai cross-border businesses. To ensure more comprehensive insights, the experts recommended that the developed questionnaire be complemented by semi-structured interviews with the tier-1 suppliers. Based on these comments, the next section aims to validate the proposed tool with a case study to enhance the research’s applicability.

4. Case Study Validation

4.1. The Case Study Context: Thai Construction Material Cross-Border Suppliers Along Thai–Laos Border

Lao People’s Democratic Republic (or Laos) is a landlocked country and has a very low domestic production capacity [55]. Therefore, international trade and importation from neighboring countries are crucial to driving Laos’ economic growth [56]. In the past, a cross-border supply chain from Thailand has been a vital element in enabling the accessibility of essential commodities of good quality, such as refined petroleum and flavored water, to Laos buyers and individual consumers [57]. Currently, Laos is undertaking several construction projects to improve infrastructure, including transport projects, road networks, public water systems, electrical and energy systems, and so on [58]. A disruption of the Thai–Laos cross-border supply chain could result in delays/shortages of construction materials, further creating severe impacts on both sides of the border.
Five Thai suppliers located in the northeastern region of Thailand were chosen for the validation. These suppliers have high market shares of construction materials in markets along the Thai–Laos border. Other suppliers with high market shares were not available to participate in the questionnaire assessment. Table 5 summarizes the characteristics of these suppliers. Suppliers A, B, and C can be grouped into the “Big” Supplier type as they share some common characteristics. These suppliers under the “Big” Supplier have adequate resources, especially transport resources, allowing them to provide cross-border transport services with their own resources. Note that cross-border transport from Thailand to Laos always faces challenging and fluctuating cross-border policies. All suppliers of this type have large (or multiple) storage locations near the border. Extra inventories can be kept at storage locations for buyers.
Suppliers D and E can also be grouped under the “Small” Supplier type. These suppliers have limited capacity and resources. Cross-border transportation services are often conducted by buyers or outsourcing services. Storage capacities are also limited, where only minimum inventories can be stored. In the case of stock-outs at these suppliers, the buyers might need to wait up to 15 days for stock replenishment.

4.2. Results and Discussions

The survey questionnaire, coupled with semi-structured interviews, was conducted in January 2024. The semi-structured interview took the questionnaire to initiate conservations and rationale discussions behind the given scores. The analysis of the assessment results obtained can be summarized as follows. Figure 3 and Figure 4 benchmark the Cross-Border Resilience Performance Indexes of Big and Small Supplier types, respectively. Big Supplier had an overall Cross-Border Resilience Performance Index of 1.6. Particularly focusing on the integrated supply chain flexibility and redundancy resilience indexes, Big Supplier had a value of 1.4 (from the inbound supply chain perspective) and 1.5 (from the outbound supply chain perspective). In terms of the integrated supply chain collaboration and agility resilience indexes, Big Supplier had values of 1.7 (for both inbound and outbound supply chain perspectives).
Small Supplier had an overall Cross-Border Resilience Performance Index of 1.2. The integrated supply chain flexibility and redundancy resilience indexes of Small Supplier were 1 (from the inbound supply chain perspective) and 0.9 (from the outbound supply chain perspective). In terms of the integrated supply chain collaboration and agility resilience indexes, Small Supplier had a value of 1.4 (from the inbound supply chain perspective) and 1.5 (from the outbound supply chain perspective).
In Figure 5 and Table 6, the Cross-Border Resilience Performance Indexes of Big Supplier by sub-indicator and by assessment component of each sub-indicator are visualized. From the perspective of the inbound supply chain, the Cross-Border Resilience Performance Index of the integrated collaboration and agility resilience capabilities were all high, including values of 1.7 (for the visibility sub-indicator), 1.7 (for the relationship orientation sub-indicator), and 1.8 (for the communication sub-indicator) as displayed in Figure 5. This implies that Big Supplier actively and openly communicates and exchanges information with their suppliers (i.e., supplier tier-2 or manufacturers). Based on information captured by the semi-structured interview, dynamic transport lead times, production lead times, and order lead times from supplier tier-2 are visible and updated to Big Supplier. Big Supplier uses the obtained information to implement purchasing portfolio and supplier categorization to some extent. Thus, Big Supplier can prioritize and define their important suppliers and devise appropriate sourcing strategies as by-products. Items with sourcing challenges are additionally stored and spared at Big Supplier storage locations. This is an initiative to increase redundancy and supply flexibility [26].
Some suppliers under Big Supplier have more than one storage location, but they are mostly located in the same proximity. Considering the investment in redundant storage locations in different proximities, especially on another side of the border, could enhance the supply chain redundancy, supply chain flexibility, and ultimately SCRES of both inbound and outbound supply chain perspectives [26]. Another recommendation to increase SCRES is that Big Supplier should utilize the strategic partnership establishment with supplier tier-2 due to purchasing portfolio and supplier categorization. Once successfully established, Big Supplier can request the strategic supplier tier-2 to increase safety stocks, extra inventories, or slack capacities. This is also to increase supply flexibility, where the current score indexes of assessment components #3 and #4 under the flexible supply sub-indicator were low (i.e., values of 1.1).
From the perspective of the outbound supply chain, Big Supplier also actively communicates with the buyers, where the resilience index for communication sub-indicator was also 1.8. Although necessary information is regularly shared and exchanged with the buyers, strategic partnerships between Big Supplier and the buyers are not commonly implemented. The resilience index of the relationship orientation sub-indicator is then lower than one of the inbound supply chain perspectives, as displayed in Figure 5. This creates a reluctance of Big Supplier to fully invest in supply flexibility for buyers. Nonetheless, Big Supplier puts some effort into increasing supply resilience by regularly communicating and monitoring the projected demands of strategic/bottleneck items from the buyers. Some spare inventories can, therefore, be planned, stored, and responsively delivered to the buyers. This initiative is a part of the actual business strategies of Big Supplier to increase (or maintain) sales volumes. It can be confirmed by the high resilience index of 1.8 of assessment component #2 under the flexible supply sub-indicator.
Cross-border transport services to mobilize commodities to Laos buyers are usually conducted using the resources of Big Supplier. Big Supplier has adequate capacities, knowledge, and information to adapt to the fluctuating cross-border policies and other changing operational conditions in Laos. The resilience index of using its own transport resources was as high as 1.4. The low resilience index of 0.9 (i.e., assessment component #3 under flexible transport and distribution channel sub-indicator) is the resiliency of using cross-border transport outsourcing, which is currently limited for Big Supplier. To consider increasing flexible transport outsourcing, Big Supplier needs to expand (or diversify) transport outsourcing options [26] or apply supplier contract flexibility [12]. With adequate resources, i.e., manpower, Big Supplier should also consider implementing production/assembly postponement [29]. This is to increase supply flexibility for the buyers, yet it may come at the expense of resource capability building.
In Figure 6 and Table 7, the Cross-Border Resilience Performance Indexes of Small Supplier by sub-indicator and by assessment component of each sub-indicator are visualized. From the perspective of the inbound supply chain, the Cross-Border Resilience Performance Index of the supply chain communication sub-indicator was 1.8. Small Supplier regularly communicates and exchanges information with supplier tier-2 or manufacturers. Both types of Suppliers, Big and Small, maintain a high level of supply chain communication and upstream (or inbound) supply chain visibility. However, Small Supplier should utilize the obtained information for further analysis and implement purchasing portfolio and supplier categorization with supplier tier-2. Currently, the relevant indexes in Figure 6 and Table 7 (i.e., under the relationship orientation sub-indicator) are very low. Analysis of the obtained information could assist Small Supplier in detecting suspicious signals or patterns of upstream (or inbound) supply chain. Decisions can responsively be made. This is to increase supply chain agility. Also, implementing the purchasing portfolio and supplier categorization with supplier tier-2 can result in supply flexibility. For instance, it could determine what items (i.e., items with high sourcing vulnerabilities from supplier tier-2) should additionally be stored or spared in Small Supplier storage locations. Currently, resilient indexes related to supply flexibility are also low.
Limited transport resources, knowledge, and skills result in the need for transport outsourcing options. Diversifying transport options (i.e., dual/multiple sourcing) could increase flexibility in transportation. Having transport outsources who can adapt to changing operational conditions, albeit expensive, can increase SCRES. Also, with a limited workforce and limited investment funds to increase headcounts, building capacities of workforces to be more productive and multi-skilled are the only options to increase SCRES [26]. Similar resilience-related issues take place from the perspective of the outbound supply chain. Similar resilience initiatives and recommended mitigation actions should, therefore, be considered to boost resilience capabilities and increase SCRES.
Figure 7 illustrates a comparison of the Resilient Performance Indexes between Big Supplier and Small Supplier. This analysis highlights the key strengths and limitations of each supplier type across six dimensions, offering real-world examples to illustrate the findings.
According to Figure 7, the flexible supply dimension reveals that large suppliers exhibited a higher level of flexibility compared to small suppliers. In our case, the large suppliers could stock cement and steel from various factories across Thailand or neighboring countries to meet increased demand in Lao PDR. As a result, these large suppliers had greater capacity to stockpile materials, enabling them to mitigate supply chain disruptions effectively. In contrast, small suppliers depended on a single production facility and sometimes faced delays if the facility encountered operational disruptions. Due to their reliance on a single or limited number of sources, small suppliers were more vulnerable to supply chain interruptions.
The large suppliers also demonstrated greater flexibility in transportation and distribution channels. They utilized multiple modes of transport, such as road transport via the Thai–Lao Friendship Bridge or river transport along the Mekong River. This allowed them to adapt quickly to logistical challenges and optimize costs. For instance, a large supplier could switch to river transport if road routes were temporarily closed due to border congestion. On the other hand, small suppliers relied heavily on a single mode of transport, usually road-based, which limited their ability to respond effectively to disruptions. Consequently, small suppliers often suffered significant delays due to their lack of alternative logistical options.
Another key advantage of large suppliers was their workforce flexibility. They could recruit temporary labor in border areas or deploy skilled personnel to manage operations in Lao PDR. For example, a large supplier could assign a team to oversee the distribution process in Vientiane, ensuring timely delivery, while small suppliers struggled to deploy additional personnel, resulting in slower response times and potential customer dissatisfaction. In contrast, small suppliers operated with limited manpower and lacked the resources to scale up their workforce during peak demand periods.
Supply chain visibility was another area where large suppliers outperformed small suppliers. By investing in advanced technologies such as Global Positioning System (GPS) tracking and Enterprise Resource Planning (ERP) systems, large suppliers could provide real-time updates on shipment status and inventory levels, enabling proactive decision-making. Some large suppliers were able to update their customers in Lao PDR with precise delivery timelines through automated systems. In contrast, small suppliers relied on manual tracking methods or basic communication tools, which led to delays and inefficiencies. For example, some small suppliers needed to wait for confirmation from transport operators, risking delays and miscommunication.
Large suppliers further distinguished themselves in relationship orientation. They maintained strong, long-term partnerships with key stakeholders in Lao PDR, including local distributors and retailers. These relationships were often formalized through contracts and joint ventures, ensuring stability and enhanced market access. For instance, a large supplier might collaborate with multiple wholesale distributors in Vientiane to secure extensive market coverage. In contrast, small suppliers typically relied on ad hoc or short-term relationships, making them more susceptible to being replaced by competitors. These small suppliers might be dependent on a single intermediary, which increases their operational risks.
Finally, large suppliers benefited from streamlined communication processes enabled by digital platforms that facilitated efficient cross-border coordination. These platforms enabled real-time sharing of data on inventory, orders, and transportation, minimizing delays and errors. For example, a large supplier could promptly notify a retailer in Lao PDR of shipment delays through a centralized system, thereby maintaining customer trust. In contrast, small suppliers often relied on traditional communication methods, such as phone calls or emails, which were prone to delays and inaccuracies. Some struggled to deliver timely updates, potentially damaging their relationships with clients.
In conclusion, large suppliers outperformed small suppliers across all dimensions of the Resilient Performance Index. Their ability to leverage diversified sourcing strategies, flexible logistics, advanced technologies, and robust partnerships enabled them to mitigate risks and maintain operational resilience. Meanwhile, small suppliers faced significant challenges due to their limited resources, reliance on traditional methods, and lack of flexibility. These findings underscore the importance of capacity-building initiatives for small suppliers, including investments in digital tools, workforce training, and collaborative networks, to enhance their resilience and competitiveness in cross-border trade with Lao PDR.

4.3. Reflections on the Proposed Tool

Table 8 presents an evaluation of the proposed tool, the Cross-Border Resilience Performance Index, against existing tools developed using notable techniques, including mathematical models, simulation methods, graph theoretical approaches, and Bayesian and analytical network models. First, we outline the distinct strengths and limitations of these seminal methodologies regarding their theoretical foundations, computational requirements, and practical applicability. Then, the strengths and limitations of the Cross-Border Resilience Performance Index developed in this study are discussed.
Mathematical models, such as the stochastic optimization frameworks proposed by Fattahi et al. [41] and Spiegler et al. [42], are powerful tools for designing supply chain networks that can adapt to disruptions. By integrating probabilistic elements, these models enable decision-makers to optimize performance under uncertainty, providing quantitative results that clearly highlight trade-offs between cost and resilience. Additionally, their flexibility in accommodating various constraints—such as transportation costs and inventory levels—makes them highly adaptable. However, the complexity of these models presents challenges. They require significant computational power, especially for large-scale supply chains, and rely on high-quality, detailed data, which may not always be readily available. This dependence on both data and computational resources can limit their practicality in certain settings, particularly for organizations with limited resources or expertise in optimization techniques.
Simulation techniques, as demonstrated by Dixit et al. [43], provide another valuable approach to resilience assessment by modeling supply chain performance in both pre- and post-disruption scenarios. These methods excel at offering dynamic and visual representations of how supply chains react to disruptions, allowing practitioners to identify critical weaknesses and recovery mechanisms. The incorporation of Conditional Value at Risk (CVaR) as a risk measure further enhances their ability to assess extreme risks, which are crucial in high-impact scenarios. However, like mathematical models, simulations are computationally intensive and time-consuming, requiring expertise in simulation tools and methods. Additionally, the results of simulations are often scenario-specific, making it difficult to generalize findings across different supply chain contexts.
The graph-theoretical approach proposed by Agarwal et al. [12] shifts the focus to the structural aspects of supply chain networks. This method simplifies supply chains into network structures, enabling researchers to evaluate resilience using well-established graph theory principles. Its simplicity and ability to provide clear visualizations of network structures make it a widely applicable tool across industries. However, its static nature limits its ability to capture the dynamic processes of disruptions and recovery. By reducing complex supply chain interactions to static graphs, the approach risks oversimplifying key operational details, potentially leading to an incomplete understanding of resilience.
Bayesian and analytical network models, such as those proposed by Aguila and ElMaraghy [45] and Badhotiya et al. [44], bring probabilistic reasoning and network analysis to the forefront. These methods excel in capturing uncertainties and providing deep insights into the cause-and-effect relationships within supply chain disruptions. Their flexibility allows them to be tailored to specific supply chain configurations and resilience metrics, making them highly versatile. However, their computational demands are significant, especially for large and complex networks. Furthermore, the interpretation of Bayesian results requires a strong statistical background, which can present challenges for practitioners without specialized expertise. Additionally, like mathematical models, Bayesian methods rely heavily on high-quality data to build accurate probabilistic models.
Regarding the Cross-Border Resilience Performance Index, proposed in this study, it offers several advantages as follows. Firstly, it is more practical and an accessible tool for assessing both qualitative and quantitative resilience in the cross-border supply chains. Unlike the other methods, this approach is designed to be user-friendly, requiring minimal time, effort, and costly software. It allows for the assessment and benchmarking of resilience across different suppliers, providing actionable insights into what needs to be implemented to enhance resilience. The integration of both qualitative and quantitative measures makes it particularly effective in offering a holistic view of resilience, especially in the context of cross-border trades. However, its simplicity may limit the depth of quantitative analysis compared to more advanced methods like mathematical models or Bayesian networks. Additionally, the inclusion of qualitative measures introduces potential subjectivity, depending on how the assessments are conducted.
Secondly, while the other methods require specialized knowledge and expertise and are powerful in providing in-depth insights and detailed analyses, the Cross-Border Resilience Performance Index offers a practical and user-friendly alternative. Its design emphasizes simplicity, allowing users to quickly and efficiently assess the resilience of cross-border supply chains without the need for advanced expertise or costly software. This accessibility makes the proposed tool particularly appealing to organizations that lack the technical resources to adopt more complex methodologies, compared with the seminal methods that often demand significant computational resources and high-quality data, making them less accessible to organizations with limited technical capabilities. Additionally, the Cross-Border Resilience Performance Index integrates both qualitative and quantitative measures, enabling a comprehensive evaluation that considers numerical factors as well as less tangible elements, such as cultural and operational risks inherent in cross-border supply chains.
Thirdly, a notable advantage of the Cross-Border Resilience Performance Index is its ability to provide actionable insights. Beyond measuring resilience, it identifies specific areas for improvement, offering organizations practical recommendations for enhancing their supply chain strategies. Its focus on cross-border supply chains further enhances its applicability, as it considers the diverse and dynamic challenges faced by businesses operating in international contexts. However, the simplicity of the index comes with certain limitations. Its depth in quantitative analysis may not match that of more advanced tools like mathematical models or Bayesian networks, which can capture highly detailed and probabilistic relationships within supply chains. Moreover, the inclusion of qualitative measures introduces potential for subjectivity, as the results may vary depending on the assessment methods employed.
In summary, while the advanced methodologies provide robust and detailed evaluations, the Cross-Border Resilience Performance Index strikes a balance between comprehensiveness and practicality. It is particularly well suited for cross-border supply chains, offering a user-friendly approach that combines accessibility with actionable insights, making it an invaluable tool for organizations seeking to enhance their resilience in a rapidly evolving global environment. However, the Cross-Border Resilience Performance Index is not proposed as a substitute for the other tools. While it may be useful as a starting point when assessing the resilience status, other assessment methods may be required for specific purposes.

5. Conclusions

A lack of practical tools to directly assess cross-border supplier resilience impedes the continuous flow of essential commodities supplied across the border. Therefore, by adapting the well-recognized LPI concept and the relevant supply chain resilience literature, this paper aims to develop a resilience assessment tool for cross-border supply chains that is more practical and user-friendly. Based on the literature review, the resiliency of cross-border suppliers relies on a group of adaptive capabilities, including flexibility, redundancy, collaboration, and agility. These capabilities could theoretically be dimensions (i.e., key indicators) for the resilience assessment. A set of questionnaire surveys corresponding to each assessment dimension was developed and validated with cross-border experts. To enhance the research’s applicability, the final questionnaire-based assessment tool has been employed to assess the resilience of Thai construction material cross-border suppliers along the Thai–Laos border.
The study proposes an alternative tool called the Cross-Border Resilience Performance Index, which is the study’s primary contribution and is novel to the supply chain literature. It can be used to assess the resilience status of cross-border supply chains. Compared with other seminal methodologies, the Cross-Border Resilience Performance Index is more practical and user-friendly. It does not require specialized knowledge and expertise and complex computational techniques. Practitioners can use the tool to benchmark and determine which suppliers are more resilient than others. This valuable information can become one of the criteria for supplier selection and evaluation for the buyers. Selecting cross-border suppliers that are more flexible, adaptive, collaborative, and responsive can better ensure smooth supply across borders. A detailed analysis of each assessment dimension plays a crucial role in identifying immediate areas for improvement for cross-border suppliers. Understanding the status quo and developing precise resilience initiatives to boost (or maintain) resilience capabilities can eliminate the cross-border suppliers from being the supply chain bottlenecks.
With its practicality and user-friendly working environment, the Cross-Border Resilience Performance Index should be regularly and continuously used to assess cross-border suppliers. It should be used by firms, practitioners, policymakers, and governments to assess the resilience status of cross-border supply chains. Assessing such status should reveal the strength of the cross-border supply chains when facing disasters and disruptive events. This will eventually ensure the smooth distribution of commodities and effective international trade. Suppliers can improve their resilient performances to maintain their businesses. Having a more practical resilience assessment tool can cope with the immediate needs arising from the ground, especially in the case of the Thai–Laos cross-border, where Thai suppliers have had a significant influence on the Laos market. With the impact of the coronavirus pandemic, the ongoing global economic concerns, and upcoming uncertainties, many buyers (including ones from Laos) have decided to diversify their supply chain risks and extend their supply markets. Thai suppliers are in dire need of a practical means for evaluation and advice on building resiliency on inbound and outbound supply chain perspectives to maintain their businesses under the global supply chain realignment scheme.
Nonetheless, the Cross-Border Resilience Performance Index has some limitations. Firstly, despite its practicality, one who employs the proposed assessment tool must possess knowledge of SCRES. It is essential for the success of using the proposed tool, especially during semi-structured interviews and data analysis. Next, the assessment dimensions have been defined with the views of the authors and a limited number of cross-border experts. The proposed assessment tool still needs further validation. It may serve as a starting point for further studies to replicate and validate with more case studies, such as adapting it to other types of cross-border supply chains, such as production, and other industrial and geographical contexts. It may require some modifications, but the interesting question is whether assessment metrics need to be removed or added to address various contexts. Using the proposed tool for case studies with different supply chain characteristics or commodity types might result in prioritizing, revising, or adding novel assessment dimensions. Once the proposed tool has been validated with multiple case studies, conducting a sensitivity analysis and multiple case analysis would be an interesting topic. Researchers may need to observe how characteristics of industries and firms as well as organizational behavior influence specific resilience dimensions and scores of the index.

Author Contributions

Conceptualization, R.B. and N.B.; methodology, R.B., N.B., P.J. and P.V.; validation, N.B.; formal analysis, N.B.; investigation, P.J. and P.V.; data curation, N.B.; writing–original draft preparation, R.B. and N.B.; writing–review and editing, R.B. and P.J; visualization, N.B.; supervision, R.B.; project administration, P.V.; funding acquisition, R.B. All authors have read and agreed to the published version of the manuscript.

Funding

This research was funded by the Thailand Science Research and Innovation Fundamental Fund fiscal year 2023, grant number Fundamental Fund fiscal year 2023. The APC was funded by the Thailand Science Research and Innovation Fundamental Fund fiscal year 2023.

Institutional Review Board Statement

We confirm that our research did not involve human subjects and meets the American Association for Public Opinion Research (2022) guideline; thereby, an ethical approval is not necessary to our paper. According to the guideline, if the data in the research was not obtained from human by using any intervention or interaction with human, it does not meet the definition of “human subjects”. Furthermore, these findings cannot be generalized and do not require IRB Review (https://web.uri.edu/research-admin/office-of-research-integrity/human-subjects-protections/does-my-research-need-irb-review/). For more information about the American Association for Public Opinion Research (2022) guideline, please see https://www.aaup.org/report/institutional-review-boards-and-social-science-research.

Informed Consent Statement

The guideline further suggests that if the data is not individuals’ private data, it does not meet the definition of “human subjects”. Our research contains no individuals’ private data. Human interacted in our research were individuals who were corporate representatives and provided corporate-related information. We did not ask them to reveal their private information. They participated as anonymous and there is no way to trace back their origins. Although our research involves a questionnaire survey, we assure that the questionnaire was used to assess the firm’s performance, not used to inquire individuals’ private data. According to the American Association for Public Opinion Research (2022) guideline, our questionnaire does not meet the definition of “human subjects”.

Data Availability Statement

The data presented in this study are available upon request from the corresponding author, as they are corporate-related. Providing the data to anyone requires authorization from the corporation.

Acknowledgments

The authors would like to thank the members of the Federation of Thai Industries (FTI) for their efforts and time in participating in the validation session and providing valuable feedback to the developed assessment tool. These participants contributed their opinions to this research as representatives of the FTI. They provided verbal consent, and their private data and identities have been kept confidential by the research team.

Conflicts of Interest

There are no conflicts of interest.

References

  1. Yan, C.; Wang, X.; Zhang, Y.; Ding, Q. Analysis of cross-border supply chain network system. In Proceedings of the 5th International Conference on Electromechanical Control Technology and Transportation (ICECTT), Nanchang, China, 15–17 May 2020; pp. 603–606. [Google Scholar]
  2. Zhang, H.; Jia, F.; You, J.X. Striking a balance between supply chain resilience and supply chain vulnerability in the cross-border e-commerce supply chain. Int. J. Logist. Res. Appl. 2023, 26, 320–344. [Google Scholar] [CrossRef]
  3. Wang, L.; Zhang, C.; Jiang, F. Matching governance mechanisms with transaction-specific investment types and supplier roles: An empirical study of cross-border outsourcing relationships. Int. Bus. Rev. 2019, 28, 316–327. [Google Scholar] [CrossRef]
  4. Sneci. COVID-19: Its Impact on the Automotive Supply Chain and Lessons Learned. 2021. Available online: https://www.sneci.com/blog/covid-19-its-impact-on-the-automotive-supply-chain-and-lessons-learned/ (accessed on 11 September 2024).
  5. Karwasra, K.; Soni, G.; Mangla, S.K.; Kazancoglu, Y. Assessing dairy supply chain vulnerability during the COVID-19 pandemic. Int. J. Logist. Res. Appl. 2021, 27, 2378–2396. [Google Scholar] [CrossRef]
  6. Zighan, S. Managing the great bullwhip effects caused by COVID-19. J. Glob. Oper. Strateg. Sourc. 2021, 15, 28–47. [Google Scholar] [CrossRef]
  7. Steinbuch, Y. Suez Canal Ship Crisis May Unleash Worldwide Toilet Paper Shortage, New York Post. 2021. Available online: https://nypost.com/2021/03/26/suez-canal-crisis-may-unleash-worldwide-toilet-paper-shortage/ (accessed on 25 September 2024).
  8. Maskrey, A.; Jain, G.; Lavell, A. The social construction of systemic risk: Towards an actionable framework for risk governance. Disaster Prev. Manag. 2023, 32, 4–26. [Google Scholar] [CrossRef]
  9. Durach, C.F.; Wiengarten, F.; Choi, T.Y. Supplier-supplier coopetition and supply chain disruption: First-tier supplier resilience in the tetradic context. Int. J. Oper. Prod. Manag. 2020, 40, 1041–1065. [Google Scholar] [CrossRef]
  10. Adobor, H.; McMullen, R.S. Supply chain resilience: A dynamic and multidimensional approach. Int. J. Logist. Manag. 2018, 29, 1451–1471. [Google Scholar] [CrossRef]
  11. Chowdhury, M.M.H.; Quaddus, M. Supply chain readiness, response and recovery for resilience. Supply Chain Manag. Int. J. 2016, 21, 709–731. [Google Scholar] [CrossRef]
  12. Agarwal, N.; Seth, N.; Agarwal, A. Evaluation of supply chain resilience index: A graph theory-based approach. Benchmarking Int. J. 2022, 29, 735–766. [Google Scholar] [CrossRef]
  13. Pereira, C.R.; da Silva, A.L.; Tate, W.L.; Christopher, M. Purchasing and supply management (PSM) contribution to supply-side resilience. Int. J. Prod. Econ. 2020, 228, 107740. [Google Scholar] [CrossRef]
  14. Shivajee, V.; Singh, R.K.; Rastogi, S. Procurement system for resilient supply chain amid the COVID-19 pandemic: Systematic literature review. J. Glob. Oper. Strateg. Sourc. 2023, 16, 397–429. [Google Scholar] [CrossRef]
  15. Kähkönen, A.K.; Patrucco, A.S. Guest editorial: A purchasing and supply management view of supply resilience for better crisis response. J. Purch. Supply Manag. 2022, 28, 100803. [Google Scholar] [CrossRef]
  16. Han, Y.; Chong, W.K.; Li, D. A systematic literature review of the capabilities and performance metrics of supply chain resilience. Int. J. Prod. Res. 2020, 58, 4541–4566. [Google Scholar] [CrossRef]
  17. Brookbanks, M.; Parry, G.C. The impact of Industry 4.0 technologies on the resilience of established cross-border supply chains. Supply Chain Manag. 2024, 29, 731–754. [Google Scholar] [CrossRef]
  18. Jain, V.; Kumar, S.; Soni, U.; Chandra, C. Supply chain resilience: Model development and empirical analysis. Int. J. Prod. Res. 2017, 55, 6779–6800. [Google Scholar] [CrossRef]
  19. Lohmer, J.; Bugert, N.; Lasch, R. Analysis of resilience strategies and ripple effect in blockchain-coordinated supply chains: An agent-based simulation study. Int. J. Prod. Econ. 2020, 228, 107882. [Google Scholar] [CrossRef]
  20. Scholten, K.; Stevenson, M.; van Donk, D.P. Dealing with the unpredictable: Supply chain resilience. Int. J. Oper. Prod. Manag. 2020, 40, 1–10. [Google Scholar] [CrossRef]
  21. Pettit, T.J.; Croxton, K.L.; Fiksel, J. Ensuring supply chain resilience: Development and implementation of an assessment tool. J. Bus. Logist. 2013, 34, 46–76. [Google Scholar] [CrossRef]
  22. Shahbaz, M.S.; Rasi, R.Z.R.M.; Ahmad, M.F.B.; Rehman, F. What is supply chain risk management? A review. Adv. Sci. Lett. 2017, 23, 9233–9238. [Google Scholar] [CrossRef]
  23. Tay, H.L.; Banomyong, R.; Varadejsatitwong, P.; Julagasigorn, P. Mitigating risks in the disaster management cycle. Adv. Civ. Eng. 2022, 2022, 7454760. [Google Scholar] [CrossRef]
  24. Tummala, R.; Schoenherr, T. Assessing and managing risks using the supply chain risk management process (SCRMP). Supply Chain Manag. Int. J. 2011, 16, 474–483. [Google Scholar] [CrossRef]
  25. Ponis, S.; Koronis, E. Supply chain resilience: Definition of concept and its formative elements. J. Appl. Bus. Res. 2012, 28, 921–930. [Google Scholar] [CrossRef]
  26. Tukamuhabwa, B.R.; Stevenson, M.; Busby, J.; Zorzini, M. Supply chain resilience: Definition, review and theoretical foundations for Further Study. Int. J. Prod. Res. 2015, 53, 5592–5623. [Google Scholar] [CrossRef]
  27. Christopher, M.; Peck, H. Building the Resilient Supply Chain. Int. J. Logist. Manag. 2004, 15, 1–14. [Google Scholar] [CrossRef]
  28. Shekarian, M.; Parast, M.M. An integrative approach to supply chain disruption risk and resilience management: A literature review. Int. J. Logist. Res. Appl. 2021, 24, 427–455. [Google Scholar] [CrossRef]
  29. Christopher, M.; Holweg, M. Supply chain 2.0: Managing supply chains in the era of turbulence. Int. J. Phys. Distrib. Logist. Manag. 2011, 41, 63–82. [Google Scholar] [CrossRef]
  30. Bhusiri, N.; Banomyong, R.; Julagasigorn, P.; Varadejsatitwong, V.; Dhami, N. A purchasing portfolio model for humanitarian supply chain resilience: Perspectives from a development aid context. J. Humanit. Logist. Supply Chain Manag. 2021, 11, 639–660. [Google Scholar] [CrossRef]
  31. Kraljic, P. Purchasing must become supply management. Harv. Bus. Rev. 1983, 61, 109–117. [Google Scholar]
  32. Min, S.; Roath, A.S.; Daugherty, P.J.; Genchev, S.E.; Chen, H.; Arndt, A.D.; Richey, R.G. Supply chain collaboration: What’s happening? Int. J. Logist. Manag. 2005, 16, 237–256. [Google Scholar] [CrossRef]
  33. Chen, J.; Sohal, A.S.; Prajogo, D.L. Supply chain operational risk mitigation: A collaborative approach. Int. J. Prod. Res. 2013, 51, 2186–2199. [Google Scholar] [CrossRef]
  34. Ivanov, D. Two views of supply chain resilience. Int. J. Prod. Res. 2023, 62, 4031–4045. [Google Scholar] [CrossRef]
  35. Ali, A.; Mahfouz, A.; Arisha, A. Analysing supply chain resilience: Integrating the constructs in a concept mapping framework via a systematic literature review. Supply Chain Manag. Int. J. 2017, 22, 16–39. [Google Scholar] [CrossRef]
  36. Sheffi, Y.; Rice, J.B., Jr. A supply chain view of the resilient enterprise. MIT Sloan Manag. Rev. 2005, 47, 41–48. [Google Scholar]
  37. Fridolfsson, E.; Lapidoth, L.D.M. Assessing Supply Chain Resilience to Mitigate Supply Chain Risks: A Case Study of the Inbound Logistics at Volvo CE. Master’s Thesis, Linköping University, Linköping, Sweden, 2023. [Google Scholar]
  38. Pettit, T.J.; Fiksel, J.; Croxton, K.L. Ensuring supply chain resilience: Development of a conceptual framework. J. Bus. Logist. 2010, 31, 1–21. [Google Scholar] [CrossRef]
  39. Zhao, G.; Liu, S.; Wang, Y.; Lopez, C.; Zubairu, N.; Chen, X.; Xie, X.; Zhang, J. Modelling enablers for building agri-food supply chain resilience: Insights from a comparative analysis of Argentina and France. Prod. Plan. Control 2024, 35, 283–307. [Google Scholar] [CrossRef]
  40. Rahman, M.S. The advantages and disadvantages of using qualitative and quantitative approaches and methods in language testing and assessment research: A literature review. J. Educ. Learn. 2016, 6, 102–112. [Google Scholar] [CrossRef]
  41. Fattahi, M.; Govindan, K.; Maihami, R. Stochastic optimization of disruption-driven supply chain network design with a new resilience metric. Int. J. Prod. Econ. 2020, 230, 107755. [Google Scholar] [CrossRef]
  42. Spiegler, V.L.; Naim, M.M.; Wikner, J. A control engineering approach to the assessment of supply chain resilience. Int. J. Prod. Res. 2012, 50, 6162–6187. [Google Scholar] [CrossRef]
  43. Dixit, V.; Verma, P.; Tiwari, M.K. Assessment of pre and post-disaster supply chain resilience based on network structural parameters with CVaR as a risk measure. Int. J. Prod. Econ. 2020, 227, 107655. [Google Scholar] [CrossRef]
  44. Badhotiya, G.K.; Soni, G.; Jain, V.; Joshi, R.; Mittal, S. Assessing supply chain resilience to the outbreak of COVID-19 in Indian manufacturing firms. Oper. Manag. Res. 2022, 15, 1161–1180. [Google Scholar] [CrossRef]
  45. Aguila, J.O.; ElMaraghy, W. Supply chain resilience and structure: An evaluation framework. Procedia Manuf. 2019, 28, 43–50. [Google Scholar] [CrossRef]
  46. Rajesh, R.; Ravi, V. Modelling enablers of supply chain risk mitigation in electronic supply chains: A Grey-DEMATEL approach. Comput. Ind. Eng. 2015, 87, 126–139. [Google Scholar] [CrossRef]
  47. Arvis, J.; Ojala, L.; Shepherd, B.; Ulybina, D.; Wiederer, C. Connecting to Compete 2023: Trade Logistics in an Uncertain Global Economy—The Logistics Performance Index and Its Indicators; World Bank: Washington, DC, USA, 2023. [Google Scholar] [CrossRef]
  48. Beysenbaev, R.; Dus, Y. Proposals for improving the Logistics Performance Index. Asian J. Shipp. Logist. 2020, 35, 34–42. [Google Scholar] [CrossRef]
  49. Tongur, U.; Turkcan, K.; Ekmen-Ozcelik, S. Logistics performance and export variety: Evidence from Turkey. Cent. Bank Rev. 2020, 20, 143–154. [Google Scholar] [CrossRef]
  50. Qazi, A.A.; Appolloni, A.; Shaikh, A.R. Does the stakeholder’s relationship affect supply chain resilience and organizational performance? Empirical evidence from the supply chain community of Pakistan. Int. J. Emerg. Markets 2024, 19, 1879–1900. [Google Scholar] [CrossRef]
  51. Olsen, R.F.; Ellram, L.M. A portfolio approach to supplier relationships. Ind. Mark. Manag. 1997, 26, 101–113. [Google Scholar] [CrossRef]
  52. Hu, S.; Dong, Z.S.; Lev, B. Supplier selection in disaster operations management: Review and research gap identification. Socio-Econ. Plan. Sci. 2022, 82, 101302. [Google Scholar] [CrossRef]
  53. Pereira, C.R.; Christopher, M.; Da Silva, A.L. Achieving supply chain resilience: The role of procurement. Supply Chain Manag. Int. J. 2014, 19, 626–642. [Google Scholar] [CrossRef]
  54. Padhi, S.S.; Wagner, S.M.; Aggarwal, V. Positioning of commodities using the Kraljic portfolio matrix. J. Purch. Supply. Manag. 2012, 18, 1–8. [Google Scholar] [CrossRef]
  55. Lamphayphan, T.; Toyoda, T.; Czerkawski, C.; Kyophilavong, P. Export supply of electricity from Laos to Thailand: An econometric analysis. Int. J. Energy Econ. Policy 2015, 5, 450–460. [Google Scholar]
  56. Asa, S.P. The Impact of Trade Cost and Trade Facilitation on Export of Lao PDR; Mekong Institute: Khon Kaen, Thailand, 2014; Volume 5. [Google Scholar]
  57. OEC. Historical Data. Thailand/Laos: Historical Data. 2024. Available online: https://oec.world/en/profile/bilateral-country/tha/partner/lao/ (accessed on 11 September 2024).
  58. Kyophilavong, P.; Lamphayphan, T. Lao PDR Country Report. In Financing ASEAN Connectivity; Zen, F., Regan, M., Eds.; ERIA Research Project Report FY2013, No. 15; ERIA: Jakarta, Indonesia, 2014; pp. 131–165. [Google Scholar]
Figure 1. General structure of the cross-border supply chain.
Logistics 09 00001 g001
Figure 2. LPI results (i.e., benchmarking of national logistics performances of Singapore, Thailand, and Laos) (source: Arvis et al. [47]).
Logistics 09 00001 g002
Figure 3. Overall resilient performances of Big Supplier.
Logistics 09 00001 g003
Figure 4. Overall resilient performances of Small Supplier.
Logistics 09 00001 g004
Figure 5. Resilient performances of Big Supplier by sub-indicator.
Logistics 09 00001 g005
Figure 6. Resilient performances of Small Supplier by sub-indicator.
Logistics 09 00001 g006
Figure 7. Comparison of overall Cross-Border Resilience Performance Indexes of Big Supplier and Small Supplier.
Logistics 09 00001 g007
Table 1. Focused supply chain resilience capabilities.
Categories of Supply Chain Resilience CapabilityExamples of Key EnablersExamples of Implementable Initiatives and Mitigating Policies in Practices
Supply chain flexibility [10,26,28]
-
Flexible supplier and supply base [21,27]
-
Flexible labor arrangement and deployment [29]
-
Flexible financial resources [26]
-
Flexible production capacity [12]
-
Flexible transportation [26]
-
Flexible order fulfillment and distribution [21]
-
Flexible inventory [29]
-
Flexible storage capacity [29]
-
Dual/multiple sourcing and outsourcing policy [29]
-
Developing appropriate supplier selection criteria [30,31]
-
Supplier contract flexibility [12]
-
Developing alternative transport and distribution channels [11]
-
Raw material/product substitution policy [30]
-
Portfolio diversification [30,31]
-
Production postponement [29]
-
Having alternative technology and device deployment [29]
-
Multi-skilled labor capacity building [29]
Supply chain redundancy [26,28]
-
Duplication/backup/alternative of resources, suppliers, inventories, and capacities [21]
-
Supply network diversification in diverse locations [21,26]
-
Spare inventory [26]
-
Safety/buffer stock [30]
-
Dual/multiple sourcing policy [29]
-
Developing alternative (reserved/slack) production and storage capacity [21,27]
-
Maintaining low capacity utilization policy [21]
Supply chain collaboration [26,28]
-
Supply chain visibility [24]
-
Supply chain orchestration [18,32]
-
Supply chain coordination and communication [21,33]
-
Relationship orientation [30,31]
-
Information sharing and knowledge management [27,33]
-
Demand/supply forecasting [32]
-
Configurable workflows and processes [32]
-
Joint planning [32]
-
Collaborative solution development [32]
-
Strategic partnership establishment [30]
Supply chain agility [26,28]
-
Supply chain visibility [27]
-
Supply chain velocity [27]
-
End-to-end supply chain visibility [21]
-
Regular risk and vulnerability management [27]
-
Early warning monitoring [33]
-
Forecasting [21]
-
Contingency planning development [32]
-
Streamlining processes and mitigating non-valued added processes [27]
Table 2. Indicators for resilience assessment in terms of the integrated flexibility and redundancy resilience capabilities.
Indicator: Flexibility and Redundancy Resilience Capabilities
Assessment components in perspective of the inbound supply chain of the supplier tier-1Sub-indicatorsAssessment components in perspective of the outbound supply chain of the supplier tier-1
(1) An ability to have (or apply) an appropriate purchasing portfolio and supplier categorization [30,31]
(2) An ability to have an expansion and diversification of locations/sources of supply [26]
(3) An ability to have a strengthened partnership with its strategic supplier and request to have a safety stock of important commodities to ensure smooth supply [20]
(4) An ability to have a strengthened partnership with its strategic supplier and request increased supplies on short notice [50]
Flexible supply(1) An ability to assist (or provide information or participate) buyer in analyzing and categorizing purchasing portfolio and supplier [30,31]
(2) An ability to provide expansion of locations of supply by having inventories in multiple locations domestically and internationally [26]
(3) An ability to provide a strengthened partnership and store safety stocks or extra inventories (i.e., important commodities) for buyers [20]
(4) an ability to provide a strengthened partnership and increased supplies to be delivered at short notice (i.e., having spare/slack capacity) [50]
(1) An ability to have a diversification of inbound distribution channels (and transport modes) [26]
(2) An ability to redeploy and expand its own transport resources for inbound deliveries (in case the supplier tier-1 uses its own transport resources) [26]
(3) An ability to have an expansion/diversification of transport outsourcing options [26]
Flexible transport and distribution channel(1) An ability to provide a diversification of outbound distribution channels (and transport modes) [26]
(2) An ability to redeploy and expand its own transport resources for outbound deliveries (in case the supplier tier-1 uses its own transport resources for deliveries to the buyer) [26]
(3) An ability to provide an expansion/diversification of transport outsourcing options [26]
(1) An ability to have a strengthened partnership with its strategic supplier and request to build capacities of the workforce to be more productive and multi-skilled. Also, an ability to build capacities of its own workforce to handle inbound deliveries [26]
(2) An ability to have a strengthened partnership with its strategic supplier and request to redeploy and expand the workforce. Also, an ability to redeploy and expand its workforce to handle inbound deliveries [26]
Flexible workforce arrangement(1) An ability to provide a strengthened partnership and prepare to build the capacities of its workforce (to handle outbound deliveries) to be more productive and multi-skilled [26]
(2) An ability to provide a strengthened partnership and prepare to redeploy and expand its workforce (to handle outbound deliveries) [26]
Table 3. Indicators for resilience assessment in terms of integrated collaboration and agility resilience capabilities.
Indicator: Collaboration and Agility Resilience Capabilities
Assessment components in perspective of the inbound supply chain of the supplier tier-1Sub-indicatorsAssessment components in perspective of the outbound supply chain of the supplier tier-1
(1) An ability to have information and supply chain performances exchanged, shared, received, tracked, and monitored by other suppliers [28]
(2) An ability to analyze and evaluate the performance of supply (from other suppliers) [28]
Supply chain visibility(1) An ability to share and exchange its information for the buyers to track and monitor the performances and receive useful information from the buyer [28]
(2) An ability to analyze and forecast demands from the buyer [28]
(1) An ability to prioritize its suppliers
(2) An ability to have an appropriate establishment of different levels of relationships with other suppliers [30]
Relationship orientation(1) An ability to assist the buyer in prioritizing the supply base
(2) An ability to assist the buyer in establishing appropriate relationships [30]
(1) An ability to have proactive, regular, and responsive communicate with other suppliers. Also, it includes the ability to have an alignment of communication channels [28]Supply chain communication(1) An ability to provide proactive, regular, and responsive communication with the buyer. Also, it includes an ability to provide an alignment of communication channels [28]
Table 4. Examples of the questionnaire.
Sub-Indicator (and Its Assessment Component #)Question
Flexible supply (the 1st assessment component under the inbound supply chain perspective)Do you know who your strategic suppliers are or what your strategic purchased items are? Have you prioritized your suppliers and purchased items?
Do you regularly prioritize (or have you prioritized) your suppliers by considering other characteristics/criteria of your suppliers other than the highest volume purchases or the highest spending per year?
Do you involve risks, difficulties, and challenges of acquiring and procuring items as criteria when you prioritize or differentiate between strategic suppliers (strategic items) and others?
Do you know (or have you applied) the concept of the Kraljic model (or something similar) when differentiating between strategic suppliers (strategic items) and others (i.e., it can result in four categories: non-critical, leverage, bottleneck, and strategic. All categories will have different partnership engagements and sourcing strategies.)?
The answers range across five levels: Not at all, Rarely/Somewhat agree, Sometimes/Agree, Often/Strongly agree, and Nearly always/Totally agree.
Table 5. Supplier characteristics.
NameBusiness SizeTypes of Cross-Border Business and Customer in LaosTypes of Transportation Used for Cross-Border Service
A, B, CBig (with market capitalization of ≥THB 1000 million)
-
Offering a wider variety of products
-
Main cross-border customers are big retailers in Laos (i.e., it can be considered a business-to-business type)
-
Offering cross-border transport services by own transport resources. Being able to provide transport services with a big volume purchased.
D, ESmall (with market capitalization of <THB 100 million)
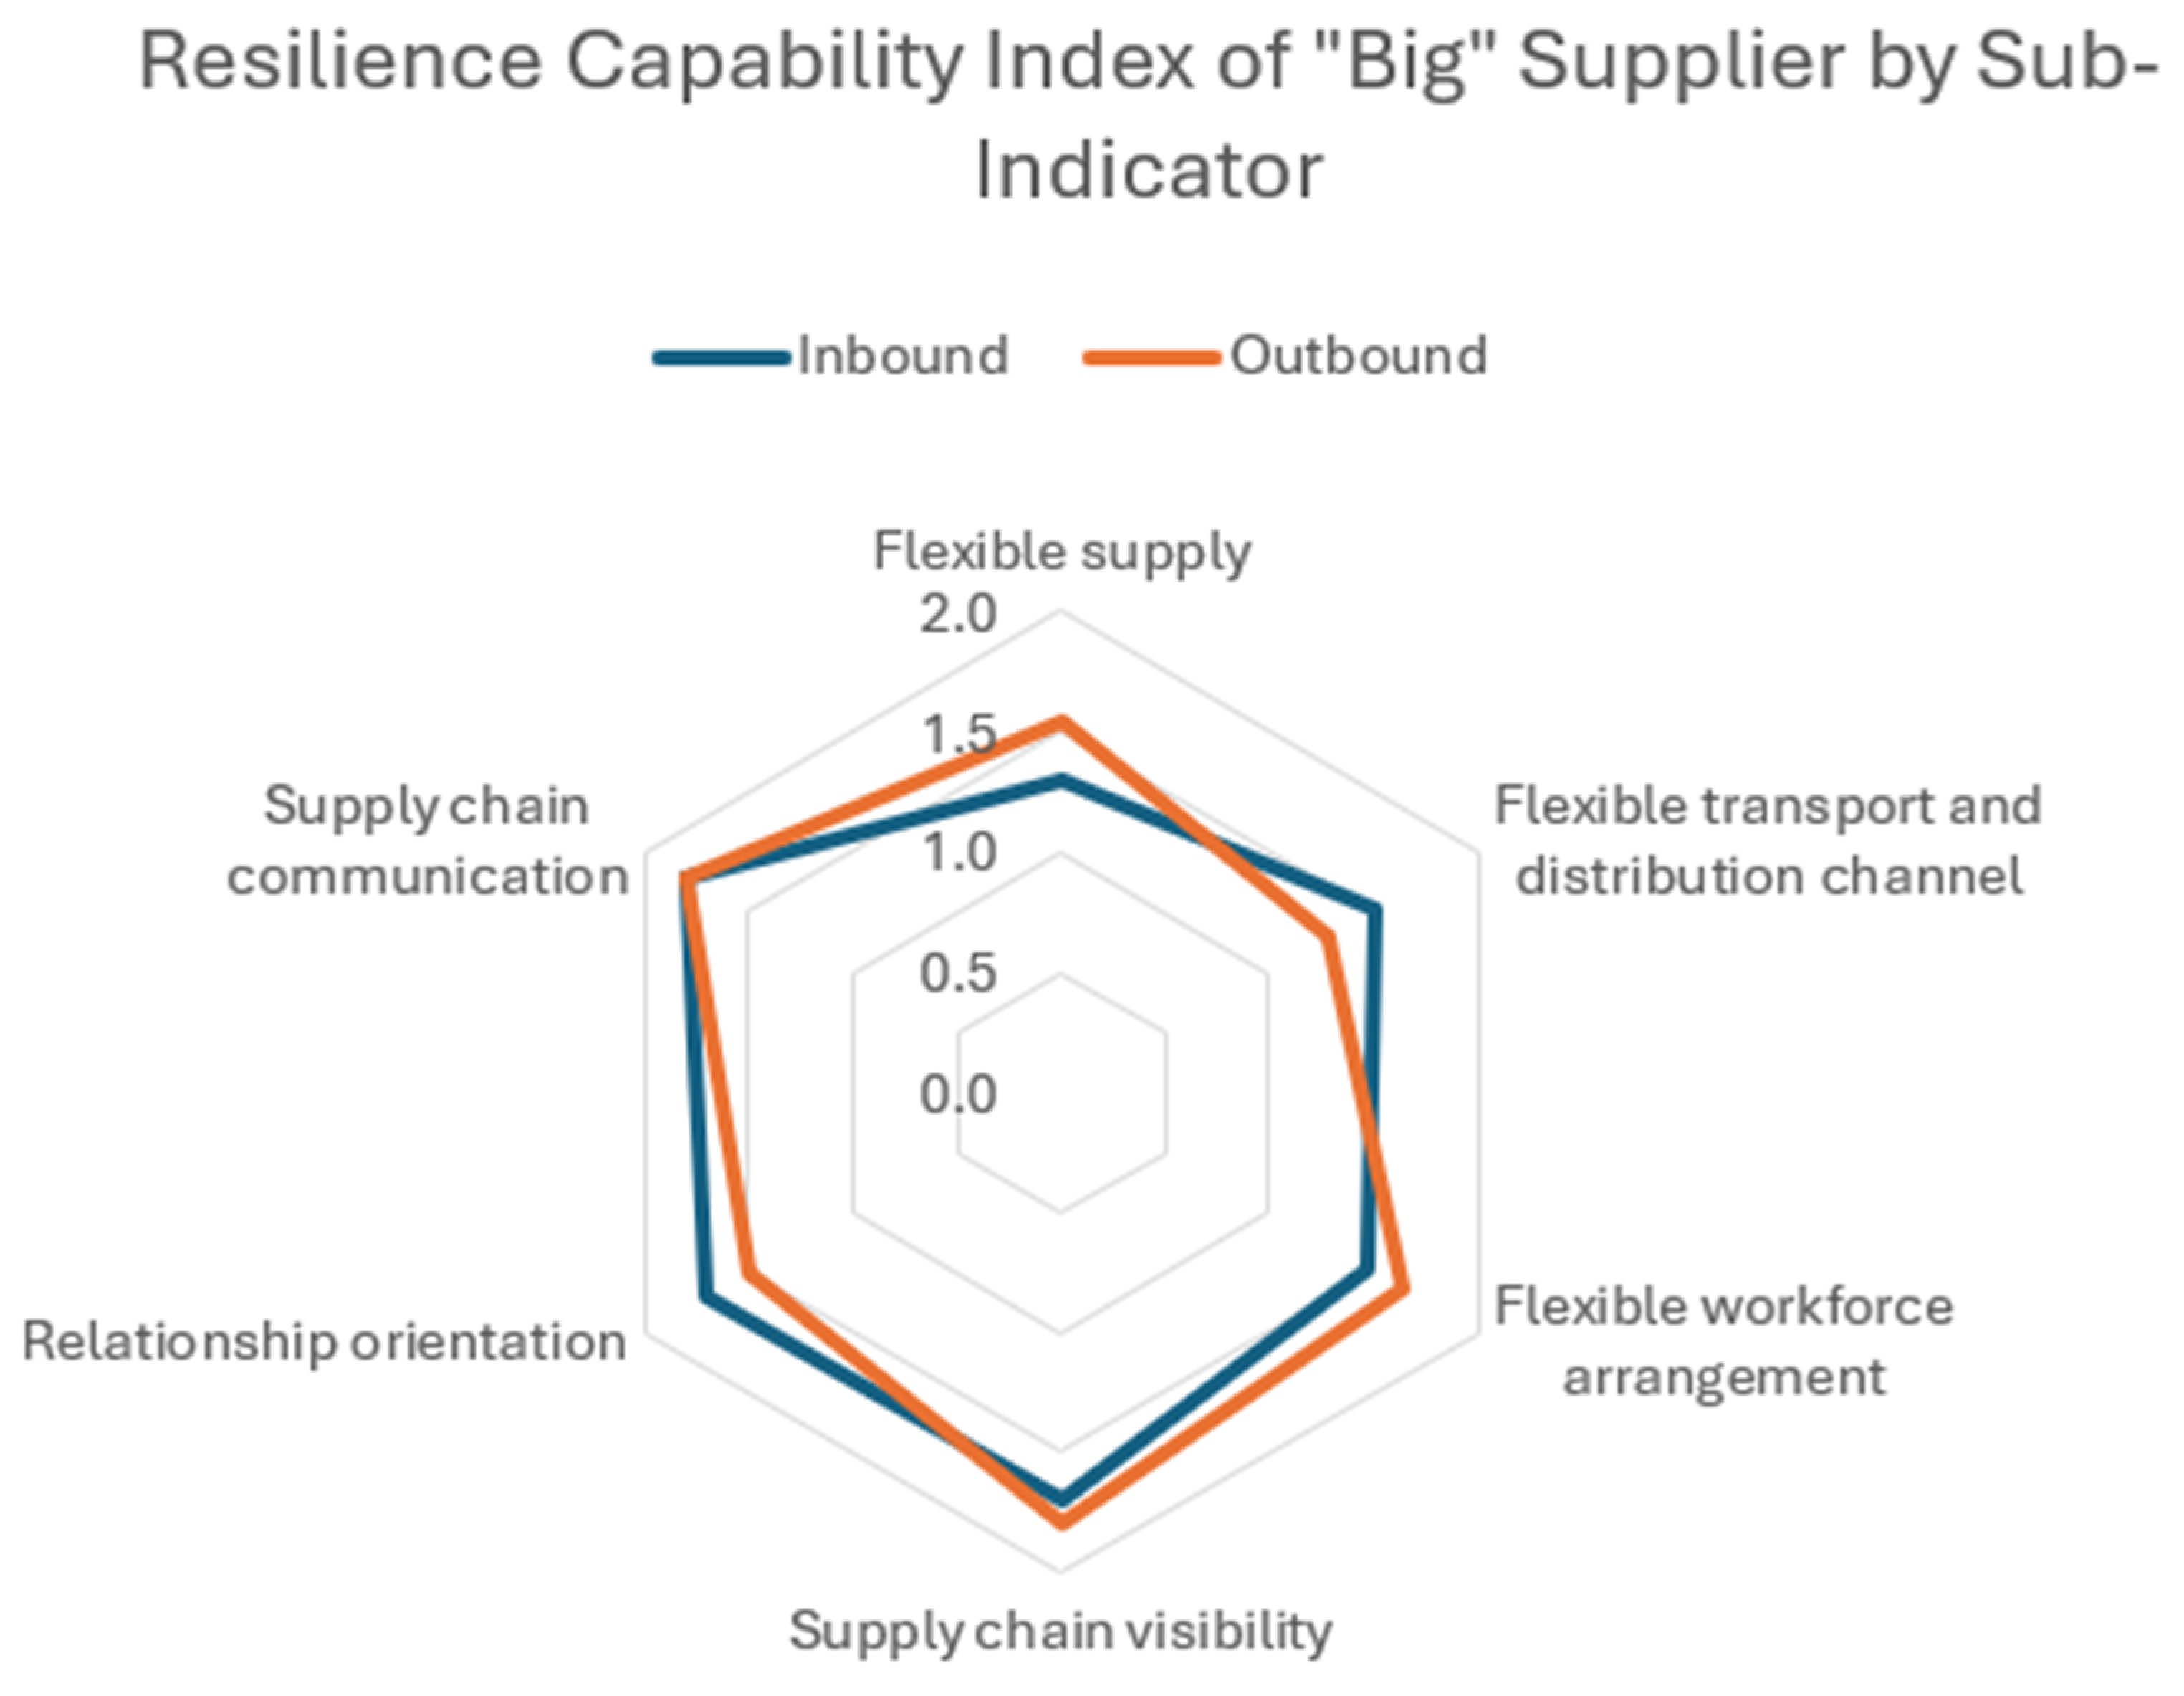
-
Offering a smaller variety of products
-
Cross-border customers are small and individual buyers in Laos
-
Having limited transport resources, limited capacity, knowledge, and skills to provide cross-border transport services by own transport resources. Cross-border transport is often conducted by buyers or by using outsourcing services.
Table 6. Cross-Border Resilience Performance Index of Big Supplier by assessment component of each sub-indicator.
IndicatorSub-IndicatorAssessment Component #Resilient Index
(Inbound Supply Chain Perspective)
Resilient Index
(Outbound Supply Chain Perspective)
The integrated supply chain flexibility and redundancy resilience capabilitiesFlexible supply#11.61.4
#21.41.8
#31.11.7
#41.11.2
Flexible transport and distribution channel#11.51.5
#21.61.4
#31.50.9
Flexible workforce arrangement#11.41.5
#21.51.8
The integrated supply chain collaboration and agility resilience capabilitiesSupply chain visibility#11.81.8
#21.61.8
Relationship orientation#11.71.5
#21.61.5
Supply chain communication#11.81.8
Table 7. Cross-Border Resilience Performance Index of Small Supplier by assessment component of each sub-indicator.
IndicatorSub-IndicatorAssessment Component #Resilient Index
(Inbound Supply Chain Perspective)
Resilient Index
(Outbound Supply Chain Perspective)
The integrated supply chain flexibility and redundancy resilience capabilitiesFlexible supply#11.01.0
#21.01.0
#31.01.0
#41.01.0
Flexible transport and distribution channel#11.41.0
#20.31.0
#31.41.0
Flexible workforce arrangement#11.01.0
#21.01.0
The integrated supply chain collaboration and agility resilience capabilitiesSupply chain visibility#11.61.7
#21.41.5
Relationship orientation#10.81.1
#21.01.1
Supply chain communication#11.81.8
Table 8. Evaluation of the proposed tool against the existing methods.
TableAdvantagesDisadvantages
Mathematical Models [41,42]Robust optimization under uncertainty; quantitative insights; customizabilityHigh computational demand; data-intensive; complex implementation
Simulation Techniques [43]Dynamic scenario analysis; risk quantification (CVaR); visualizationTime/resource-intensive; limited generalizability; expertise required
Graph Theoretical Approach [12]Simplicity; network visualization; broad applicabilityStatic nature; simplistic assumptions; limited predictive capabilities
Bayesian/Analytical Models [44,45]Uncertainty modeling; causal relationships; flexibilityComputationally intensive; data-dependent; interpretation challenges
Cross-Border Resilience Performance Index (proposed by the authors)Practical; user-friendly; qualitative and quantitative integration; benchmarking capabilityLimited depth in quantitative modeling; potential subjectivity; focused on cross-border scenarios
Disclaimer/Publisher’s Note: The statements, opinions and data contained in all publications are solely those of the individual author(s) and contributor(s) and not of MDPI and/or the editor(s). MDPI and/or the editor(s) disclaim responsibility for any injury to people or property resulting from any ideas, methods, instructions or products referred to in the content.

