Abstract
Background: Efficient inventory management is critical for sustainability in supply chains. However, maintaining adequate inventory levels becomes challenging in the face of unpredictable demand patterns. Furthermore, the need to disseminate demand-related information throughout a company often relies on cloud services. However, this method sometimes encounters issues such as limited bandwidth and increased latency. Methods: To address these challenges, our study introduces a system that incorporates a machine learning algorithm to address inventory-related uncertainties arising from demand fluctuations. Our approach involves the use of an attention mechanism for accurate demand prediction. We combine it with the Newsvendor model to determine optimal inventory levels. The system is integrated with fog computing to facilitate the rapid dissemination of information throughout the company. Results: In experiments, we compare the proposed system with the conventional demand estimation approach based on historical data and observe that the proposed system consistently outperformed the conventional approach. Conclusions: This research introduces an inventory management system based on a novel deep learning architecture that integrates the attention mechanism with cloud computing to address the Newsvendor problem. Experiments demonstrate the better accuracy of this system in comparison to existing methods. More studies should be conducted to explore its applicability to other demand modeling scenarios.
1. Introduction
The Newsvendor model, also known as the single-period model, is of significant importance in supply chain management [1]. In its classical form, this model addresses the challenge of managing one or more perishable items during a single sales period. The items face uncertain demand governed by a known distribution [2]. However, practical scenarios rarely provide insight into the actual demand distribution, and the techniques used to determine it are complex and prone to computational errors [3].
Previous studies have highlighted that the demand value is influenced by a range of factors recognized in the existing literature as external variables. These variables are called attributes of the demand data [4]. Among these attributes, elements such as local weather conditions, day of the week, month of the year, interest rates, and discounts play a role, in addition to various other local factors [2]. Furthermore, some researchers also account for broader attributes at the regional and global levels, including inflation, factors that affect competition, and the consumer price index [5]. In particular, neural networks exhibit particular proficiency in processing and analyzing this type of data [2].
To enhance the effectiveness of existing cutting-edge models for order allocation, our research focuses on using the attention mechanism [6] and recurrent neural networks (RNNs), more specifically a Gated Recurrent Unit (GRU) [7], to capture and represent the trend of demand. Our rationale is that the attention mechanism can effectively identify relevant and significant information related to the demand while disregarding irrelevant and noisy data. In addition, we propose integrating this distribution with the Newsvendor model, allowing us to establish an optimal stocking policy. In addition, we harness the power of fog computing to facilitate the sharing of predictions, ensuring that stakeholders and the entire supply chain are equipped with accurate and timely information. In this research, we introduced a conceptual system for inventory management that uses fog computing, incorporates deep learning techniques, and is based on the Newsvendor model. Thus, this study brings three key contributions:
- Introducing a novel deep learning architecture that combines RNNs and the attention mechanism to effectively model demand. By leveraging these techniques, we aim to capture intricate patterns and dependencies within demand data, ultimately improving the accuracy of our predictions.
- Developing an integration framework that combines the deep learning architecture with the Newsvendor model. This integration enables us to derive an optimal stocking policy, which takes into account both the demand trend and other relevant factors, ensuring efficient allocation of resources and minimizing costs.
- Using fog computing as a means of communication across various processes within the supply chain, specifically for data acquisition purposes. By leveraging fog computing, we establish a decentralized network that enables efficient and seamless sharing of prediction results. This ensures that stakeholders throughout the supply chain have access to up-to-date demand predictions, allowing them to make informed decisions regarding stocking and resource allocation.
2. Literature Review
In this section, we aim to explore some necessary concepts and pertinent literature surrounding Industry 4.0, Industrial Internt of Things (IIoT) and fog computing. These topics provide important insights into the technological landscape that support our research. The accelerated and frequent advances in technology have led to significant updates in the industrial sector [8]. These progressions cover a spectrum from automating manufacturing processes to self-regulating procedures that operate independently of human involvement [9]. This industrial paradigm demands comprehensive monitoring of the status of the system, together with the creation of responses by the control system to ensure effective operations [8].
The Industrial Internet of Things refers to the integration of industrial processes and their physical components into the Internet. When this concept is applied primarily to the manufacturing industry, it gives rise to the concept of Industry 4.0, which, in turn, is a subset of the larger notion of the Internet of Things [9]. Within IIoT and Industry 4.0, sensor networks observe system conditions, actuators execute control system responses, while operators, analysts, robots, business processes, and connected electrical devices contribute. This industrial approach generates substantial volumes of data [10] that can be stored and processed in the cloud. However, some processes require rapid response times that cloud processing is unable to deliver, leading to inefficiencies, sub-par product quality, and compromised operational security [11].
For addressing the requirements of IIoT with the cloud infrastructure, in some cases the adoption of an intermediary infrastructure, known as middleware, positioned between industrial processes and web services. This middleware, known as fog computing, embraces a distributed processing methodology in which IIoT devices proximate to the information source employ their installed capabilities. These devices possess fewer features but offer considerable computing power [12]. In essence, fog computing is characterized by limited storage and processing capacities, but sufficient power to maintain stable and efficient operation [9].
There exists several cases of the use of integration of industrial processing, IIoT, machine learning, and cloud and fog infrastructures, for example in [13] an hybrid method using convolutional neural network and GRUs with the attention mechanism to extract the temporal correlation features was proposed for time series workload prediction of host machines in cloud data centers this helps to predicts the workload for the next few steps. Also, in [14], it is introduced a biobjective model for optimizing a green supply chain, incorporating learning effects across suppliers, manufacturers, distribution centers, and retailers with varying capacities. Their model aims to minimize the costs associated with inventory, manpower, fixed, and variable expenses while reducing carbon dioxide emissions. For achieving this they try to optimize vehicle allocation, considering diverse scenarios, using Nondominated Sorting Genetic Algorithm-II as a optimization tool. while in [15] it is proposed a model for the vehicle routing problem in industrial environments. They try to optimize vehicle capacity and energy consumption by, simultaneously, reducing costs and waiting time for customers. For this end, a particle swarm optimization and Non-dominated Sorting Genetic Algorithm-II are employed. In [16] a defensive mechanism based on fog computing is proposed to secure communication in IIoT. The framework uses deep learning layers to help secure communication, in this case a a bidirectional long short-term memory and a GRU.
Although some authors distinguish between fog computing and edge computing based on hardware positioning and location of the computing center [12,17], this paper will use the terms interchangeably, referring to this middleware as fog computing. Fog computing can improve inventory management costs by the following means [18]:
- Real-time processing and data analysis of inventory levels to prevent excess.
- Predictive maintenance facilitated by IIoT devices, offering insight into machine and equipment status, mitigating unscheduled downtime.
- Inventory optimization involves the execution of algorithms to analyze various data sources such as sales, inventory levels, shipment dates and quantities, and demand data characteristics [2].
- Enhanced supply chain visibility emerges by linking IIoT devices to cloud processing through fog processing, providing real-time insight into supply chain operations.
The standard design of the architecture for fog computing is commonly conceptualized as comprising three distinct layers, with the fog layer serving as an expansion of cloud services toward the network edge [19]. These layers consist of the cloud layer, the intermediary fog layer, and the IoT or sensor/device layer, shown in Figure 1.
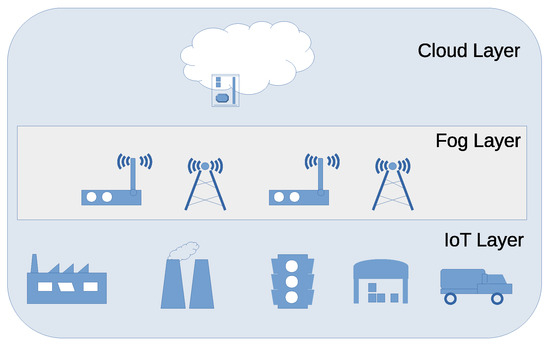
Figure 1.
Structure of fog computing.
The fog layer encompasses the fog nodes, a crucial element in the fog computing architecture [20]. A fog node consists of two layers: a hardware layer that houses physical resources such as CPU, memory, and network interfaces, and a system layer essential for hardware abstraction and application execution [20,21].
This research proposes enhancing the system layer of a fog node to acquire demand information from various equipment or sensors for predictive analysis using a deep learning algorithm. Subsequently, the Newsvendor model is used to suggest optimal batch sizes. This information is then transferred to the cloud for further analysis and distribution to stakeholders.
3. Materials and Methods
In this section, we present the proposed inventory management system, which uses fog computing and deep learning (DL) techniques. We examine the Newsvendor problem concerning the modeling of demand time series within a DL architecture. To achieve this, we propose merging the Newsvendor objective equation with the DL architecture. Subsequently, we integrate this combined approach into a fog node. This fog node serves as a communication hub, allowing interaction with various processes within the supply chain to predict demand and establish an optimal stocking policy. In the subsequent discussion, we provide a detailed overview of the key components comprising the fog node, namely the DL network and its integration with the Newsvendor model.
3.1. Demand Prediction with GRU and Attention Mechanism
Here we describe the proposed DL architecture for demand prediction. We make the assumption that the customer demand is stochastic, characterized by a random variable at time n, following a specific probability density function . Therefore, predicting the demand for any future time by looking ahead over the next k days involves finding a sequence that maximizes the conditional probability given the past history of samples in the past. In other words, we aim to determine
In this research, we employ a deep learning network that incorporates gated recurrent units (GRUs) and attention mechanisms to construct a parameterized model. The primary objective of this model is to maximize the conditional probability by training it on historical demand data, allowing for accurate predictions. In addition, our goal is to model the distribution of the predictions. To simplify the analysis without sacrificing generality, we assume a prediction horizon of , focusing on a single step prediction.
For the analysis and prediction of future trends, we employ a Recurrent Neural Network (RNN), which is a specific type of artificial neural network designed to handle sequences or time series data. This is achieved by determining a hidden representation, commonly referred to as a hidden state, of the input sequence. They are commonly used in deep learning architectures for tasks involving temporal dependencies, such as natural language processing and speech recognition. Among the RNN variants, the GRU has demonstrated superior performance compared to other popular implementations such as the LSTM. We also decide to use the GRU mainly because GRUs have a simpler architecture compared to LSTMs, by combining its forget and input gates into a single update gate, reduces the number of parameters to be learned, this in turn reduces its training speed and requires fewer computational resources compared to LSTMs. Additionally, GRUs tend to be less prone to overfitting than LSTMs, especially when the data set is small. The fewer parameters in GRUs can act as a form of regularization, preventing the model from memorizing noise in the data [22].
In general, a RNN maintains at each time step an internal hidden state tensor and produces an output that depends on the hidden state; note that is the dimension of the hidden state components and is related to the number of neurons in the RNN. The hidden state is updated at each step n with an input sequence , represented as a vector, according to
where the function varies based on the specific RNN type. For GRUs, consists of multiple gates, and the output can either be the complete hidden state for sequence-to-sequence modeling or the last component of the tensor for a summary representation of the entire input sequence. Here, we employ the former representation. In GRUs, the hidden state is updated according to [7]:
which involves element-wise (Hadamard) multiplication ⊙, an update gate , and a state determined by a reset gate as shown in
The gates and are given by
which model the input data and are determined by weight matrices , , , and that are learned based on the demand patterns, and is the sigmoid activation function. In particular, when the reset gate approaches zero, Equation (4) indicates that the state is based only on the input demand , effectively resetting the state. Furthermore, Equation (3) illustrates how the update gate controls the extent to which information from the previous hidden state influences the current hidden state.
In this work, we proposed a new representation of the demand sequence in terms of features, which is obtained automatically by the network. For this, a bank of convolutional layers (conv1D), each of these layers processes the input extracting different features because they have different filter sizes and activation functions, Figure 2. The output of the three convolutional layers is concatenated to obtain an enriched sequence with enhanced features , where is the dimension of the components of the feature sequence and is related to the number of filters in the convolutional layers. In this work, the number of filters is selected to match the dimension of the GRU components.

Figure 2.
Structure of the proposed deep learning network. Here, the inputs of the attention layer are identified with standard names: query, key, and value.
To enhance the model’s ability to assign higher importance to more relevant samples, we incorporate the Bahdanau attention mechanism block [6] into the GRU units. This attention block takes as input the hidden-state output from GRU and a new representation of the demand sequence. The Bahdanau attention mechanism is mainly used for sequential data because it enhances the model’s ability to understand long-range dependencies within input and output sequences. This is achieved by calculating attention weights that determine the importance of different components in the input data for the given task. These weights are computed for each element in the input sequence on the basis of its relevance to the current output element being generated. As a result, the model can selectively prioritize different parts of the input sequence during the prediction process, resulting in improved forecast quality.
For the case of the proposed model, the attention layer basically computes the scores considering both the input and the state of the GRU. These scores are then used to calculate weights that indicate the importance of different components in the prediction of demand. In essence, these weights allow the model to perform a weighted average of the state , placing more emphasis on the most relevant components of during the prediction process.
The energy scores within the attention mechanism are computed using a compatibility function. This function serves the purpose of comparing two tensors: a key and a query, to produce similarity values, which are expressed as energy scores [23]:
here, , , , and are trainable parameters. The purpose is to capture the similarity between the key, which in our case is the output of the GRU, , and a query. This query is ideally a value related to the sample to predict , so in our case we used the component of .
One crucial aspect of attention mechanisms is the distribution that maps energy scores to attention weights. This distribution is calculated over the scores using a softmax function, resulting in the calculation of the attention weights as:
Finally, a context vector is generated, which is a linear combination of the components of . The context vector captures the relevant information required for the task at hand and is calculated as:
The fundamental concept behind attention mechanisms is to enhance the model’s learning process by identifying where to focus and extract meaningful information, this information being encoded in the context vector . By doing so, the model can concentrate on the pertinent parts of the input while disregarding noisy or irrelevant data.
The final component of the proposed architecture focuses on predicting future demand values and estimating the associated probability distribution. In this study, the time series distribution, , is modeled as a Gaussian distribution. It is worth noting that alternative distributions could also be considered. To train the network architecture, our objective is to approximate the time series distribution using the alternative proxy , where and represent the mean and variance, respectively, of the normal distribution. The proposed network architecture accomplishes this by placing the distribution parameters in a scheme similar to [24]. The mean parameter, , is obtained through a dense layer. Since it is assumed that the demand is positive in this case, a Rectified Linear Unit (ReLU) activation function is employed as follows:
where is a matrix of weights of the dense output layer and is the output of a previous dense layer (Figure 2). Similarly, the standard deviation is approximated by another dense layer with ReLU activation, as in:
where is a matrix of weights of the dense output layer; note that it uses the same input as in the -layer. Both layers are supplied with input from dense layers, which are, in turn, fed by the attention block described earlier. Finally, the prediction output, , corresponding to the next demand value, is calculated as the mean of the estimated distribution. If the mean has a decimal value, it is rounded to the nearest integer. In the following, we describe the Newsvendor inventory model and explain how the integration will be with the proposed deep learning architecture.
3.2. DL Architecture Integration with the Newsvendor Model
The objective function of the Newsvendor model, which involves a one-period order quantity y under demand D, can be represented as the expected cost described in Equation (12),
The components of this equation include: the expectation operator, the total cost, the penalty cost per shortage unit during the period, the holding cost per unit in the period, and the pdf of the demand. It is worth noting that there are other extensions and equivalent forms for Equation (12). In this context, we operate under the assumption that demand occurs immediately at the beginning of the period and that there are no associated setup costs.
In Section 3.1 of our development, we obtained a robust forecasting method to model the demand trend using an attention mechanism. Furthermore, we derived a proxy probability distribution Q to estimate the demand distribution. This distribution was tailored to match the statistical properties of the available demand data, and its approximation was achieved with a Multi-Layer Perceptron (MLP). By integrating this distribution into the Newsvendor model, we can derive a concise expression for the solution of the model.
In this work, we proposed to model the demand distribution, by the proposed deep learning architecture, that is,
where c contains information about the demand extracted from the GRU and the attention mechanism.
The distribution of the demand, of the proposed model is given as
where the density in (12) is replaced by probability distribution Q in (13).
The optimal value, denoted as , which maximizes the expected profit, is now the critical fractile in , and is given by
where is the cumulative distribution function corresponding to Q, with denoting its inverse. In this way we expect to endow the model with the ability to look for possible trends in the demand, thus obtaining a more accurate model in the estimation of y.
3.3. Design and Integration of Fog Computing
In this section, we present the design of our proposed system, based on fog computing. We also detail on the integration process of the Newsvendor inventory model and our proposed deep learning architecture into the system’s modules, describing their interactions with other components of the fog node. The diagram in Figure 3 illustrates the proposed fog node along with the entire fog computing system. This fog node has the versatility to serve both manufacturers and retailers; its primary responsibility involves seamlessly incorporating demand data into various levels of supply chain operation, working in collaboration with the cloud. In addition, the fog node is equipped to react to trends changes and provide insight for tasks such as design, manufacturing, and product delivery. This responsiveness is achieved by enabling direct and rapid communication between the fog node and the manufacturing locations. This communication setup establishes a flexible pathway between production and management, facilitating the implementation of last-minute changes on production lines. Next, a more detailed breakdown of the constituent stages of the proposed fog computing-based system is presented.
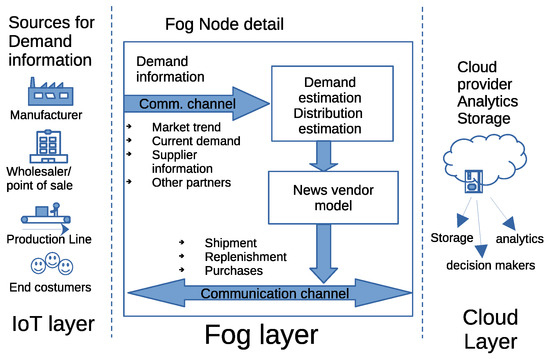
Figure 3.
Structure of the proposed system based on fog computing.
The IoT layer comprises communication devices utilized by information providers. These sources include a variety of entities, such as manufacturing sites, wholesalers, point-of-sale centers, and end-customers. The tools that facilitate communication between the fog node and these information sources include various devices. For example, mobile phones serve as communication tools for end customers, RF tags are used on production lines, and inventory and product orders are managed through systems employed in industries and point-of-sale centers.
The fog layer contains fog nodes, each equipped with communication channels to accommodate various sources of information. Consequently, fog nodes have the ability to transmit data using various protocols, such as Wi-Fi, Bluetooth, Zigbee, Z-Wave, and RFID. This facilitates the acquisition of relevant data required for demand estimation, including factors such as market trends, ongoing demand, supplier status, and insight from other partners. In this study’s simulations, we focused exclusively on the Wi-Fi protocol. This protocol is compatible with most personal computers and is integrated in the packaging of many popular microcontrollers. The acquired information is then channeled into a machine learning module (MLM) composed of a GRU (Gated Recurrent Unit) and an attention mechanism. The MLM produces an estimate of the demand and its distribution. Following this, the Newsvendor model is used to determine optimal inventory levels. These newly derived insights are subsequently relayed to both the IoT and cloud layers for further processing and decision-making purposes.
Finally, the cloud layer, the framework within the cloud computing layer, presents a scalable method for the system to efficiently oversee different aspects related to shipping, restocking, and acquisitions. Furthermore, the cloud layer includes functions such as the allocation of storage for devices, setting up security protocols, performing data analysis, and handling specific processing tasks. Furthermore, by extending the availability of ample computing prowess and large storage capacities, this layer empowers IoT devices to take advantage of considerable computational potential.
4. Results
In this section, we present the results of various tests conducted to assess the effectiveness of various aspects of the proposed system. We compared the results achieved by the proposed method in this context with those obtained by assuming a uniform distribution and estimating its mean and variance based on historical data. We call this approach Historic Estimation Method (HEM) [25], additionally we compared with the best method of [26], in this case using Extreme Learning Machines (ELM).
Module for Demand Estimation
The DL model within this module was evaluated using simulated data. To replicate the demand, we adopted a Brownian motion model as described in [27]. For the simulation process, the Brownian motion parameters were configured as follows: a volatility of 0.25 and a drift set at 0.1. The DL model was trained using 2400 data samples, employing mean square error as the loss function, with five percent of this data reserved for validation purposes. The training optimization method used was adaptive moments (adam).
Figure 4a illustrates the performance curves as the number of epochs increases. Meanwhile, in Figure 4b, we provide a closer view of the curve focusing on epochs. This allows for a clearer visualization of the point at which the model achieves the lowest loss, which occurs at approximately epoch 60.
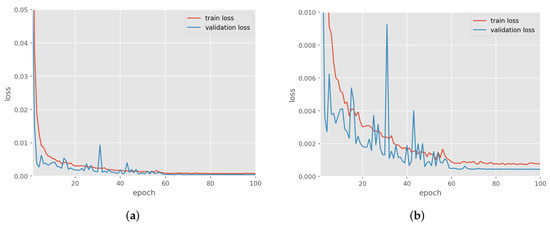
Figure 4.
(a) Loss decaying curve during training phase, (b) a zoom of the loss decaying curve during training phase.
In Figure 5, the curve representing the simulated demand for periods 20–100, as well as the estimates generated by the HEM, ELM and our proposed method, can be observed. These curves highlight that the proposed method is closely aligned with the actual demand curve compared to the HEM and ELM methods.
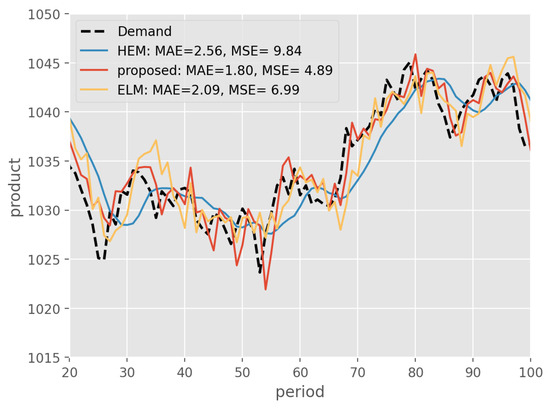
Figure 5.
Performance for demand estimation, in this case the demand follows a Brownian motion. Performance is measured using Mean Absolute Error (MAE) and Mean Squared Error (MSE).
In Figure 6, scatter plots are displayed to visually assess the performance of the different methods in demand estimation. Specifically, Figure 6a–c depict the different methods individually, while Figure 6c presents both the HEM and the ELM methods simultaneously against the proposed method. It is evident that the proposed method exhibits a stronger positive correlation between observed demand values and predicted values compared to the HEM and ELM methods.
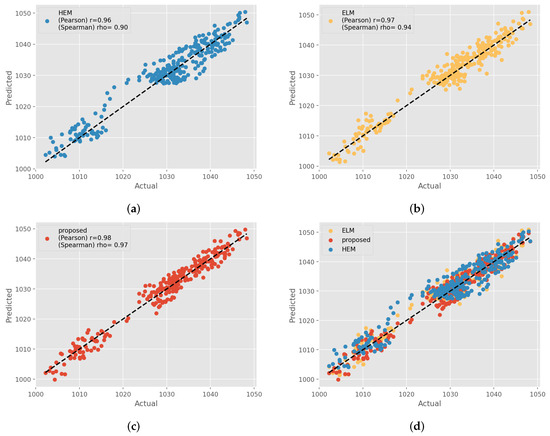
Figure 6.
(a) scatter plot of real demand versus HEM prediction, (b) scatter plot of real demand versus ELM method, (c) scatter plot of real demand versus proposed method, and (d) comparison of scatter plots.
Now, the results of a specific demand scenario are presented to assess the corresponding inventory levels. In this particular scenario, the evaluations are carried out over 20 periods; the results are shown in Figure 7. The figure illustrates that, when considering the proposed model, the quantity of inventory exhibits fewer instances of excessive surplus and fewer instances of being out of stock compared to the HEM and ELM methods.
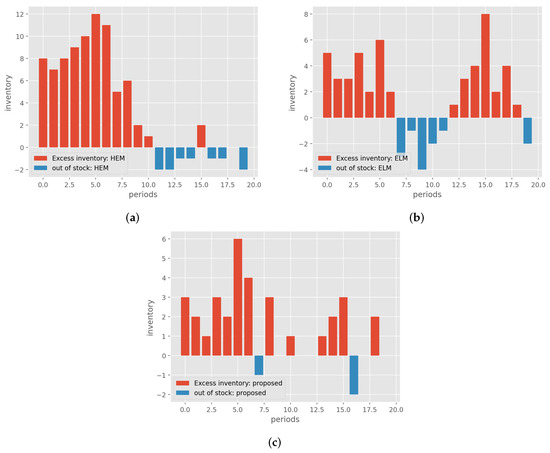
Figure 7.
Excess inventory and out of stock of (a) HEM, (b) ELM, and (c) proposed.
Figure 7a shows the excess inventory for the HEM method, demonstrating that it consistently has more surplus inventory than the proposed method during the same periods, as indicated in Figure 7c. The same happens with the ELM method, as seen in Figure 7b, having more surplus inventory than the proposed method. All methods exhibit a peak in excess inventory around the fifth period, with the HEM method’s peak being notably higher, approximately double that of the ELM and proposed method. Regarding instances of being out of stock, the ELM present up to four units of inventory shortage. The HEM and proposed methods rarely exceed two units of inventory shortage, but the HEM method experiences more such instances than the proposed method.
For a summary of inventory behavior across all methods, refer to Figure 8. The box plot provides a general overview, revealing that, on average, the proposed method saves 1.5 units of inventory compared to the HEM method and 0.3 units with respect to ELM. However, HEM and ELM present higher variance with respect to the proposed method.
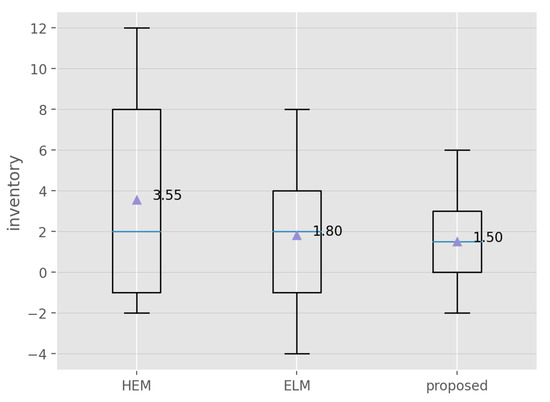
Figure 8.
Box plots of the inventory behavior with the different methods.
5. Discussion
While the proposed study presents a system aimed at enhancing inventory efficiency, it is essential to recognize the potential limitations inherent in the research, for example, the quality and quantity of data, since the effectiveness of the proposed DL architecture is heavily based on the quality and quantity of the data used for training. Limitations in the availability or quality of historical inventory and demand data could impact the accuracy of predictions. Furthermore, since the complexity and interpretability of the model are inherent in all DL models, this could present challenges in understanding and explaining the decision-making process to stakeholders, which can hinder adoption and implementation. And finally, while fog computing offers benefits such as real-time data processing and reduced latency, its implementation may require significant infrastructure investment and technical expertise. Limitations in the availability or reliability of fog computing infrastructure could affect the system’s performance and scalability. However, we believe that the proposed system for efficient inventory management still offers several potential contributions: Such as an enhanced accuracy in demand prediction, the incorporation of an attention mechanism within the proposed architecture provides improved accuracy in demand prediction, as was assessed in the results. Furthermore, by combining machine learning techniques with the Newsvendor inventory model, the proposed system offers a more comprehensive approach to inventory management compared to works using prediction only, such as [28]. Although machine learning algorithms excel at capturing complex patterns in data, the Newsvendor model provides a well-established framework for optimizing inventory levels under uncertainty. Additionally, Real-Time Decision-Making with fog Computing enables rapid dissemination of information and facilitates improve decision-making throughout the company. Compared to centralized cloud computing approaches, such as [13], fog computing reduces latency and enhances responsiveness by processing data closer to the source. This capability is particularly advantageous in dynamic inventory management scenarios where timely information dissemination is crucial to effective decision making.
6. Conclusions
In this study, we have introduced a comprehensive inventory management system that harnesses the power of cloud computing while seamlessly integrating a deep learning architecture and the Newsvendor model.
Our novel deep learning architecture is based on the attention mechanism for better demand prediction. Through rigorous experimentation involving a simulated demand scenario, we have observed that our approach closely tracks the actual demand curve, demonstrating its superior accuracy compared to alternative methods.
Furthermore, we have assessed the integration of this deep learning architecture with the Newsvendor model. The results of these experiments highlight the remarkable benefits of this combination. Specifically, our approach substantially reduces instances of excessive surplus and out-of-stock situations.
The implications of adopting our method to determine the level of inventory are substantial within the industrial landscape. First, it offers enhanced flexibility in monitoring inventory control systems due to its predictive capabilities. This results in better short-term and medium-term projections, subsequently leading to reductions in both inventory quantities and associated storage costs. Furthermore, our use of fog computing facilitates the rapid dissemination of demand-related information across the entire company with minimal latency.
In future work, research is planned to simulate other demand modeling processes to accommodate simulation with various products.
Author Contributions
Conceptualization, J.-M.M.-M., and L.A.S.; methodology, J.G., J.-M.M.-M., G.B., and O.C.-M.; software, J.-M.M.-M., G.B.; validation, J.G., and L.A.S.; Investigation, J.G., J.-M.M.-M., L.A.S., and O.C.-M.; data curation, J.-M.M.-M.; writing—original draft preparation, J.G., and J.-M.M.-M.; writing—review and editing, G.B., L.A.S., and O.C.-M.; supervision, J.-M.M.-M.; All authors have read and agreed to the published version of the manuscript.
Funding
This research received no external funding.
Data Availability Statement
The data used in this work was simulated by the authors by adopting a Brownian motion model as outlined in [27].
Acknowledgments
The authors would like to express their appreciation to the UACJ and the Doctorado en Ciencias de la Ingenieria Avanzada program for their great support and contributions to this research. This work was made possible through the support provided by both entities and the guidance of DOCIA staff. Their commitment and Conahcyt’s support to ongoing academic improvement and research have enriched this project. This work was partially supported by UNAM-PAPIIT IN303523. We declare the use of AI, ChatGPT and Writefull, for grammar and spelling review. The methodology, analyzes, originality, validity, and integrity were carried out exclusively by the authors. No AI was used for such a purpose.
Conflicts of Interest
The authors declare no conflicts of interest.
Abbreviations
The following abbreviations are used in this manuscript:
| IoT | Internet of Things |
| IIoT | Industrial Internet of Things |
| RNN | Recurrent Neural Network |
| GRU | Gated Recurrent Unit |
| DL | Deep Learning |
| HEM | Historic Estimation Method |
| conv1D | Bank of convolutional layers |
| MAE | Mean Absolute Error |
| MSE | Mean Squared Error |
References
- Jacobs, F.R.; Chase, R.B.; Lummus, R.R. Operations and Supply Chain Management; McGraw-Hill/Irwin: New York, NY, USA, 2014. [Google Scholar]
- Oroojlooyjadid, A.; Snyder, L.V.; Takáč, M. Applying deep learning to the newsvendor problem. IISE Trans. 2020, 52, 444–463. [Google Scholar] [CrossRef]
- Zhang, Y.; Gao, J. Assessing the performance of deep learning algorithms for newsvendor problem. In Proceedings of the Neural Information Processing: 24th International Conference, ICONIP 2017, Guangzhou, China, 14–18 November 2017; Proceedings, Part I 24. Springer: Berlin/Heidelberg, Germany, 2017; pp. 912–921. [Google Scholar]
- Ban, G.Y.; Rudin, C. The big data newsvendor: Practical insights from machine learning. Oper. Res. 2019, 67, 90–108. [Google Scholar] [CrossRef]
- Neghab, D.P.; Khayyati, S.; Karaesmen, F. An integrated data-driven method using deep learning for a newsvendor problem with unobservable features. Eur. J. Oper. Res. 2022, 302, 482–496. [Google Scholar] [CrossRef]
- Bahdanau, D.; Cho, K.; Bengio, Y. Neural machine translation by jointly learning to align and translate. arXiv 2014, arXiv:1409.0473. [Google Scholar]
- Cho, K.; Van Merriënboer, B.; Gulcehre, C.; Bahdanau, D.; Bougares, F.; Schwenk, H.; Bengio, Y. Learning phrase representations using RNN encoder-decoder for statistical machine translation. arXiv 2014, arXiv:1406.1078. [Google Scholar]
- Ghadge, A.; Er Kara, M.; Moradlou, H.; Goswami, M. The impact of Industry 4.0 implementation on supply chains. J. Manuf. Technol. Manag. 2020, 31, 669–686. [Google Scholar] [CrossRef]
- Aazam, M.; Zeadally, S.; Harras, K.A. Deploying fog computing in industrial internet of things and industry 4.0. IEEE Trans. Ind. Inform. 2018, 14, 4674–4682. [Google Scholar] [CrossRef]
- Verba, N.; Chao, K.M.; Lewandowski, J.; Shah, N.; James, A.; Tian, F. Modeling industry 4.0 based fog computing environments for application analysis and deployment. Future Gener. Comput. Syst. 2019, 91, 48–60. [Google Scholar] [CrossRef]
- Liu, Y.; Fieldsend, J.E.; Min, G. A framework of fog computing: Architecture, challenges, and optimization. IEEE Access 2017, 5, 25445–25454. [Google Scholar] [CrossRef]
- Sabireen, H.; Neelanarayanan, V. A review on fog computing: Architecture, fog with IoT, algorithms and research challenges. Ict Express 2021, 7, 162–176. [Google Scholar]
- Dogani, J.; Khunjush, F.; Mahmoudi, M.R.; Seydali, M. Multivariate workload and resource prediction in cloud computing using CNN and GRU by attention mechanism. J. Supercomput. 2023, 79, 3437–3470. [Google Scholar] [CrossRef]
- Eslamipoor, R. A Biobjective Model for Integrated Inventory and Transportation at Tactical and Operational Levels with Green Constraints. IEEE Trans. Eng. Manag. 2023; in press. [Google Scholar] [CrossRef]
- Eslamipoor, R. Direct and indirect emissions: A bi-objective model for hybrid vehicle routing problem. J. Bus. Econ. 2024, 94, 413–436. [Google Scholar] [CrossRef]
- Javeed, D.; Gao, T.; Saeed, M.S.; Khan, M.T. FOG-empowered Augmented Intelligence-based Proactive Defensive Mechanism for IoT-enabled Smart Industries. IEEE Internet Things J. 2023, 10, 18599–18608. [Google Scholar] [CrossRef]
- Chalapathi, G.S.S.; Chamola, V.; Vaish, A.; Buyya, R. Industrial internet of things (iiot) applications of edge and fog computing: A review and future directions. In Fog/Edge Computing for Security, Privacy, and Applications; Springer: Cham, Switzerland, 2021; pp. 293–325. [Google Scholar]
- Qi, Q.; Tao, F. A smart manufacturing service system based on edge computing, fog computing, and cloud computing. IEEE Access 2019, 7, 86769–86777. [Google Scholar] [CrossRef]
- Rani, S.; Kataria, A.; Chauhan, M. Fog computing in industry 4.0: Applications and challenges—A research roadmap. In Energy Conservation Solutions for Fog-Edge Computing Paradigms; Springer: Berlin/Heidelberg, Germany, 2022; pp. 173–190. [Google Scholar]
- Bachiega Jr, J.; Costa, B.; Araujo, A.P. Computational perspective of the fog node. arXiv 2022, arXiv:2203.07425. [Google Scholar]
- Coulouris, G.F.; Dollimore, J.; Kindberg, T. Distributed Systems: Concepts and Design; Pearson Education: London, UK, 2005. [Google Scholar]
- Chung, J.; Gulcehre, C.; Cho, K.; Bengio, Y. Empirical evaluation of gated recurrent neural networks on sequence modeling. arXiv 2014, arXiv:1412.3555. [Google Scholar]
- Galassi, A.; Lippi, M.; Torroni, P. Attention in natural language processing. IEEE Trans. Neural Netw. Learn. Syst. 2020, 32, 4291–4308. [Google Scholar] [CrossRef]
- Salinas, D.; Flunkert, V.; Gasthaus, J.; Januschowski, T. DeepAR: Probabilistic forecasting with autoregressive recurrent networks. Int. J. Forecast. 2020, 36, 1181–1191. [Google Scholar] [CrossRef]
- Taha, H.A. Operations Research: An Introduction; Pearson Education India: London, UK, 2013. [Google Scholar]
- Zohdi, M.; Rafiee, M.; Kayvanfar, V.; Salamiraad, A. Demand forecasting based machine learning algorithms on customer information: An applied approach. Int. J. Inf. Technol. 2022, 14, 1937–1947. [Google Scholar] [CrossRef]
- Vickson, R.G. A single product cycling problem under Brownian motion demand. Manag. Sci. 1986, 32, 1336–1345. [Google Scholar] [CrossRef]
- Wang, J.; Chong, W.K.; Lin, J.; Hedenstierna, C.P.T. Retail Demand Forecasting Using Spatial-Temporal Gradient Boosting Methods. J. Comput. Inf. Syst. 2023, 1–13. [Google Scholar] [CrossRef]
Disclaimer/Publisher’s Note: The statements, opinions and data contained in all publications are solely those of the individual author(s) and contributor(s) and not of MDPI and/or the editor(s). MDPI and/or the editor(s) disclaim responsibility for any injury to people or property resulting from any ideas, methods, instructions or products referred to in the content. |
© 2024 by the authors. Licensee MDPI, Basel, Switzerland. This article is an open access article distributed under the terms and conditions of the Creative Commons Attribution (CC BY) license (https://creativecommons.org/licenses/by/4.0/).