Abstract
Background: The ongoing technical innovation is fully involving transportation sector, converting the usual mass-transit system toward a sustainable mobility. Make-or-buy decision are usually adopted to assess different solutions in terms of costs-benefits to put in place strategic choices regarding in-house production or from an external supplier. This can also be reflected on maintenance operations, thus replicating a similar approach to transport companies involved. Method: A decision-making model by means of a multi-criteria analysis can lead make-or-buy choices adapted to maintenance. A brief introduction into the actual mobility context is provided, evaluating global and national trends with respect to the mobility solutions offered. Then, a focus is set on maintenance approaches in mobility sector and the need of a make-or-buy decision process is considered. The decision-making path is developed through a multi-criteria framework based on eigenvector weighing assessment, where different Key Performance Indicators (KPIs) are identified and exploited to assess the maintenance approach at stake. Results: A comparison among different scenarios considered helped in identify the solution offered to the transport operator. In particular, for the case study of interest a −35% decrease in maintenance specific cost and −44% in cost variability were found. Reliability of the fleet was kept at an acceptable level compared to the reference in-house maintenance (≥90%) while an increase in the Mean Time Between Failure was observed. Conclusions: For the purposes of a small company, the method can address the choice of outsourcing maintenance as the best. Finally, a general trend is then extrapolated from the analysis performed, in order to constitute a decision guideline. The research can benefit from further analysis to test and validate that the selected approach is effective from the perspective of transport operator.
1. Introduction
The transportation sector is undergoing a deep renewal thanks to technical innovation, environmental policies and the development of sustainable solutions. The advent of new players on the market, together with the effects of pandemic led to redefine mobility [1]. Smart mobility must be intended as both individual and collective transportation system. Public transport is being reshaped in a people-oriented perspective, providing a customer-centered service starting from design, management and decision-making phases. Public transport is also creating personalized mobility services through data-driven transport solutions mediated by the application of Artificial Intelligence (AI). This is reached through offering new solutions, such as Mobility as a Service (MaaS) or on-demand ride-sharing services as valuable examples. In such an active context, Transport Operators (TOs) play a very important role, which goes beyond the usual realization of public transport governance and extends to the regulation and management of the entire urban system. While mass public transport will still act as a backbone around which sustainable mobility solutions will flourish, the variety of complementary solutions is enhancing the complexity of passenger transport market.
As a consequence, enormous changes were reflected also in mobility sector. TOs need to develop helpful strategies to adequately respond to unforeseen setbacks. General trends are influenced by three main causes:
- Global—growth in passenger demand, socioeconomic inequality, transformation of urban topology.
- Behavioral—flexible work/smart-working, travel safety, re-organization of travel patterns.
- Technology and Market—spread of e-commerce, digital process, integrated micro-mobility, market share for private companies.
The European Green Deal approved in 2020 collects efforts by the European Commission to reach carbon neutrality of EU in 2050, with −50% reduction in Green-House Gases (GHG) until 2030. According to recent evaluations, the transportation sector is the principal emitter of [2]. Figure 1 depicts the partition of GHG emissions for each transportation system. A comprehensive strategy for a sustainable and smart mobility must be implemented to increase the adoption of sustainable and alternative fuels in road, maritime and air transport and set the emission standards for combustion-engine vehicles [3].
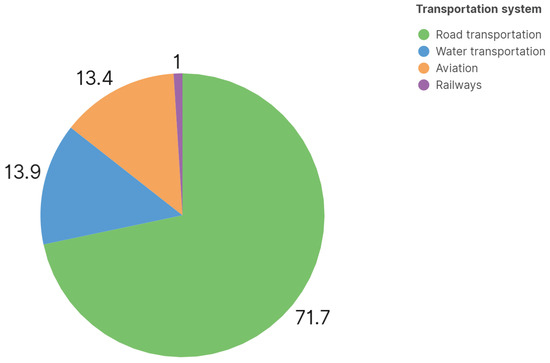
Figure 1.
Overall emissions for transportation.
The pandemic represented a re-defining moment for mobility in metropolitan areas, highlighting the importance of health, environment as well as travel speed, convenience and consumption. Despite that, moving the sight to rural areas, mobility is commonly perceived as a problem, since network is not extended. Few available connections to large cities force local citizens to use private vehicles. In addition, the public transport sector is also experiencing shortage of personnel. In a future perspective, public transportation should replace the today’s use of private cars and carefully consider exploiting service in surrounding areas. This switch requires strong changes that must be adopted in parallel not only in citizens habits and mindset but also in the overall organizational system. Within this framework, the public transportation can potentially play a trailer role to realize these changes. In this context, maintenance is a crucial aspect for TOs as it contributes to achieve the targets set [4]. In fact, maintenance processes can significantly impact on the system conditions, such as availability and accessibility and safety for the customers [5]. Optimal maintenance contributes to increase service quality standards, while technological innovations enable a more efficient management of maintenance resources, both economic and environmental.
In the present paper, the development of a multi-criteria framework applied to maintenance processes is proposed. The scope of the presented analysis is to improve the decision quality by adequately supporting the choice through exploring and comparing a set of incompatible alternatives aiming to increase the quality and convenience of maintenance operations. Different methods retrieved within literature are presented in Section 2 while maintenance approaches are recalled in Section 3, followed by the presentation of the actual maintenance practices currently diffused in the public transportation context. The methodology is then provided in Section 4, where all Key Performance Indicators (KPIs) are identified. Results are then presented and critically discussed in Section 5 to be eligible for a feasible implementation in a real environment. As a final step, a generalization is extrapolated starting from the results obtained, aimed to provide a synthetic guideline for TOs.
2. Literature Review
Decision-making models are focused within the literature as valuable methods to assist decision-makers in choosing the suitable approach or scheme to be adopted. In particular, the problem is addressed to handle with risk assessment, maintenance strategy and time interval of inspection. A proper method is proposed to realize Selective Maintenance Problem (SPM) or Selective Parallel Maintenance Sequence Planning (SPMSP) through a multi-objective optimization algorithm to establish the optimal maintenance sequence for multi-state systems [6,7]. For each scenario, parameters—i.e., workers skills or initial budget—are forced to vary in order to evaluate the best alternative in terms of reliability. The technique here adopted is based on a sensitivity analysis, being thus able to find the best trade-off between component costs, repair duration and labor costs to ensure the highest reliability [7]. Also, Monte-Carlo Simulations can be applied to assess the resilience of maintenance under variable loading conditions [8]. A step-by-step calculation are performed to assess the reliability of the system or failures. This is applied evaluating case studies between no maintenance and all components are maintained. The mean system reliability increases as the budget increases, but these improvements do not vary at the same rate as the budget increments. Absolute values are difficult to be dealing with, a sensitivity analysis can help maintenance managers consider the trade-off between the system reliability improvement and maintenance budget spending. Hybrid approaches can be adopted to correctly consider quantitative and qualitative criteria [9,10]. In a Delphi methodology, a panel of experts is chosen and a first-attempt survey is answered regarding qualitative criteria. The second step analyses the results and provides a second-attempt questionnaire, adjusted on the basis of the previous. This iterative process is stopped when a general consensus is achieved among the experts. This method joins a proper Multi-Criteria Decision Making (MCDM) method such as Analytical Hierarchy Process (AHP) or Preference Ranking Organization Method for Enrichment Evaluation (PROMETHEE). In this case, the target is to establish the best maintenance approach among a predefined set of alternatives. A cooperation between Bayesian approach and PROMETHEE is evaluated dealing with a “replacement-time” problem. The best-fitting intervention timing and repair frequency for components is established according to three criteria [11]. The context is related to a decision problem for a general company involved in maintenance operations; the output results make the intervention frequency vary with a different span according to the dominant criterion weighted. Relevant KPIs defined are in common among the different papers considered such as maintenance costs and time. However, to prompt out a generalized framework to assist a TO in the most effective and convenient decision, a sensitivity analysis is required to analyze the impact on the set of criteria produced by a variation in the relative weight of a single criterion.
Problems related to a decision-making can be divided as follows:
- Multi-Criteria problem (MCDM), the preferred solution is selected within an initial set of predefined alternatives.
- Multi-Objective problem (MODM), exploited to identify the best solution through an optimization method during a design process.
Methods for MCDM can be categorized according to the following distinction:
- Weighting assessment, which includes eigenvectors, weighted least square and entropy methods, all based on a pairwise comparison matrix as recalled in (1) where are the relative importance coefficients and the number of criteria. Weights can be calculated according to a normalized eigenvector (2), through minimizing a Lagrangian function (3) or evaluating an entropy level vector , whose values are evaluated according to (4) [12,13,14,15,16,17].
- Unique criterion methods, most diffused are Analytical Hierarchy Problem (AHP) and Analytical Network Problem (ANP), where the problem is modeled according to a two level hierarchical disposition or to a network respectively. The latter results as a generalization of the former alternative, turning into an origin-destination paths [18,19,20].
- Outranking methods are able to evaluate existing preferences or incompatibilities between alternatives through pairwise comparisons. If the set of features considered provides enough elements to state that an alternative a is at least as good as b, therefore “a is outranking b”. Most diffused methods are Preference Ranking Organization Method for Enrichment Evaluation (PROMETHEE) [21], based on feature comparison or ELimination Et Choix Traduisant la REalité (ELECTREE), which operates a sorting of the alternatives based on outranking relationships [22].
3. Case Study
A make-or-buy decision framework addresses relevant aspects to set up a strategic choice between in-house production or outsourcing purchase from an external supplier [4,23]. It is a strategic decision when a company faces low production capacity, limited experience, lack of expertise or variable demand [5,24]. This allows to compare all costs and benefits resulting from the two (or more) alternatives. Table 1 collects the main indicators that contribute to evaluate the best-fitting strategy for the company to adopt.

Table 1.
Characteristics of make-or-buy approaches.
Usually, the choice to convert an in-house production into an outsourcing purchase is driven by [25]:
- reduction of overall costs and capital investments,
- increase of competitive advantage.
This decision is based on the core business of the company itself and production costs and quality can lead to outsourcing [26]. The whole framework contributes to reduce risk exposure of the company [27]. The role of know-how is crucial for a company [28]. The level of expertise can be classified into:
- key (or core), related to the main business of the company and contributing to gain competitiveness;
- lateral, developed for critical processes but not linked to the competitive advantage, and potentially useful to start new businesses;
- special, necessary but available externally.
Thus, in-house manufacturing fits better based on key and lateral levels of expertise, while outsourcing is preferred for special levels required [29]. A similar approach can be adopted by TOs as extended also to maintenance for vehicle fleet [30].
A general scheme for classification of maintenance approaches is reported in Figure 2. Maintenance embraces all functional inspections to establish the necessity to repair or replace a component. For TOs, this is important to maintain or restore the functional condition to reach the highest grades of safety, reliability, regulatory compliance and warranty coverage for the running vehicles, thus extending the useful life of the equipment minimizing downtime and costs [31]. Maintenance approaches can be classified as:
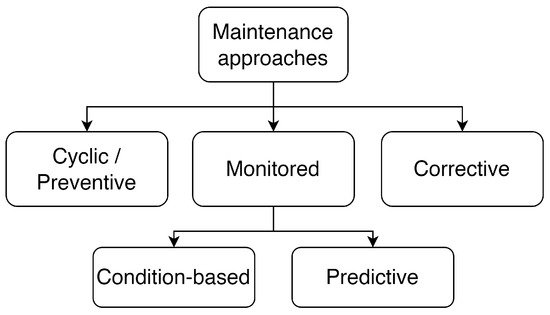
Figure 2.
Maintenance models.
- Cyclic (or preventive), aimed to maintain the functionality of the component and includes a-priori all operations that must be performed in a given age or time horizon.
- Corrective, which includes all operations needed as a consequence of a malfunction.
- Monitored, based on measurement activities and data collection and analysis, subdivided into:
- -
- Condition-based, where a continuous monitoring is performed to detect unacceptable working conditions.
- -
- Predictive-based, where the analysis of periodic measurement data through mathematical models is capable to estimate the expected wear for a given component or system.
Differences between the previously recalled approaches are collected hereafter in Table 2.

Table 2.
Comparison between maintenance approaches.
A decision framework similar to manufacturing activities but regarding maintenance can be described according to the following distinction and recalled in Figure 3:
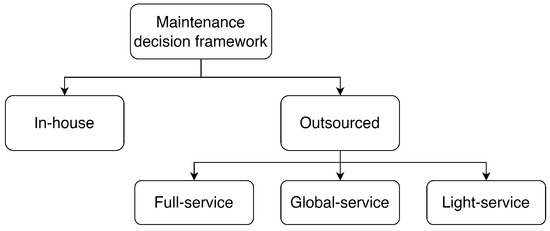
Figure 3.
Maintenance decision framework.
- In-house maintenance;
- Outsourced maintenance, based on an agreement between the supplier and TO to provide a set of predefined activities at a fixed price [32]. In particular, it is divided into:
- -
- Global-service, includes all maintenance activities [33].
- -
- Full-service, includes the main maintenance activities, excluding tyres and technology maintenance.
- -
- Light-service, it excludes the replacement of highly-expensive components, both in terms of cost and time needed for the process.
- -
- Package service, usually involves scheduled maintenance activities for frequently-consumable components.
Generally, an outsourced maintenance involves a series of activities provided by the vehicle manufacturer to the TO within a given time period, as established during the purchase phase. The agreement establishes a maintenance fee—usually expressed in €/km—for a specific duration. From the TO’s point of view, this solution enables to:
- first to provide cost planning, avoiding volatile repair costs;
- secondly, benefit from original spare parts, thus ensuring maximum reliability.
On the other hand, the manufacturer aims to obtain the highest possible profit from the maintenance service provided and sold [34]. However, the cost estimation does not solely depend on the market, but it is extrapolated from the vehicle life cycle. Outsourcing maintenance acts therefore to prevent any possible unforeseen risk the vehicle may experience at a competitive cost and through highly specialist maintenance operators, thus ensuring a higher reliability, safety and economic value of the vehicle [35].
4. Methodology
In this section, the rationale and the overall strategy of the methodology are presented. The decision-making path is set up through a multi-criteria approach to provide make-or-buy evaluations for maintenance process of a bus fleet. This consists of defining relevant KPIs to address the topic. Based on the classification of methods and the literature background analyzed in Section 2 regarding the subject, an eigenvector-based weighing assessment is chosen to investigate the most convenient maintenance approach to be adopted. In particular, this must be reflected in providing to TOs a valuable short-coming decision whether allocating maintenance internally or outsourcing it. Table 3 reports the average score meaning [19]. A flowchart to briefly illustrate the process is also provided in Figure 4.

Table 3.
Scoring scale.
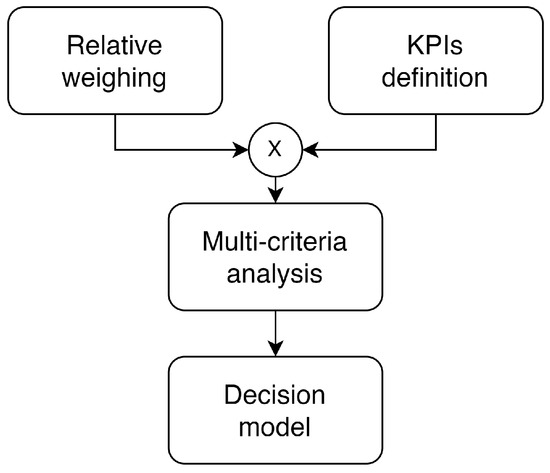
Figure 4.
Methodological approach for make-or-buy maintenance choice.
The identification of both technical and managerial KPIs is fundamental to set up a decision-making model [36]. This helps to compare and evaluate both maintenance solutions—i.e., full-service and in-house. KPIs include all those metrics needed to monitor the performance of a given activity within a given business sector. There is not a unique framework to define performances for every company. Therefore, a specific analysis must be performed carefully to identify all parameters providing the correct indications on directions and results achieved by each strategy [37,38]. A generic KPI must be:
- Measurable (i.e., repeatable and reproducible), allowing comparisons over time and different contexts.
- Specific, related to a particular aspect.
- Relevant, the information provided must be useful to the evaluation process.
To guarantee the deepest framework to be exploited by the decision-making, KPIs can be:
- quantitative, can be numerical and/or statistics,
- qualitative, can be verbal.
Quantitative indicators allow assumptions to be tested through the systematic data collection and analysis, while qualitative allow ideas, remarks and return of experiences to be considered in depth. All KPIs were calculated through historical data referred to 2022, in order to have a deep sight of the company’s situation. In fact, the choice was made by trying to combine the analytical approach, which is based on the pure calculation of indicators, with the empirical one, which aims to best highlight how the solution adopted influences the business environment. KPIs were identified to encompass all areas involved in maintenance processes by TO, from economic to service aspect, like evaluation of operational aspects and the quality of maintenance activities. Particular care was set to endorse this last aspect, in order to increase the customer satisfaction, an indicator that can rapidly change in the perceived service quality by the passengers.
As far as quantitative KPIs, the following indicators were identified:
- Maintenance costs ,
- Cost variability ,
- Availability rate A,
- Mean Time Between Failure (MTBF).
Maintenance cost is defined according to the analytical expression reported in (5). It depends on the total maintenance cost sustained by the company for spare parts , working operators and if needed outsourced operations . The total economic amount is put in relationship with the average distance traveled by the fleet .
Cost variability is calculated as the standard deviation of . The objective of this KPI is to highlight the costs distribution and unpredictability, distinguishing between internal and external maintenance costs as shown in (6). Only the absolute value of the standard deviation is considered. This indicator quantifies the deviation of maintenance costs from the expected value .
Availability rate A is one of the main and most important KPIs for evaluating the actual configuration. This parameter determines the level and quality of the transportation service provided. The availability rate of a vehicle is therefore calculated according to (7) as the rate between the available days and the total working/service days considered within the timespan. Only the days in which the vehicle is out of service for ordinary and extraordinary maintenance are taken into account—i.e., both when maintenance is scheduled and corrective. This allows to observe whether there are differences in the level of availability between the two maintenance solutions. In fact, this indicator helps to determine the quality of the work performed: generally the level of maintenance quality decreases, as the number of unserviceable days increases. Consequently, a higher availability rate corresponds to higher quality maintenance.
The last quantitative indicator is represented by the Mean Time Between Failures (MTBF); this KPI is able to evaluate the expected usage between two subsequent failures of a system during normal service. Therefore, it is computed as the average distance before a failure occur as reported in (8). This definition depends on what is considered as a fault. In this analysis, a failure is meant as any maintenance intervention, whether planned or corrective. The MTBF accounts for the number of failures occurred in the considered usage range.
Both A and MTBF carry an important remark on the quality of maintenance performed. The important distinction between the two indicators is that A is evaluated on a temporal basis, while MTBF is related to a distance-based evaluation. The output of these last parameters vary based on the vehicle model, age and the total number of kilometers. As a general consideration, an outdated vehicle shows lower values for A and MTBF than a younger vehicle.
For what concerns qualitative KPIs, the following are considered in this present work:
- Flexibility,
- Readiness,
- Assets,
- Control and monitoring.
By definition, qualitative KPIs do not provide a specific numerical value as output, but rather a qualitative judgment that attempts to reflect the meaning. These KPIs are usually implemented when dealing with a Multi-criteria decision problem, in particular for all characteristics of the problem that can not be modeled through an analytical relationship, thus a numerical meaning can be associated to a precise verbal definition or evaluation. In this present case, this kind of KPIs are considered to assess the solution proposed.
Flexibility is commonly intended as the ability to adapt/change within the business systems [39]. It is related to organizational structure and models of the company, being nowadays a fundamental aspect for the competitiveness of a company on the market. Two different flexibility types can be distinguished [39]:
- The state flexibility is the stability of the system to work despite changing operating conditions.
- The action flexibility is the ability of the system to react to changes, in particular moving from an operational state to another with short transients and low costs.
Readiness addresses the maturity of a technology, process or supplier at the instant of its selection. It can be evaluated according to a rating range from 1 to 9, from “basic principles observed and reported” to “actual system tested in an operational environment” [40,41,42,43]. Readiness is exploited to help in decision-making process concerning the technology transition and development. For what regards maintenance activities, the readiness depends on several factors, such as the organizational structure of a supplier or the company.
Assets are resource featured by economic value that an individual, a corporation, a company or a country owns or controls aimed to produce profits or benefit. An asset is everything that can generate cash flows, reduce expenses or improve sales in the future, regardless of whether it is a physical (an equipment, a building) or a non-physical item (a patent). Fixed assets have an expected life greater than one year, such as plants, equipment, and buildings and are fundamental to lead the decision between realizing in-house or outsourcing maintenance processes.
The last qualitative KPI to be considered is related to monitoring and control. The target is improving the efficiency and effectiveness of the performance through constantly providing all relevant information, hence to constitute a detailed picture of the activity. Monitoring and measurement of performance is probably the longest phase in the whole performance management cycle. In this wake, the purpose is to control the overall performance throughout the whole period between target setting and evaluation. From the company perspective, this phase is designed to support the achievement of corporate goals. Nevertheless, monitoring and measurement provides valuable inputs for any further development or adjustment of the activity.
In order to establish meaningful comparisons between a full-service and in-house maintenance solutions, a multi-criteria decision analysis is considered. The impacts of each alternative can be expressed numerically by both quantitative and qualitative expressions. To formulate a decision-making process, it is necessary to calculate the different KPIs evaluating several scenarios, which represent different business situations. In this context, 7 different real scenarios are evaluated, each featured by a different maintenance model, vehicle fleet, kilometers-per-vehicle traveled in one year, the average age and the year when the service started. Table 4 collects all information related to considered scenarios.

Table 4.
Scenarios for multi-criteria decision making process.
Within the scenarios adopting the full-service approach, vehicles with close mileages were taken into account. Deviation in this case is reduced, about 0.05 €/km. In details, all “young” vehicles falling within the first two years of a full-service contract where the mileage is an order of magnitude lower than in the other years, were excluded. First, the quantitative KPIs are computed. Then, a score is assigned to each KPI based on a threshold scale as reported in Table 3. Each score is then multiplied by a weighting coefficient, based on the importance of the indicator seen from the company’s perspective. On the other hand, for qualitative KPIs, the score is assigned based on the company’s experience and impact. Therefore, the total weighted average score is calculated for each scenario considered. Secondly, each qualitative KPI is accounted to evaluate the effectiveness of the solutions.
Thus, the final decision moves from the numerical evaluation of KPIs to assess the solution for maintenance. However, the decision model does not limit only to the ranking of the alternatives, but aims to comment or justify the results obtained, so to highlight the advantages and disadvantages of the two solutions.
5. Results and Discussion
As far as pure quantitative KPIs are concerned, Table 5 collects all threshold values set to assign a score to each alternative; Figure 5 depicts the general overview of the evaluation performed while for each KPI performances of scenarios are evaluated graphically in Figure 6, Figure 7, Figure 8 and Figure 9. The seven scenarios considered are described in details by Table 6.

Table 5.
Scoring and threshold for KPIs.
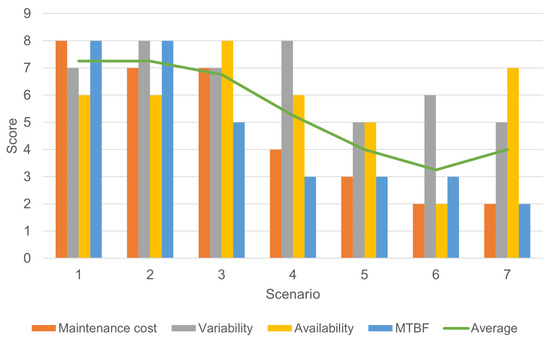
Figure 5.
Ranking of quantitative KPIs with 25% weighting coefficients.
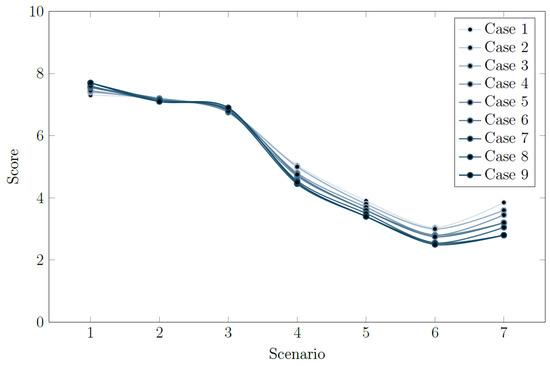
Figure 6.
Sensitivity analysis on KPIs weighting coefficient for maintenance costs.
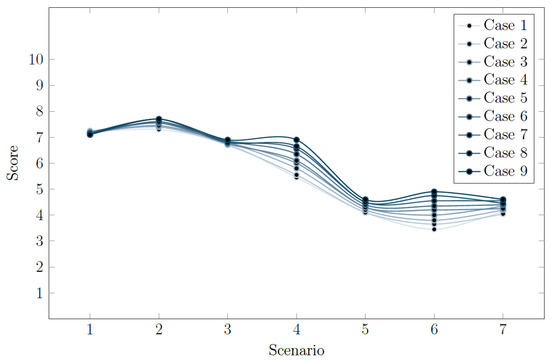
Figure 7.
Sensitivity analysis on KPIs weighting coefficient for cost variability.
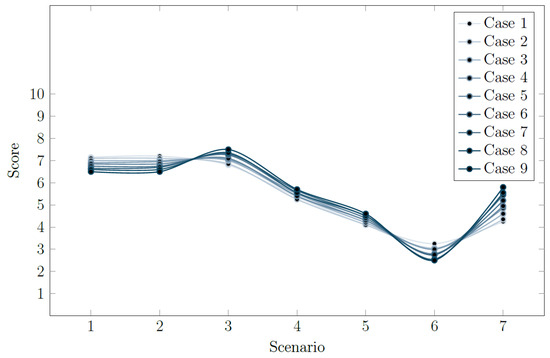
Figure 8.
Sensitivity analysis on KPIs weighting coefficient for availability.
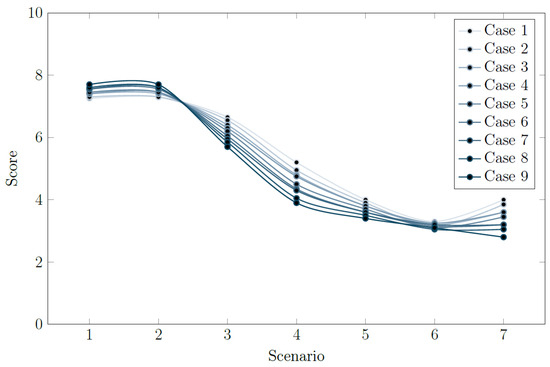
Figure 9.
Sensitivity analysis on KPIs weighting coefficient for MTBF.

Table 6.
Quantitative KPIs for Multi-criteria analysis.
Scenarios 1 and 2 featured by an outsourced full-service maintenance approach are the most performing cases. On the contrary, in-house scenarios 6 and 7 show higher cost per kilometer. In general, a direct comparison between outsourced and in-house maintenance approaches states in favor of the former, where the overall costs are low. However, it is interesting to notice that Scenario 4 is described by high maintenance costs despite an outsourced approach adopted. This case represents a mixed type of maintenance which includes more interventions within the fee. This explains why this peak occurs.
The differences between the considered scenarios appear to be insignificant at a first sight. This wrong impression is given by the evaluation of specific costs indicators. However, the differences in total cost is significant, since a bus travels more than 104 km/year on average. Just for instance, if a bus fleet composed by 100 vehicles is considered, with a distance covered of , accounting for a delta specific cost of 0.1 €/km, the total cost difference projected at the end of the year is 500,000 €/year. Furthermore, comparing all scenarios with the best-performing cases (Scenarios 1 and 2):
- Scenario 4 reports +25% €/km;
- Scenarios 5, 6 and 7 show a maintenance cost at least +50% €/km.
Variability of costs also impacts on the global evaluation of scenarios. This KPI is lower in scenarios 1, 2, 3 and 4 all featured by full-service maintenance. Conversely, scenarios 5, 6 and 7 present the highest values for cost variability, observing that in the case of in-house maintenance is more expensive as expected. Despite that, for outsourced maintenance it is necessary to consider some influencing factors. First of all, the contract agreement for outsourcing maintenance excludes few inspection activities, thus causing reductions to the contractual mileage fee. Furthermore, the mileage rate is distributed among the bus fleet, meaning that not all vehicles show the same mileage in the same scenario.
As far as the availability rate is concerned, results are very similar between the different scenarios, since the deviation observed is minimal. However, there is the case of Scenario 6 whose availability rate is much lower than the others −10% if compared with the best case. Actually, this represents an outlier; in fact, there are no significant deviations between scenarios adopting an outsourced or an in-house maintenance approach.
The MTBF can be seen as the consequence of the previous KPIs. In fact, it depends on both the distance traveled by the vehicles and its availability rate. Thus, again the cases with the best MTBF are Scenarios 1 and 2, as depicted in Figure 9. In addition, since the MTBF indicator is calculated as the ratio of inspections and the number of kilometers traveled within the period considered, the outsourcing approach is the best performing.
For setting up a multi-criteria approach, first the scoring criteria for each quantitative KPI must be established. An overview is provided in Table 5. An initial assessment is provided in Figure 5 where all quantitative KPIs are weighted equally among them—i.e., 25% of relative weight. It is immediately noticeable that scenarios featured by an outsourced maintenance approach show also higher scores. The green average line underlines how an outsourced maintenance approach is highly performing with respect to the in-house approach, as Scenarios 1, 2 and 3 show since are characterized by this approach. In particular, it can be noted that:
- the maintenance cost scores are in favor of outsourcing approach identified by Scenarios 1, 2 and 3;
- cost variability is distributed among the cases;
- availability rate is best-performing on Scenario 3, followed by Scenario 7 while Scenario 6 obtained the lowest score;
- MTBF scores follow the path obtained for maintenance costs, with Scenarios 1 and 2 best-performing.
A sensitivity analysis is then performed where a different relative weight is assigned to each KPI, thus observing how the results vary. In particular, 9 different steps were evaluated, with an +5% increase of the weighting coefficient for each quantitative KPI considered with respect to the others. Therefore, the analysis is performed to evaluate how the progressive relevance of each indicator impacts on the remaining KPIs and hence on the final output.
Results point out a knee-curve trend, enclosing in the first branch Scenarios 1, 2 and 3 while the second branch includes all remaining scenarios. Different behaviors can be observed depending both on the scenarios and on the KPI’s weight increase. As a general trend, Scenarios 1 and 2 behave in opposite way with respect to the others. Moreover, scenarios 1 and 2 are best-performing, improving their overall scores with the exception of availability A, as Figure 8 depicts. Conversely, remaining scenarios suffer a general score deterioration, in particular Scenarios 4 and 7 experience a down-scoring from 5.2 to 3.9 and from 4 to 2.8 respectively for maintenance cost case (Figure 6). The only exception is represented by the outlier Scenario 6, which behaves as Scenarios 1 and 2 in Figure 8. In addition, benefits are found when weight increase in cost variability is accounted as prompted by Figure 7. The choice between the two maintenance approaches also depends on the weight assigned by the company or decision-maker to each KPI. In this way, the decision-making model developed is exploited by the company itself to assess if the choice is capable to fulfill and satisfy all its needs and targets.
Discussion
Based on the analysis for the quantitative indicators, the qualitative KPIs are evaluated. For what concerns flexibility, two different discussions can be set. The first aspect to underline is related to the company’s internal structure; scenarios with in-house maintenance approach—i.e., Scenario 5, 6 and 7—can show potentially a high level of flexibility if the managerial and organizational levels are sufficiently developed. However, if the pure flexibility of each approach is considered during a choice, for example for a new batch of vehicles, outsourcing allows for more flexibility. In fact, the company would not train staff and could easily manage a change by trying to include its requirements in the contract signed with the supplier. This last aspect is not always agreed by the supplier. For these reasons, Scenarios 1, 2, 3 and 4 are characterized by less flexibility in this case study. Scenarios with a higher score are described by a more organized structure, i.e., maintenance hubs with a high seniority. For this reason, qualitatively Scenarios 5 and 7 are preferable in terms of flexibility.
Consequently, if readiness is endorsed, the best-performing scenarios are the one characterized by in-house approach, since the knowledge of the vehicle maintenance process is very high. Similar levels are reached by outsourcing scenarios, given the competitiveness of the full-service maintenance activities. What is needed to have an adequate and high-quality service is the level of expertise of both the company and the supplier. Therefore, Scenarios 5, 6 and 7 are the best-performing cases. Nevertheless, the outsourcing scenarios also present a competitive level of preparedness given by the overall score.
From the point of view of assets, it is clear that Scenarios 5, 6 and 7 obtained the highest scores because the hubs already own a number of resources that enable to carry out in-house maintenance process, especially for what concerns the allocations of equipment needed. The outsourcing scenarios, on the other hand, do not hold any asset, as all activities are performed by the vehicle supplier. Consequently, the in-house maintenance approach requires allows for significant assets to be owned, while the outsourcing approach does not require, either in terms of personnel or real estate.
Finally, in-house maintenance scenarios are more suitable for control and monitoring activities, since the control structure is integrated directly within the company and controlled by the company itself. When operations are outsourced, it is more complex to act control, since the process parameters are usually not disclosed by supplier nor can be accurately monitored by the company. Consequently, in-house scenarios score higher in terms of control activities, since the whole maintenance is performed in-house by company’s own operators. When maintenance is outsourced to a supplier, the verification phase on the supplier for all maintenance operations performed as required by the customer needs the creation of a dedicated internal structure. Furthermore, the internal management of the control structure can better define priorities and evaluate performances.
In conclusion, the benefits and drawbacks are listed in Table 7. As a final task, a generalization can be derived from the results still obtained. Outsourcing approach is feasible and competitive when dealing with a young vehicle fleet—i.e., when the average vehicle age is low. This allows a sensible reduction in both operational (OPEX) and capital expenditures (CAPEX), since the maintenance activities are performed upon fee payment within maintenance hubs owned by the TO. In addition, all maintenance equipment that must be installed in maintenance hubs owned by TO itselfu are absorbed by in-house maintenance costs. Moreover, also MTBF indicator is higher for outsourcing approach chosen. Cost variability is also limited with respect to in-house maintenance since costs are defined a-priori upon contract agreement. Conversely, availability rate is higher for in-house. Limitations of outsourcing maintenance approach are mainly related to the agreement and contract clauses, which act as constraints against any change of the agreed conditions. It is also evident that, without a support structure, outsourcing does not guarantee flexibility, as all operations would be performed and defined by a supplier. On the contrary, in-house maintenance guarantees more flexibility, but strongly limited to (or depending on) internal expertise.

Table 7.
Comparisons between maintenance approaches.
6. Conclusions
In this paper, a make-or-buy choice focused on maintenance processes was examined as seen from the perspective of the Transport Operator. This is needed to increase robustness of the company against unforeseen or unexpected cost rise. Moreover, the benefits generated through an accurate maintenance approach chosen can be transferred in a higher customer satisfaction, given higher reliability of the fleet and high-quality maintenance. Different approaches were presented in deep detail, showing advantages and drawbacks both technical and economical for choosing an outsourced maintenance in place of an in-house approach. This evaluation was based on a framework of identified KPIs with the interest of the company to achieve its market targets and economic plan and contractual clauses and signed agreements, which are the main limitations of the work. The outsourcing approach is suitable when a new technology is introduced and the actual know-how hold by the company is not adequately developed. It guarantees lower maintenance costs, but defined and agreed upon TO and supplier at the beginning of the vehicle life cycle. Maintenance is therefore regulated solely by a fee within a contract. On the other hand, an in-house maintenance approach shows strengths and benefits for the company when the technological know-how is very consolidated and developed, turning into a core factor for the company’s core-business. It also allows a closer and accurate control of process, as well as greater flexibility in the vehicle life cycle and fleet management. The analysis was developed assigning a score to each KPI for all scenarios considered and a preliminary rank of the alternatives was performed. Moreover, a sensitivity analysis was also performed to evaluate the impact of variations in the weighting coefficients on each scenario, thus reinforcing the final choice. The choice of maintenance approach depends on multiple factors, since maintenance process involves directly all business areas, from the economic to the service through the management, financial, assets and investment areas. From an economic point of view, outsourcing provides to the company cost security, thus protecting against unforeseen changes or extraordinary situations (−35% in specific maintenance cost-per-km). In addition, benefits are carried in a reduced cost variability (−44%) and higher Mean Time Between Failures (+116%) and comparable reliability rates (). Conversely, the in-house approach can be settled when TOs need to monitor maintenance KPIs directly and hold available space where to allocate maintenance equipment needed. Levels of reliability for vehicle fleet is comparable to outsourcing case, but on the other hand an increase in maintenance cost-per-km and its variability must be accounted. As a future development, results here presented can be extended to a full-electric bus fleet—or other technologically-new power supply—to assess whether the results obtained are still valid for new technologies developed, thus to carry further interest to the findings here reported.
Author Contributions
Conceptualization, T.O., A.D.M. and M.L.; methodology, T.O. and A.D.M.; software, T.O.; validation, A.D.M. and M.L.; formal analysis, A.D.M.; investigation, T.O.; resources, D.Z.; data curation, M.L.; writing—original draft preparation, A.D.M.; writing—review and editing, A.D.M. and M.L.; visualization, A.D.M.; supervision, M.L.; project administration, D.Z.; funding acquisition, D.Z. All authors have read and agreed to the published version of the manuscript.
Funding
This research received no external funding.
Data Availability Statement
No new data were created or analyzed in this study. Data sharing is not applicable to this article.
Conflicts of Interest
The authors declare no conflicts of interest.
References
- Van Audenhove, F.J.; Pourbaix, J.; Rominger, G.; Eagar, R.; Dommergues, E.; Carlie, J. The Future of Mobility Post-COVID; Resreport; UITP (Union Internationale des Transports Publics), Arthur D. Little Future Lab: Bruxelles, Belgium, 2020. [Google Scholar]
- Capata, R. Urban and Extra-Urban Hybrid Vehicles: A Technological Review. Energies 2018, 11, 2924. [Google Scholar] [CrossRef]
- Baccelli, O.; Brenna, C.; Grea, G.; Sileo, A.; Papa, C.; Armiento, M.; Cordella, I. Scenari e Prospettive Dell’Elettrificazione del Trasporto Pubblico su Strada; Resreport; Università Bocconi, Enel Foundation: Milan, Italy, 2021. [Google Scholar]
- Rosyidi, C.N.; Pratama, M.A.; Jauhari, W.A.; Suhardi, B.; Hamada, K. Make or buy analysis model in a multi-stage manufacturing processes. In Proceedings of the 2016 IEEE International Conference on Industrial Engineering and Engineering Management (IEEM), Bali, Indonesia, 4–7 December 2016; pp. 971–976. [Google Scholar] [CrossRef]
- Agostino, M.; Caballini, C.; Chiara, B.D.; La Scala, P. Compliance of maintenance and operational needs for trains: A simulation analysis to evaluate the impact of a flexible scheduling on local transport by rail. In Proceedings of the 2020 IEEE 23rd International Conference on Intelligent Transportation Systems (ITSC), Rhodes, Greece, 20–23 September 2020; pp. 1–6. [Google Scholar] [CrossRef]
- Tian, G.; Zhang, L.; Fathollahi-Fard, A.M.; Kang, Q.; Li, Z.; Wong, K.Y. Addressing a Collaborative Maintenance Planning Using Multiple Operators by a Multi-Objective Metaheuristic Algorithm. IEEE Trans. Autom. Sci. Eng. 2024, 1–13. [Google Scholar] [CrossRef]
- Aghezzaf, E.H.; Diallo, C.; Khatab, A.; Venkatadri, U. A joint selective maintenance and multiple repair-person assignment problem. In Proceedings of the 7th International Conference on Industrial Engineering and Systems Management. Wirtschaftswissenschaften HTW SAAR, Saarbrücken, Germany, 11–13 October 2017; pp. 317–322. [Google Scholar]
- Dao, C.D.; Zuo, M.J. Optimal selective maintenance for multi-state systems in variable loading conditions. Reliab. Eng. Syst. Saf. 2017, 166, 171–180. [Google Scholar] [CrossRef]
- Khanfri, N.E.H.; Ouazraoui, N.; Simohammed, A.; Sellami, I. New Hybrid MCDM Approach for an Optimal Selection of Maintenance Strategies: Results of a Case Study. SPE Prod. Oper. 2023, 38, 724–745. [Google Scholar] [CrossRef]
- Emovon, I.; Norman, R.A.; Murphy, A.J. Hybrid MCDM based methodology for selecting the optimum maintenance strategy for ship machinery systems. J. Intell. Manuf. 2015, 29, 519–531. [Google Scholar] [CrossRef]
- Faghihinia, E.; Mollaverdi, N. Building a maintenance policy through a multi-criterion decision-making model. J. Ind. Eng. Int. 2012, 8, 14. [Google Scholar] [CrossRef]
- Chu, A.T.W.; Kalaba, R.E.; Spingarn, K. A comparison of two methods for determining the weights of belonging to fuzzy sets. J. Optim. Theory Appl. 1979, 27, 531–538. [Google Scholar] [CrossRef]
- Ishizaka, A.; Labib, A. Review of the main developments in the analytic hierarchy process. Expert Syst. Appl. 2011, 38, 14336–14345. [Google Scholar] [CrossRef]
- Munier, N.; Hontoria, E.; Jiménez-Sáez, F. Strategic Approach in Multi-Criteria Decision Making; Springer International Publishing: Berlin/Heidelberg, Germany, 2019. [Google Scholar] [CrossRef]
- Nijkamp, P. Stochastic quantitative and qualitative multicriteria analysis for environmental design. Pap. Reg. Sci. Assoc. 1977, 39, 174–199. [Google Scholar] [CrossRef]
- Peláez, J.; Lamata, M. A new measure of consistency for positive reciprocal matrices. Comput. Math. Appl. 2003, 46, 1839–1845. [Google Scholar] [CrossRef]
- Zelany, M. A concept of compromise solutions and the method of the displaced ideal. Comput. Oper. Res. 1974, 1, 479–496. [Google Scholar] [CrossRef]
- Alonso, J.A.; Lamata, M.T. Consistency in the analytic hierarchy process: A new approach. Int. J. Uncertainty Fuzziness Knowl.-Based Syst. 2006, 14, 445–459. [Google Scholar] [CrossRef]
- Saaty, T.L. A scaling method for priorities in hierarchical structures. J. Math. Psychol. 1977, 15, 234–281. [Google Scholar] [CrossRef]
- Saaty, T.L. How to make a decision: The analytic hierarchy process. Eur. J. Oper. Res. 1990, 48, 9–26. [Google Scholar] [CrossRef]
- Mareschal, B.; Brans, J.P.; Vincke, P. Prométhée: A New Family of Outranking Methods in Multicriteria Analysis; ULB Institutional Repository, ULB–Universite Libre de Bruxelles: Bruxelles, Belgium, 1984. [Google Scholar]
- Banayoun, R.; Roy, B.; Sussman, N. Manual de Reference du Programme Electre; Note de Synthese et Formation 25; Direction Scientifique SEMA: Paris, France, 1966. [Google Scholar]
- Bouchriha, H.; D’amours, S.; Ladet, P. A “make or buy” decision model with economies of scale. In Proceedings of the IEEE International Conference on Systems, Man and Cybernetics, Yasmine Hammamet, Tunisia, 6–9 October 2002; Volume 6, p. 6. [Google Scholar] [CrossRef]
- Medina-Serrano, R.; González-Ramírez, R.; Gasco-Gasco, J.; Llopis-Taverner, J. Strategic sourcing: Developing a progressive framework for make-or-buy decisions. J. Ind. Eng. Manag. 2020, 13, 133–154. [Google Scholar] [CrossRef]
- Canez, L.; Probert, D. Technology sourcing: The link to make-or-buy. In Proceedings of the PICMET ’99: Portland International Conference on Management of Engineering and Technology. Proceedings Vol-1: Book of Summaries (IEEE Cat. No.99CH36310), Portland, OR, USA, 29 July 1999; Volume 2, pp. 47–52. [Google Scholar] [CrossRef]
- Rahman, H.U.; Raza, M.; Afsar, P.; Khan, H.U.; Nazir, S. Analyzing Factors That Influence Offshore Outsourcing Decision of Application Maintenance. IEEE Access 2020, 8, 183913–183926. [Google Scholar] [CrossRef]
- Vidor, G.; Radke, A.; Fogliatto, F.; Tseng, M. Make-or-buy: Multicriteria method to guide the decision in mass customization oriented companies. In Proceedings of the 22nd International Conference on Production Research, ICPR 2013, Parana, Brazil, 28 July–1 August 2013. [Google Scholar]
- Frank, A.G.; Souza, D.V.S.D.; Ribeiro, J.L.D.; Echeveste, M.E. A framework for decision-making in investment alternatives selection. Int. J. Prod. Res. 2013, 51, 5866–5883. [Google Scholar] [CrossRef]
- ur Rehman, H.; Bamma, H.K.; Nazir, S.; Shahzad, S.; Hodosi, T. A sourcing decision model for application maintenance services. In Proceedings of the 2017 3rd International Conference on Science in Information Technology (ICSITech), Bandung, Indonesia, 25–26 October 2017; pp. 401–407. [Google Scholar] [CrossRef]
- Corazza, M.V.; Magnalardo, S.; Vasari, D.; Petracci, E.; Tozzi, M. The EBSF_2 innovative predictive maintenance system for buses: A case study to synergetically improve operational and environmental bus performance. In Proceedings of the 2017 IEEE International Conference on Environment and Electrical Engineering and 2017 IEEE Industrial and Commercial Power Systems Europe (EEEIC/I&CPS Europe), Milan, Italy, 6–9 June 2017; pp. 1–6. [Google Scholar] [CrossRef]
- Li, S.; Huang, H.Z.; Wang, P.; Jin, T. Design of maintenance outsourcing contracts considering fleet expansion. In Proceedings of the 2016 Annual Reliability and Maintainability Symposium (RAMS), Tucson, AZ, USA, 25–28 January 2016; pp. 1–7. [Google Scholar] [CrossRef]
- Wester, P.; Smit, J.; Groot, E. Outsourcing maintenance processes in electricity utilities. In Proceedings of the 16th International Conference and Exhibition on Electricity Distribution, 2001. Part 1: Contributions. CIRED. (IEE Conf. Publ No. 482), Amsterdam, The Netherlands, 18–21 June 2001; Volume 6, p. 5. [Google Scholar] [CrossRef]
- Tseng, F.S.; Tang, K.; Moskowitz, H.; Plante, R. Maintenance Outsourcing Contracts for New Technology Adoptions. IEEE Trans. Eng. Manag. 2009, 56, 203–218. [Google Scholar] [CrossRef]
- Nunna, S.; Ermecke, R.; Schupke, D. Toward Modeling Rationalization Potential in Network Operations and Maintenance Outsourcing. In Proceedings of the 2011 IEEE International Conference on Communications Workshops (ICC), Kyoto, Japan, 5–9 June 2011; pp. 1–6. [Google Scholar] [CrossRef]
- Schmitz, B.; Düffort, F.; Satzger, G. Managing Uncertainty in Industrial Full Service Contracts: Digital Support for Design and Delivery. In Proceedings of the 2016 IEEE 18th Conference on Business Informatics (CBI), Paris, France, 29 August–1 September 2016; Volume 1, pp. 123–132. [Google Scholar] [CrossRef]
- Mahamoud, N.Y.; Dehombreux, P.; Pirlot, M.; Roble, H.E. Decision-support approach for selecting the suitable maintenance policy. In Proceedings of the 2016 IEEE International Conference on Industrial Engineering and Engineering Management (IEEM), Bali, Indonesia, 4–7 December 2016; pp. 1355–1359. [Google Scholar] [CrossRef]
- Naji, M.A.; Mousrij, A. Maintenance success factors identification using the fuzzy AHP. In Proceedings of the 2018 IEEE International Conference on Technology Management, Operations and Decisions (ICTMOD), Marrakech, Morocco, 21–23 November 2018; pp. 107–112. [Google Scholar] [CrossRef]
- Jin, T.; Nalajala, N.; Jimenez, J.A. A multi-criteria approach for performance based maintenance with variable fleet size. In Proceedings of the Proceedings of 2011 9th International Conference on Reliability, Maintainability and Safety, Guiyang, China, 12–15 June 2011; pp. 909–914. [Google Scholar] [CrossRef]
- Mandelbaum, M.; Buzacott, J. Flexibility and decision making. Eur. J. Oper. Res. 1990, 44, 17–27. [Google Scholar] [CrossRef]
- Hart, S.G. Nasa-Task Load Index (NASA-TLX); 20 Years Later. Proc. Hum. Factors Ergon. Soc. Annu. Meet. 2006, 50, 904–908. [Google Scholar] [CrossRef]
- Olechowski, A.; Eppinger, S.D.; Joglekar, N. Technology readiness levels at 40: A study of state-of-the-art use, challenges, and opportunities. In Proceedings of the 2015 Portland International Conference on Management of Engineering and Technology (PICMET), Portland, OR, USA, 2–6 August 2015; pp. 2084–2094. [Google Scholar] [CrossRef]
- Salazar, G.; Russi-Vigoya, M.N. Technology Readiness Level as the Foundation of Human Readiness Level. Ergon. Des. 2021, 29, 25–29. [Google Scholar] [CrossRef]
- Terrile, R.J.; Doumani, F.G.; Ho, G.Y.; Jackson, B.L. Calibrating the Technology Readiness Level (TRL) scale using NASA mission data. In Proceedings of the 2015 IEEE Aerospace Conference, Big Sky, MT, USA, 7–14 March 2015; pp. 1–9. [Google Scholar] [CrossRef]
Disclaimer/Publisher’s Note: The statements, opinions and data contained in all publications are solely those of the individual author(s) and contributor(s) and not of MDPI and/or the editor(s). MDPI and/or the editor(s) disclaim responsibility for any injury to people or property resulting from any ideas, methods, instructions or products referred to in the content. |
© 2024 by the authors. Licensee MDPI, Basel, Switzerland. This article is an open access article distributed under the terms and conditions of the Creative Commons Attribution (CC BY) license (https://creativecommons.org/licenses/by/4.0/).