1. Introduction
Dynamic changes in the business market and the constant increase in customer expectations force transportation enterprises to constantly seek methods and tools to optimize processes and improve the efficiency of the entire transport system, which, operating in a changing environment, is susceptible to negative effects [
1]. The consequences may include the disruption of transportation tasks or a complete inability to undertake transportation activities.
The diverse set of qualitative and quantitative data describing the execution of a single transport order and the constantly changing conditions of vehicle use mean that taking rational and planned actions in transportation enterprises in terms of intensity of use, maintenance activities, control or monitoring is often driven by intuitive and subjective feelings, which does not strengthen the position of the enterprise’s vehicle operation strategy. The large number of variables describing the process of vehicle use, especially in micro- and small enterprises, means that, in practice, the coefficients characterizing the operation of vehicles and their impact on the profitability of the tasks carried out are not analyzed [
2]. Lack of awareness of the cause-and-effect relationship of the process of using and operating vehicles results in users often making decisions that are inappropriate and irrational from the point of view of the business outcome. This significantly affects the quality of the vehicle operating system, generates costs associated with its use and operation and may cause the risk of incurring financial losses when the cost of executing the order exceeds its value.
SME enterprises are characterized by the small number of vehicles they own as part of their fleet. Due to their limited budget, which is mainly due to the fact that they carry out less profitable transport orders, they are unable to implement advanced transportation management systems (e.g., TMS class) to optimize their operations. This causes them to rely solely on their experience when deciding whether to undertake an order and its pricing. The above causes them to often execute orders at a price below the break-even point. This causes the economic efficiency of such entities to decrease significantly. Therefore, it seems important to build simple and accessible tools to support decision-makers in the decision-making process for the execution of transport orders. The above formed the basis for further analysis [
3].
The purpose of this article was to analyze the economic efficiency of vehicle operation in terms of enterprises’ financial security. For the purpose of the study conducted, the research problem was formulated as follows: How do the various parameters of a transport order affect its profitability? The following research methods were used: critical analysis of the literature, mathematical modeling using a logistic regression model and inference (synthesis and deduction). In this article, an analysis was made of the execution of transport orders in an SME enterprise (which is characterized by a fleet of light commercial vehicles with a capacity of up to 3.5 t) providing services in Poland in the FMCG industry. Logistic regression was used in this article. The accumulated observations and preliminary analyses carried out made it possible to isolate the main factors affecting the profitability of a transport order and enabled the selection of the model’s predictors. These included qualitative variables, characterizing lead time, and quantitative variables, describing operating parameters, i.e., daily mileage, driving speed or fuel consumption. The parameters estimated by the regression model made it possible to analyze and evaluate the relationships that occurred. The quality of the proposed model was verified by analyzing the significance of the parameters and testing the goodness of fit using the Receiver Operating Characteristic (ROC) Curve and the Area Under ROC (AUC) Curve.
2. Literature Analysis
Efficiency is a concept widely described, although it is often not clearly defined in the literature. With regard to the profitability of implemented activities, the literature most often uses the concept of economic efficiency. Efficiency, not as a technical but as an economic category, determines the outcome of the evaluation of the enterprise’s activities as well as its individual areas, i.e., the process of vehicle use, service and diagnosis. One of the most popular definitions of economic efficiency indicates that it is an activity that is waste-free and aimed at achieving the best result within the available resources and technology [
4,
5]. In general terms, it is defined as the ability to use one’s resources in such a way as to achieve a given goal in the most efficient and least wasteful manner. The essence of measuring such efficiency is to compare the effect achieved with the inputs consumed [
6]. Samuelson and Nordhaus defined efficiency as the most effective application of a society’s available resources in the process of satisfying needs [
7]. According to organizational theory, efficiency is considered the broadest in meaning among such concepts as performance, productivity, economy, rationality or effectiveness [
8]. Efficiency can apply to both individual entities and the economy as a whole [
9]. Moreover, it can be considered in the short and long term [
10]. An enterprise is efficient if, making full use of its resources, it produces goods that are in demand in the market without unnecessary stockpiling [
11]. In an attempt to capture the essence of efficiency, Pyszka points out the ambiguous interpretation of this concept, which is undergoing constant modification with the development of management theory [
12].
When analyzing considerations of efficiency, it is necessary to adopt such a concept of it that most aptly characterizes the work of delivery vehicles [
13]. Therefore, the following section of this paper will analyze the efficiency of use, which will be considered from two aspects, i.e., functional, related to efficiency and compliance with customer requirements, and economic, related to the profitability of orders. This approach was adopted because, in many publications, the authors confirm that the efficiency of transportation enterprises is a universal concept determined by the rational management of vehicles [
14,
15]. However, the transportation tasks carried out in transportation enterprises can be efficient from one point of view and inefficient from another [
16]. Thus, the main objectives of rational vehicle management in transportation enterprises include minimizing expenditures on the operation of vehicles, thus increasing the enterprise’s profit from the execution of orders [
17].
For transportation enterprises, the measurable feature of the efficiency of the use of vehicles is always the revenue from the execution of transport orders and the resulting costs. The optimal management of the vehicle use process should always be aimed at maximizing revenue and minimizing costs [
18].
Effective management of the system of operation of delivery vehicles expresses the entire ability to meet the specific needs of users and is focused on making rational decisions aimed at maximizing the degree of achievement of the objectives, including the bottom line [
19]. Shaping and evaluating the effects of the vehicle use process in transportation enterprises is closely related to the need to optimally allocate tasks to vehicles along with maintaining their performance characteristics at an appropriate level under specific operating conditions [
20]. These features, which meet the requirements of representative ones, should be controlled on an ongoing basis in order to maintain the fitness of the vehicle. With the help of the selected operating ratios, the fleet manager can verify the intensity of vehicle use in real time, analyze the profitability of the actions taken and plan the process of vehicle use. An analysis of the literature showed that there are a number of studies on the economic efficiency of vehicles, but they are conducted for heavy-duty vehicles whose payload exceeds 9.5 t [
21]. However, there is a lack of studies dealing with fleets of light commercial vehicles with a cargo capacity of up to 3.5 t. In addition, due to costs, micro- and small enterprises rarely implement modern information systems to support decision-making in vehicle operation. The lack of access to specialized tools causes decision-makers to rely solely on their experience when valuing an order and undertaking its execution [
22]. This causes them to rely solely on their experience when deciding to undertake an order and its valuation. They often undertake orders that are completely unprofitable for them (e.g., with a cargo weight above the permitted capacity, taking the risk of receiving a fine or damaging the vehicle) or price the order at or below the profitability limit. A characteristic feature of such entities is that they perform transports over short distances (within up to 200 km of their headquarters) and for relatively small amounts. As a result of their decisions, these entities do not make a high profit and cannot invest in further development, including both IT systems and the purchase of a new fleet of vehicles. That is why it is important to provide simple decision-support tools, the implementation of which does not require large financial outlays. Such a tool can be the logistic regression model presented in this article for assessing the economic efficiency of vehicle operation in transportation enterprises. This research was conducted at an SME transportation enterprise that provides transportation services to a trade company operating in the FMCG (Fast-Moving Consumer Good) sector in Poland. The main characteristic of this industry, both in Poland and around the world, is the relatively low price of the products offered to customers, as well as the fact that they are sold on a mass scale and with very short delivery times [
23]. The above makes it necessary for the transport processes implemented for this industry to be characterized by relatively low costs and high reliability. The performance of transportation services for this type of industry is characterized by a special approach due to the type of cargo being carried. The specific nature of the products transported, i.e., eggs, fresh vacuum-packed meat and cured meats, requires transportation enterprises to handle orders particularly quickly and efficiently, with the goal of ensuring the freshness of the products. Appropriate transportation methods and conditions, cargo security, flexibility and often taking on orders immediately are all challenges that a carrier providing food transportation services must address. From the point of view of trade companies, the most important criterion for the selection of a transportation enterprise is the price of the service provided, but given the nature of the product, the complex logistics chain and the very short delivery times, trading companies rely on the flexibility of the carrier and are willing to pay a higher price to pick up the cargo as quickly as possible and deliver it to the recipient. These types of orders are an opportunity for carriers to earn much more revenue, so it is important to be able to analyze and evaluate the factors that have a key impact on the profitability of the order being executed and the degree of this impact.
3. Methodology—Logistic Regression Model
The analysis and evaluation of the profitability of transport orders were made using a logistic regression model. It provides a mathematical notation of the effect of several variables x
1, x
2, …, x
n on the dichotomous variable
Y, which takes the value of 1 when the order is profitable and 0 when the enterprise suffers financial losses. The mathematical function in this kind of model is the logistic function, which takes the form presented in (1) below [
24]:
where
e—Euler number;
x—value of the explanatory variable X.
The logistic regression model is described by the following equation:
where
βi i = 0, …, k—logistic regression coefficients;
x1, x2, …, xk—independent variables, which can be both measurable and qualitative.
It is based on a way of expressing probability through odds, i.e., the ratio of the probability of an event occurring to the probability that it will not happen. For a given event A, the above definition takes the following form:
The measure of the relationship between the variables in the above model is the odds ratio (OR), which, when comparing groups A and B, should be understood as the ratio of the chance of occurrence of A to the chance of occurrence of B. It is most often written in the following form:
Regression coefficients
βi, where
I = 0, …, k, are estimated based on the maximum reliability method (MRM), which maximizes the reliability function or its square. The reliability function takes the following forms [
25]:
where
—unknown distribution parameters;
—observed values of variable X in a random sample;
p(x)—distribution defined by a probability function;
f(x)—distribution defined by the density function;
L—reliability function.
Taking into consideration that all observations are independent of each other, the probability of observing the entire data set is equal to the likelihood function of the individual samples.
The use of a logistic regression model is only possible after examining and meeting the following requirements:
- -
The dependent variable is binary;
- -
There is no correlation between the independent variables;
- -
There is a linear relationship between the probability logit and the independent variables;
- -
The model includes only those independent variables that have a significant impact on the dependent variable.
The assessment of the correctness of the built model and its goodness of fit is possible by doing the following:
- -
Using statistics used in evaluating diagnostic tests, i.e., accuracy (ACC), sensitivity (SE) and specificity (SP);
- -
Performing the Hosmer and Lemeshow test;
- -
Plotting the ROC curve and analyzing the area under the AUC curve.
To evaluate the research conducted and the results obtained, a value and the corresponding cut-off point should be determined. It is the value of the research variable for which it is possible to best divide the set into two groups (the phenomenon occurs and does not occur). This point is a fixed value of
π0 from the interval [0,1], for which the following is assumed:
To assess model goodness of fit, two quantities are most often used simultaneously: sensitivity and specificity (defined as difference 1—SP). For evaluation, the obtained pairs of 1—SP and SE values are marked on a plane, where the horizontal axis represents 1—SP values, while the vertical axis represents SE values. The combination of the obtained points forms the so-called ROC curve, which allows an overall evaluation of the predictive quality of the model. It shows all possible cut-off points and the statistics associated with them. In addition, it does not depend on the scale adopted and allows easy reading of sensitivity and specificity values.
If there is a continuous independent variable in a logistic regression model, a number of different cut-off points can be tested to distinguish occurrences from non-occurrences, depending on the predicted probability. It is important to find a point that has high values of both sensitivity and specificity. This is the optimal cut-off point, which is determined using the Youden index (J). It takes the following form:
The optimum cut-off point corresponds to the case where the J value reaches its maximum.
An analysis of the literature has shown that there are many scientific publications using logistic regression models to analyze diversified problems and variables. These models have also been applied to assess the profitability of companies. Zizi et. al. [
26] used it to assess the determinants and predictors affecting SMEs’ financial failure, considering only the macroeconomic indicators that characterize these companies. Budak and Sarvari [
27] analyzed profit margin prediction in sustainable road-freight transport. Their study, however, considered a company without its own fleet of vehicles, which, when valuing orders, operates only by assessing its own margin, which is added up to the value of the order given by the truck driver. Conrad IV [
28], on the other hand, carried out an analysis of the profitability of individual timber deliveries for truck owners doing business in the USA, indicating that it is often unprofitable (86%) and explaining the reasons for this. The above are only examples of the application of the regression model to similar cases; however, no studies dedicated to the analysis of the profitability of transport orders, especially for companies with a fleet of delivery vehicles, were found.
4. Results and Discussion
This article analyzes the bottom-line figures for transport orders registered in 2021–2022, which were carried out by transportation enterprises of the SME sector in the FMCG industry in Poland. Due to the knowledge of the Polish transport market and the fact that, in 2021–2022, Polish transport companies were the industry leaders among all EU countries, it was decided to choose this country as an appropriate example of process implementation [
29]. Additionally, our study covered the years 2021–2022, i.e., the post-pandemic period, in which a significant increase in the number of transport operations was recorded. It focuses on the profitability of their execution and the analysis of the impact of vehicle performance on enterprises’ bottom line. An analysis of operating costs showed that for a transport order to be profitable, its value should be min. PLN 500. Therefore, an order profitability index with a binomial distribution was indicated as the dependent variable, where 1 meant that the order was profitable and 0 meant that its cost exceeded revenue, generating a loss. Therefore, a logistic regression model was used. The data set size was 13,000 observations. They were divided into two subsamples, test and training, in a ratio of 80–20.
Building the model began by selecting the factors that could affect the explanatory variable. The ones selected were those related to the operating conditions of the vehicles, i.e., daily mileage [km], operating time [min], driving speed [km/h], cargo weight [kg], fuel consumption [l] and the seasonality of the deliveries made, i.e., day of the week and month of the order. The first part of this study analyzed and evaluated the impact of the selected parameters on the dependent variable. For this purpose, the LR test, which allows testing whether a univariate model containing a given variable is significantly better than a model containing only an absolute term, was used. The results are presented in
Table 1.
The calculated p-value for the variable day of the week was 0.09, which means that the null hypothesis of no significant effect of this variable on the analyzed phenomenon could not be rejected. Therefore, the variable was also eliminated and not considered further in our study. For the remaining variables, the calculated p-value of the test conducted indicated that the alternative hypothesis, stating that their effect on profitability is significant, should be accepted.
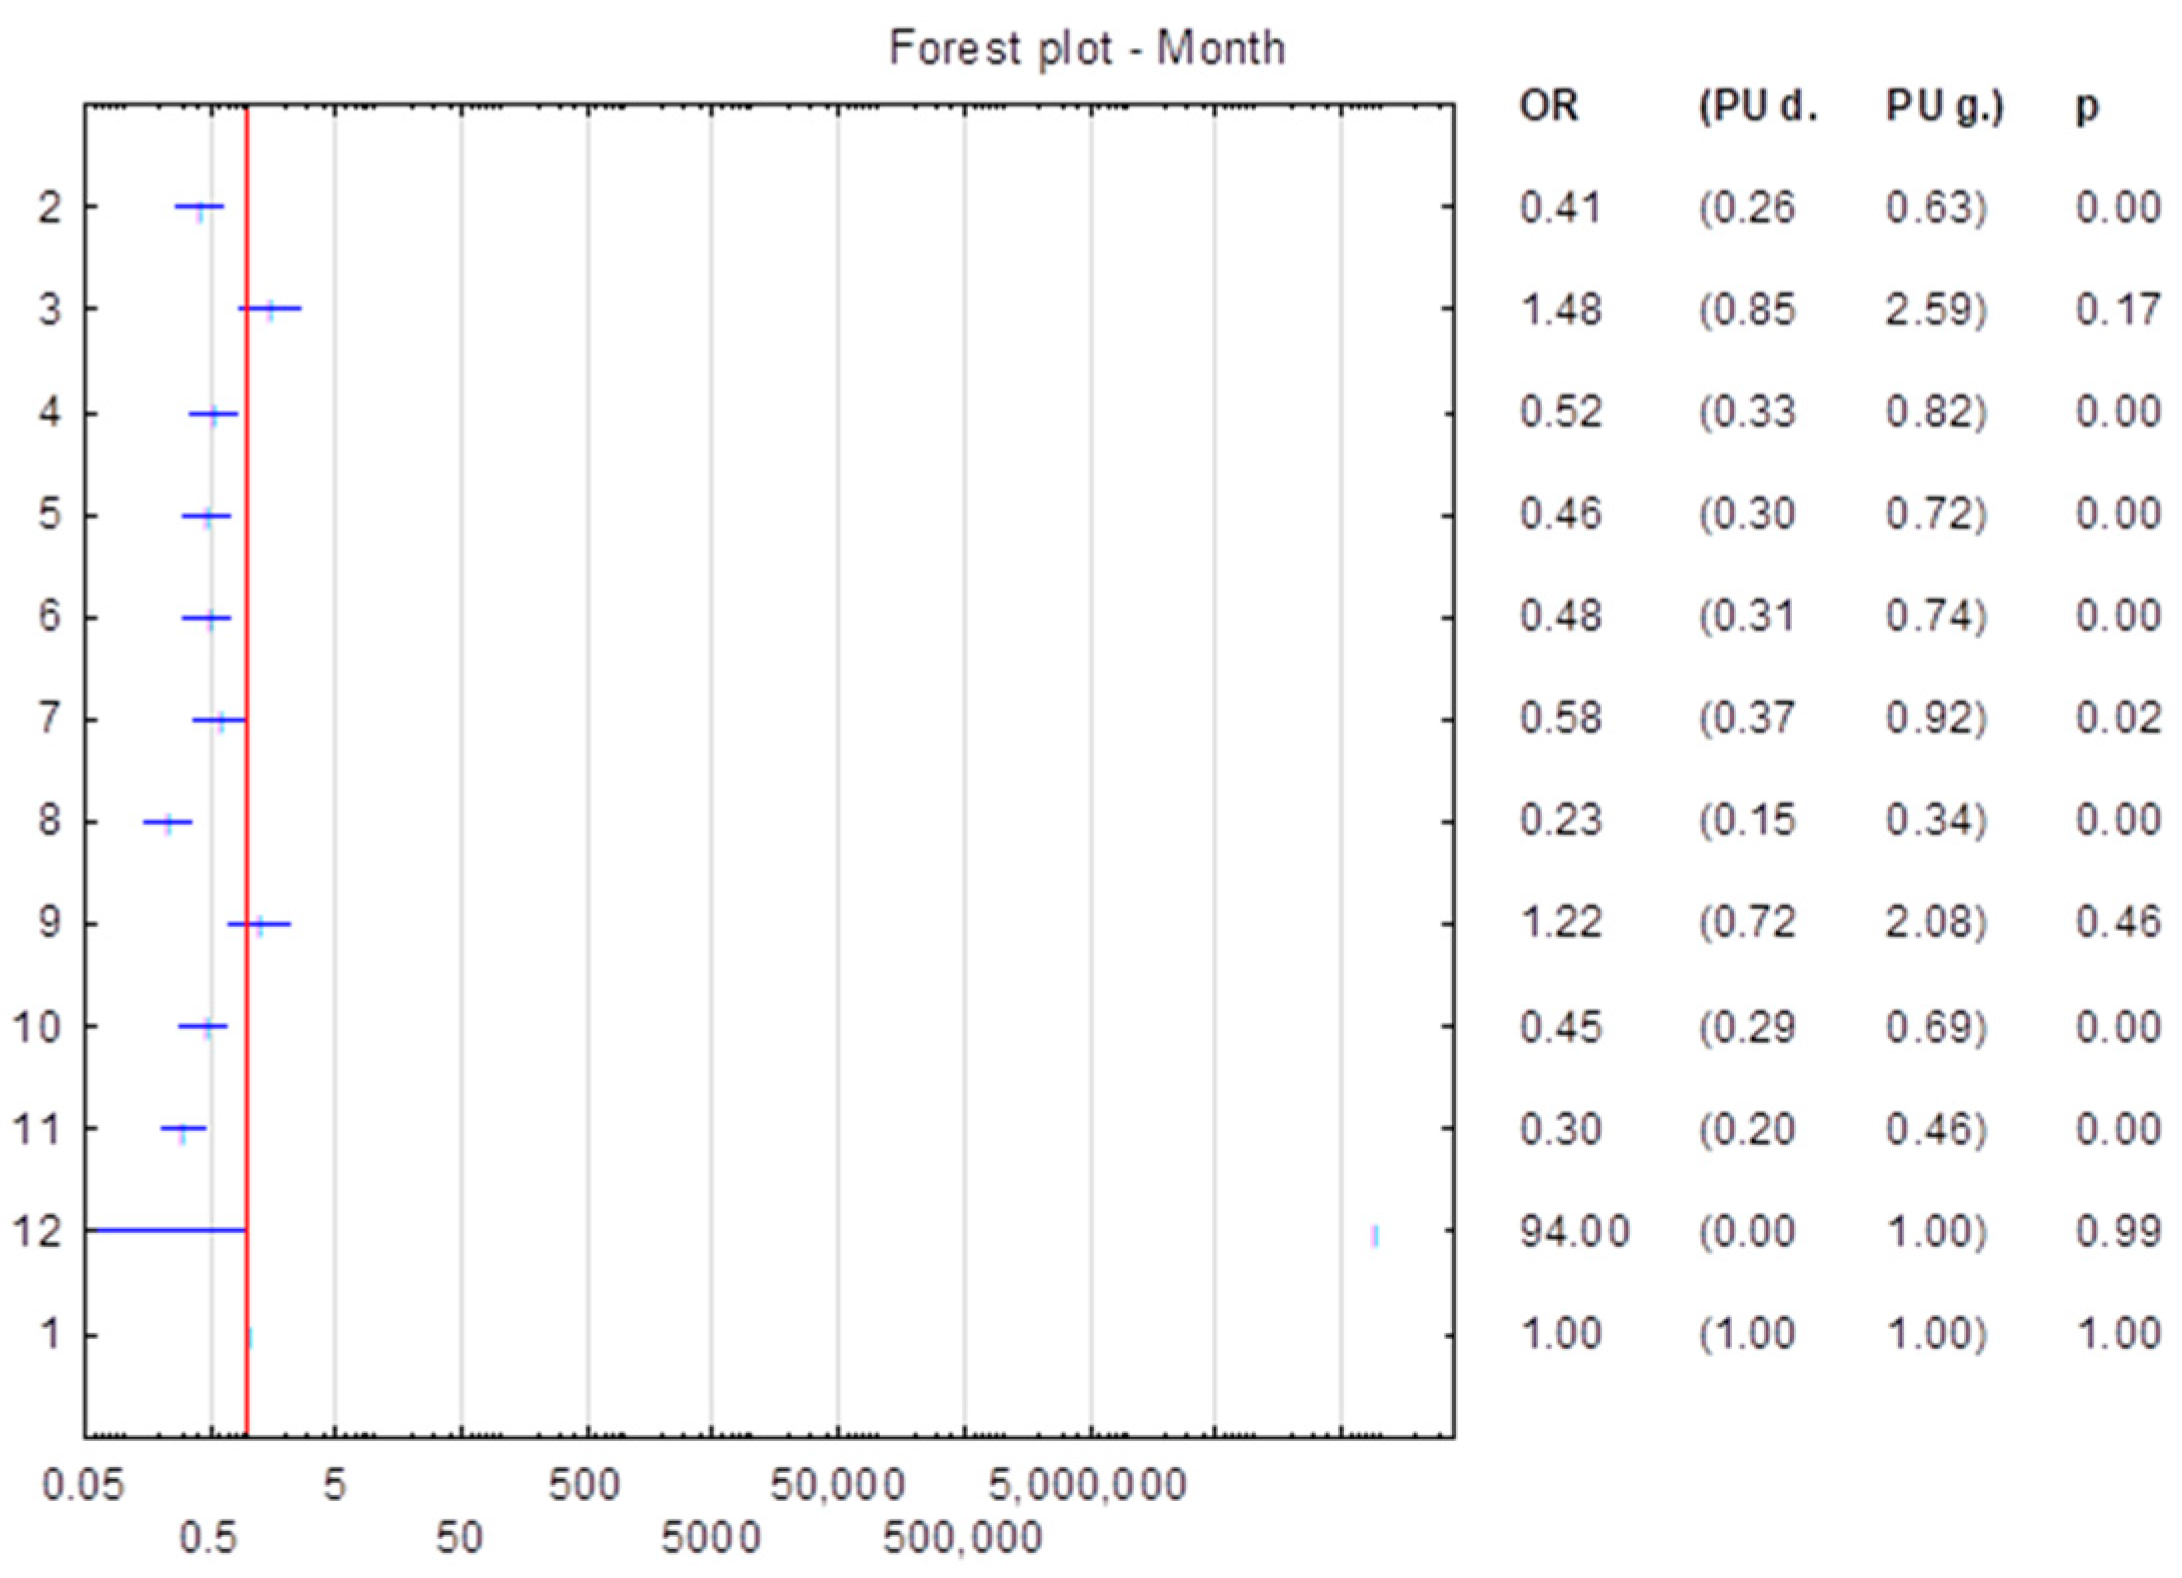
The next step examined the strength of the effect of the qualitative variables on the phenomenon under study and their statistical significance. For this purpose, a forest plot, which shows the odds ratios calculated from the regression parameter evaluations, was used (
Figure 1).
The plot above was made for the odds ratios, which refer to the regression parameter ratings for the month variable. It should be noted that for the month variable, a significant difference of 1 was not found only for the months of March, September and December; therefore, this variable was included in the further study.
The use of a logistic regression model is only possible if the assumption of linearity of the explanatory variables is met. For the selected quantitative variables, a graphical assessment of the scatterplot was performed along with the analysis of the corresponding logarithm of odds values, and a linearity test was performed [
30]. The calculated
p-value indicated that there was no basis to reject the null hypothesis of the linear effect of the studied variables on the analyzed phenomenon (
Table 2).
In the next step, the collinearity of the explanatory variables selected to build the model was checked. For this purpose, the correlation between the quantitative variables was tested (
Table 3). The significance of the correlation is marked in red.
The analysis performed made it possible to isolate two clusters of correlated variables, i.e., fuel consumption and cargo weight, and daily mileage and operating time. Accordingly, it was decided to eliminate the variables fuel consumption and operating time from further analysis.
The next step was to build a multivariate model. For the qualitative variables, parameterizations with an assumed baseline were adopted. Model building was carried out using the backward-step method, which allowed the elimination of irrelevant predictors from the model. The 10-fold cross-validation method, which is an intermediate method between strategies based on splitting the data set into a training and a testing sample and the LOO (leave-one-out) strategy, was indicated as a way to validate the model. It involves dividing the sample into 10 subsets, each of which acts as a subset of the observations used to calculate the prediction errors. The global error score is the average of the values from each subset.
The estimated values of the model parameters are presented in
Table 4. On the other hand, the results of the LR test for the significance of the model parameters are shown in
Table 5.
All the estimated model parameters proved to be statistically significant. In the case of the
month variable for March, April, September and December, the calculated value of the Wald statistic and the corresponding
p-value were greater than the adopted significance level of 0.05, so they will be eliminated from the model. The equation of the logistic regression model takes the following form:
The equation presented above can take the equivalent form of the odds presented in (11) below:
Finally, the goodness of fit of the model was tested based on a comparison of predicted and observed values. For this purpose, the Hosmer–Lemeshow (HS) test was used. The HS test is based on comparing the incidence count of the modeled class with its actual realization. The null hypothesis is that the observed and expected counts are not different. The calculated p-value of the HS test was 0.42 and did not warrant the rejection of the null hypothesis, indicating that the model is a good fit for the data.
Next, calculations were made of the odds ratios that the order would be profitable when the various parameters associated with the operation of the vehicle were met. The sign next to the calculated parameter values indicates whether the analyzed factor is a stimulant or a destimulant of the odds of the phenomenon under study.
The calculated odds ratio values (
Table 6) indicated that each of the model parameters significantly affects the profitability of a transport order. In terms of daily vehicle mileage, the odds ratio indicated that with each additional kilometer driven, the probability of an order being profitable increases by 1%. When considering driving speed, it was estimated that as its value increases by 1 km/h, the probability of order profitability decreases by 3%. In contrast, an increase of 1 kg of cargo weight makes the odds of profitability of an order increase by 9%. This is because the increase in freight rates is a result of the increase in the weight of goods carried. With regard to the month of order execution, it is inferred from the results that, with reference to January, the probability of order profitability is 0.55 times lower in February, 0.36 times lower in May, 0.45 times lower in June, 0.54 times lower in July, 0.21 times lower in August, 0.36 times lower in October and 0.23 times lower in November.
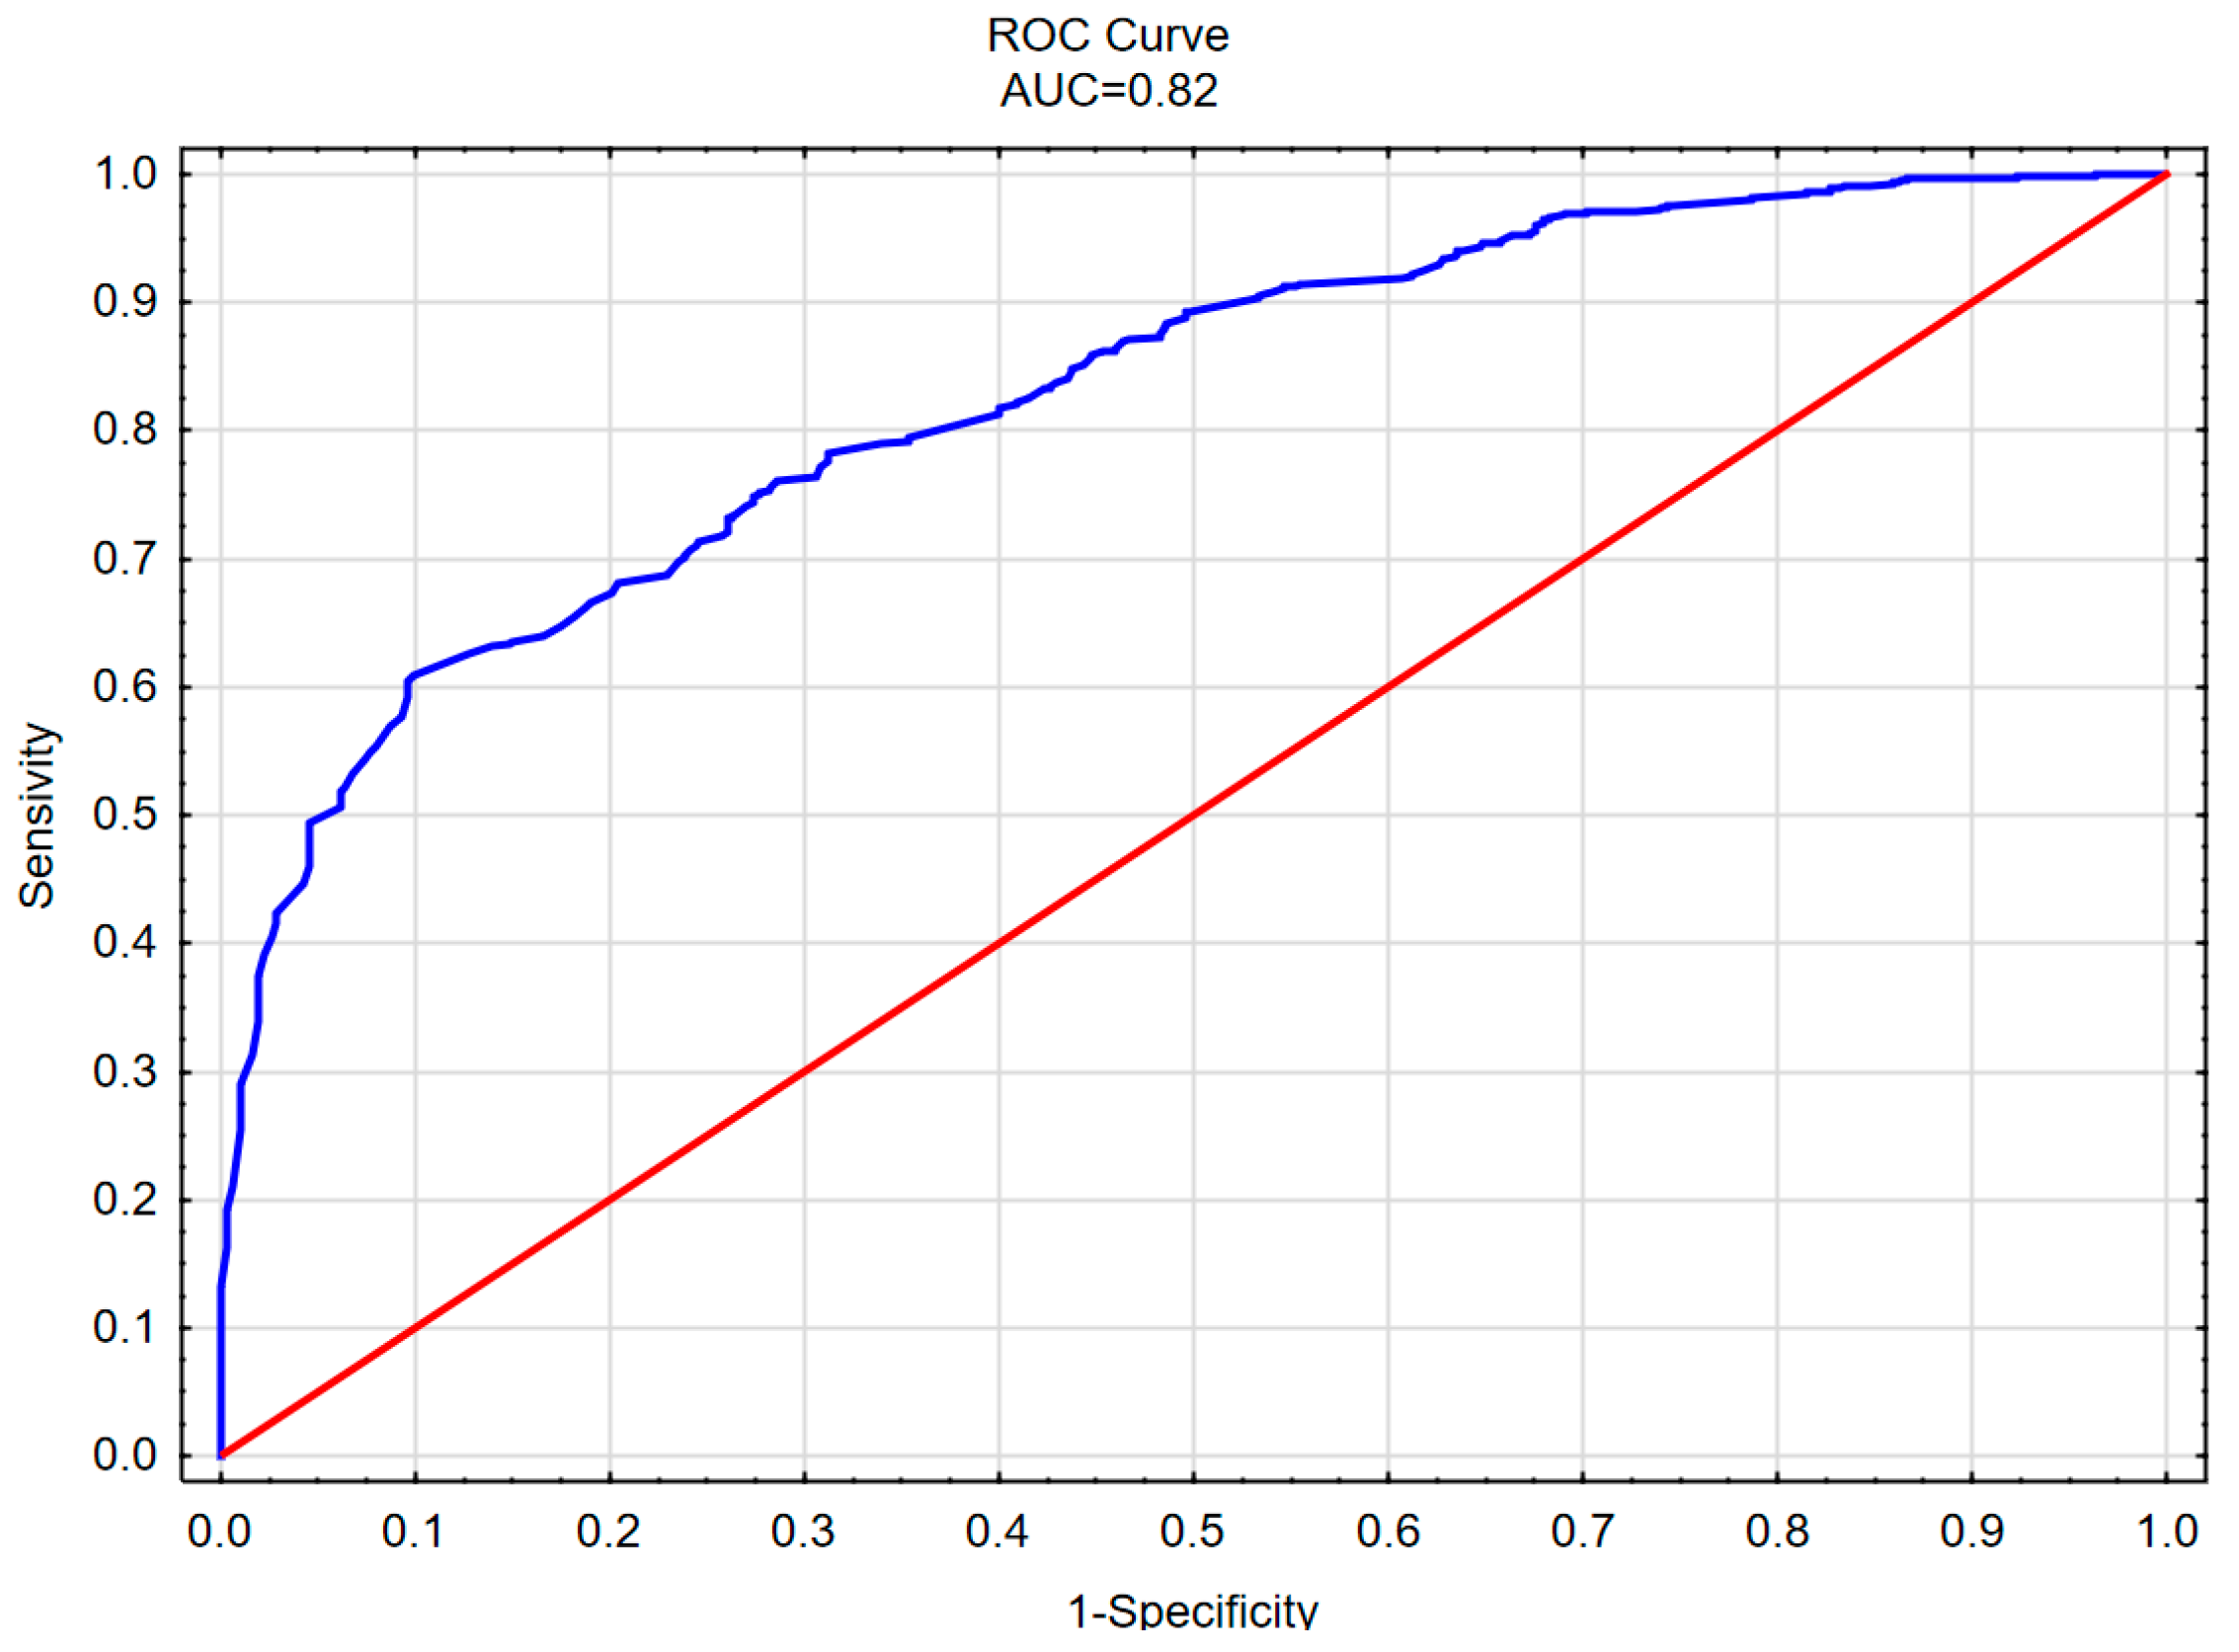
The developed model can be used to predict the profitability of a transport order depending on the parameters of its execution, so an evaluation of the quality of the prediction was carried out. For this purpose, an ROC curve was plotted, with the AUC, or area under the ROC curve, being the most important parameter for evaluation. It takes values from 0 to 1. The larger the area under the curve, the greater the discrimination of the model, for the evaluation of which Kleinbaum and Klein proposed the following classification (
Table 7) [
31,
32].
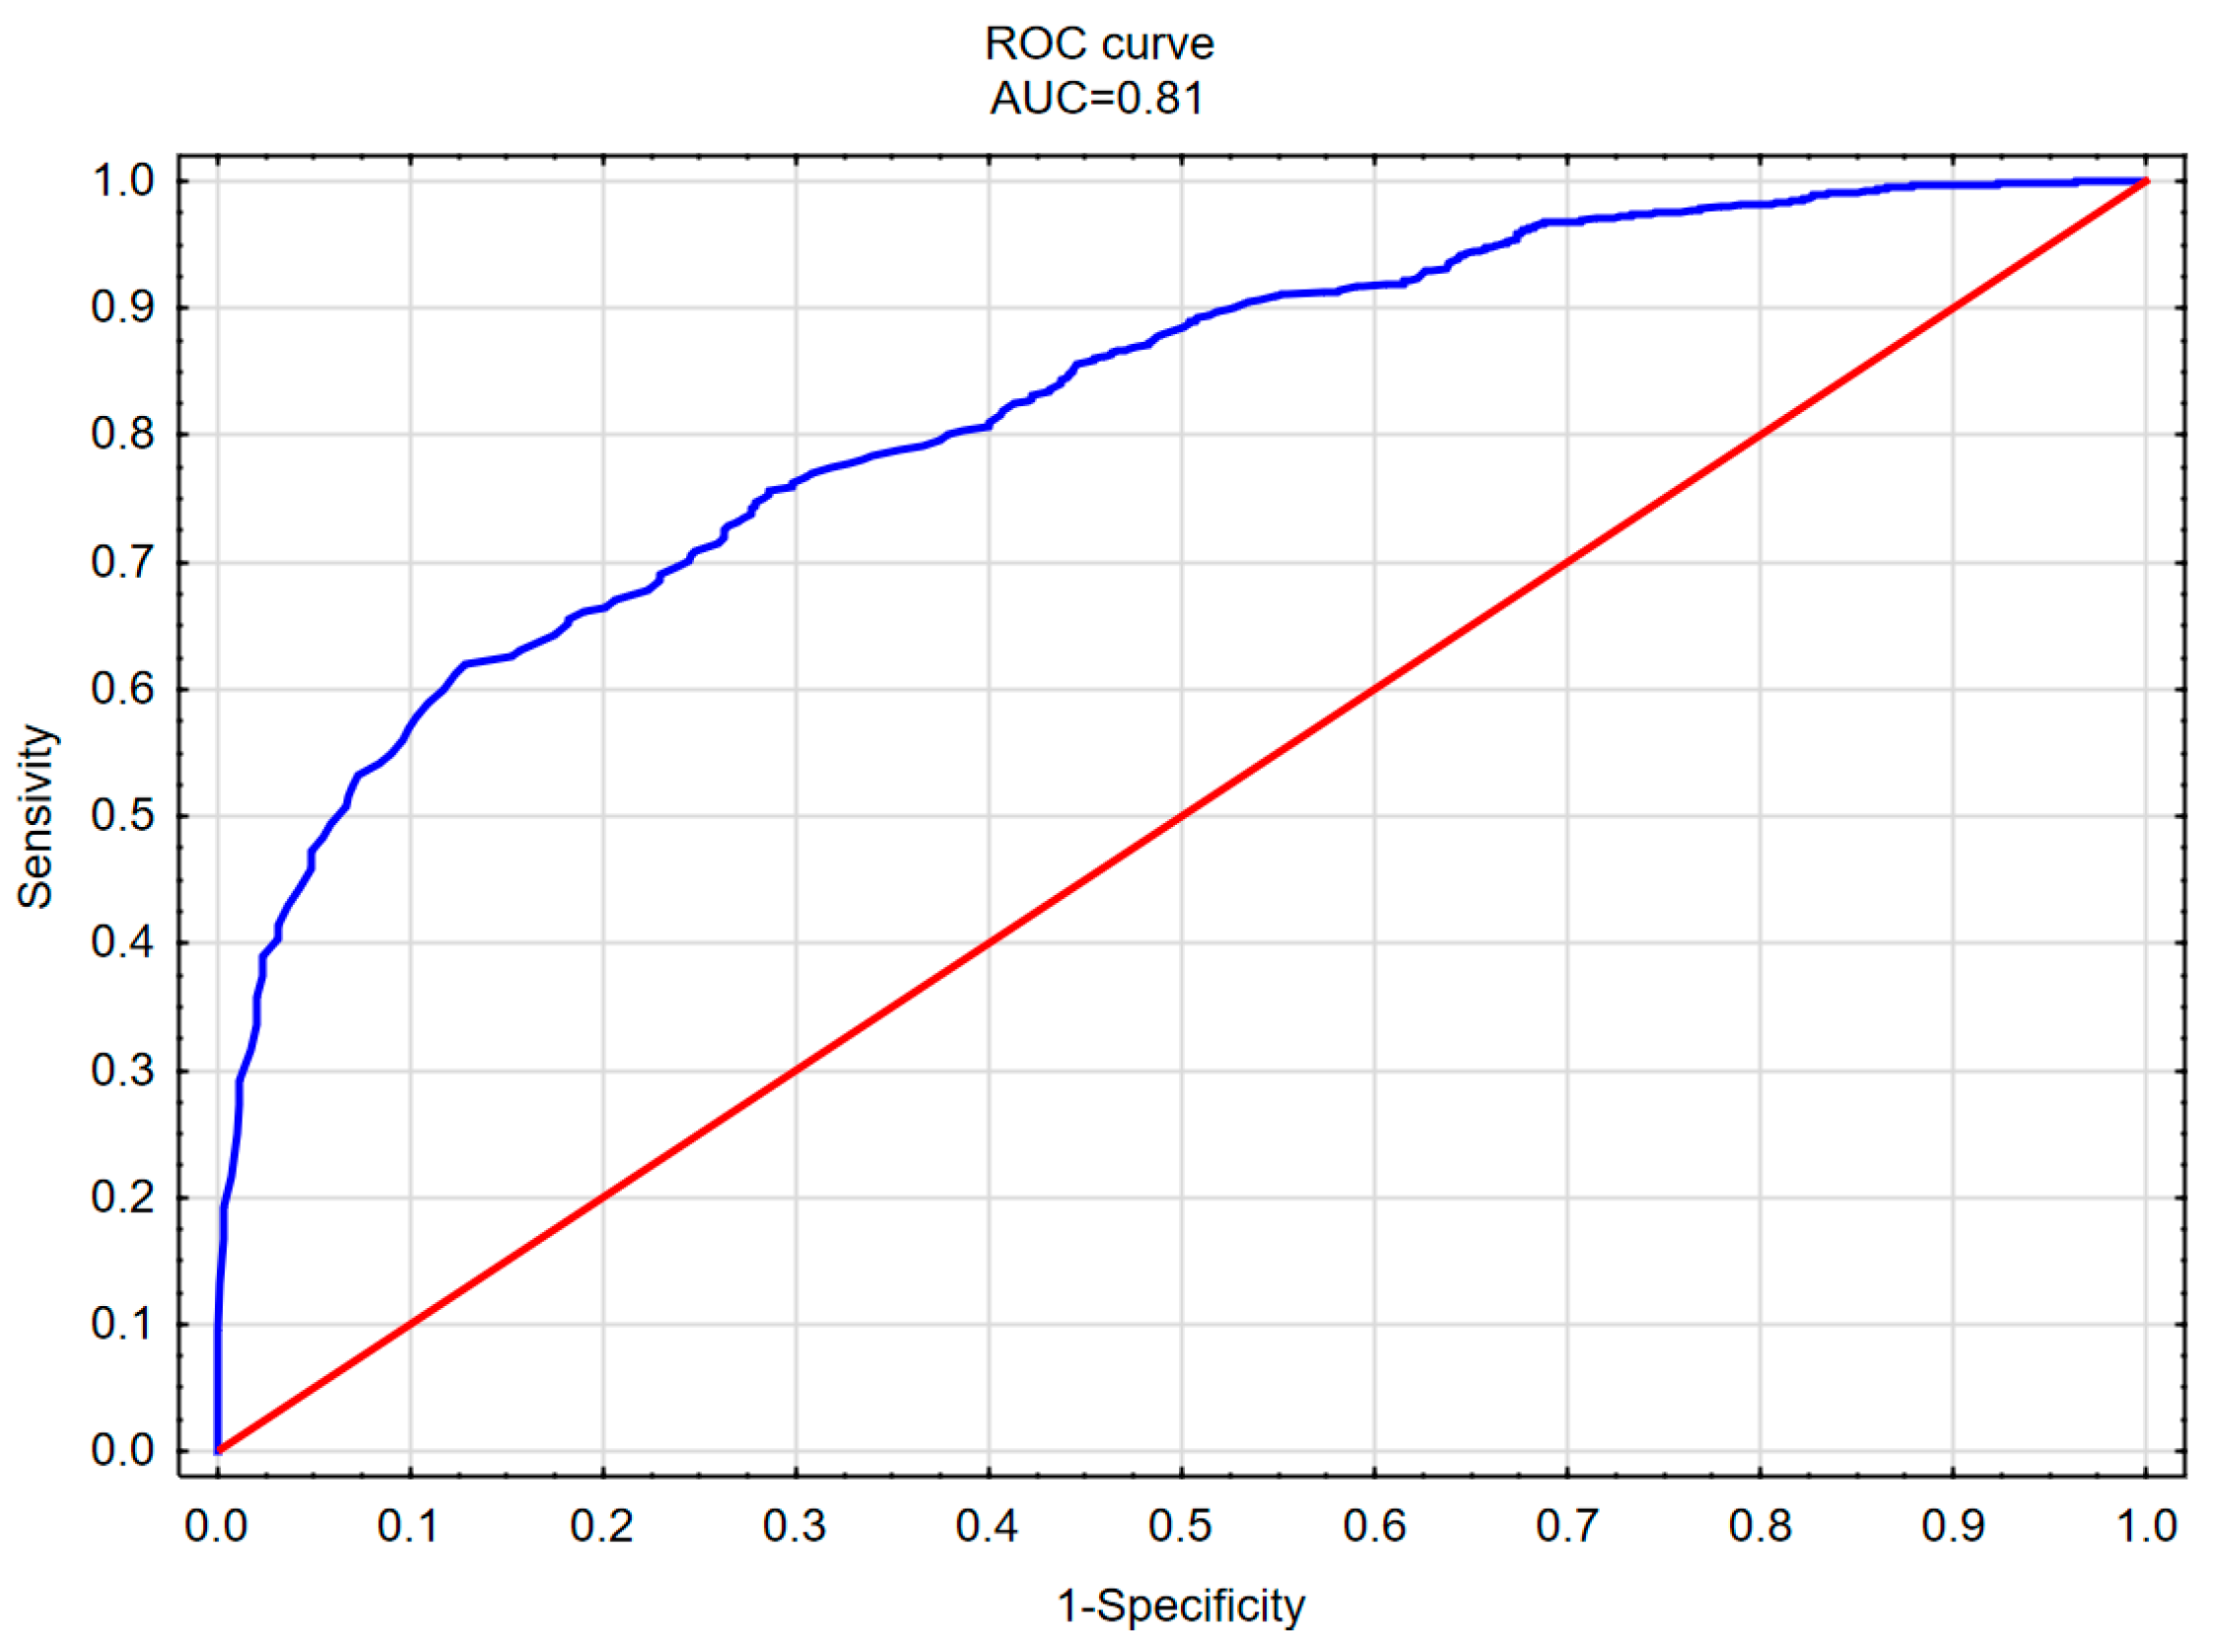
As cross-validation was used to validate the model, ROC curves were plotted separately for the training and testing sample sets and AUC areas were calculated (
Figure 2 and
Figure 3). In addition, a cut-off point and a classification matrix of actual and model-indicated observations were determined (
Table 8 and
Table 9).
The calculated AUC values for each set were 0.82 for the training set and 0.81 for the testing set, which allows us to conclude that they are characterized by sufficient discrimination. This demonstrates both sufficient adaptation to the data and sufficient quality of the model when new data come in. In addition, the calculated AUC values were close to each other (the difference between them did not exceed 0.05), which allows the model to be considered correct.
For the proposed cut-off point, the sensitivity was 0.619 and the specificity was 0.129. There were 8281 correctly classified cases (7693 positives and 588 true negatives) and 4820 misclassified cases (87 false positives and 4733 false negatives). This allows the built model to be considered correct.
This literature analysis has shown that there are a number of studies on the economic efficiency of vehicles, but they are conducted for trucks weighing more than 9.5 tons. However, there is a lack of research on fleets of light commercial vehicles with a load capacity of up to 3.5 t. However, there are several studies that have examined the profitability of transport orders. Research available in the literature indicates, similarly to the study above, that profitability is influenced by the length of the transport route, increasing the probability as the transport distance increases [
28]. It was also indicated that increasing the transported load increases the probability of making a profit, which is also consistent with the results obtained (an increase in fuel consumption increases the probability of profitability). Similar results were also obtained using other mathematical models and ratio analysis methods for vehicles with a load capacity of over 60 t [
33] and for orders acquired from the transport exchange market [
34]. It should be noted that despite the differences in the load capacity of trucks, similar results were obtained.
5. Conclusions
The study presented in this article was conducted on the basis of data on the execution of transport orders by SME enterprises in the FMCG industry. It was prompted by the peculiarities of the industry’s operation and their impact on the profitability of orders.
The purpose of this article was to develop a model for evaluating the profitability of transport orders based on selected parameters related to vehicle operation. It was made using the value of the order and the costs it generates, thus indicating how the selected parameters affect the risk of loss for transportation enterprises. Based on the results obtained, it can be concluded that each of the selected parameters related to operation significantly affects the profitability of a transport order. In terms of daily vehicle mileage, the odds ratio indicated that with each additional kilometer driven, the probability of an order being profitable increases by 1%. When considering driving speed, it was estimated that as its value increases by 1 km/h, the probability of order profitability decreases by 3%. In contrast, an increase of 1 kg of cargo weight makes the odds of profitability of an order increase by 9%. This is because the increase in freight rates is a result of the increase in the weight of goods carried. With regard to the month of order execution, it is inferred from the results that, with reference to January, the probability of order profitability is 0.55 times lower in February, 0.36 times lower in May, 0.45 times lower in June, 0.54 times lower in July, 0.21 times lower in August, 0.36 times lower in October and 0.23 times lower in November.
SMEs do not have large budgets, so they often cannot invest in advanced software to support the management of transportation processes. In addition, the nature of the FMCG industry and the low price of the products sold force costs to be reduced to a minimum. Therefore, the developed tool, due to its simple form and ability to easily draw conclusions, can be an ideal tool to support decision-makers at the stage of accepting and pricing transport orders.


 ,
, 
