Article

A Bi-Objective Mixed-Integer Linear Programming Model for a Sustainable Agro-Food Supply Chain with Product Perishability and Environmental Considerations

1
Department of Industrial and Manufacturing Engineering, Egypt-Japan University of Science and Technology (EJUST), Alexandria 21934, Egypt
2
Production Engineering Department, Faculty of Engineering, Alexandria University, Alexandria 21544, Egypt
*
Author to whom correspondence should be addressed.
Logistics 2023, 7(3), 46; https://doi.org/10.3390/logistics7030046
Submission received: 3 May 2023 / Revised: 1 June 2023 / Accepted: 14 July 2023 / Published: 29 July 2023

Abstract

:
Background: Agro-food supply chains possess specific characteristics due to the diverse nature of products involved and contribute to all three pillars of sustainability, making the optimal design of a sustainable agro-food supply chain a complex problem. Therefore, efficient models incorporating the unique characteristics of such chains are essential for making optimal supply chain decisions and achieving economically and environmentally sustainable agro-food supply chains that contribute to global food security. Methods: This article presents a multi-objective mixed-integer linear programing model that integrates agricultural-related strategic decisions into the tactical design of an agro-food supply chain. The model considers transportation, inventory, processing, demand fulfilment, and waste disposal decisions. It also accounts for seasonality and perishability, ensuring a comprehensive approach to sustainability. The model aims to maximize the total generated profits across the supply chain while simultaneously minimizing CO2 emissions as a measure of environmental impact. Results: By implementing the model on a sugar beet supply chain in the Netherlands, strategic crop rotation farm schedules for the crop rotation cycle and the optimum supply network decisions are obtained. Furthermore, different objectives are analyzed and the Pareto-efficient frontier is investigated to analyze the underlying trade-offs. Additionally, the model serves as a decision support tool for managers facilitating informed investment decisions in technologies that prolong product shelf life while maintaining profitability. Conclusions: The proposed multi-objective model offers a valuable framework for designing economically and environmentally sustainable agro-food supply chains. By aligning with sustainability goals and providing decision support, this research contributes to enhancing global food security and promoting sustainable resource utilization.

1. Introduction

The current infrastructure of food supply chains (FSCs) is responsible for the significant inefficiencies in food production [1]. A primary driver of these inefficiencies is the generation of waste along the FSC, which results in the loss of invested resources, capital, and labor [2]. Studies estimate that approximately one-third of all food produced for human consumption is lost or wasted globally [3], leading to widespread food insecurity and malnutrition, affecting around one billion individuals worldwide [4].
The effectiveness of FSCs in terms of economic and environmental performance is heavily influenced by the configuration of the supply chain (SC), including factors such as the mode of transportation, facility design, location, and type [2]. As such, it is crucial to reassess and redesign FSC configurations to eliminate inefficiencies wherever possible, to ensure sustainable and efficient food security for a growing global population [2].
FSCs can be categorized based on several criteria due to the diversity of food products [2]. These criteria include differences in shelf life, with food products classified as either short and perishable or long and non-perishable, as well as the product’s origin, with food products categorized as animal or plant-based. Additionally, FSCs can be classified according to the processing of food products, with products being categorized as either fresh without any processing or processed. Finally, FSCs can also be categorized based on the industry, with products being classified as either agro-food or manufactured food [2].
This article investigates the strategic and tactical modeling and design of a supply chain network (SCN) configuration for the agro-food industry, the main concern of which is the conversion of agro-materials and crops into a set of finished products [2]. As agro-materials are the foundation of this industry, the design of an agro-food supply chain (AFSC) must take into account the unique characteristics of these materials, including planting and harvesting decisions, the seasonality in yield and demand, and the perishability of crops and products, as well as the effects of processing on product perishability [2,5]. Thus, obtaining an optimal SCN configuration for AFSCs that considers both economic and environmental sustainability dimensions is a complex problem that is more difficult to manage than that of other SCs, given the distinctive characteristics of agro-food products and processes [2,6].
An AFSC encompasses a series of interdependent processes, including crop cultivation, harvesting, transportation, processing, storage, and distribution to customers. In the initial stage of the AFSC, cropping decisions involve allocating agricultural land to specific crops, appropriate planting and harvesting schedules, and providing necessary resources and equipment for planting [7]. In addition, some crops need to be grown in a rotation to sustain crop yield and preserve soil quality [8]. Therefore, a well-designed crop rotation schedule is essential to be adequately planned in an AFSC. Crop rotation is defined as the sequential cultivation of different crops in a specific order on the same land, aiming to decrease the usage of synthetic fertilizers and pesticides [9].
Inadequate planning of upstream activities, such as cropping decisions, can adversely affect downstream activities, resulting in the production of wastes along the supply chain, a loss of resources, and greenhouse gas (GHG) emissions. Hence, this negatively impacts economic and environmental objectives.
In an AFSC, the proper planning of cropping and harvesting decisions is critical. Crops have a specific growing season, and harvest timings depend on the maturity period of each crop. Therefore, it is essential to plan these decisions accurately to ensure the necessary service levels and maintain the AFSC’s efficiency and responsiveness in an economically and environmentally sustainable manner. To achieve this, cropping and harvesting decisions should be integrated into AFSC planning and design with a vision to process products at the right time with the right quantities. However, according to Kusumastuti, van Donk, and Teunter’s (2016) literature review, there are limited models that integrate harvesting and processing decisions [10]. This indicates a need for more research in this area to optimize AFSC performance.
FSC actors contribute to climate change by focusing on economic sustainability to maximize profits while paying less attention to environmental sustainability and neglecting environmental externalities [11]. In this regard, the agro-food sector has emerged as one of the primary sources of human-induced GHG emissions, where 31% of these emissions in 2019 were attributable to the world’s agri-food systems [12]. Given the significant environmental implications of AFSCs, decision support tools that address the economic and environmental aspects of sustainability while considering trade-offs between these conflicting objectives are critical for designing sustainable AFSCs [13].
Multi-objective optimization is valuable for achieving a favorable balance or trade-off between economic and environmental objectives [14]. This approach yields eco-efficient solutions (i.e., solutions in which it is impossible to improve environmental performance without negatively affecting the economic objective [15]).
In this article, we present the main contributions of our research, which focuses on the design of a sustainable AFSC using multi-objective optimization. Our approach integrates strategic decisions at the agricultural stage with tactical decisions in the SCN to achieve economic and environmental sustainability. The key contributions of our work are as follows:
  • The development of a mixed-integer linear programming (MILP) model for AFSC design;
  • The integration of crop rotation planning into SC design, considering factors such as crop allocation and the timing of harvesting;
  • The incorporation of tactical decisions in the SCN, including transportation, storage, processing, demand fulfillment, and waste management;
  • The consideration of seasonality of yield and demand, as well as the perishability of crops and products;
  • An analysis of multiple cropping seasons through a rotation cycle.
These contributions highlight the novel aspects of our research and the value it brings to the field of sustainable SC design. By considering both economic and environmental dimensions, our approach offers insights and strategies for designing AFSCs that are economically efficient while minimizing their negative environmental impact.
This article is structured as follows. Section 2 presents a survey of the relevant literature. Section 3 provides a detailed description of the studied problem. Section 4 describes the proposed mathematical model to solve such a problem, and the case study to which the model was applied is explained in Section 5. The case study results are presented and analyzed in Section 6. Eventually, Section 7 concludes the work done and provides an insight into the directions of future work.

2. Literature Review

The literature was reviewed using the following keywords: agro-food supply chain, agro-food supply chain design, and crop rotation planning. The reviewed research articles were identified by searching on various search engines such as Google Scholar and Egyptian Knowledge Bank (EKB). In addition, searches were performed on different databases to obtain the most relevant research studies related to the design of an AFSC. These databases are, for instance, Elsevier, Springer, IEEE, Taylor and Francis, and Wiley. Almost 36 research articles published in the period between 2004 and 2023 were reviewed; 15 of these articles were directly related to AFSC design and were carefully investigated to identify the potential search directions, possible research gaps, and the recent studies related to the problem.
This section investigates the most relevant articles to the design of an AFSC with an integrated approach of accounting for the crop rotation problem as one of the considerations in the design of an AFSC. In addition, a survey of the work related to the modeling of the special features of agro-materials is provided.
The AFSC is a well-established research direction in the literature with many review articles discussing its distinguished characteristics [7]. However, research in AFSC design is still scarce, even though research interest in such a topic has grown [16]. Most models are for mono-product AFSCs, yet multi-product models receive more interest as the literature of the last two years indicates [16].
To obtain insights into the previous work done in the AFSC, an analysis was conducted through the Scopus database from Elsevier. To guarantee accurate results, specific keywords which are closely related to the article’s main concern were used to cover as many relevant aspects as possible. Therefore, the following combination was used: “Agro-food supply chain”, “agro-food”, “food supply chain” and “agro-food industry”. The analysis was conducted considering the research articles published between the period from 2004 to 2022 to be able to obtain accurate insights into the changing trend of the AFSC research. From the geographical perspective, all the countries were considered. Document types considered for this analysis were articles, conference articles, review articles, book chapters, books, and conference review articles.
Figure 1 summarizes the conducted analysis and shows the published documents per year in the AFSC topic. The graph shows that the interest in the AFSC has grown over time. The duration from 2005 to 2013 makes a slight contribution to the topic as there was zero to one published document. The period from 2015 to 2018 is a fluctuation period while the year 2021 represents the peak of the research conducted in the field of the AFSC. Therefore, such a graph indicates the importance of the research in the AFSC area.

2.1. Special Features of AFSCs

According to Lucas et al., 2004, AFSC relies on agro-materials which exhibit seasonality and regional differences as one of its main characteristics [17]. Cultivating crops is subject to seasonal variations because of its inherent nature [17]. Moreover, yield and quality vary from one region to another for a given commodity due to interregional disparities in climate, quality of soil, and agricultural techniques [17].
Jonkman et al., 2019, stated that cultivated crops are only available in a certain area of land for a limited period in which they must be harvested. Also, the yield and quality of the harvested crop depend on its maturity, weather conditions and the naturally varying crop itself [2]. Therefore, the supply in AFSCs is time- and region-dependent, and uncertain in terms of time, quantity, and quality [2].
Rong et al., 2011, found that the quality of food products degrades over time and is dependent on environmental conditions of storage and transportation facilities [18]. De Keizer et al., 2017, declared that minimum product quality thresholds are required at different nodes of the SC. Therefore, quality decay should be considered in the design of the SCN configuration [19]. Thus, accounting for perishability is essential in the design of AFSCs [2].
In the literature, perishability is modeled using fixed shelf life or decay functions (e.g., a certain percentage of products expires every period, or the quality degrades based upon an underlying distribution and products below a minimum quality threshold are considered expired and wasted) [2]. Shelf-life is defined by the Institute of Food Science and Technology of the United Kingdom (1993) as “the time during which the food product will remain safe, be certain to retain the sensory, chemical, physical and microbiological characteristics, and comply with any label declaration of nutritional data [20]”.

2.2. The Design of AFSCs

Akkerman et al., 2010, Lucas and Chhajed, 2004, and Soto-Silva et al., 2016, reviewed the decision support models used for the design of AFSCs and other FSCs [6,17,21]. In addition, they also found that a deficiency in the models that consider the specific characteristics of FSCs exists [6,17,21].
Kusumastuti et al., 2016, concluded that limited work has been carried out regarding the development of integrated approaches to model harvesting and processing in AFSC [10]. The same conclusion was reached by Jonkman et al., 2019 [2]. Moreover, as an alternative to the integrated approach, most articles involve the use of the sequential approach, solving harvesting decisions and then the SCN configuration-related decisions [2].
Furthermore, the seasonal variability in supply is not often considered in the design of AFSCs, and the availability of raw materials when required is generally considered an assumption according to Jonkman et al., 2019 [2].
Regarding the perishability aspect of agro-materials, according to van Elzakker et al., 2014, ignoring the shelf life in the tactical planning problem involves several risks (e.g., a portion of the inventory could exceed its shelf life, resulting in disposal costs as well as a risk of losing sales due to the reduced inventory which may not be sufficient to meet the demand) [22]. Accordingly, it is essential to consider shelf life limitations in the tactical planning problem which, in contrast, has received only limited attention in the literature [22].
A survey of the work carried out in the modeling of AFSC design is classified in the following subsubsections based upon the studied objective which incorporates one or more dimensions of sustainability.

2.2.1. Economic Objective

The following surveyed articles represent research studies that were conducted to design AFSCs which optimize an economic objective (e.g., profit maximization or cost minimization) under different considerations, as will be discussed.
Esteso et al., 2021, investigated the impact of product perishability on an AFSC design by presenting a MILP model to design entire AFSCs with multiple products considering capacity, planting, harvesting, transportation and perishability constraints for a multiple-period horizon while maximizing SC profits. A set of scenarios was studied through varying products’ shelf life, which demonstrated that product perishability affects the design of AFSCs, especially for products with a short shelf life. This means that accounting for perishability improves the AFSC’s economic performance. The model can also determine the maximum investment that can be made to extend product shelf life while remaining profitable [16].
Accorsi et al., 2016, considered the FSC an ecosystem by defining more inclusive boundaries for the SC. A design framework that supports strategic decision making was presented, which incorporates a linear programing model for the design of AFSCs involving a land network problem that merges land use allocation and location allocation problems while minimizing the total fixed and variable costs of the agro-food ecosystem. The economic and environmental trade-offs were analyzed by comparing scenarios in which environmental constraints were either enforced or relaxed. These constraints enforce a zero-carbon ecosystem where overall emissions associated with crops and logistics activities must either be offset through sequestration from forestation or renewable energy usage, and they also limit the supply of energy to renewable energy sources [11].
Fikry et al., 2021, presented a strategic tactical planning model for the sugar beet SC through formulating a binary integer programing model to minimize the overall operational cost, including the transportation and inventory of processed and non-processed beets. The proposed model integrates agricultural and industrial decisions coupled with the transportation of crops by capacitated vehicles from farms to processing facilities. The agricultural decisions incorporated crop planting and harvesting decisions where crop rotation planning between different cropping seasons was studied. In addition, the key industrial decisions incorporate aggregate production plans for processing harvested beet, as well as managing the shipping and storage of processed and non-processed beets in the processing facility [7].
Hajimirzajan et al., 2021, proposed a multi-stage MILP model to minimize the total cost of a large-scale strategic crop rotation planning problem integrated with the design of an AFSC, identifying important tactical decisions (e.g., cultivated, stored, and transported quantities). The main considerations of the proposed model are agricultural allocation through deciding the best climatic conditions essential for a high crop yield, product perishability and demand-related considerations [23].
Sinha et.al., 2020, proposed a model for minimizing the total cost of SCs while considering product perishability through addressing the selection of the optimal ordering policy from a pool of ordering policies at the retailer’s end. The suggested model would serve as a decision making tool on an operational level for merchants when placing perishable product orders, based on stock inventories and perishable product allocation according to shelf life [24].
Fikry et al., 2021, studied the agricultural stage of an AFSC in a standalone manner and proposed a mathematical model that optimizes crop rotations while considering uncertainties in water and net return, aiming to maximize the farmer’s total net return during the rotation cycle. The model incorporated robust optimization techniques to provide a more resilient solution for crop rotation planning. The model was applied to a case study in Kansas, USA, which demonstrated the model’s effectiveness in providing robust solutions for crop rotation planning [25]

2.2.2. Economic and Environmental Objectives

The following surveyed articles represent research studies that were conducted to design AFSCs which simultaneously optimize economic and environmental objectives (e.g., profit maximization and CO2 emission minimization) under different considerations as will be discussed.
Jonkman et al., 2019, presented a mathematical model formulation for the strategic design and tactical planning of an AFSC integrating harvesting decisions as well as considering the role of seasonality, perishability, and processing. The model accounted for forward and backward flows along the chain while maximizing the total gross margin and minimizing the global warming potential in CO2-eq. The Pareto-efficient frontier using the ϵ -constraint method in addition to a stochastic version of the model addressing uncertainties in demand and harvested yield were explored. Applying the model to the sugar beet processing chain in the Netherlands showed that considering such unique characteristics (e.g., seasonality, perishability, and uncertainty) yielded better-performing supply chain configurations in terms of both the economic and the environmental objectives [2].
Banasik et al., 2019, proposed a multi-objective two-stage stochastic programing model to account for uncertainty in AFSCs while optimizing the economic and environmental impacts. The model was illustrated using a mushroom SC in the Netherlands as a case study. The optimal decisions from the stochastic model were compared with the results of an equivalent deterministic model, and the results showed that accounting for stochasticity in yield and demand can reduce the difference between expected and realized economic performance by approximately 4% on average. Moreover, the presented stochastic model can reduce the environmental impact without compromising the current economic performance [13].
Recent work by Shokouhifar et al., 2023, focused specifically on the phosphorus fertilizer supply chain. The study proposes an ensemble algorithm that integrates knowledge-based heuristics and metaheuristic optimization techniques to develop an efficient and environmentally friendly network [26]. This work aligns with the broader objective of achieving sustainability in agro-food systems by emphasizing renewable resource utilization and reducing ecological footprints. Comparatively, while crop rotation planning primarily focuses on enhancing soil quality and pest management, this research contributes to the sustainable agro-food supply chain literature by addressing the specific challenges of phosphorus fertilizer management, optimizing efficiency, and reducing environmental impact throughout the supply chain network.

2.2.3. Economic, Environmental, and Social Objectives

Most research articles neglect to incorporate the social component in sustainable supply chain management, focusing instead on environmental and economic variables, which might be partially due to the difficulty in measuring and determining the essential social components [27].
The following surveyed articles represent research studies that were conducted to design AFSCs which simultaneously optimize economic, environmental and social objectives (e.g., minimizing cost, minimizing CO2 emissions and maximizing product freshness) under different considerations, as will be discussed.
Liu et al., 2021, developed an integrated location inventory routing linear programing model for perishable products using a multi-objective model solved using the YALMIP toolbox. The model considered strategic and tactical decisions aiming to optimize the three dimensions of sustainability through minimizing the economic cost, minimizing the environmental impact represented by carbon emissions and maximizing product freshness [28].
Allaoui et al., 2018, focused on optimizing the triple bottom lines for the strategic design of a sustainable AFSC through minimizing the SC total cost, minimizing the resulting carbon footprint, and maximizing the number of jobs created from this SC. A multi-objective linear programing model was developed, and a Pareto frontier was been used for the decision making and trade-off analysis [29].
Sazvar et al., 2018, proposed a multi-objective linear mathematical model for a sustainable AFSC with perishable products considering the three aspects of sustainability. The model mainly emphasized minimizing agro-food cultivation-related climate change by using organic cultivation instead of the conventional form that uses chemicals and pesticides. The main objectives are cost minimization, carbon dioxide emission minimization, and the maximization of consumers’ health level [30].
Taghikhah et al., 2021, developed an integrated model for AFSC design combining agent-based, discrete event, and system dynamics simulations to study the interplay of the consumer behavioral preferences and socio-environmental considerations related to agricultural and food production. The model considered behavioral factors such as farmers’ and retailers’ behavior, social norms, and habits. It also considered the operational factors of the FSC such as lead time, stored and transported quantities, and prices [31].
Rohmer et al., 2019, considered optimizing people’s diet as the social component in their multi-objective research while minimizing the cost of the SCN and its environmental impact. The proposed model was developed to expand the scope of agro-food SCNs under dietary considerations integrating sourcing, processing, and transportation decisions on a tactical operational level [32].
Table 1 summarizes the considerations that received attention in AFSC design. Agricultural decisions and crop rotation are considered two different aspects where crop rotation implies the full crop rotation planning problem and its essential criteria (i.e., planting at least one legume crop during the rotation cycle, the presence of at least one fallow period during the rotation cycle, accounting for the succession of crops from different families, etc.). It is shown that although AFSC topic interest has grown, there are still too many important considerations that need to be considered in an integrated manner to obtain an accurate representative model for AFSC decisions. Furthermore, Table 2 summarizes the methodologies used in the literature to model the design of AFSCs as well as an investigation of the objective functions being studied. As can be seen, linear programing has been the most popular method for tackling the design of AFSCs to reach an optimum SC configuration.

2.3. Research Gaps and Article Contributions

We have identified significant gaps in the existing literature on sustainable AFSC design. These gaps include the following:
  • Inadequate consideration of agricultural decisions in the context of AFSC, such as the seasonality and perishability of crops and the timing of harvesting;
  • Insufficient attention to the design of an AFSC for multiple products with different planning levels over a multi-period planning horizon;
  • Limited focus on optimizing the environmental dimension of sustainability in an AFSC.
To address these gaps, this article makes the following contributions.
  • It proposes a novel strategic tactical decision support planning model that integrates agricultural decisions represented in strategic crop rotation schedules, with the tactical design of an AFSC that includes transportation, inventory, processing decisions, and waste disposal;
  • It accounts for the seasonal variability of agro-materials and the perishable nature of non-processed and processed products by directly incorporating shelf life constraints while simultaneously maximizing profits across the entire SC and minimizing the negative environmental impact represented in CO2 emissions.
Overall, this article provides a valuable framework for sustainable AFSC design by integrating the economic and environmental dimensions of sustainability and addressing important gaps in the existing literature.

3. Problem Description

This section describes the stages of the studied AFSC and the strategic and tactical decisions that the proposed model considers.
As shown in Figure 2, the agro-food SCN studied incorporates three main stages:
  • The agricultural stage;
  • The coupling and transportation stage;
  • The industrial stage.
Figure 2. The studied activities in the design of a sustainable AFSC.
Logistics 07 00046 g002
At every stage of the SCN, a variety of decisions exists that should be planned carefully to reach an optimum SCN with the maximum benefits and minimum loss for all stakeholders of such chains.
Agricultural activities carried out at the early stage of the AFSC have a significant environmental impact, represented by CO2 emissions due to the use of agricultural tools and instruments that contribute to CO2 emissions. In addition, agricultural activities directly impact the fulfilled demand at the end of the SCN, which is directly related to the generated profits across the SCN. Therefore, the agricultural activities should be planned properly to satisfy the associated demand in a timely manner and to minimize the negative environmental impact. These activities include planting, irrigation, harvesting decisions and their associated timings and seasons.
Transportation activities also contribute to both the environmental impact of the AFSC as well as the encountered costs. The types of trucks available in the SCN also affect the number of trips required to ship the harvested crops to the processing facilities due to the differences in the permissible capacity per truck type. Therefore, the fleet used to transport the harvested quantities from plots to processing facilities contributes significantly to CO2 emissions, depending on the number and type of trucks used for transportation activities. Hence, there is a need for an economically and environmentally efficient transportation plan to determine the quantities to be shipped each period, the types as well as the number of trucks to be used, the number of trips required, the associated CO2 emissions, and the route taken (e.g., from which plots to which facilities) to ensure a proper transition from the first stage to the third stage of the SCN with the optimum transportation cost and minimal environmental impact.
Coordination between the agricultural and transportation decisions is crucial in the SCN because the harvested crops should be shipped immediately to the processing facilities not only to provide the raw materials needed for production plans in a timely manner but also to shorten the time those perishable products spend in the SC before being delivered to customers.
The industrial stage incorporates processing the harvested crops to produce finished products and storing the non-processed and processed products inside the processing facility. Processing activities also contribute to CO2 emissions as well as the SC cost. In addition, the period those products remain in the processing facility after being harvested has a significant effect on the age of products. If crops or products stored in the processing facility have exceeded their shelf life before being used to satisfy customer demands, they will be disposed as waste, which not only contributes to CO2 emissions but also causes the loss of the associated resources and costs. Production schedules should be planned properly to secure sufficient supply to meet the product demand in the market while considering the cost as well as the environmental impact of processing, carried inventory, and any generated wastes, if any.
Accordingly, the different stages and special characteristics of the AFSC combines to make the integrated agricultural, logistics and production strategic tactical planning problem a challenging and complicated assignment where improper decisions in any of these stages in the SCN will affect the following activity down to the final consumer.

4. Proposed Mathematical Model

The proposed deterministic multi-objective MILP model considers the strategic agricultural planning decisions through studying the crop rotation planning problem, and the harvesting decisions integrated with the tactical design of AFSCs incorporating transportation, storing, processing, waste disposal, fulfilled demand and lost sales, if any.
The proposed model is an upgraded model formulation of the model presented in the recent publication of Fikry et al., 2021 [7], after accounting for perishability, in terms of direct shelf life constraints and the cost of processing in addition to the generated profits, and introducing a second objective function to minimize the associated environmental impact (CO2 emissions). The model seeks to find the following optimum decisions in the studied AFSC.
  • The selection of plots to be planted as well as the crops to be planted on them in addition to the planting period;
  • The selection of the harvesting period as well as estimating the harvested quantity from each crop in each plot at each period;
  • The calculation of the transported quantity from each farm to each processing facility per period as well as the number of trips needed to transport such quantity;
  • The determination of the processed quantity of products at each processing facility per period;
  • The estimation of the total stored quantity from both non-processed and processed products at each processing facility per period;
  • The determination of the satisfied demand and lost sales, if any.

4.1. Model Assumptions

  • The estimated yield for each crop in each period is known, which mainly depends on the harvested period and its maturation level;
  • The farm consists of homogenous plots of standard sizes; therefore, the obtained yield is the same in any plot;
  • The expected crop yield and irrigation water depend only on the present crop, regardless of the preceding crop;
  • The total annual available water is constant for all the years in the rotation cycle;
  • Each crop has a known deterministic demand in each period;
  • There is no water stored in the soil;
  • The harvested quantity is transported to the processing facility immediately after harvesting in the same harvesting period;
  • Inventory is held at the processing facilities only; hence, there is no inventory on the fields;
  • Processing facilities have a fixed processing capacity;
  • Crops and products which exceed their shelf life are disposed of immediately in the same period;
  • The age of crops used to process a specific product has no effect on its shelf life after processing.

4.2. Model Nomenclature

The following indices and sets are used:
i I Set of crops
j J Set of periods
t T Set of years in the rotation cycle
h i t J Allowable harvesting periods for crop i in year t
f N N Set of crop families where f N 1 represents the legume family and f N represents the fallow periods (unplanted periods)
K K Set of plots
f F Set of processing facilities
v V Set of vehicles
p P i Set of products produced from a specific crop (e.g., P 1 is the set of products produced from crop 1)
a { 0 , 1 , , S L i } Index indicating the age of a crop since its harvesting in periods
A { 0 , 1 , , S L p } Index indicating the age of a product since its production in periods
The input parameters used in the model are summarized as follows:
S i t Starting period of planting crop i in year t , with S i t J
t p i Production time required for planting crop i (maturation period)
E i t Ending period of harvesting crop i in year t , with E i t J
N Number of crop families
Y L D i j k Expected harvested percentage of crop i harvested in period j on plot k (%)
T P i k Optimum yield quantity of crop i planted on plot k (ton/ha)
M i n _ B i t Minimum threshold on the required plots from crop i in year t
M a x _ B i t Maximum threshold on the required plots from crop i in year t
A P Number of plots available per year
W i The required amount of water for irrigating crop i ( m 3 / h a )
A W The total annual available amount of water ( m 3 / y e a r )
f i Planting frequency of crop i during the rotation cycle
f m i Frequency modification factor for crop i
F i The reciprocal of frequency of crop i
T The rotation cycle length in years
TSAnnual time slots
PSNumber of different planting seasons per year
M T i m i n Minimum maturation period for crop i , M T i m i n h i t
M T i m a x Maximum maturation period for crop i , M T i m a x h i t
T C A P v Truck capacity for transporting crops using vehicle v (ton)
N m a x k Maximum number of trips from plot k
V v j Total number of trips for vehicle v during period j
S i j f m a x Maximum required supply from crop i in period j to facility f (ton/period)
P C p j f Processing capacity of product p in period j in facility f (ton/period)
C F p f The conversion factor for producing product p in facility f (ton/ton)
D p j f The demand of product p in period j at facility f (ton)
d k f Distance between plot k and facility f (km)
C i v Cost per km of transporting crop i using vehicle v (EUR/km⋅ton)
h i j f Holding cost of crop i in period j in facility f (EUR/ton⋅period)
h p j f Holding cost of product p in period j in facility f (EUR/ton⋅period)
e a i Agriculturally related CO2-eq emissions of the production of crop i (ton CO2-eq/hectare)
e t i v Transportation-related CO2-eq emissions for transporting crop i using vehicle v (ton CO2-eq/ton⋅km)
e p p f Processing related CO2-eq emissions of product p in facility f
e d i Disposal-related CO2-eq emissions of crop i (ton CO2-eq/ton)
e d p Disposal-related CO2-eq emissions of product p (ton CO2-eq/ton)
S L i Maximum shelf life of crop i (periods)
S L p Maximum shelf life of product p (periods)
D L p m i n Minimum threshold of the fulfilled demand from product p during the rotation cycle (ton)
D L p m a x Maximum threshold of the fulfilled demand from product p during the rotation cycle (ton)
c p p f Processing cost of product p in facility f (EUR/ton)
P r p Price of selling product p (EUR/ton)
c d i Disposal cost of crop i (EUR/ton)
c d p Disposal cost of product p (EUR/ton)
P n p Penalty cost of lost sales from product p (EUR/ton)

4.3. Model Formulation

4.3.1. Decision Variables

The decision variables used in the model are as follows:
X i j k       = 1   i f   c r o p   i   i s   p l a n t e d   i n   p e r i o d   j   i n   p l o t   k , 0   o t h e r w i s e
Z i j k       = 1   i f   c r o p   i   i s   h a r v e s t e d   i n   p e r i o d   j   i n   p l o t   k , 0   o t h e r w i s e
Y i k t       = 1   i f   c r o p   i   i s   p l a n t e d   i n   p l o t   k   a t   y e a r   t , 0   o t h e r w i s e
H i j k Harvested quantity from crop i harvested in period j from plot k
S Q i j k f v Shipped quantity of crop i harvested in period j from plot k to facility f using vehicle v
N T i j k f v Required number of trips to transport crop i harvested in period j from plot k to facility f using vehicle v
A v i d f a Available quantity from crop i in period j at facility f with age a
I i j f a Inventory of crop i in period j at facility f with age a
P P p j f a Processed quantity of product p in period j in facility f made from crop of age a
I P p j f A Inventory of product p in period j at facility f with age A
W i j f a Disposed waste from crop i in period j   a t facility f with age a
W P p j f A Disposed waste from product p in period j   a t facility f with age A
F D p j f A Fulfilled demand from product p in period j from facility f of age A
L S p j f Lost sales from product p in period j from facility f

4.3.2. Objective Functions

Two objective functions are considered as follows:
m a x p P j J f F A = 0 S L p P r p . F D p j f A i I j J k K f F v V d k f . C i v . S Q i j k f v i I j J f F a = 0 S L i h i j f . I i j f a     i I j J f F A = 0 S L p h p j f . I P p j f A i I j J f F a = 0 S L i c d i . W i j f a i I j J f F A = 0 S L p c d p . W P p j f A     p P j J f F a = 0 S L i c p p f . P P p j f a     p P j J f F P n p . L S p j f
m i n i I k K t T e a i . Y i k t +   i I j J k K f F v V e t i v . d k f . S Q i j k f v + p P j J f F a = 0 S L i e p p . P P p j f a     + p P j J f F a = 0 S L i e d i . W i j f a     + p P j J f F A = 0 S L p e d p . W P p j f A
The economic objective function represented in the total generated profit across the SCN is to be maximized as shown in Equation (1). The first part of the objective function is the revenue from selling the products. Then, the following costs are subtracted from the revenue:
  • Cost of shipping the crops from plots to the processing facilities;
  • Holding cost of storing crops and products in the processing facilities;
  • Cost of disposing waste from crops and products which exceed their shelf lives;
  • The processing cost of products;
  • Penalty cost of unfulfilled product demand.
The environmental objective represented in the total CO2-eq emissions is to be minimized as shown in Equation (2). It considers carbon emissions from planting, the transportation of crops from plots to processing facilities, the processing of harvested crops, and the disposal of crops and products that exceed their shelf lives.

4.3.3. Constraints

Constraints in the proposed model are classified into seven main categories as follows: crop rotation constraints from (2) to (15), harvesting constraints from (16) to (17), transportation constraints from (18) to (21), inventory and processing constraints from (22) to (29), perishability constraints from (30) to (34), demand fulfilment constraints from (35) to (38) and finally, domain constraints from (39) to (47).
i = 1 I X i j k 1 j J , k K
j = S i t E i t X i j k = t p i . X i j k i I , k K , t T
k = 1 K j J / S i t , , E i t X i j k = 0 i I , t T
X i j k + i f n X i j + t p i k 1 i I , j E i t , k K , n = 1 , , N 2
S i t X i S i t k T . f i + f m i i I , k K
j = 1 F i X i S i t + j 1 T S k 1 i I , k K , t T
Y i k t X i s i t k = 0 i I , k K , t T
i = 1 I Y i k t P S k K , t T
i = 1 I k = 1 K Y i k t P S . A P t T
M i n _ B i t k = 1 K Y i k t M a x _ B i t i I , t T
i f N 1 t = 1 T Y i k t 1 k K
i f N t = 1 T Y i k t 1 k K
i = 1 I k = 1 K W i . Y i k t A W t T
M T i m i n M T i m a x Z i j k = Y i k t i I , k K , t T
H i j k = Y L D i j k . T P i k . Z i j k i I , j h i t , k K
H i j k = f = 1 F v = 1 V S Q i j k f v i I , j h i t , k K
f = 1 F v = 1 V N T i j k f v . T C A P v H i j k i I , j h i t , k K
j h i t f = 1 F v = 1 V N T i j k f v N m a x k i I , k K
i = 1 I k = 1 K f = 1 F N T i j k f v V v j j h i t , v V
k = 1 K v = 1 V S Q i j k f v S i j f m a x i I , j h i t , f F
A V i j f a = k K v V S Q i j k f v i I , j h i t , f F , a = 0
A V i j f a = I i j 1 f ( a 1 ) i I , j J , f F , 0 < a S L i
I i j f a = A V i j f a P P p j f a C F p f W i j f a i I , j J , p P i , f F , 0 a S L i
a = 0 S L i P P p j f a P C p j f i I , p P i , j J , f F
P P p j f a C F p f . A V i j f a i I , p P i , j J , f F , 0 a S L i
I P p j f A = a = 0 S L i P P p j f a F D p j f A i I , p P i , j J , f F , A = 0
I P p j f A = I P p j 1 f A 1 W P p j f A F D p j f A i I , p P i , j J , f F , 0 < A S L p
W i j f a = 0 i I , j J , f F , 0 a < S L i
W i j f a = A V i j f a i I , j J , f F , a = S L i
P P p j f a = 0 i I , p P i , j J , f F , a = S L i
W p j f A = 0 i I , p P i , j J , f F , 0 A < S L p
W p j f A = I P p j 1 f ( A 1 ) i I , p P i , j J , f F , A = S L p
a = 0 S L i P P p j f a F D p j f A i I , p P i , j J , f F , A = 0
F D p j f A = 0 i I , p P i , j J , f F , A = S L p
D L p m i n j J f F A = 0 S L p F D p j f A D L p m a x i I , p P i
D p j f = A = 0 S L p F D p j f A + L S p j f i I , p P i , j J , f F
X i j k 0 , 1 i I , j J , k K
Z i j k 0 , 1 i I , j h i t , k K
Y i k t 0 , 1 i I , k K , t T
H i j k 0 i I , j h i t , k K
S Q i j k f v , N T i j k f v 0 i I , j h i t , k K , f F , v V
A V i j f a , I i j f a , W i j f a 0 i I , j J , f F , 0 a < S L i
P P p j f a 0 i I , p P i , j J , f F , 0 a < S L i  
I P p j f A , W P p j f A , F D p j f A 0 i I , p P i , j J , f F , 0 A < S L p
L S p j f 0 i I , p P i , j , J , f F
Crop rotation constraints ensure necessary conditions for perfect crop cultivation criteria. Each agricultural farm is divided into a set of plots. Each plot is independent of the others and could be cultivated with various types of crops. The following criteria are considered as in [34]:
  • Each crop has its criteria, including the planting and harvesting dates and the associated demand;
  • Each crop requires different amounts of water for irrigation that must be satisfied at a given time period;
  • Crops belong to different botanic families. The same crops or crops from the same family cannot be planted in succession;
  • At least one legume crop should be planted on each plot during the rotation cycle; this would positively affect the soil and the yield obtained;
  • Every cycle should involve at least one fallow period to allow the soil to restore its moisture and fertility content.
Whereas constraint (3) ensures that there is at most one crop per plot per period, constraint (4) ensures that the planted crop will occupy the plot during its whole production cycle. Constraint (5) guarantees that the crop is only grown in its permissible planting periods. Constraint (6) prevents the same crop or two crops from the same family to be planted consecutively. Constraint (7) ensures that the number of occurrences of each crop during the rotation cycle is based upon that crop’s frequency. However, in the case that the rotation length is greater than the frequency reciprocal of the crops, constraint (7) will not be enough to ensure that enough time has elapsed before planting the same crop again based upon its planting frequency. Therefore, constraint (8) is introduced to ensure that there is enough time before planting the same crop again. Constraint (9) determines the annual status of crop i on plot k in year t , (e.g., whether or not crop i is planted on plot k in year t ). Constraint (10) ensures that the annual planted crops per plot cannot exceed the planting seasons permissible. Constraint (11) limits the yearly planted crops to the total available land. Constraint (12) ensures that the fulfilled demand of each crop is within the allowed limits in terms of the required number of plots annually. Constraints (13) and (14) ensure the presence of at least one legume crop and one fallow period during the rotation cycle, respectively. Constraint (15) limits the total used water for irrigation per year to the total annually available water.
As for harvesting constraints, constraint (16) ensures that the crop is totally harvested if and only if it is planted in a certain plot in year t . Constraint (17) represents the harvested quantity per crop as a percentage of the optimum yield quantity.
As for transportation constraints, constraint (18) ensures that all of the harvested quantity is transported to the processing facilities in its harvesting period. Constraint (19) estimates the number of trips required to transport each crop from plot k to the processing facilities based upon the capacity of vehicles used. Constraint (20) limits the total number of trips from each plot to a certain value. Constraint (21) ensures that the total trips per period for each vehicle cannot exceed a certain limit.
As for inventory and processing constraints, constraint (22) limits the total shipped quantity from each crop during each harvesting period to the maximum available storage capacity in each processing facility. Constraint (23) determines the available quantity of fresh crops ( a = 0 ) in each facility based on the total shipped quantity of that crop in each harvesting period. Constraint (24) ensures that the available quantity from carried-over crops of a specific age at the beginning of any period is equal to that of the available inventory from the last period. Constraint (25) determines the available inventory of each crop with a specific age, a , at the end of each period in each facility. Constraint (26) ensures that the processed products in each facility cannot exceed the production capacity of that facility. Constraint (27) associates the processed quantity of each product to the available quantity of the relevant crop in each period. Constraint (28) determines the available inventory from freshly produced products ( A = 0 ) in each period in each facility. Constraint (29) determines the carried-over inventory from each product in each period in each facility considering its remaining age.
As for perishability constraints, constraint (30) ensures that no crop waste is generated for crops whose age has not exceeded the allowable shelf life. Constraint (31) ensures the disposal of crop waste from crops that have reached their shelf life limit. Constraint (32) ensures that crops that exceed their shelf life are not processed. Constraint (33) ensures that no product waste is generated for products whose age has not exceeded the allowable shelf life. Constraint (34) ensures the disposal of product waste from products that have reached their shelf life limit.
As for demand fulfilment constraints, constraint (35) ensures that the fulfilled demand from fresh products ( A = 0 ) comes only from recently processed products not carried over in the inventory. Constraint (36) ensures that no demand is fulfilled from products that reached their shelf life. Constraint (37) ensures that the fulfilled demand from each product during the rotation cycle is within the allowable thresholds. Constraint (38) ensures that the demand for each product in each period in each facility is either fulfilled or considered lost sales for which a penalty is paid.

5. Case Study Description

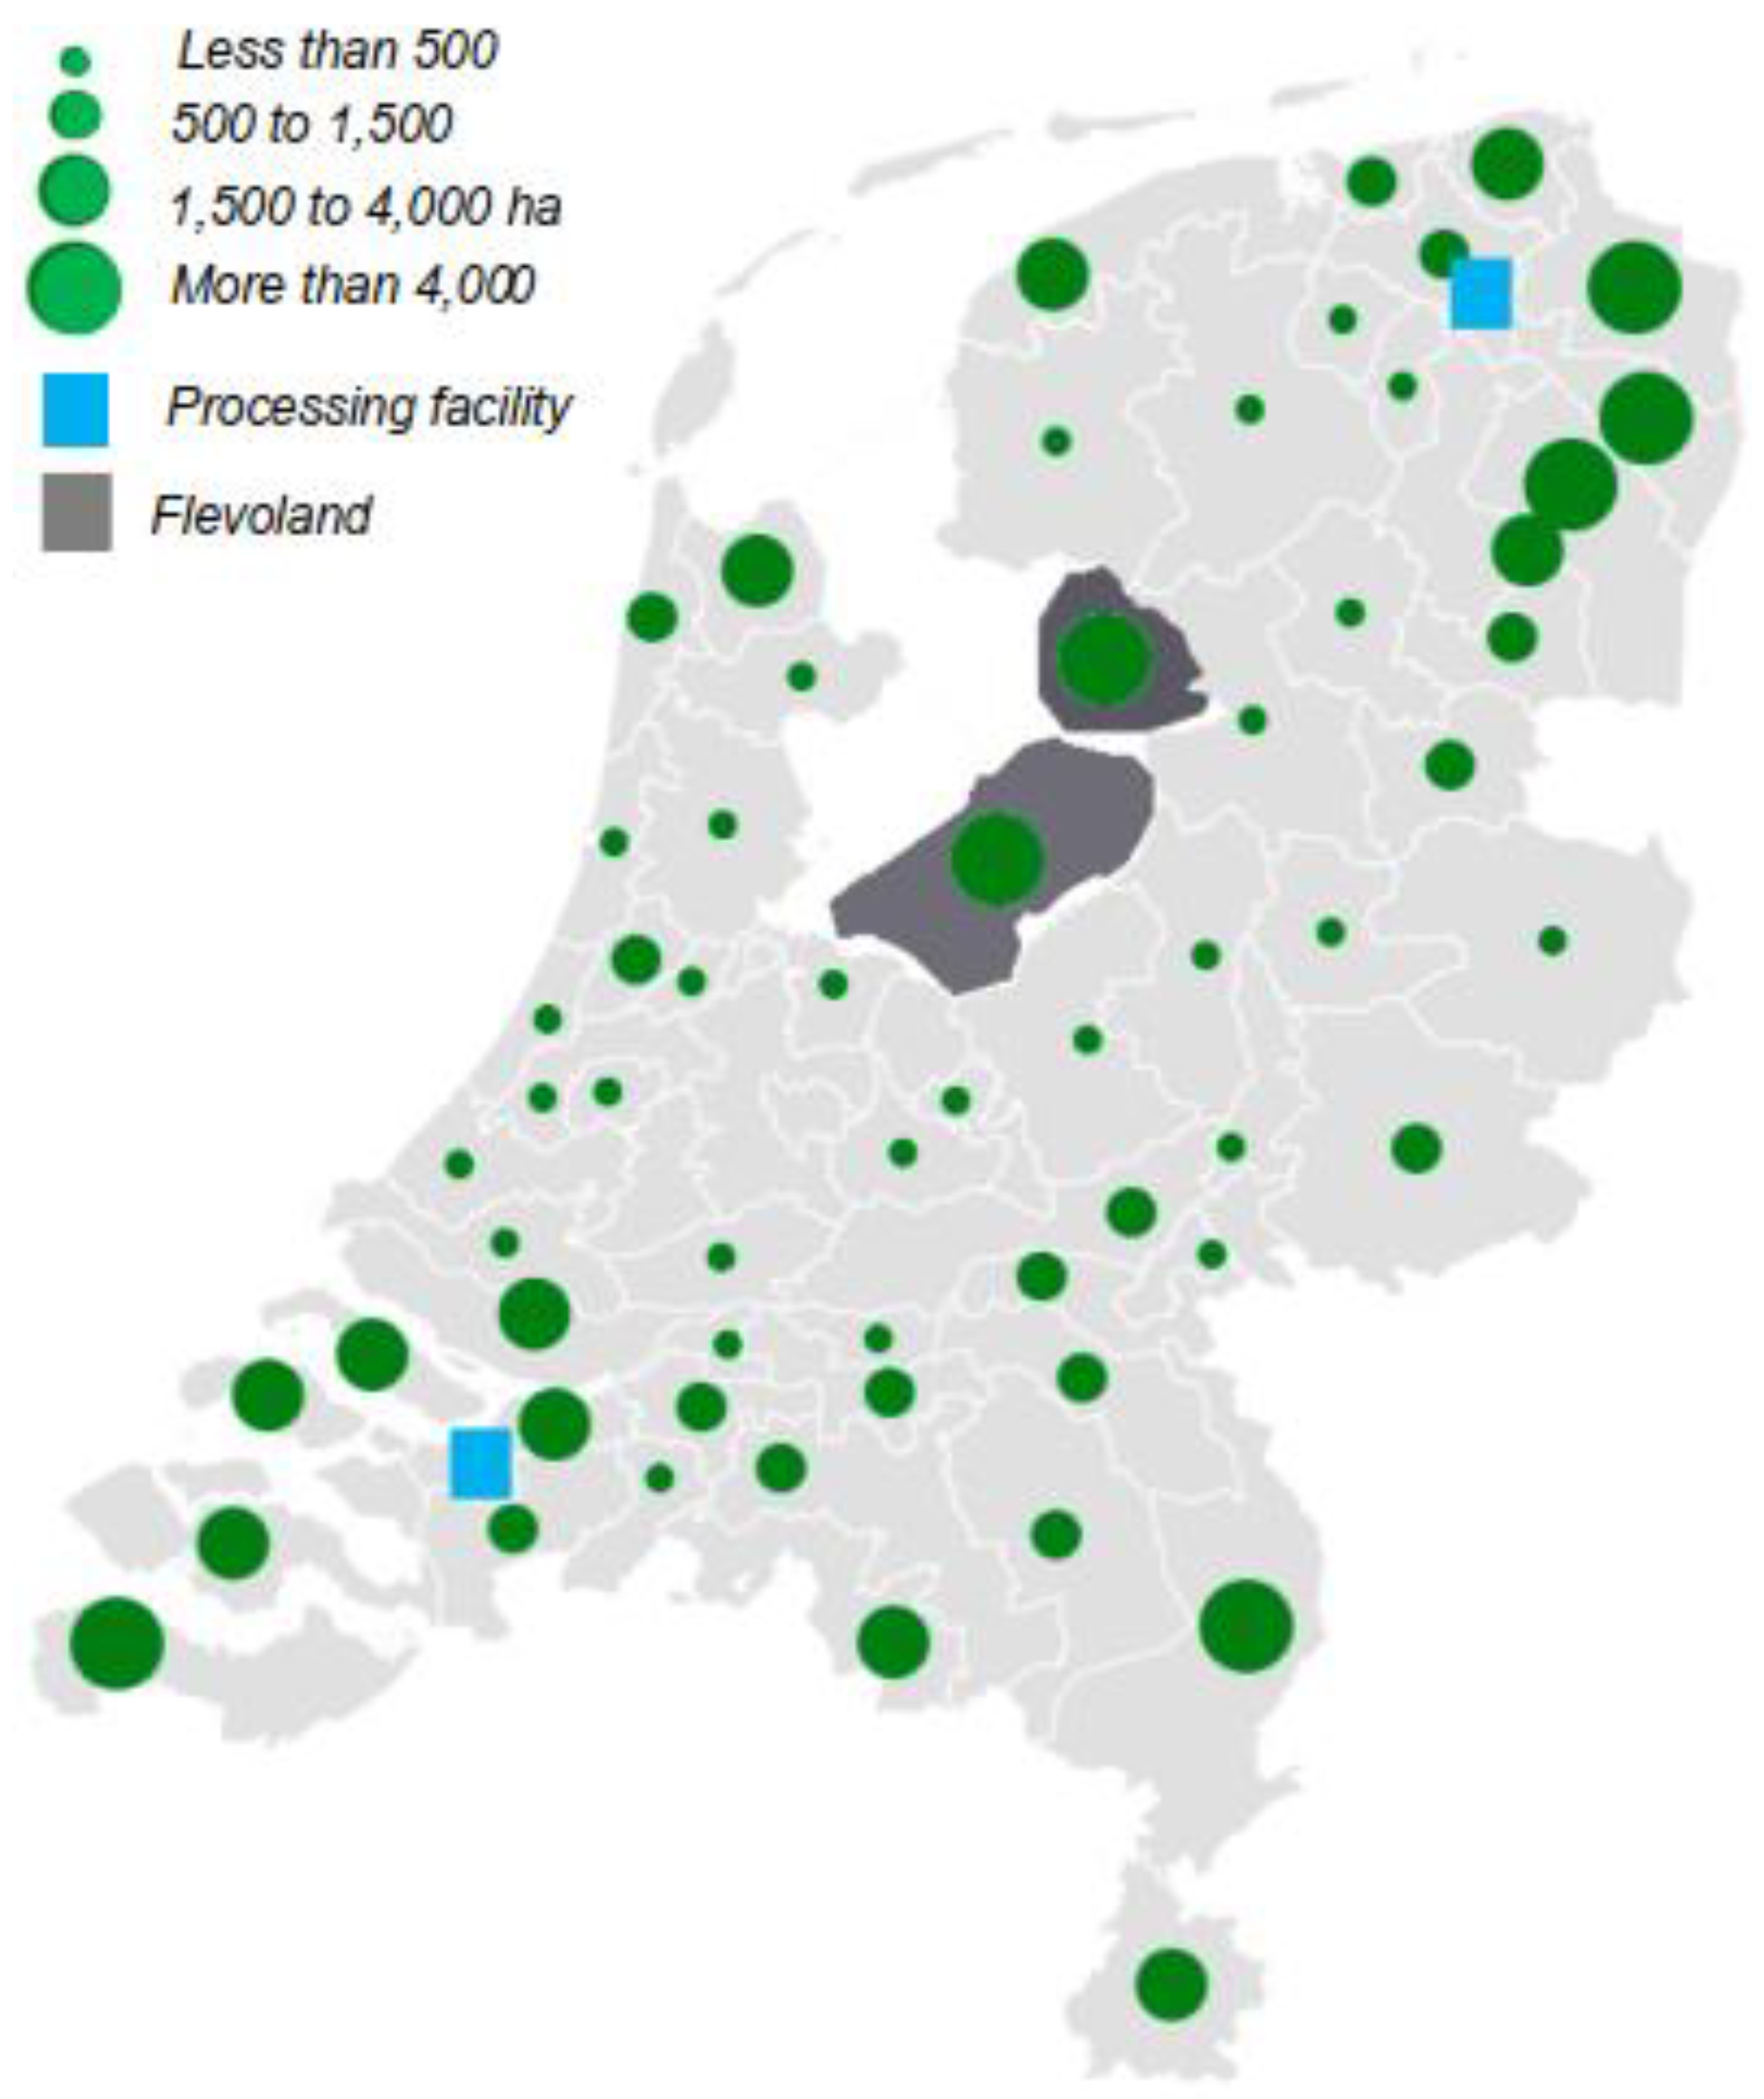
The proposed model was applied to a case study of sugar beet processing chains in the Netherlands. The essential input data were obtained from Flevoland province, Netherlands. The geographical distribution of farms and processing facilities of such chains is shown in Figure 3 [35]. In the Netherlands, the processing facilities are centralized in the shown locations, where Flevoland supplies the northern facility located in Groningen [7].
Due to growing markets and new uses for sugar beet-derived products, there is a forecasted increase of 20% in sugar beet supply [2].
The rotation cycle in the agricultural stage was obtained using a different number of crops, and then the sugar beet crop only is considered for the rest of the stages. Sugar beet can only be grown every four years based on the rotation schemes used by farmers [36]. Therefore, a planning horizon of four years was studied and divided into 96 periods where each period was equivalent to two weeks.
The average size of a small farm in the Netherland is less than 20 ha [37]. Accordingly, a small farm with 12 plots (one hectare each) was considered to investigate the effect of crop rotation schedules during the rotation cycle for different farms’ plans. Twelve crops belonging to seven different botanic families were studied, and crop cultivation and harvesting dates are shown in Table 3 while the maximum demand threshold to be fulfilled from each crop can be found in the Supplementary Materials. The minimum demand threshold corresponding to each crop was assumed to be one-third of the maximum threshold.
In terms of the transportation stage, which is the second stage in the network, only sugar beet was studied. The main goal of this stage is transporting sugar beet to the processing facilities. For simplicity, this case study considers only one vehicle, and the distances between the plots and the processing facilities can be found in the Supplementary Materials.
In the processing stage, sugar beet is converted into white sugar. White sugar is then sold to satisfy the required demand. However, sales may be lost due to several reasons and a penalty is applied for unfulfilled demand. The penalty cost for lost sales is assumed to be half the product’s selling prices.
Transportation- and processing-related parameters are shown in Table 4 and price as well as other cost parameters are shown in Table 5.
To consider the perishability aspect, it is important to note that sugar beet shelf life is considered to be five months [38]. After processing sugar beet, the resulting white sugar produced is assumed to have a shelf life of two years, which is a relatively very long period that makes white sugar a non-perishable product.
For the environmental impact considerations, CO2 emissions are considered for all the SCN. Thus, CO2 emission-related data are shown in Table 6.
Table 3. Input data for different crops in Flevoland province in the Netherlands.
CropFamily f i  [36] ( # . y r 1 ) Yield [37] (tons/ha)Sowing
Date [39]
Harvesting Date [39]Maturity Period [39] (Days)
Sugar beetChenopodiaceae1/490–100AprilOctober–November285–305
Winter wheatgrass (Cereal)1/48.7September–OctoberAugust210–230
Green peasLegumes1/65.7MarchNovember300–315
Seed potatoNightshade1/438.7March–AprilJuly–September220–230
Seed onionAmaryllidaceae1/637MarchJune-July215–235
Winter rapeseedBrassica1/43.5JanuaryDecember300–315
Barley (spring)grass (Cereal)16.3AprilSeptember215–235
Maize (silage)grass (Cereal)140.8AprilNovember275–295
OnionsAmaryllidaceae1/658.4MarchJuly–August235–250
Potatoes (ware)Nightshade1/356.8March–AprilAugust–September255–275
Wheat (spring)grass (Cereal)1/27.8AprilSeptember215–235
Winter carrotApiaceae1/670September–OctoberSeptember–October70–80
Table 4. Transportation and processing parameters.
ParameterValue
Truck capacity50 ton
White sugar conversion rate [40]0.14625 ton/ton
Daily processing capacity [41]10 ton
Table 5. Price and cost parameters.
ParameterValue
White sugar selling price [41]500 EUR/ton
Transportation cost [40]0.1 EUR/ton⋅km
White sugar processing cost in a traditional facility design [41]65.49 EUR/ton
Holding cost of white sugar [2]0.1 EUR/day⋅ton
Holding cost of sugar beet [7]0.15 EUR/day⋅ton
Disposal cost of white sugar [2]10 EUR/ton
Disposal cost of sugar beet10 EUR/ton
Penalty for lost sales250 EUR/ton
Table 6. Environmental impact parameters.
ParameterValue
e a for sugar beet [2]2.69 ton CO2-eq/hectare
e t [2]82.5 g CO2-eq/ton⋅kilometer
e p for a traditional facility design [2]60.27 kg CO2-eq/hectare
e d i 1220 kg CO2-eq/hectare
e d p 30.135 kg CO2-eq/hectare

6. Results and Discussion

In this section, the solution of the proposed MILP model is presented. The proposed model was implemented using GUROBI® 9.5.0 incorporated with Python. The model was tested on a 3.47 GHz Intel Xeon PC with a 96 GB RAM computer. The solver uses a branch and bound algorithm to find the optimal solution for the design of an economically as well environmentally sustainable AFSC in which the crop rotation planning problem is incorporated.

6.1. Model Verification and Validation

The mathematical model as well as the code used to implement the model were verified to ensure that the model could perform its intended function and be free of errors. The code was checked with the help of syntax error detectors and no errors were found. In addition, model verification was performed using small test instances to ensure that the model captured the problem’s logic and mathematics and that none of the constraints were violated (e.g., that there is at least one legume crop at each plot during the rotation cycle). The comparison of the model’s results and the manually run test instances ensured the correctness of both the mathematical model and the code used to implement it.
The model was also validated by applying it to a comprehensive case study—described in the previous section—to ensure its eligibility to be applied on a realistic case study. Inspecting the model’s results—Section 6.2—allowed a confirmation of the validity of the model.

6.2. Case Results and Discussion

In this subsection, the results of applying the formulated MILP model to the case study described in the previous section are discussed and analyzed. The optimum farm schedule across the rotation cycle is obtained and to the optimum decisions to be taken across the whole SC are determined. Furthermore, a trade-off analysis is conducted between the economic and environmental objectives. Eventually, the impact of crop and product perishability on the economic objective is studied, which can be used as a decision support tool for assessing investment-related decisions.
The following analysis was conducted on a small-sized problem using 12 crops, 12 plots, 4-year planning horizon divided into 96 periods (period = two weeks), one processing facility, one vehicle and one product.

6.2.1. Farm Schedule

The optimum farm schedule across the rotation cycle is the first type of model outcome. Such a schedule provides optimum decisions regarding the following questions:
  • Which crops will be planted in which plots and in which period?
  • When should planted crops be harvested?
The farm schedule obtained meets all the necessary conditions and criteria of the crop rotation planning problem which were incorporated in the model constraints. These constraints ensure that the cultivation and harvesting of crops during the rotation cycle are adequate to satisfy the corresponding demand of that crop, that planting is restricted to the crop’s planting season and that harvesting takes place after a minimum growth period. Legumes and fallow periods are present in each plot at least once during the rotation cycle and the same crops or crops from the same family are not planted successively on the same plot while enough time is given before planting the same crop again at the same plot. Finally, water requirements for irrigation during each period are satisfied with the available water amount.
It is important to note that the model can be used efficiently with larger farm sizes as will be shown in Section 6.3. However, studying a small farm containing 12 plots was enough for illustration purposes.
Two scenarios were considered to study the different farm plans based on two different strategies for crops’ demand requirements where
  • Scenario 1 entails satisfying a certain demand from each crop (e.g., contract farming) where a maximum and minimum threshold on the number of annual plots that should be planted with specific crops are used;
  • Scenario 2 entails that each crop should be planted annually during the rotation cycle (crop mix).
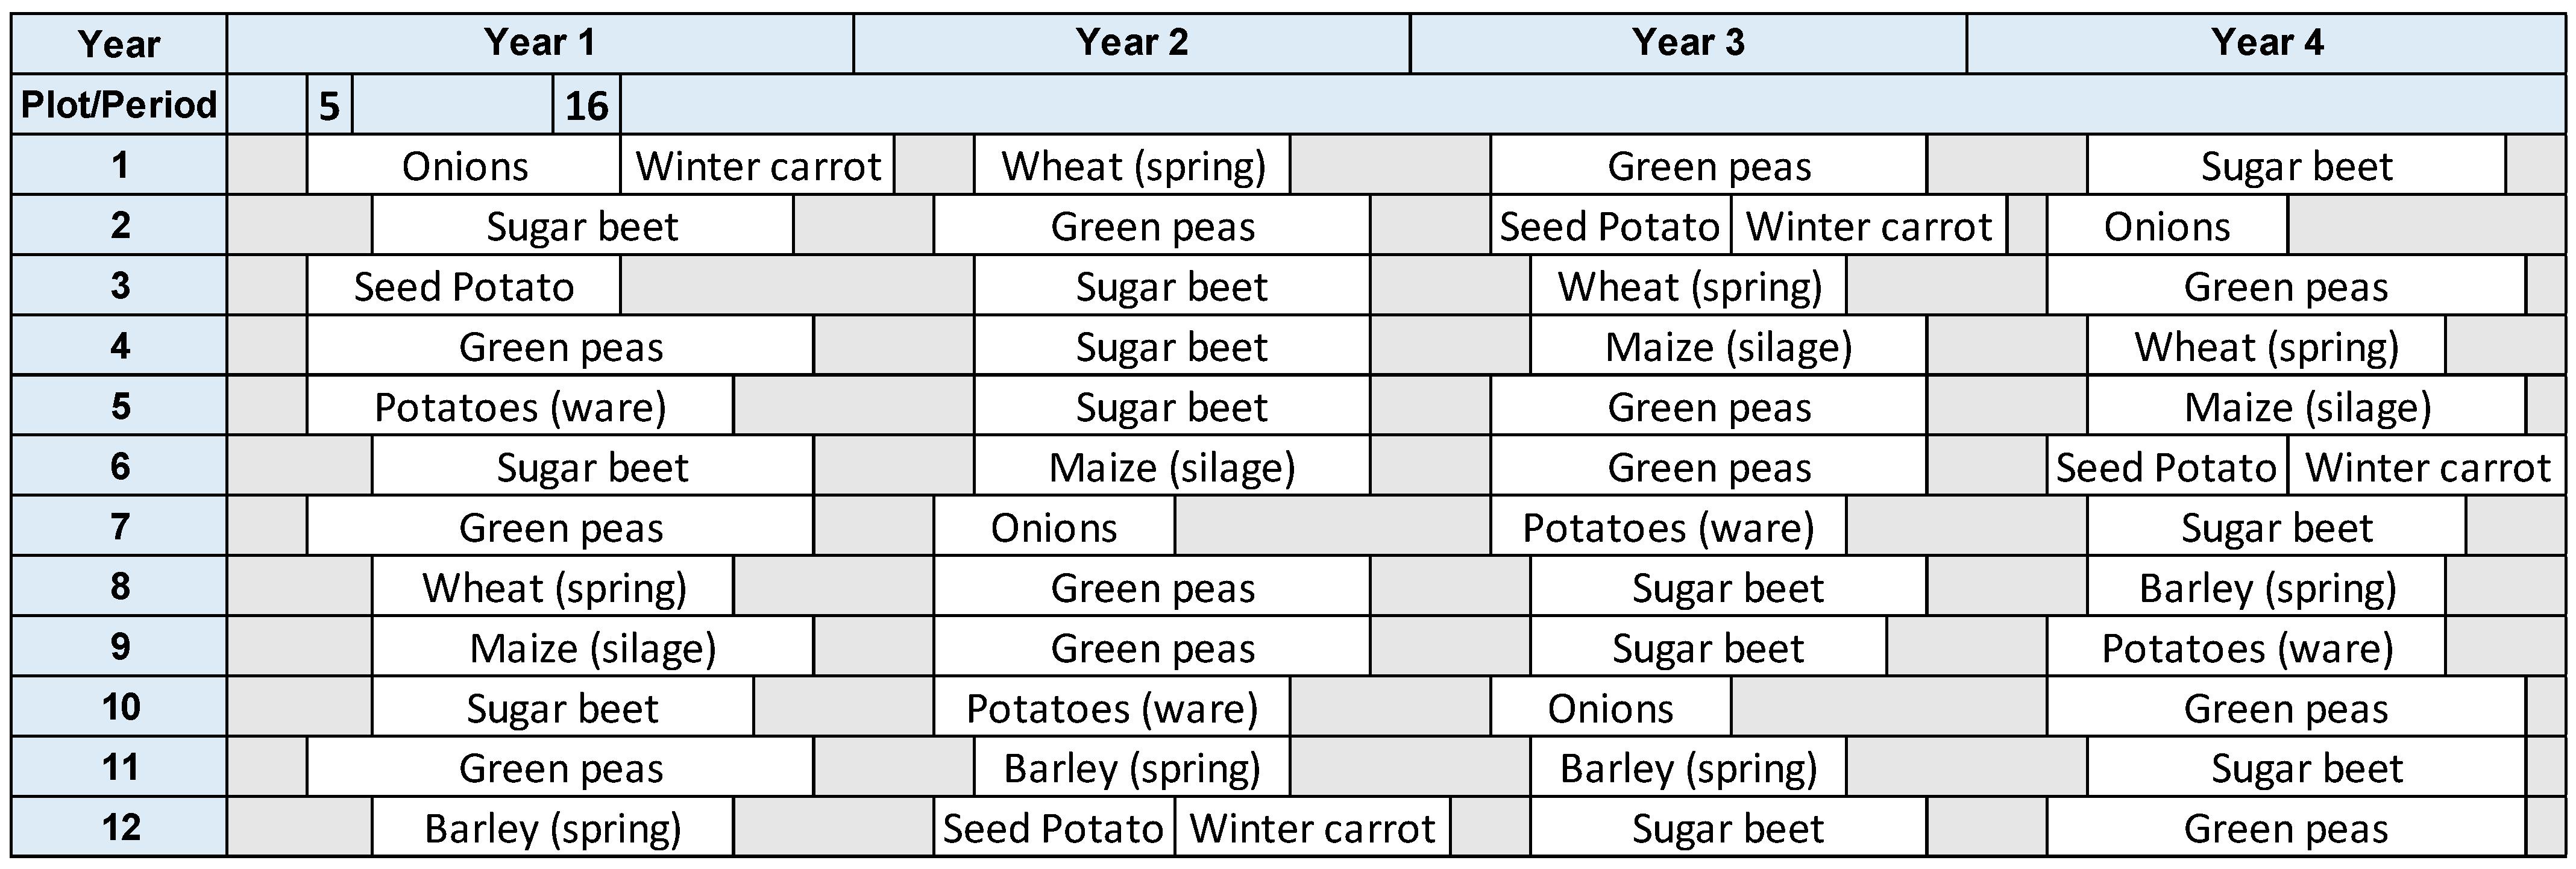
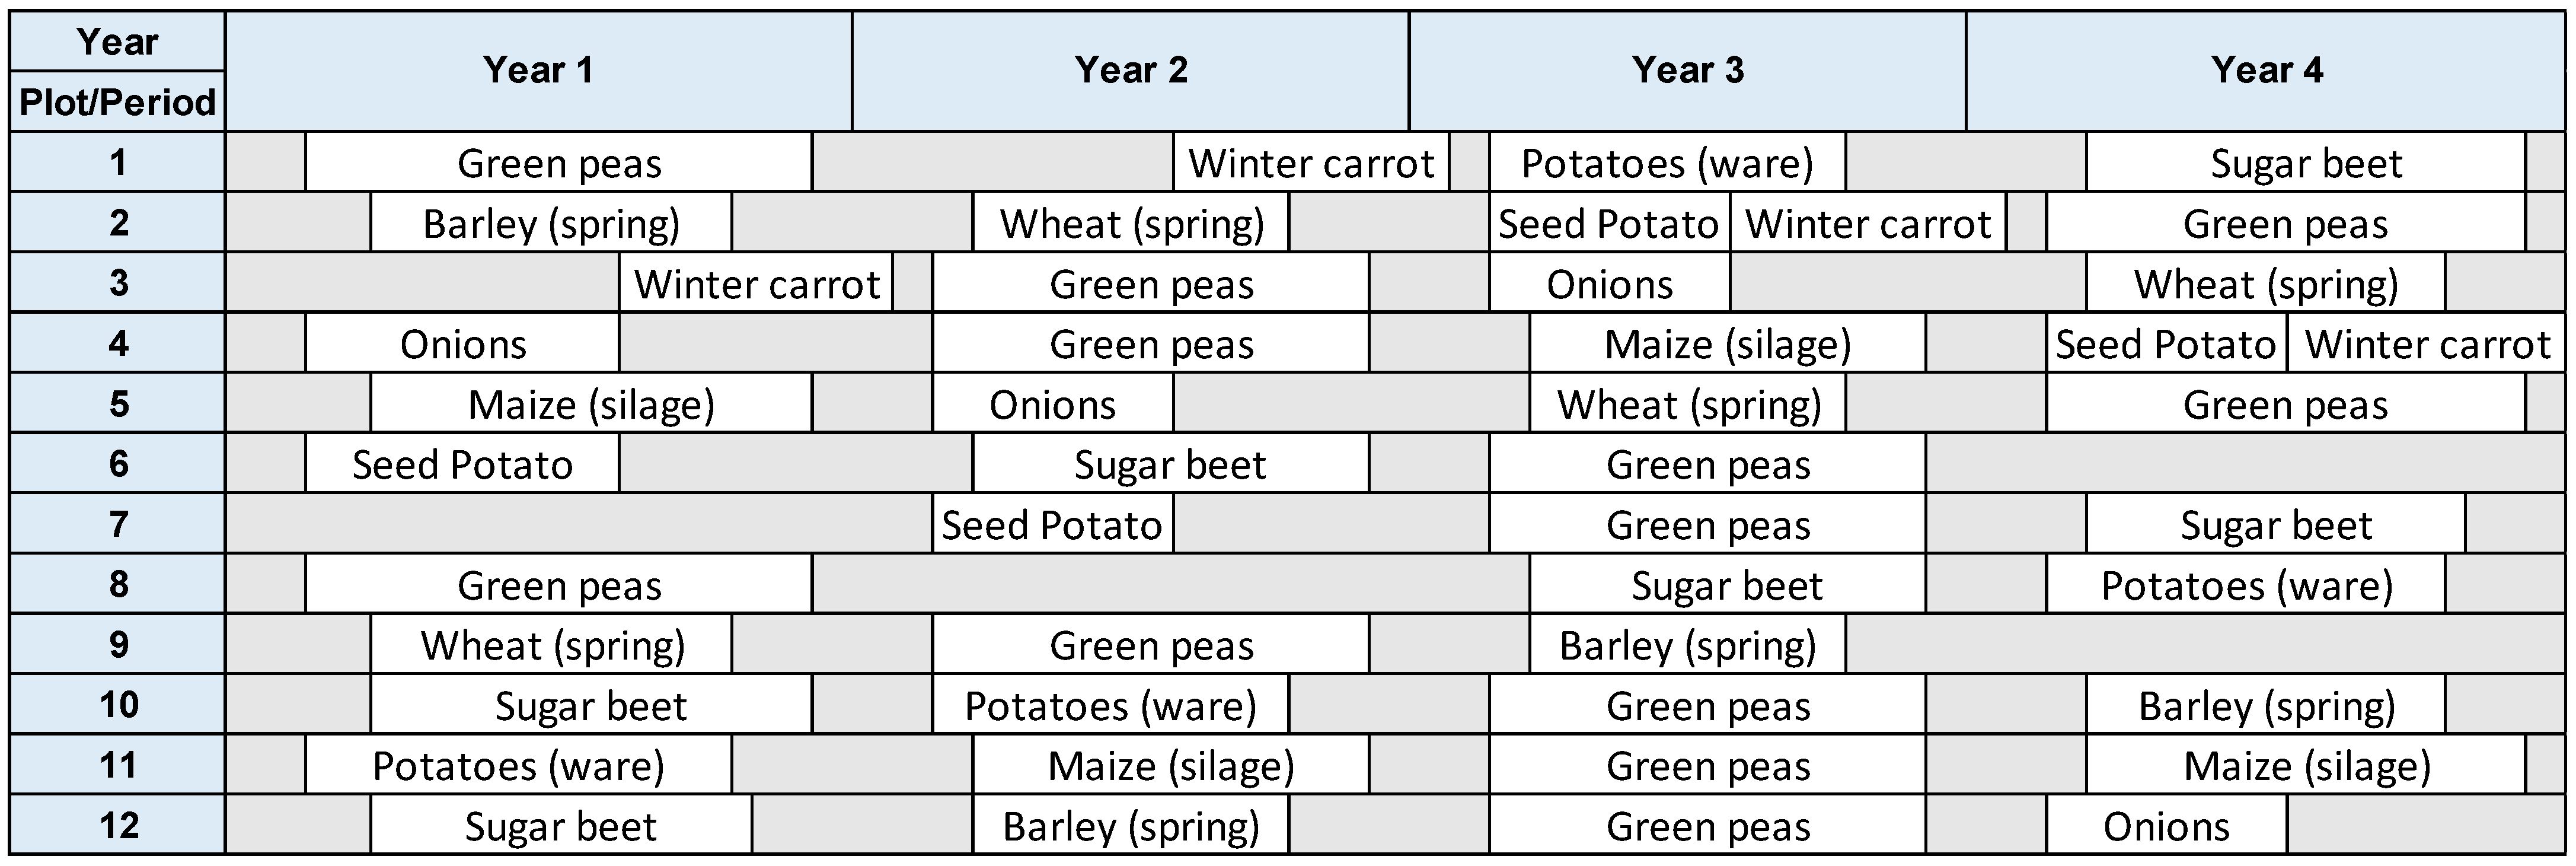
The farm schedule for scenario 1 is obtained twice. Farm schedule (a)—shown in Figure 4—is the best economic solution obtained while maximizing the economic objective and imposing no restrictions on the environmental objective while farm schedule (b)—shown in Figure 5—is the best environmental solution while optimizing the environmental objective through minimizing the CO2-related emissions and imposing no restrictions on the economic objective. However, it should be noted that the CO2 agriculturally related emissions of only the sugar beet were incorporated into the model due to the limitation of data availability of such a parameter for the rest of the studied crops. Thus, the differences in the generated farm schedules in scenario 1 while optimizing different objectives are generated due to the variation in the satisfied demand—in terms of the annual plots that should be planted with specific crops—based upon the identified demand range.
Farm schedule (a) obtained from scenario 1 while maximizing the economic objective and imposing no restrictions on the environmental objective is shown in Figure 4 with an associated profit of EUR 66,241 and total emissions of 47,616 kg CO2-eq. For instance, onions occupy plot 1 from period 5 to period 16 which means that onions should be planted on plot 1 in period 5 and should be harvested from the same plot in period 16. In the first scenario, the crop rotation schedule ensures the satisfaction of the demand range demand range of specific crops per year. For instance, the maximum number of plots that can be planted for sugar beet per year for a farm containing 12 plots is 3 plots since the planting frequency of sugar beet is 0.25/year per plot which is equivalent to limiting the maximum rate of cultivating sugar beet to one cultivation per rotation cycle (4 years in the Netherlands) per plot. Thus, three plots were fed to the model as the maximum annual demand for sugar beet. The minimum annual demand for sugar beet was chosen to be one-third of the maximum limit which is one plot per year. As shown in Figure 4, three plots were planted with sugar beet annually, which is the maximum limit, to maximize the fulfilled demand from white sugar to generate the maximum profit. It is also shown that the same plot is planted with sugar beet only once during the rotation cycle satisfying the planting frequency.
Farm schedule (b) obtained from scenario 1 while optimizing the environmental objective through minimizing the CO2-related emissions and imposing no restrictions on the economic objective is shown in Figure 5 with an associated profit of EUR 11,833 and total emissions of 23,437 kg CO2-eq. As can be seen, the cultivation of sugar beet has decreased compared to that in scenario 1 (a) to minimize CO2 emissions. Sugar beet was planted twice in years 1 and 4 and once in years 2 and 3. Sugar beet was planted in an amount greater than the minimum threshold in years 1 and 4 despite the objective of minimizing CO2 emissions including agriculturally related emissions, to satisfy the minimum threshold on the fulfilled demand from white sugar.
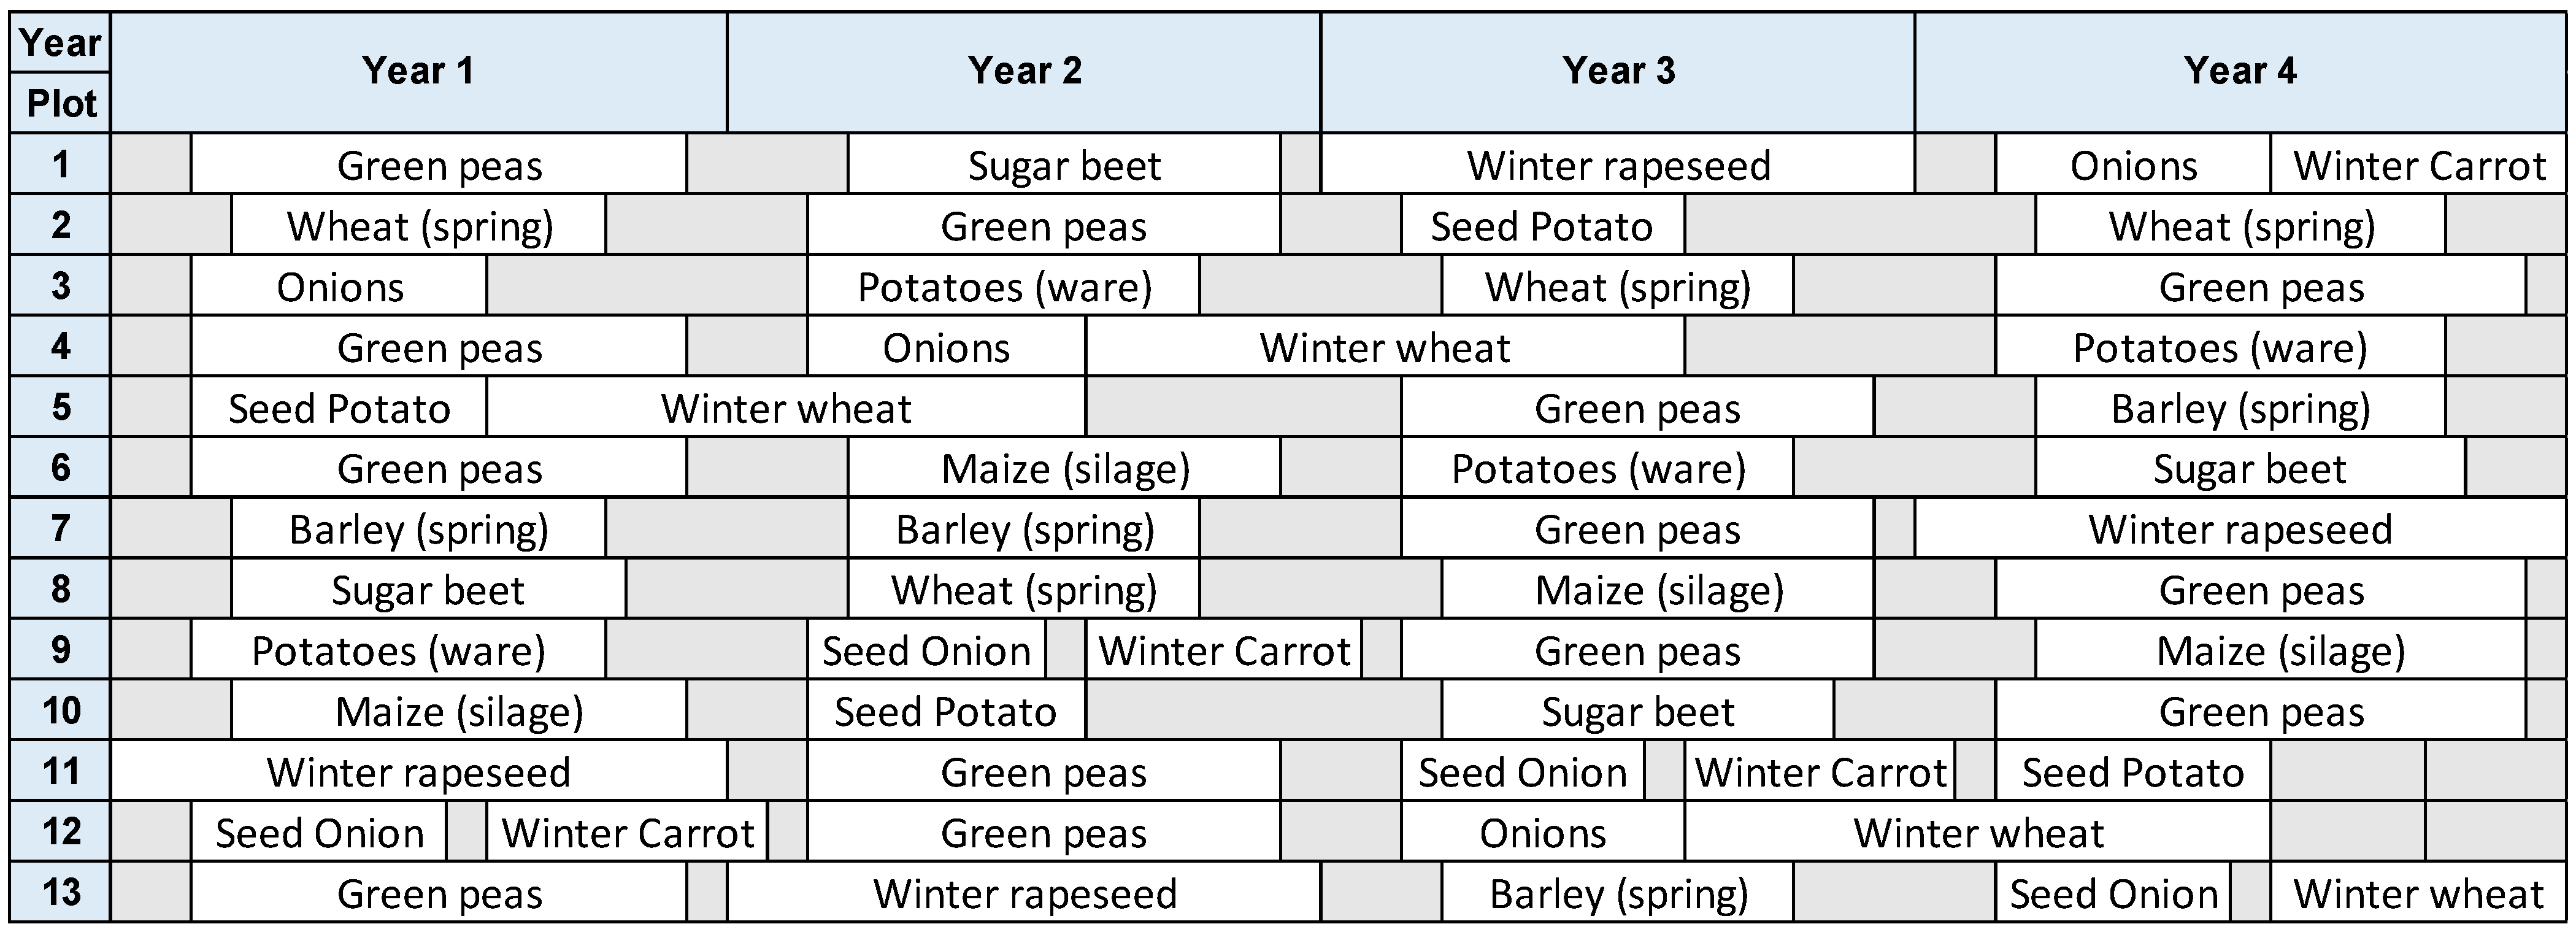
In scenario 2, each crop should be planted annually during the rotation cycle. Applying such a scenario on a small farm with 12 plots resulted in an infeasible model to solve, which means that a farmer with a small farm of 12 hectares will have to make a trade-off between losing sales from one crop and planting 11 crops annually instead of 12 or widening the farm with one more hectare to include 13 plots instead, since the model yielded a feasible solution with a minimum number of 13 plots as shown in Figure 6. The infeasibility of solving the model with 12 crops to be planted annually using a 12-plot farm is because of the limited amount of land and the long growth duration of most crops. Although there are two planting seasons per year, some crops such as sugar beet, barley, maize, wheat (spring), potatoes, rapeseed and green peas occupy the plot for relatively long periods leaving no room for other crops to be planted beside them in one year. Thus, seven plots will be fully occupied annually with only seven crops. In addition, since green peas (the only legume crop among the studied crops) should be planted at least once in each plot during the rotation cycle, two more plots will be fully occupied by green peas to have three plots cultivated with green peas annually to satisfy such a restriction. This leaves three free plots to be cultivated with the remaining five crops. These five crops are divided into three crops whose started planting period is in the first half of the year and two crops that must be planted in the second half of the year. For the first year in the rotation cycle, this can be achieved since the whole year is available for cultivation. However, for the second year, only eleven plots will be available during the first half of the year (because winter wheat which occupies one plot will be harvested in period 39 or 40). Nine plots from the total of eleven will be cultivated with plants that occupy the plot only for a year, leaving only two plots for cultivation in the first half of the year while having three plots whose planting periods is in the first half and thus leading to an infeasible solution with a twelve-plot farm. Deciding not to plant one of the crops and withstand the associated loss from the lost sales can be an option and increasing the farm area to include 13 plots can be another option. The feasible farm schedule resulting from using a 13-plot farm is shown in Figure 6.

6.2.2. Optimum SCN

The proper planning of an AFSC is essential to drive optimum decisions across the different stages of the SC where improper upstream decisions in the agricultural stage will negatively affect downstream activities in the processing stage. Thus, optimum cropping, harvesting, transportation, processing, storing, and disposing as well as fulfilling demand decisions are required for the effective control and management of the sugar beet SCN while maximizing profit and minimizing the negative environmental impacts.
Optimum decisions across the SCN vary with the objective function being optimized. Thus, two cases were investigated to study the model’s behavior while optimizing different objectives. The first case is the best economic sugar beet SCN decision while optimizing the economic objective through maximizing the profit and imposing no restrictions on the environmental objective. The second case is the best environmental sugar beet SCN decision while optimizing the environmental objective through minimizing the CO2-related emissions and having no restrictions on the economic objective.
A comparison between the two cases given a sugar beet SC configuration consisting of one conventional traditional processing facility and one vehicle where the only product produced is white sugar is shown in Table 7, where a trade-off between the model objective and fulfilled demand exists.
It can be noted that the best economic solution resulted in a SCN with the maximum possible harvested quantity of sugar beet from the 12 plots studied, since each plot can be planted once at most during the planning horizon of four years with a yield of 100 tons per plot. Harvesting the maximum possible quantity resulted in shipping 1200 tons of sugar beet using 24 trips with a maximum of 50 tons per trip. Processing all the harvested quantities from sugar beet resulted in 176 tons of white sugar which was all used to fulfill the maximum demand threshold to maximize profit.
In contrast, in the best environmental solution, the minimum demand threshold was fulfilled to minimize the total CO2 emissions across the SC, resulting in lost sales and decreased profit. To fulfil that minimum demand threshold, only 600 tons of sugar beet was harvested and shipped in 12 trips to the processing facility, where all the harvested quantity was processed to produce 88 tons of white sugar to fulfill the minimum demand threshold. Such a decrease in fulfilled demand resulted due to the model’s tendency to minimize agriculture-, transportation- as well as processing-related CO2 emissions while meeting the essential criteria and constraints of the model.
In the best economic solution and the best environmental solution, two important points are shown as follows:
  • The model tends to keep inventory from processed products (white sugar) rather than from crops (sugar beet) because of two main reasons. The first reason is that storing crops costs more than storing processed products due to the need for special setups that would prevent crops from spoiling. The second reason is that processing positively affects the perishability of products resulting in products with a longer shelf life that can be stored and kept longer across the SC;
  • There was no waste generated across the SC which is due to the relatively long shelf life of sugar beet and white sugar in addition to the model’s tendency to minimize waste whatever the objective is because disposing of waste is of a high cost and emits CO2 emissions with no added value to the SCN.

6.2.3. Multi-Objective Optimization and Trade-Off Analysis

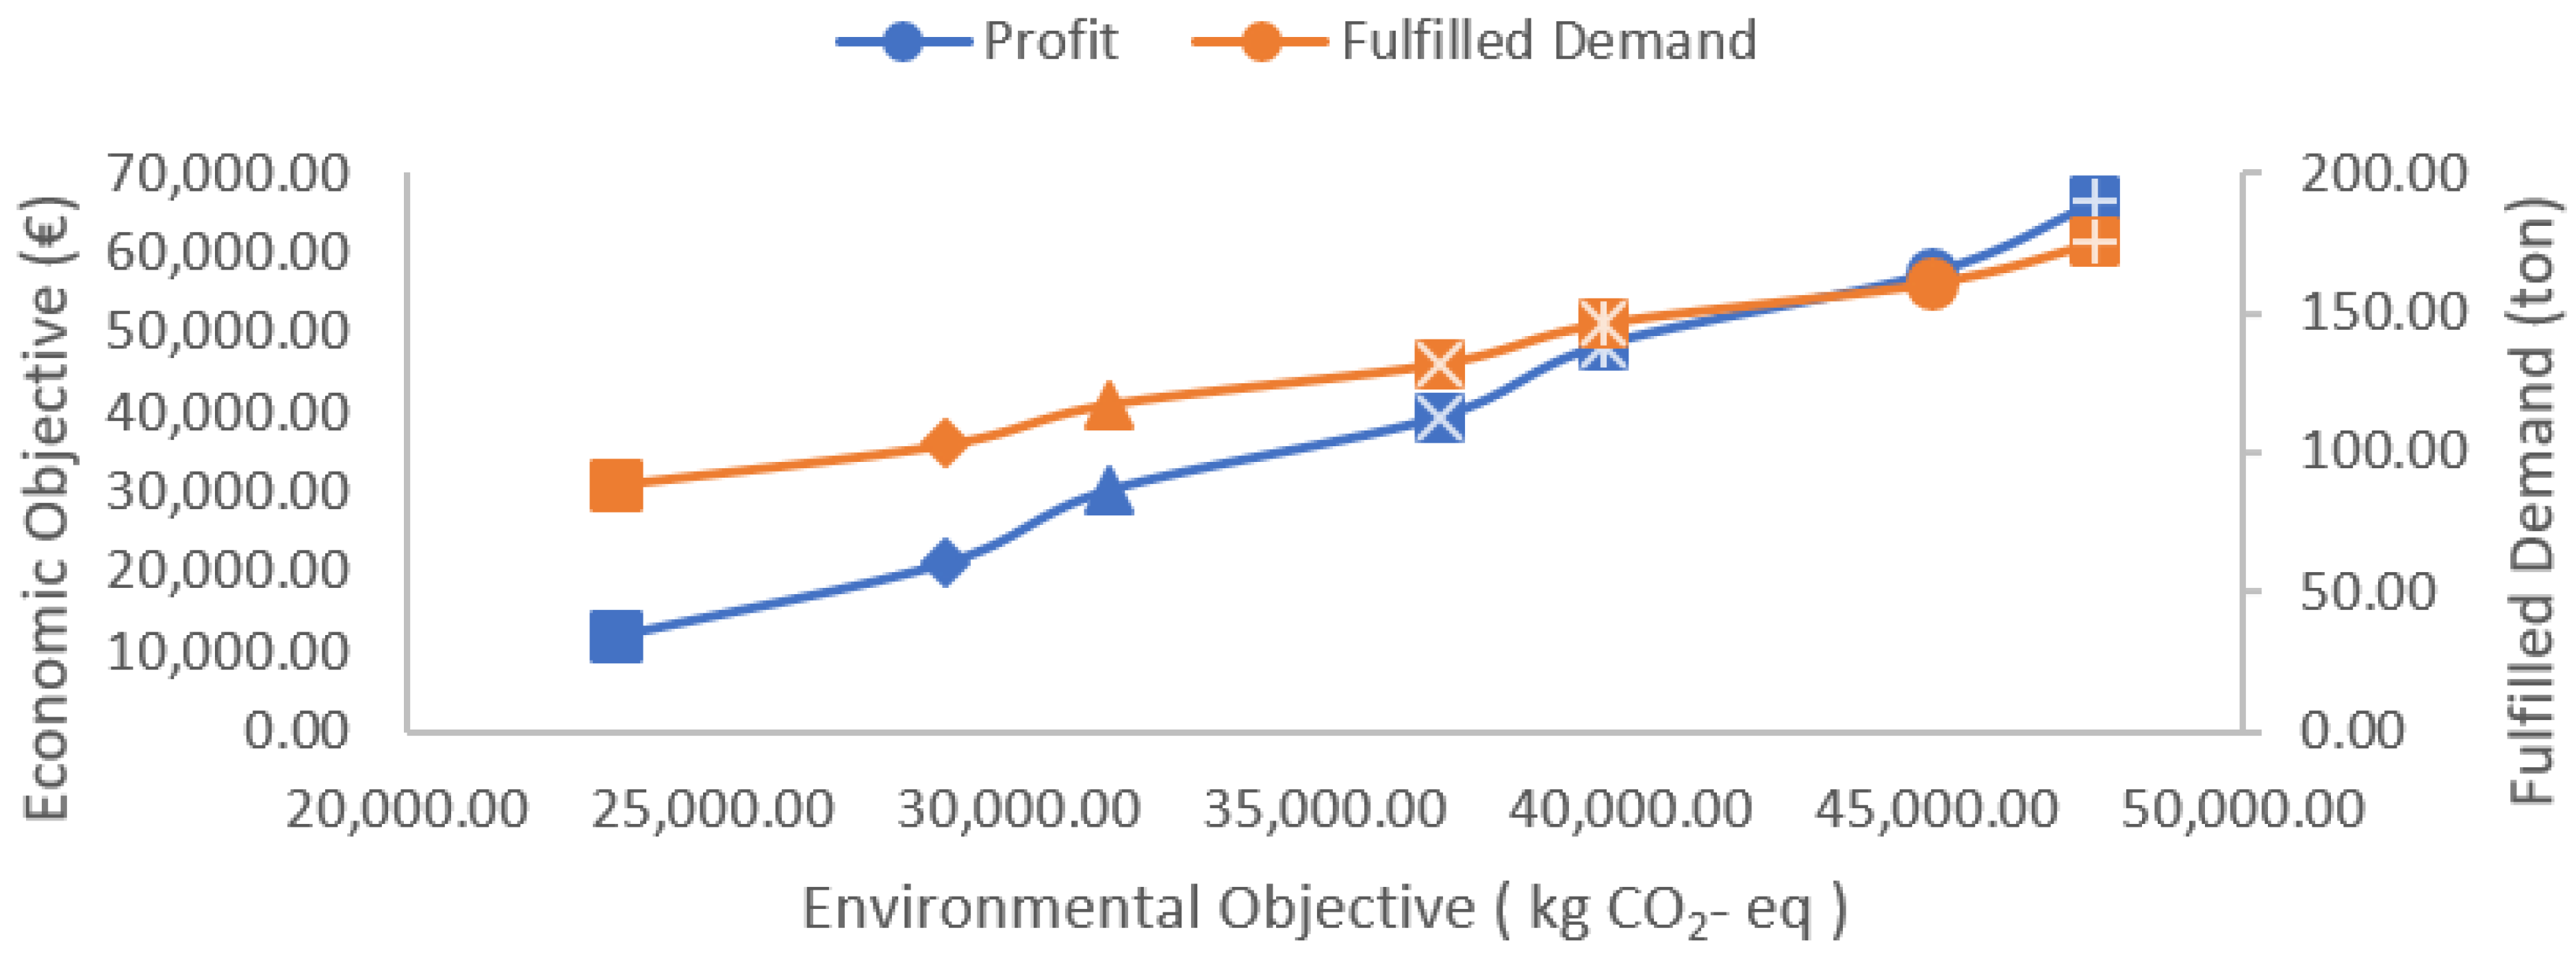
The eco-efficient solutions for the studied sugar beet SCN were obtained using the ϵ -constraint method where the economic objective was optimized through maximizing the profit while varying the allowable environmental impact in different iterations. The pseudocode for the multi-objective algorithm using the ϵ -constraint method is shown below (Algorithm 1). Such an analysis resulted in the trade-off curve shown in Figure 7, where each point on the Pareto-efficient frontier represents a different SCN—as shown in Table 8—and the extreme solutions are summarized in the previous subsubsection. Each optimal SCN corresponds to a specific integer solution of the model. All solutions reduce the environmental impact by decreasing the fulfilled demand between the maximum and minimum thresholds for demand fulfillment through decreasing the planted, harvested, transported, and processed quantities to minimize the agriculture-, transportation- and processing-related CO2 emissions. However, the decreased fulfilled demand and increased lost sales resulting from a lower environmental impact has caused a decrease in the generated profits across the sugar beet SC.
Algorithm 1. Multi-Objective Optimization Algorithm Using ε-constraint Method.
get   b e s t _ e c o n o m i c _ s o l u t i o n     maximize   profit   with   no   restriction   on   C O 2   emissions define   X 1     environmental   impact   at   b e s t _ e c o n o m i c _ s o l u t i o n get   b e s t _ e n v i r o n m e n t a l _ s o l u t i o n     minimize   C O 2 emissions   with   no   restriction   on economic   objective define   X 2     environmental   impact   at   b e s t _ e n v i r o n m e n t a l _ s o l u t i o n define   s t e p _ s i z e     ( X 1 X 2 ) / n   n   is   number   of   iterations define   p a r e t o _ f r o n t i e r     [   ] for   i = 1   to   n   do define   X     X 2 + i     s t e p   s i z e define   constraint   C :   a l l o w a b l e _ e n v i r o n m e n t a l _ i m p a c t     X get   m o d e l _ s o l u t i o n     maximize   profit   under   constraint   C define   Y     profit   at   m o d e l _ s o l u t i o n add   ( X ,   Y )   to   p a r e t o _ f r o n t i e r end   for

6.2.4. Quantifying the Impact of Perishability on the Economic Objective

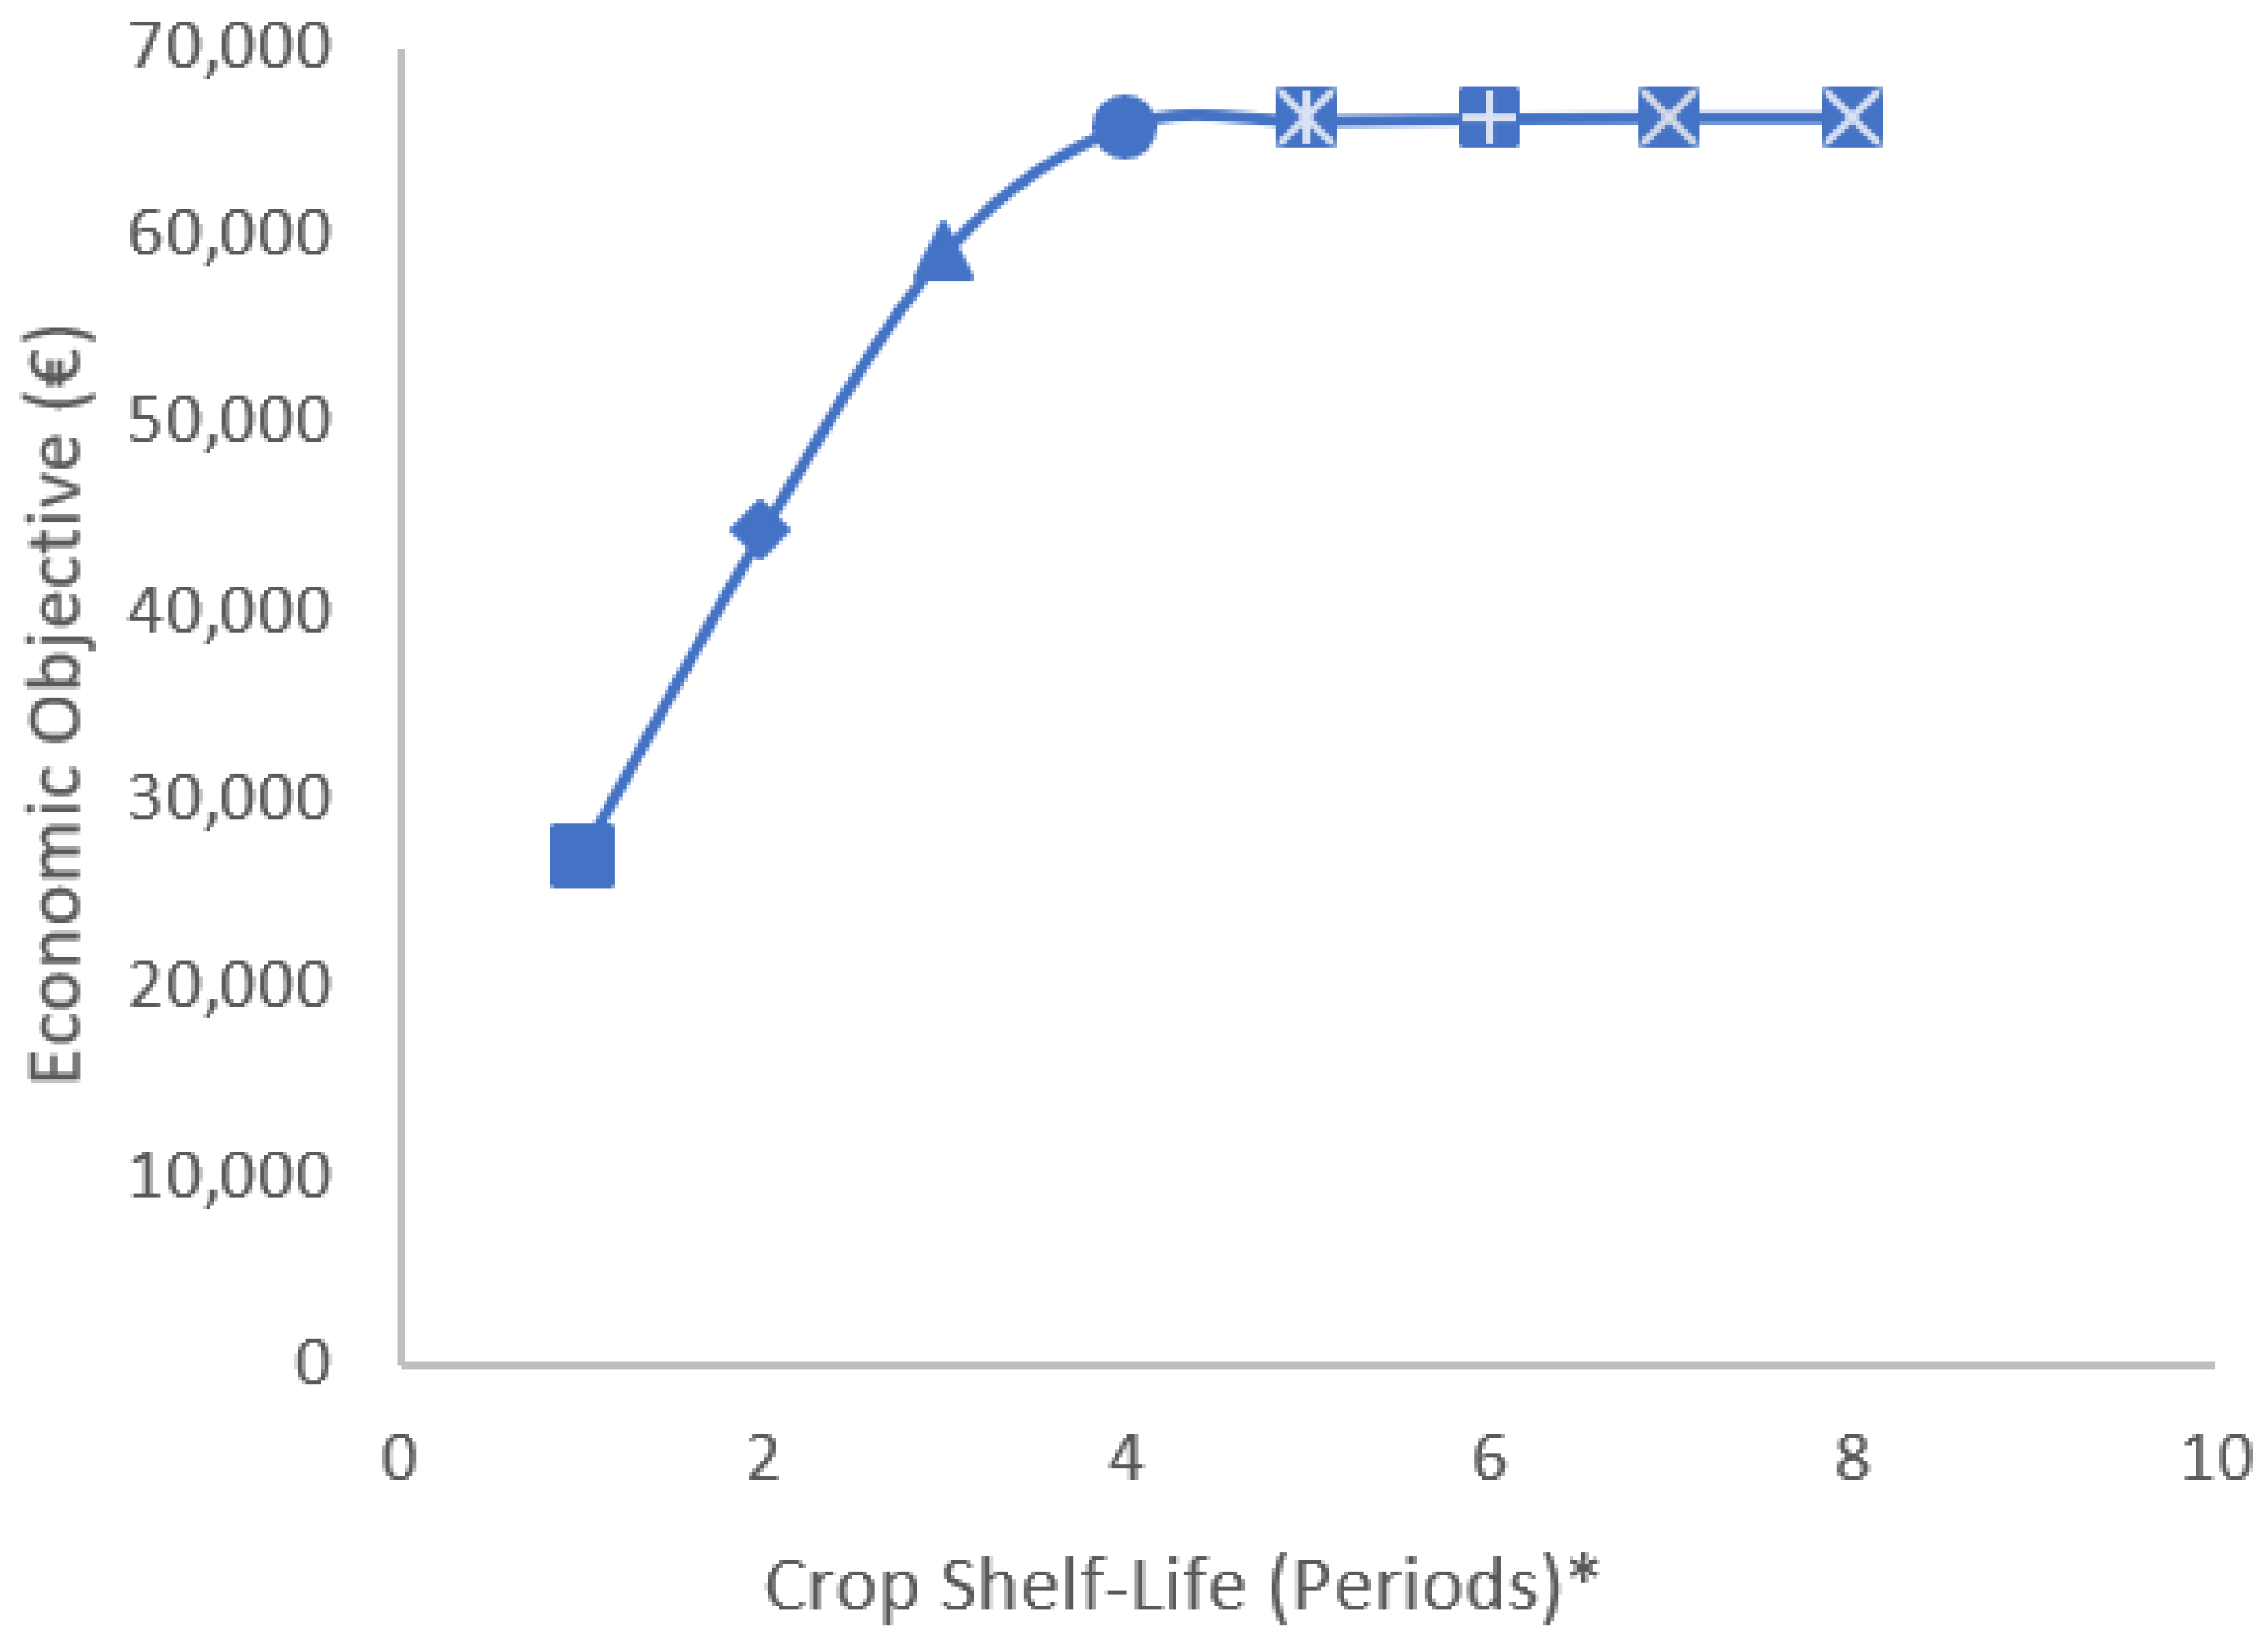
Sugar beet has a relatively long shelf life compared to that of other agro-materials used in AFSCs to produce fresh finished products. Thus, it is not possible to study the impact of perishability which is considered by the proposed model while using sugar beet. However, for the purpose of the analysis, the model was solved for eight hypothetical scenarios in which the shelf life of sugar beet was varied from one to eight periods to study the effect on the economic objective function, if there was any. In each scenario, the shelf life of processed white sugar is dependent on the shelf life of the sugar beet where processing prolongs the product shelf life to two periods, which are equivalent to four weeks more than the crop shelf life. The results obtained from solving those eight scenarios are shown in Figure 8.
It can be concluded that perishability affects the profit generated across the SC but up to a specific point where the products become stable, at which point perishability no longer has an effect. The worst economic objective value resulted from AFSCs with very perishable crops and products having very short shelf-lives and improved with increasing the shelf life of both crops and products. Then, it stabilized for crops whose shelf life exceeds seven periods for the current case. This enforces the importance of accounting for perishability while designing the AFSC of crops and products with short shelf lives and this effect diminishes until reaching a stable point where crop and product perishability no longer affects the design of the SCN.

6.2.5. Managerial Insights

The trade-off analysis conducted in Section 6.2.3 provides a powerful decision support tool for managers while planning strategic as well as tactical decisions across the SC. If there is a governmental regulation on the maximum threshold of CO2 emissions across the SC or a company is seeking to be more sustainable with a specific target for CO2 emissions, such an analysis will provide the optimum SCN decisions that will lead to the maximum profit where it’s not possible to decrease the environmental impact without decreasing the generated profit across the SC.
The current proposed model assumes that processing facilities have already been established, and the case study to which the model was applied has one conventional traditional processing facility. However, other facility designs may result in lower CO2 emissions. For instance, using facilities with the biorefinery design improves the environmental objective due to its negative contribution through the production of biogas [2]. Thus, for not yet established SC configurations or SC configurations that are subjected to changes on the strategic level for improvement or development purposes, developing the model to account for different facility designs to be established is worth studying.
Furthermore, the analysis of the impact of perishability on the economic objective provides a very powerful decision support tool for managers while assessing the maximum limit of investment to be made in any new technology that may be introduced to prolong the shelf life of crops or products (e.g., refrigerated vehicles or improved refrigeration systems in storage locations in the processing facility), where the maximum limit of investment can be assessed by the increase in profit caused by the prolonged shelf life resulting from the new technology. Such an analysis can be carried by running the model on two scenarios; one is the base case scenario with the current setup and the demonstrated shelf life of crops and products, and the other scenario is with the new parameters caused by the new technology (e.g., the inventory carrying the cost and prolonged shelf life). As shown in Figure 8, prolonged shelf life causes an increase in the profits generated across the SC and, thus, it can be concluded that the maximum investment to be made in such a technology to prolong crops or products’ shelf life is equivalent to the increase in the generated profits.

6.3. Model Performance Test

Several instances were proposed to test the model’s performance with problems of high sizes, as shown in Table 9. A different combination of crops (I) and plots (K) were studied during the computational analysis.
The developed model was tested in seven different instances and their results are presented in Table 9 which shows the best economic and environmental solution for each instance. The computational time was directly proportional to the complexity of the problem, as the time exponentially increased with the increasing number of plots in each instance. The variation in computational time between the 12 crop and 5 crop problem showed the significant effect of the number of crops on the complexity of the problem. The increase in the problem size due to the variations in the number of crops almost doubled the computational time in each instance while it kept the number of plots constant. The instances’ solutions were compared to those presented in the recent publication of [7] and the results showed the same trend.
For the instances with five crops (I = 5), the chosen crops from the twelve crops were strategic crops, which are wheat, sugar beet, onions, and potatoes in addition to one legume crop as in [7]. The five crops represented five different families resulting in the flexibility to relax the constraint relating to the succession of crops from the same family without affecting the optimum solution.
The objective of this experiment was to test the effect of varying the number of decision variables of the model along with increasing the complexity of the problem on the computational time. The model was able to solve up to 1000 plots with 12 different crops with various crop families. The number of plots had a clear effect in that it increased the computational time and the economical objective function. The trade-off is clear between the computational time and the higher problem sizes; however, it does not affect the optimality of the solution.

7. Conclusions and Directions of Future Work

Given the contribution of the current infrastructure of the AFSC to food waste and food insecurity as well as its contribution to climate change and GHG emissions, the need to build a comprehensive background in the field is evident. Therefore, in this research article, AFSC was introduced in a detailed manner to fully understand its unique characteristics (e.g., seasonality, perishability, and uncertainty), stages and incorporated activities (e.g., agriculture, transportation, and processing).
Surveying the related literature resulted in the observation of a gap in accounting for the special characteristics of an AFSC (e.g., seasonality, perishability, cropping and harvesting) in an integrated manner in the design of a SCN configuration combining agricultural decisions with the transportation and processing decisions for multiple products and accommodating different planning levels over a multi-period planning horizon.
The main contribution of this article is the presentation of a deterministic multi-objective MILP model integrating agriculturally related decisions through accounting for crop rotation planning as well as harvesting decisions in the design of a sustainable AFSC incorporating transportation, inventory and processing decisions as well as determining the fulfilled demand, generated wastes, and lost sales. The model represents a strategic tactical decision support tool for managers aiming to achieve a economically competitive SC configuration in the agro-food industry while considering environmental sustainability. The proposed model considers the seasonal variability in yield and demand and the perishable nature of non-processed and processed products in addition to studying more than one cropping season through a rotation cycle.
Multi-objective optimization was used to optimize the economic and environmental dimensions. The proposed model was applied on a sugar beet processing chain in the Netherlands to obtain the crop rotation schedule across the planning horizon of one rotation cycle for different possible farm plans, which provided optimum decisions regarding which crops to be planted in which plots and in which periods in addition to the harvesting time and the harvested quantities based upon yield parameters. Optimum crop rotation schedules and SCN decisions vary with the objective function being optimized, showing a trade-off between the two contradicting objective functions. The Pareto frontier was investigated to study such a trade-off. It was found that to reduce the environmental impact, the fulfilled demand decreases through decreasing the planted, harvested, transported, and processed quantities to minimize the agriculture-, transportation- and processing-related CO2 emissions. However, the decreased fulfilled demand and increased lost sales causes an associated penalty which is the decrease in the total generated profits across the sugar beet SC.
The model can help with providing managerial insights related to environmental sustainability by providing a trade-off analysis between the economic and environmental objectives, which provides the optimum SCN with the maximum profit at a specified environmental impact level where it is not possible to reduce the environmental impact without negatively influencing the profit across the SC. Furthermore, the model can help managers specify the maximum limit of investment to be made in a technology to prolong the shelf life of products while remaining profitable by quantifying the impact of perishability on the economic objective function.
The proposed deterministic model has two main limitations that should be addressed in future research. Firstly, a stochastic version of the model should be developed to account for the main sources of uncertainty in AFSCs, such as yield and demand uncertainty. Secondly, to provide a more comprehensive model for the sustainable design of AFSCs, the social dimension of sustainability should be included. This addition could involve a consideration of indicators such as food security and health improvement, which are often overlooked in AFSC research. By addressing these limitations, future studies can offer a more robust and holistic understanding of AFSC performance and contribute to the sustainable development of agricultural systems.

Supplementary Materials

The following are available online at https://www.mdpi.com/article/10.3390/logistics7030046/s1, Table S1: Demand data based on 12 plots, Table S2: Distance matrix.

Author Contributions

Conceptualization, R.A., R.S.M., R.E. and M.G.; methodology, R.A., R.S.M. and R.E.; software, R.A., R.S.M. and R.E.; validation, R.A., R.S.M., R.E. and M.G.; formal analysis, R.A., R.S.M. and R.E.; investigation, R.A., R.S.M. and R.E.; resources, R.A., R.S.M. and R.E.; data curation, R.A., R.S.M., R.E. and M.G.; writing—original draft preparation, R.A., R.S.M. and R.E.; writing—review and editing, M.G.; visualization, R.A., R.S.M. and R.E.; supervision, M.G.; project administration, M.G. All authors have read and agreed to the published version of the manuscript.

Funding

This research received no external funding.

Data Availability Statement

Not applicable.

Conflicts of Interest

The authors declare no conflict of interest.

References

  1. van der Goot, A.J.; Pelgrom, P.J.M.; Berghout, J.A.M.; Geerts, M.E.J.; Jankowiak, L.; Hardt, N.A.; Keijer, J.; Schutyser, M.A.I.; Nikiforidis, C.V.; Boom, R.M. Concepts for Further Sustainable Production of Foods. J. Food Eng. 2016, 168, 42–51. [Google Scholar] [CrossRef]
  2. Jonkman, J.; Barbosa-Póvoa, A.P.; Bloemhof, J.M. Integrating Harvesting Decisions in the Design of Agro-Food Supply Chains. Eur. J. Oper. Res. 2019, 276, 247–258. [Google Scholar] [CrossRef]
  3. Gustavsson, J. (Ed.) Global Food Losses and Food Waste: Extent, Causes and Prevention; Study Conducted for the International Congress Save Food! At Interpack 2011, [16–17 May], Düsseldorf, Germany; Food and Agriculture Organization of the United Nations: Rome, Italy, 2011; ISBN 978-92-5-107205-9. [Google Scholar]
  4. Naylor, R. Expanding the Boundaries of Agricultural Development. Food Secur. 2011, 3, 233–251. [Google Scholar] [CrossRef]
  5. Ahumada, O.; Villalobos, J.R. Application of Planning Models in the Agri-Food Supply Chain: A Review. Eur. J. Oper. Res. 2009, 196, 1–20. [Google Scholar] [CrossRef]
  6. Soto-Silva, W.E.; Nadal-Roig, E.; González-Araya, M.C.; Pla-Aragones, L.M. Operational Research Models Applied to the Fresh Fruit Supply Chain. Eur. J. Oper. Res. 2016, 251, 345–355. [Google Scholar] [CrossRef]
  7. Fikry, I.; Gheith, M.; Eltawil, A. An Integrated Production-Logistics-Crop Rotation Planning Model for Sugar Beet Supply Chains. Comput. Ind. Eng. 2021, 157, 107300. [Google Scholar] [CrossRef]
  8. Fikry, I.; Gheith, M.; Eltawil, A. A New Mathematical Model for the Deterministic Crop Rotation Planning Problem. In Proceedings of the 2019 IEEE International Conference on Industrial Engineering and Engineering Management (IEEM), Macao, China, 15–19 December 2019; IEEE: Piscataway, NI, USA, 2019; pp. 314–318. [Google Scholar]
  9. Zegada-Lizarazu, W.; Monti, A. Energy Crops in Rotation. A Review. Biomass Bioenergy 2011, 35, 12–25. [Google Scholar] [CrossRef]
  10. Kusumastuti, R.D.; van Donk, D.P.; Teunter, R. Crop-Related Harvesting and Processing Planning: A Review. Int. J. Prod. Econ. 2016, 174, 76–92. [Google Scholar] [CrossRef]
  11. Accorsi, R.; Cholette, S.; Manzini, R.; Pini, C.; Penazzi, S. The Land-Network Problem: Ecosystem Carbon Balance in Planning Sustainable Agro-Food Supply Chains. J. Clean. Prod. 2016, 112, 158–171. [Google Scholar] [CrossRef]
  12. New FAO Analysis Reveals Carbon Footprint of Agri-Food Supply Chain. Available online: https://news.un.org/en/story/2021/11/1105172 (accessed on 30 January 2022).
  13. Banasik, A.; Kanellopoulos, A.; Bloemhof-Ruwaard, J.M.; Claassen, G.D.H. Accounting for Uncertainty in Eco-Efficient Agri-Food Supply Chains: A Case Study for Mushroom Production Planning. J. Clean. Prod. 2019, 216, 249–256. [Google Scholar] [CrossRef]
  14. Chaabane, A.; Ramudhin, A.; Paquet, M. Designing Supply Chains with Sustainability Considerations. Prod. Plan. Control 2011, 22, 727–741. [Google Scholar] [CrossRef]
  15. Quariguasi Frota Neto, J.; Walther, G.; Bloemhof, J.; van Nunen, J.A.E.E.; Spengler, T. A Methodology for Assessing Eco-Efficiency in Logistics Networks. Eur. J. Oper. Res. 2009, 193, 670–682. [Google Scholar] [CrossRef] [Green Version]
  16. Esteso, A.; Alemany, M.M.E.; Ortiz, Á. Impact of Product Perishability on Agri-Food Supply Chains Design. Appl. Math. Model. 2021, 96, 20–38. [Google Scholar] [CrossRef]
  17. Lucas, M.T.; Chhajed, D. Applications of Location Analysis in Agriculture: A Survey. J. Oper. Res. Soc. 2004, 55, 561–578. [Google Scholar] [CrossRef]
  18. Rong, A.; Akkerman, R.; Grunow, M. An Optimization Approach for Managing Fresh Food Quality throughout the Supply Chain. Int. J. Prod. Econ. 2011, 131, 421–429. [Google Scholar] [CrossRef]
  19. de Keizer, M.; Akkerman, R.; Grunow, M.; Bloemhof, J.M.; Haijema, R.; van der Vorst, J.G.A.J. Logistics Network Design for Perishable Products with Heterogeneous Quality Decay. Eur. J. Oper. Res. 2017, 262, 535–549. [Google Scholar] [CrossRef]
  20. Institute of Food Science and Technology of the United Kingdom. Shelf Life of Foods Guidelines for Its Determination and Prediction; Institute of Food Science and Technology: London, UK, 1993. [Google Scholar]
  21. Akkerman, R.; Farahani, P.; Grunow, M. Quality, Safety and Sustainability in Food Distribution: A Review of Quantitative Operations Management Approaches and Challenges. OR Spectr. 2010, 32, 863–904. [Google Scholar] [CrossRef]
  22. van Elzakker, M.A.H.; Zondervan, E.; Raikar, N.B.; Hoogland, H.; Grossmann, I.E. Optimizing the Tactical Planning in the Fast Moving Consumer Goods Industry Considering Shelf-Life Restrictions. Comput. Chem. Eng. 2014, 66, 98–109. [Google Scholar] [CrossRef]
  23. Hajimirzajan, A.; Vahdat, M.; Sadegheih, A.; Shadkam, E.; Bilali, H.E. An Integrated Strategic Framework for Large-Scale Crop Planning: Sustainable Climate-Smart Crop Planning and Agri-Food Supply Chain Management. Sustain. Prod. Consum. 2021, 26, 709–732. [Google Scholar] [CrossRef]
  24. Sinha, A.K.; Anand, A. Optimizing Supply Chain Network for Perishable Products Using Improved Bacteria Foraging Algorithm. Appl. Soft Comput. 2020, 86, 105921. [Google Scholar] [CrossRef]
  25. Fikry, I.; Eltawil, A.; Gheith, M. A Robust Crop Rotation Optimization Model With Water Scarcity and Net Return Uncertainty Considerations. IEEE Access 2021, 9, 128938–128950. [Google Scholar] [CrossRef]
  26. Shokouhifar, M.; Sohrabi, M.; Rabbani, M.; Molana, S.M.H.; Werner, F. Sustainable Phosphorus Fertilizer Supply Chain Management to Improve Crop Yield and P Use Efficiency Using an Ensemble Heuristic–Metaheuristic Optimization Algorithm. Agronomy 2023, 13, 565. [Google Scholar] [CrossRef]
  27. Jaehn, F. Sustainable Operations. Eur. J. Oper. Res. 2016, 253, 243–264. [Google Scholar] [CrossRef]
  28. Liu, A.; Zhu, Q.; Xu, L.; Lu, Q.; Fan, Y. Sustainable Supply Chain Management for Perishable Products in Emerging Markets: An Integrated Location-Inventory-Routing Model. Transp. Res. Part E Logist. Transp. Rev. 2021, 150, 102319. [Google Scholar] [CrossRef]
  29. Allaoui, H.; Guo, Y.; Choudhary, A.; Bloemhof, J. Sustainable Agro-Food Supply Chain Design Using Two-Stage Hybrid Multi-Objective Decision-Making Approach. Comput. Oper. Res. 2018, 89, 369–384. [Google Scholar] [CrossRef] [Green Version]
  30. Sazvar, Z.; Rahmani, M.; Govindan, K. A Sustainable Supply Chain for Organic, Conventional Agro-Food Products: The Role of Demand Substitution, Climate Change and Public Health. J. Clean. Prod. 2018, 194, 564–583. [Google Scholar] [CrossRef]
  31. Taghikhah, F.; Voinov, A.; Shukla, N.; Filatova, T.; Anufriev, M. Integrated Modeling of Extended Agro-Food Supply Chains: A Systems Approach. Eur. J. Oper. Res. 2021, 288, 852–868. [Google Scholar] [CrossRef]
  32. Rohmer, S.U.K.; Gerdessen, J.C.; Claassen, G.D.H. Sustainable Supply Chain Design in the Food System with Dietary Considerations: A Multi-Objective Analysis. Eur. J. Oper. Res. 2019, 273, 1149–1164. [Google Scholar] [CrossRef]
  33. Onggo, B.S.; Panadero, J.; Corlu, C.G.; Juan, A.A. Agri-Food Supply Chains with Stochastic Demands: A Multi-Period Inventory Routing Problem with Perishable Products. Simul. Model. Pract. Theory 2019, 97, 101970. [Google Scholar] [CrossRef]
  34. Fikry, I.; Gheith, M.; Eltawil, A. A New Formulation and Solution for the Crop Rotation Planning Problem. In Proceedings of the International Conference on Computers and Industrial Engineering, CIE, Beijing, China, 18–21 October 2019; Volume 2019. [Google Scholar]
  35. CBS Centraal Bureau Voor de Statistiek. Available online: https://www.cbs.nl/ (accessed on 12 February 2022).
  36. Asadi, M. Beet-Sugar Handbook; John Wiley & Sons, Inc.: Hoboken, NJ, USA, 2007. [Google Scholar]
  37. Mandryk, M.; Reidsma, P.; Kanellopoulos, A.; Groot, J.C.J.; van Ittersum, M.K. The Role of Farmers’ Objectives in Current Farm Practices and Adaptation Preferences: A Case Study in Flevoland, the Netherlands. Reg. Environ. Chang. 2014, 14, 1463–1478. [Google Scholar] [CrossRef]
  38. Hardenburg, R.E.; Watada, A.E.; Wang, C. The Commercial Storage of Fruits, Vegetables, and Florist and Nursery Stocks; Agriculture Handbook No.66 Revis; US Department of Agriculture: Washington, DC, USA, 1986.
  39. Wolf, J.; Mandryk, M.; Kanellopoulos, A.; van Oort, P.A.J.; Schaap, B.F.; Reidsma, P.; van Ittersum, M.K. Methodologies for Analyzing Future Farming Systems in Flevoland as Applied within the AgriAdapt Project; Wageningen UR: Wageningen, The Netherlands, 2010. [Google Scholar]
  40. Kolfschoten, R.C.; Bruins, M.E.; Sanders, J.P.M. Opportunities for Small-Scale Biorefinery for Production of Sugar and Ethanol in the Netherlands. Biofuels Bioprod. Biorefining 2014, 8, 475–486. [Google Scholar] [CrossRef]
  41. Jonkman, J.; Bloemhof, J.M.; van der Vorst, J.G.A.J.; van der Padt, A. Selecting Food Process Designs from a Supply Chain Perspective. J. Food Eng. 2017, 195, 52–60. [Google Scholar] [CrossRef]
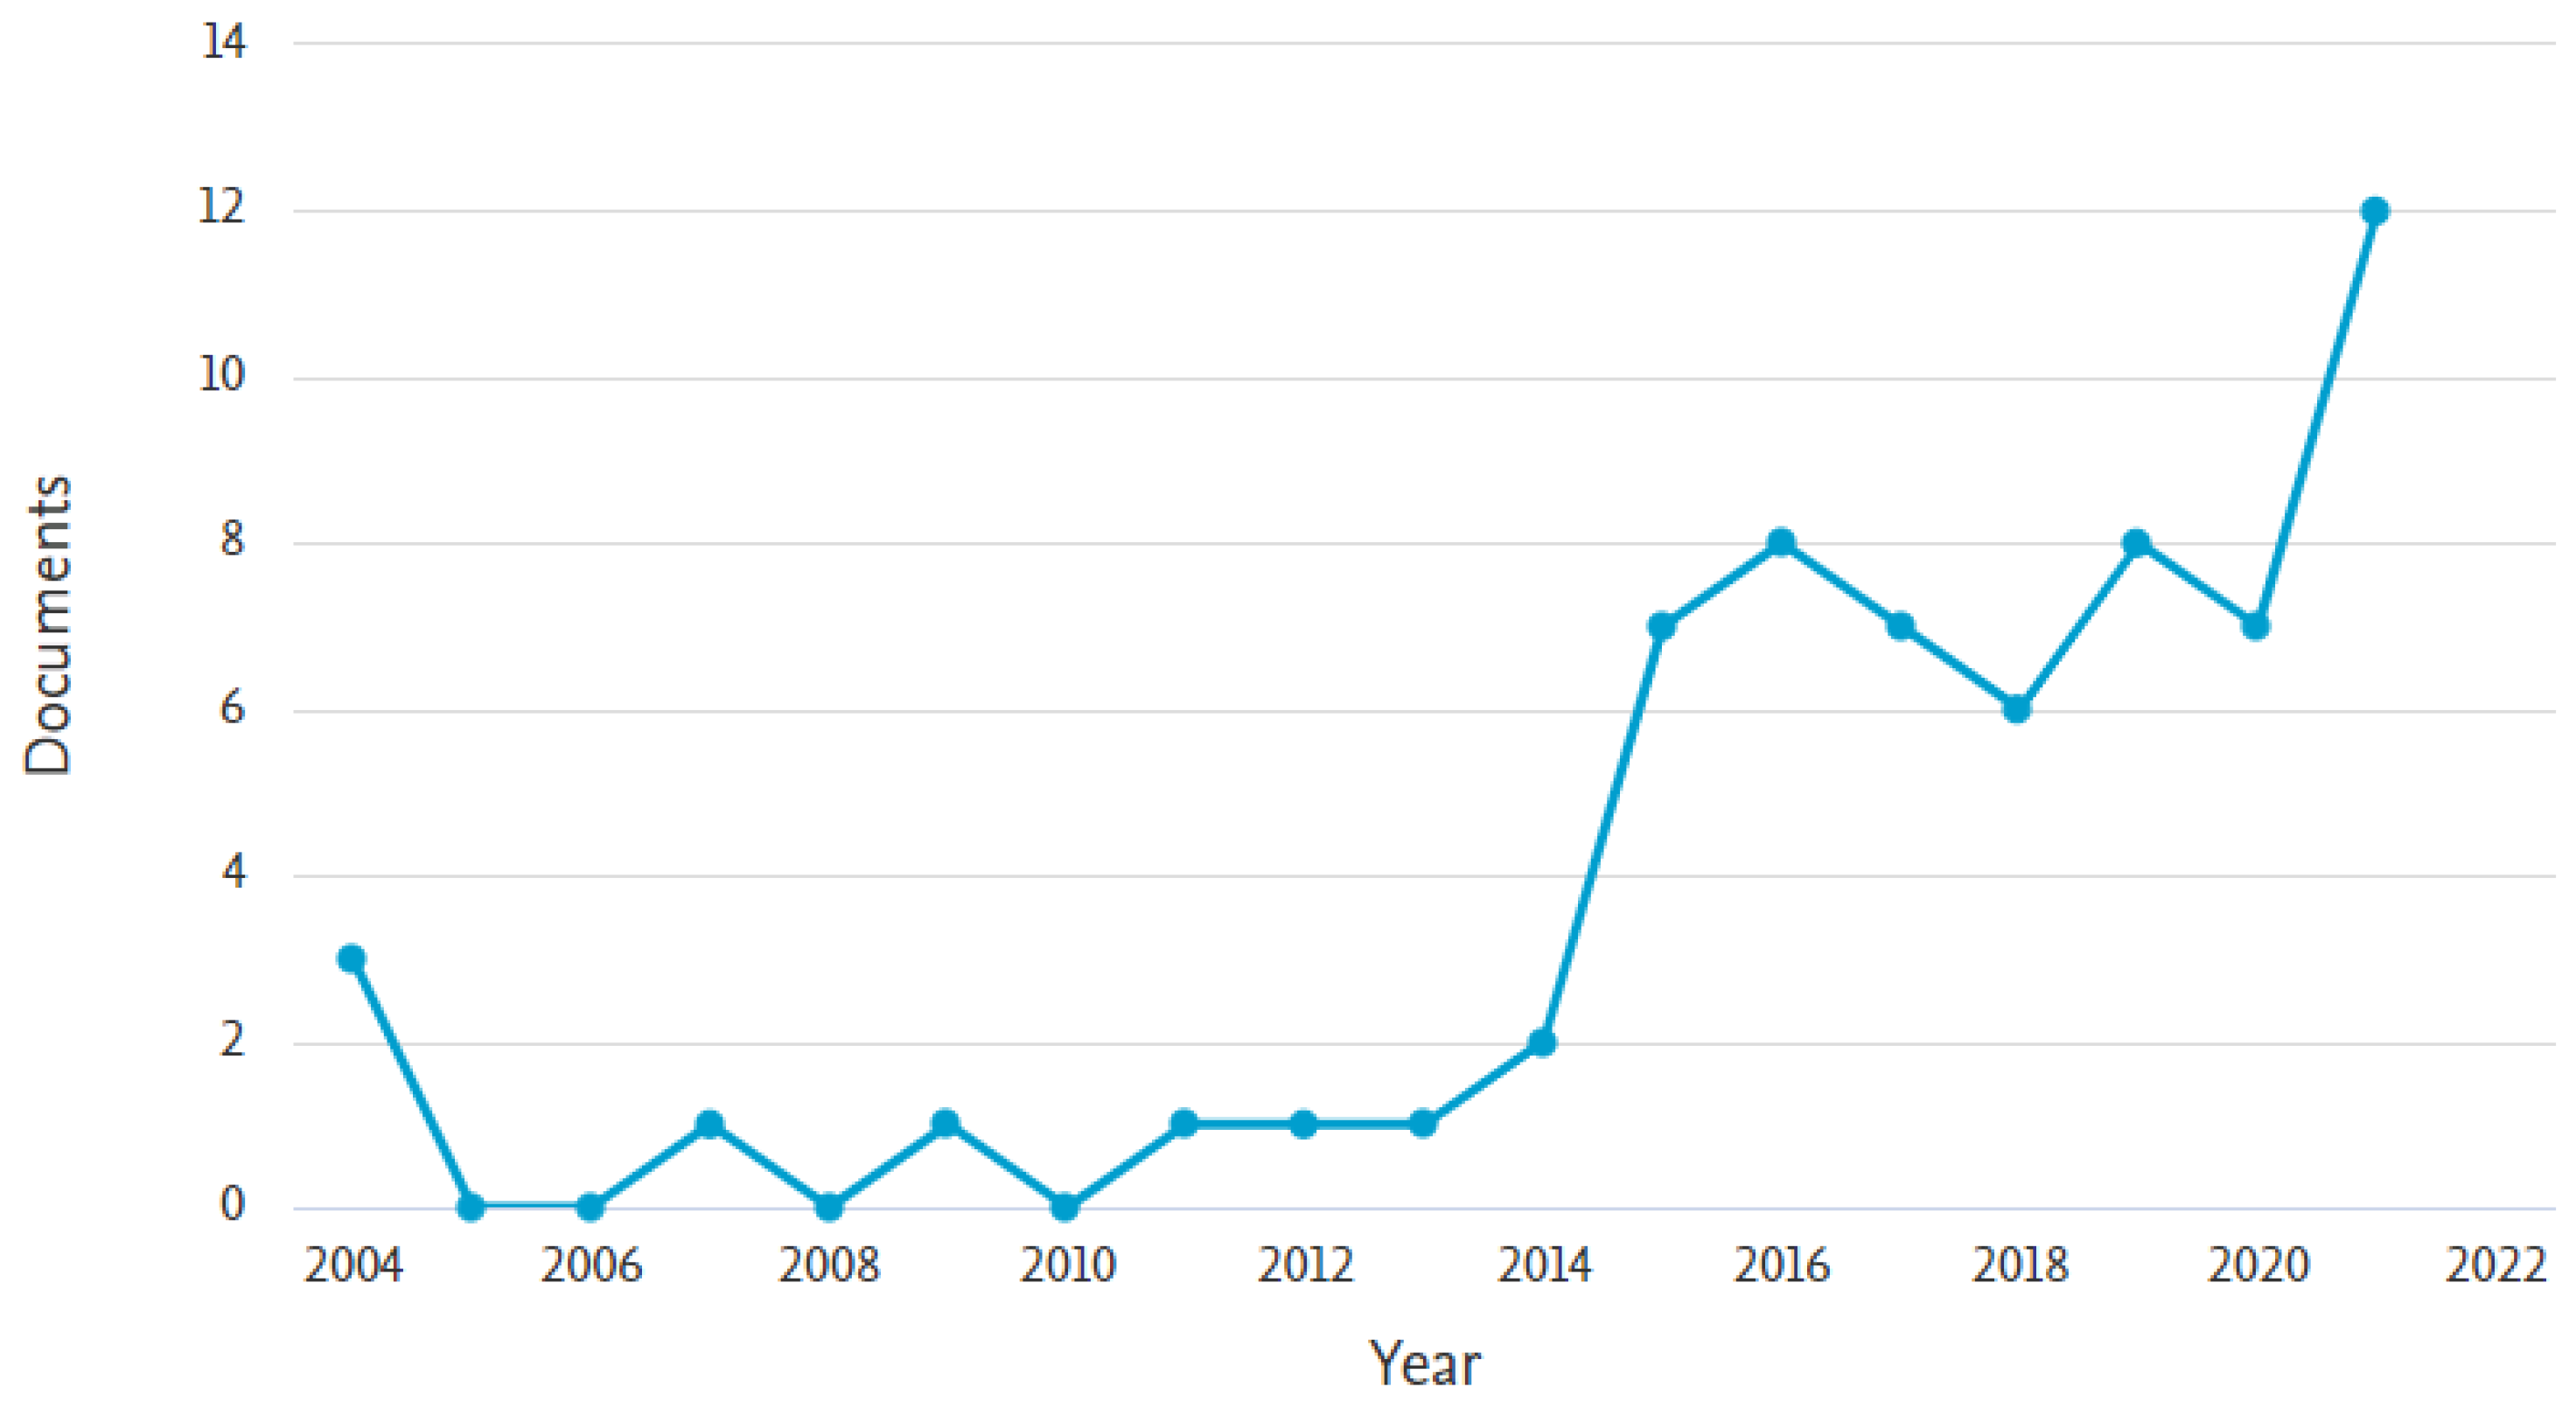
Figure 1. The trend of publications in the topic of AFSC from the Scopus database.
Logistics 07 00046 g001
Figure 3. Sugar beet farmlands and processing facilities in the Netherlands, 2017, based on [35].
Logistics 07 00046 g003
Figure 4. Farm schedule across the crop rotation cycle for all plots for scenario 1 (a).
Logistics 07 00046 g004
Figure 5. Farm schedule across the crop rotation cycle for all plots for scenario 1 (b).
Logistics 07 00046 g005
Figure 6. Farm schedule across the crop rotation cycle for all plots for scenario 2.
Logistics 07 00046 g006
Figure 7. The trade-off curve between the economic and environmental objectives. Different points on the curve represent different SC networks.
Logistics 07 00046 g007
Figure 8. Impact of perishability on economic objective (1 period = two weeks). Different points on the curve represent different SC networks. * Assuming the product shelf life is dependent on the crop shelf life where the product shelf life is four weeks longer than the crop shelf life.
Logistics 07 00046 g008
Table 1. Considered characteristics, planning levels and decisions in AFSC design in previous publications.
PublicationPlanning LevelADCRTrIndustrial StageProductsSePeHorizonEI
STOPStSiMSPMP
Accorsi et al., 2016 [11]
Allaoui et al., 2018 [29]
Sazvar et al., 2018 [30]
Banasik et al., 2019 [13]
Jonkman et al., 2019 [2]
Onggo et al., 2019 [33]
Rohmer et al., 2019 [32]
Sinha et.al, 2020 [24]
Esteso et al., 2021 [16]
Fikry et al., 2021 [7]
Hajimirzajan et al., 2021 [23]
Liu et al., 2021 [28]
Taghikhah et al., 2021 [31]
This paper
S: strategic; T: tactical; O: operational; AD: agricultural decisions; CR: crop rotation; Tr: transportation; P: processing; St: storage; Si: single; M: multiple; Se: seasonality; Pe: perishability; SP: single period; MP: multiple periods; EI: environmental impact.
Table 2. Methodologies used in the modeling and design of AFSCs in addition to the objective function studied in previous publications.
PublicationObjective FunctionModeling/Solution Approach
SingleMultiple
Accorsi et al., 2016 [11] Linear programing/Gurobi
Allaoui et al., 2018 [29] MILP/LP Solver
Sazvar et al., 2018 [30] Mixed-integer non-linear programing/CPLEX
Banasik et al., 2019 [13] Linear programing/Xpress-IVE
Jonkman et al., 2019 [2] MILP/CPLEX
Onggo et al., 2019 [33] MILP/hybrid method (heuristics and Monte Carlo simulation) using Java application
Rohmer et al., 2019 [32] Linear programing/Xpress-IVE
Sinha et.al, 2020 [24] Mathematical model/approximate method (improved bacteria foraging algorithm)
Esteso et al., 2021 [16] MILP/Gurobi
Fikry et al., 2021 [7] MILP/Gurobi
Hajimirzajan et al., 2021 [23] MILP/CPLEX
Liu et al., 2021 [28] Mixed-integer non-linear programing/YALMIP (MATLAB Toolbox)
Taghikhah et al., 2021 [31] Hybrid simulation modeling/AnyLogic
This paper MILP/Gurobi
Table 7. Optimum sugar beet SCN decisions with a single objective function.
Obj.
Function
THQ (tons)TTQ (tons)NTUTCI (tons)TPP (tons)TPI (tons)FD (tons)LS (tons)CW (tons)PW (tons)
Eco.12001200240176440176000
Env.6006001208877888800
Obj.: objective, Env.: environmental, Eco.: economic, THQ: total harvested quantity, TTQ: total transported quantity, NTU: number of trips used, TCI: total crop inventory, TPP: total processed products, TPI: total product inventory, FD: fulfilled demand, LS: lost sales, CW: crop waste, PW: product waste.
Table 8. SCN decisions at the transition points on the Pareto-efficient frontier.
Conf.Env. Obj. (kg CO2-eq)Eco. Obj. (EUR)THQ (tons)TTQ (tons)NTUTCI (tons)TPP (tons)TPI (tons)FD (tons)LS (tons)CW (tons)PW (tons)
147,61666,24112001200240175440175000
244,93057,374110011002201613371611500
339,55748,362100010002001462661462900
436,87039,3039009001801322001324400
531,49730,1828008001601171431175800
628,81021,0157007001401021051027300
723,43711,8336006001208877888800
Conf.: configuration; Obj.: objective; Env.: environmental; Eco.: economic; THQ: total harvested quantity; TTQ: total transported quantity; NTU: number of trips used; TCI: total crop inventory; TPP: total processed products; TPI: total product inventory; FD: fulfilled demand; LS: lost sales; CW: crop waste; PW: product waste.
Table 9. Instances studied in the model performance test and their results.
InstanceIJKTVPFEco. Objective (EUR)Env. Objective (kg CO2-eq)Gap (%)Computation Time (s)
1129612411166,240.723,43700.27
259612411166,249.723,43500.11
31296484111264,24392,87400.50
4596484111264,24392,87400.33
512961004111270,84591,29701.07
65961004111550,506193,58600.55
7129610004111281,38187,422014.05
Eco.: Economic, Env.: Environmental.
Disclaimer/Publisher’s Note: The statements, opinions and data contained in all publications are solely those of the individual author(s) and contributor(s) and not of MDPI and/or the editor(s). MDPI and/or the editor(s) disclaim responsibility for any injury to people or property resulting from any ideas, methods, instructions or products referred to in the content.