1. Introduction
Currently, as a result of globalization and digitalization, markets are increasingly competitive [
1,
2], and customers are more demanding [
3], so demand patterns are reflected in superior quality products at reduced prices and in a short period of time [
2,
4]. Thus, companies face an enormous challenge to maintain competitive advantage [
5].
Organizational success will depend on operational and financial performance [
6]. Therefore, companies must increase the efficiency and effectiveness of their processes [
7] and improve quality and productivity. In other words, the objective of organizations is to produce with high quality, quickly and with reduced costs [
3]. The search for excellence in these indicators should be an organizational concern [
8], which promotes innovation [
5] and continuous improvement [
2,
9,
10].
Therefore, only companies that improve processes [
1] in order to eliminate or at least reduce waste [
8], defects and non-value-added activities [
11], as well as reducing delivery times and increasing product quality [
8], will remain active in the market. It should be noted that continuous improvement is the driver for achieving these goals [
3,
10], in line with customer expectations [
5,
8]. So, the main aim of this research is to show the contribution of Total Flow Management to continuous improvement and to improve organizational performance so that the company under study responds to the market and maintains its competitive advantage. More specifically, it was intended to identify and eliminate or at least reduce waste; improve production and internal logistics flows; balance workloads; improve productivity; reduce lead time; motivate employees; promote the spirit of continuous improvement.
Several contributions can be highlighted in this work. From a theoretical perspective, the main contribution is associated with the use of the Action Research methodology to show the application of the Total Flow Management model in a practical context. In practical terms, the main contribution of this work lies in the presentation of the complete process of identification, analysis and improvement implementation in the various pillars of TFM, using various Lean tools and methods. Finally, in terms of managerial contributions, it is emphasized that this study may serve as a benchmark for future studies on the TFM model, particularly in the context of internal logistics activities.
Although the Industrial Unit where this study was carried out, which is responsible for customizing cork stoppers, is the market leader, it is inserted in a market with several competitors. In addition, the proximity to the end consumer increases the importance of seeking continuous improvement, more efficient processes and orientation towards customer needs since there is constant pressure to deliver value-added products in a short period of time and reduced costs. Moreover, more than half of the industrial unit’s sales are micro-granulated cork stoppers, that is, cork stoppers with little differentiation.
Therefore, the quality of finishes and customization, as well as the level of service and organizational performance, are of high importance to differentiate from the competition and maintain competitiveness. In addition, there is a need to motivate employees in order to stimulate the search for better performance and to be pickier and more critical. Thus, through the implementation of continuous improvement practices, the intention is to maintain a competitive advantage, involve employees, take advantage of their skills and improve organizational performance.
2. Literature Review
2.1. Lean
The lean approach emerged after World War II in order to increase efficiency and productive effectiveness [
4,
12], as well as decrease activities that do not add value and respond to customer requirements, which were not considered in mass production [
13]. So, with the implementation of lean, it was intended to improve production flows, through an analysis of processes rather than machine-to-machine, in a paradigm of continuous improvement, that is, kaizen [
13], for which it positively influenced productivity and quality indicators [
4,
12].
The idea of lean is to seek continuous improvement, realize and promote what adds value to the customer [
14], and optimize production [
15] by achieving zero waste [
14]. In other words, it focuses on highlighting what adds value and eliminating the rest [
15]. This is evidenced by its five principles—identify the value; identify the value stream; improve the value stream; pull production; seek perfection [
14,
16,
17,
18,
19].
In this way, lean aims to use various tools and techniques in order to eliminate waste [
12,
20,
21,
22], increase the rate of value-added activities [
20], respond to customer requirements [
4] and promote continuous improvement in quality, production and supply chain [
20], by maximizing the use of resources [
12].
Therefore, with the implementation of lean, it is expected a greater output with fewer inputs [
23], in a short period of time, with quality, at reduced costs [
3,
20,
24,
25]. Thus, it is possible to continuously improve processes [
17] and flows [
22], promote flexibility and response to change [
26], as well as increase production and maintain or decrease the resources used [
21].
Thus, lean seeks to identify and eliminate waste [
1], reduce costs and increase customer satisfaction through increased quality and/or price optimization [
14]. By removing waste from manufacturing and increasing the velocity of the movement of materials, companies become leaner [
27]. Evidently, lean is considered a sustainable management strategy, which promotes the achievement of good organizational results and, naturally, continuity in the markets [
20,
28], which is why it is widely used in organizations [
1].
2.2. Kaizen
Kaizen is a Japanese term that derives from the two words “kai”, which means “to change”, and “zen”, which means “better” [
2]. Therefore, the term kaizen means “to change for the better” [
14] or continuous improvement [
23] through small steps taken gradually [
13], that is, to improve without interruptions [
2]. So, it represents the last principle of lean. This concept has been increasingly used by organizations [
23], with a considerable impact [
2].
Through kaizen, it is possible to analyze complex processes and implement improvements in a simplified way. However, the results can be significant in productivity, efficiency and effectiveness indicators [
14] because they allow for improving the workplace, simplify complex processes [
4] and enable the reduction of waste [
2,
14]. Additionally, the implementation of kaizen promotes flexibility and increased quality, providing a competitive advantage [
2]. Therefore, kaizen must be part of the daily life of organizations and human resources [
23], from the highest management positions to factory floor employees [
2].
Table 1 presents some of the recent publications on continuous improvement through case studies or action research and highlights the use of the terms “lean” or “kaizen” in the various publications.
2.3. The 3 M’s
Literature on lean addresses the 3M’s concept—muda, mura and muri [
23].
Muda refers to waste [
13,
23], which will be addressed in greater detail in the next topic. Mura refers to variability [
13], a deficit of stability and reliability [
23]. Finally, muri refer to overloads [
13], requiring a greater effort in terms of time and energy [
23]. Note that mura and muri are consequences of muda [
15].
2.4. Waste
The lean approach aims to identify and eliminate waste [
4]. So, first, it must be realized what a waste is.
Waste is something that does not add value from the customer’s perspective [
4,
12,
13,
14], adding costs [
25]. Waste significantly impacts the organization’s performance [
12] and reduces profits [
25]. Since the customer is not willing to pay for this type of event [
26], when they are not necessary for the productive activity, they must be eliminated or at least reduced [
13].
Initially, seven wastes were addressed [
12,
16,
23]: defects; waiting; transporting; overproduction; inappropriate processing; motions; and inventory. However, more recently, a new waste has been introduced—misuse of employees’ skills [
12].
2.5. Total Flow Management (TFM)
In order to promote continuous improvement, the Kaizen Institute has developed a new model—Total Flow Management—which can be defined as:
“an integrated system for increasing process flow and pull effectiveness across the entire supply chain” [
23].
Therefore, TFM’s main objectives are to reduce or eliminate waste, improve productivity, improve quality and/or improve the level of service through the following improvement pillars—production flow, internal logistics flow and external logistics flow, as well as basic stability and supply chain design [
23].
Although the implementation of the TFM has a positive impact on organizations, to the author’s best knowledge, the publications that demonstrate its practical implementation are reduced, being limited to dissertations for obtaining a master’s degree (
Table 2), according to the bibliographic research carried out.
2.5.1. Basic Reliability
To implement the TFM, before starting with any of the pillars, an analysis of the basis must be performed—basic reliability. That is the stability of manpower, machines, material and method (4M’s). Only after ensuring some stability it is possible to improve the flow pillars (production flow, internal logistics flow and external logistics flow) [
23].
2.5.2. Production Flow
The first pillar of TFM flow—production flow—aims to promote the unit flow and, consequently, a continuous flow throughout the entire process; minimize the waste of employee movements; mass customizes, and simplify before automating. These goals can be achieved through changes in layout, border of line, standard work, SMED and, finally, automation [
23].
2.5.3. Internal Logistics Flow
Directly associated with production, the internal logistics flow, that is, the flow of materials and information in the gemba [
23], must guarantee the existence of the correct materials, in the correct quantity, time and place [
41], without increasing stock levels, movements and waiting times [
23]. Thus, it is intended to increase the efficiency of processes, transport, picking and resources through a balance between production and logistics [
23]. To promote continuous improvement of this pillar, supermarkets, mizusumashi, synchronization, leveling, and a pull production plan should be considered [
23].
2.5.4. External Logistics Flow
External logistics flows are the movements of materials and information between organizations, that is, outside the manufacturing facilities. The objectives of this flow are to minimize stocks, eliminate waste in logistics and minimize logistics costs. To achieve these, improvements can be made through the development of efficient storage systems, the use of milk-run transport routes, reception and dispatch flows and pull logistical planning [
23].
2.5.5. Supply Chain Design
Finally, the design of the supply chain intends to encompass the flows described above. A supply chain represents several organizations that cooperate to deliver a good or service to the customer, from the raw material supplier to the final consumer [
42]. Therefore, in order to analyze and manage the total flow of the company under analysis, its suppliers and customers must be represented. Thus, to implement improvements, three situations are expected: the analysis of the initial situation (value stream mapping) and identification of improvement opportunities; mapping of the future situation (value stream design) and, finally, implementing the changes [
23,
43].
3. Materials and Methods
To achieve the previously mentioned objectives, the action-research strategy was considered because it allows problem-solving [
44,
45,
46] and contributes to knowledge [
45,
46], where the researcher has an active role and cooperates in a team in the problem environment [
46]. Coughlan and Coghlan [
45] also emphasize that it is an investigation in action and not about action, which occurs simultaneously with the action to be analyzed. The approach used is cyclical and includes the following steps: collecting data, making the data available to the team, analyzing the data, planning actions, implementing the actions and evaluating [
45,
47]. These steps are repeated several times in order to find new actions, promoting change [
46].
Initially, through monitoring at the gemba, the integration into the company and familiarization with the products and processes took place. So, the first contact with employees was made, and it was obtained an overview of the core of the production process.
The next step was to clearly identify the problem. After an overview of the entire production process, more detailed observations were carried out, and data was collected in the various production sectors through unstructured interviews, direct observations and documentation analysis. Firstly, all the operators’ tasks were surveyed and discriminated, as well as work measurements, spaghetti diagrams and material and information flow identification schemes were performed.
This was followed by a detailed analysis of the data and identification of opportunities for improvement. The objective was to identify and reduce waste, as well as improve internal logistics and production flows, through reorganization. Finally, some identified actions were implemented, results were monitored, and successful actions were normalized.
4. Results
The present practical case was applied in an industrial unit responsible for customizing cork stoppers before being sent to end customers. In this way, it follows a postponement strategy, and the production is managed by the pull system in a make-to-order logic. In other words, the existence of the industrial unit delays the customization of the product until the moment the customer makes the request. So, the company’s entry products are mass-produced cork stoppers and the finished product is treated and/or marked cork stoppers, ready to be bottled.
The proximity to the final consumer increases the importance of seeking continuous improvement, more efficient processes and orientation to customer needs. In addition, more than half of the sales of the industrial unit are micro-granulated cork stoppers, that is, undifferentiated cork stoppers. Thus, the quality of finishes and customization, as well as the level of service and organizational performance, are of high importance to differentiate from the mark and maintain competitiveness.
The process to obtain the finished product can go through several sectors: reception, selection, branding, treatment, packaging and expedition. However, it should be noted that the steps the product goes through depend on the customer’s requirements; thus, at the limit, the stoppers can go through all the steps mentioned directly, from reception to treatment and packaging or, exceptionally, from reception to the expedition.
4.1. Initial Situation
In addition to analyzing the initial situation, at the beginning of a continuous improvement project, it is important to identify the value chain. Thus, the development of a VSM was considered relevant. However, in the first instance, it is interesting to analyze the demand.
Additionally,
Table 3 shows the distribution of demand across the various sectors of the unit’s gemba. The most sought-after value chain is the one that covers all sectors except for choice. However, the choice of cork stoppers is a specific task that requires specialized labor, which results in less flexibility.
Given the above, it was decided to consider the longest value chain, that is, the one that covers all sectors. Thus, it was possible to develop the VSM from the initial situation. The production process, which encompasses the value chain, has a lead time of 16 days (
Figure 1). That is, the customer has to wait 16 days from the request until receiving the product (
Appendix A).
However, the takt time is 10 s per thousand cork stoppers. In other words, to satisfy customer demand, it is necessary to produce at a pace of 10 sec/ML. Thus, it is possible to see in
Figure 1 that there are two value-added activities that can satisfy the demand (branding and stretch wrapping a pallet) and three activities that have a high cycle time (selection, treatment and packaging) when compared to takt time (
Appendix A).
Therefore, since the intention is to improve the efficiency and effectiveness of the process, the identification and elimination or, at least, reduction of waste must occur [
3]. Note that, through the VSM, it is not possible to identify all opportunities for improvement. However, the VSM facilitates the analysis and allows the identification of the sectors to be improved because they influence the value chain [
4]. Therefore, there is a need to analyze in greater detail the selection, treatment and packaging processes. It was decided to also analyze the branding because it is the sector with the greatest influence on quality.
4.1.1. Basic Reliability
As mentioned by Coimbra [
23], before analyzing any of the flows, the stability of the 4M’s must be verified—manpower, machines, material and method.
Starting with the manpower, punctuality and attendance are characteristics of all employees. However, nowadays and as a result of the current pandemic situation, due to the new coronavirus SARS-COV-2, it is not always possible to rely on the assiduity of human resources. Regarding the spirit of continuous improvement, although there is still some resistance to change, the effort to cultivate it must be emphasized.
In relation to materials and machines, stability is assured. A more detailed analysis will be made in the following subsection with regard to methods.
4.1.2. Production and Internal Logistics Flows
In order to better understand the production and internal logistics flows, work measurements and spaghetti diagrams were carried out for the various sectors. Throughout this study, excel was used as a random generator to avoid data bias.
First, it should be noted that, given the characteristics of the product, it is not possible to maintain a unitary flow per cork stopper. However, there is a unitary flow of containers. Despite this, throughout the entire process, there are two handling units (
Figure 2), and it is not necessary to use machinery. The baskets can carry around 1500 cork stoppers. On the other hand, carts carry between 20,000 and 24,000 cork stoppers. During subsequent analyses, this difference will be detailed.
In addition, it should be said that, between branding and treatment, there needs to be a period of stabilization in order not to compromise the quality of the mark. Thus, there is no continuous and unitary flow between these sectors, resulting in a stock of around 3.1 days, as observed in the VSM. Additionally, it should be noted that the factory has a functional layout due to the characteristics of the machines.
Considering the above, below is an explanation of the initial situation for the various sectors.
The branding sector is responsible for customizing the cork stoppers by placing the customer’s brand. It’s composed of 3 employee profiles: supplier, tuner and controller (
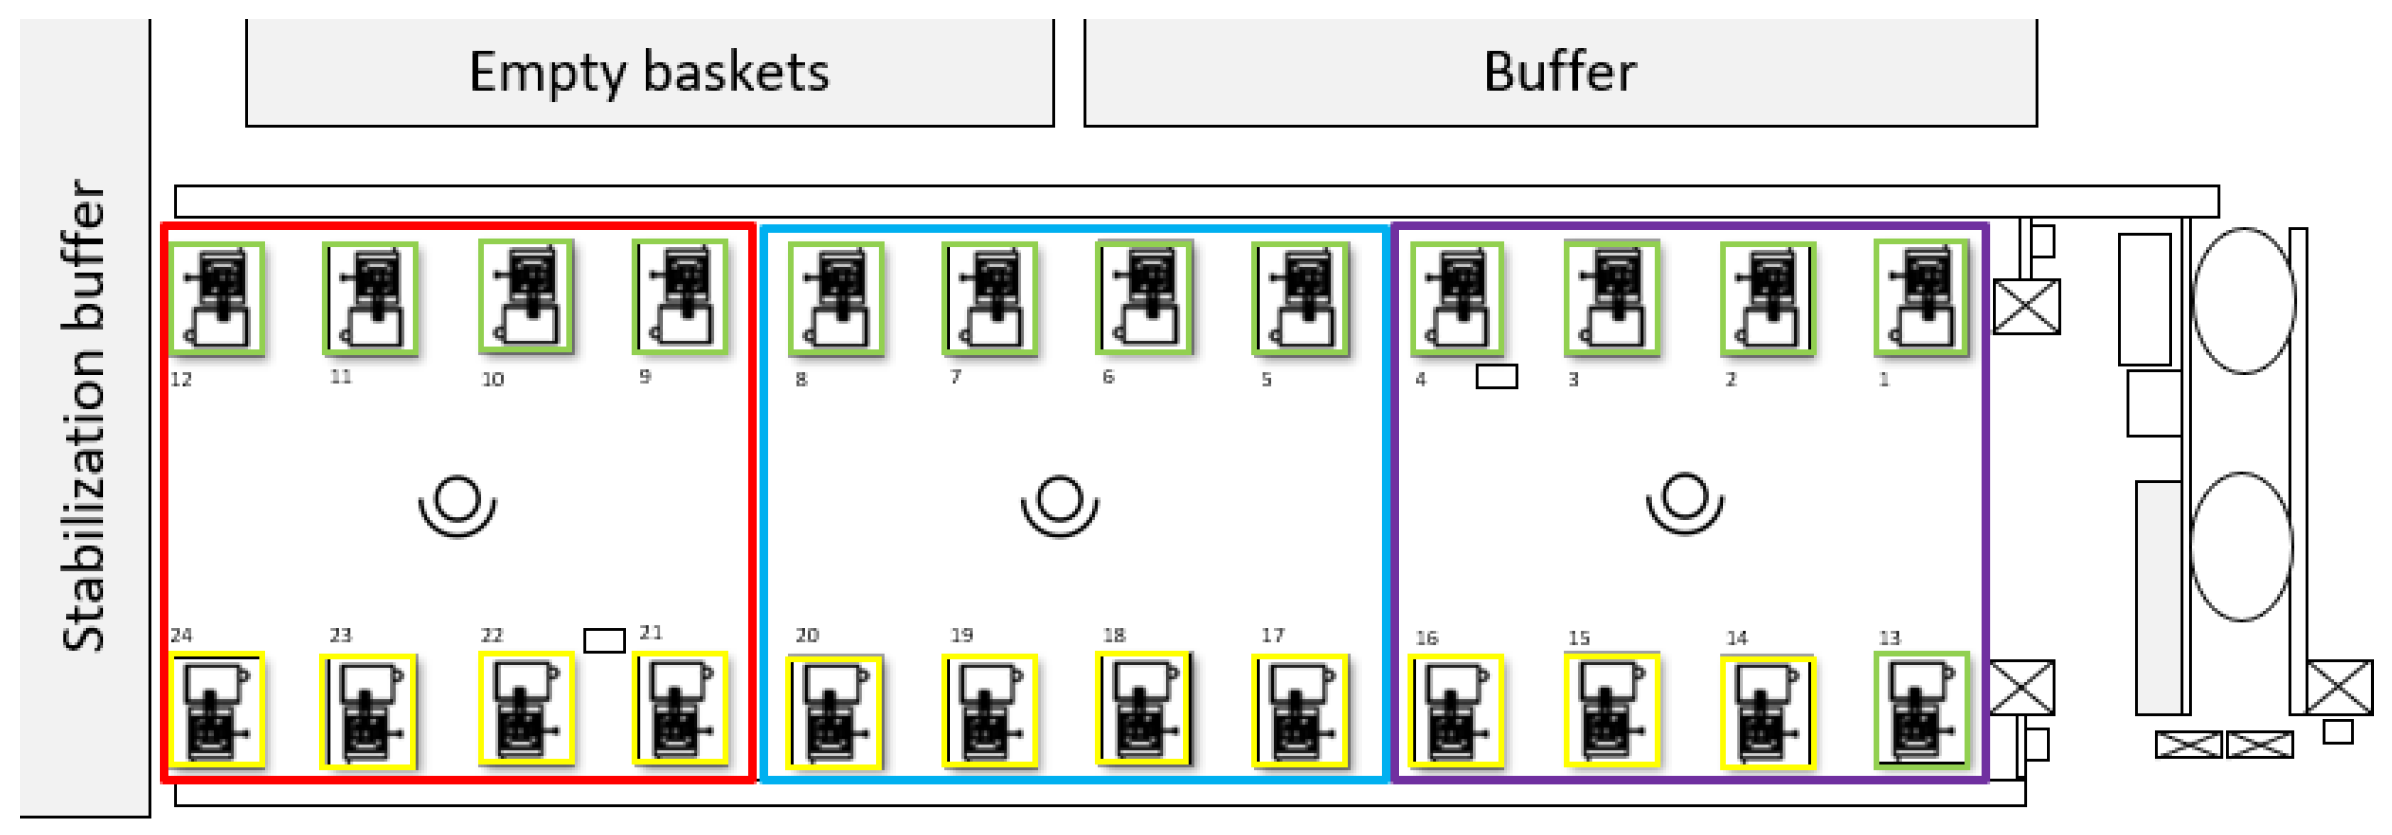
Table 4). The supplier’s function is to supply the machines with corks, as the name implies. The tuner is responsible for setups, that is, for changing brands between orders. The controller is responsible for controlling the status of the branding, making any necessary adjustments or alerting the tuner to bigger problems and transporting the containers.
Therefore, the various collaborators were analyzed in order to understand the impact of the transport units. Note that each of the four controllers is responsible for six machines in the line, as shown in
Figure 3.
First, spaghetti diagrams were made during 1 h of observation (
Figure 4). In both situations, high transport is evident, which is one of the wastes.
Thus, the work measurement was followed, over 2.5 months, in order to quantify time because, as Castro and Teixeira [
48] stated, it is only possible to improve what is measured. That said, since activities show variability, it was used the work sampling method to identify the times occupied in baskets/carts changes, baskets/carts transport and control. Thus, for a confidence level of 90%, the following results were obtained:
Therefore, the results suggest a difference of 9% at transports, using baskets and carts, and 10% at carts/basket changes (
Table 5). Furthermore, it should be noted that normal ink machines should be cleaned every day. Therefore, there is a stop in production to carry out cleaning for 1 h/day. In addition, it should also be noted that the 12 machines represented in the top row of
Figure 3 must be cleaned every day. Therefore, there is a stop in production to carry out cleaning for 1 h/day.
The next sector, treatment, is responsible for wrapping the cork stoppers in chemical products in order to facilitate bottling and unbottling. It is composed of 1 employee responsible for three manual machines and two employees responsible for four automatic machines each. Analogous to the analysis carried out in the marking sector, a more detailed analysis was carried out of the two employees responsible for the automatic machines, one of which handles cork stoppers moved in baskets and the other in carts.
Through the spaghetti diagrams performed during 1 h (
Figure 5), it is possible to verify that the transport of cork stoppers between the stabilization buffer and the treatment machines is significant.
Again, in order to quantify the work, a work measurement study was carried out through the work sampling method because the activities in the analysis are not repetitive. Thus, the data suggest that, for a confidence level of 90% and an error of 8%, the transport rate is 32% and 38%, the occupancy rate is 31% and 26% and the rate of inactivity of 37% and 36% for observations with baskets and carts, respectively (
Table 6).
It should be noted that there is some downtime for employees in this sector, but it is important that this happens, for the correct management of priorities, for reasons of ergonomics and control.
As a result of the direct observations necessary for the construction of work measurements and spaghetti diagrams, another problem that influences production flows and internal logistics was identified, which was the lack of cork stoppers in production, when these exist in the facilities. When this happens, there are two possible scenarios to tackle this problem type.
The first and least suitable is to ignore and send the existing cork stoppers to the following sectors. The order cannot be closed with missing cork stoppers; before finishing the order, there is a need to complete the missing stoppers. Thus, new production orders are generated for all preceding sectors.
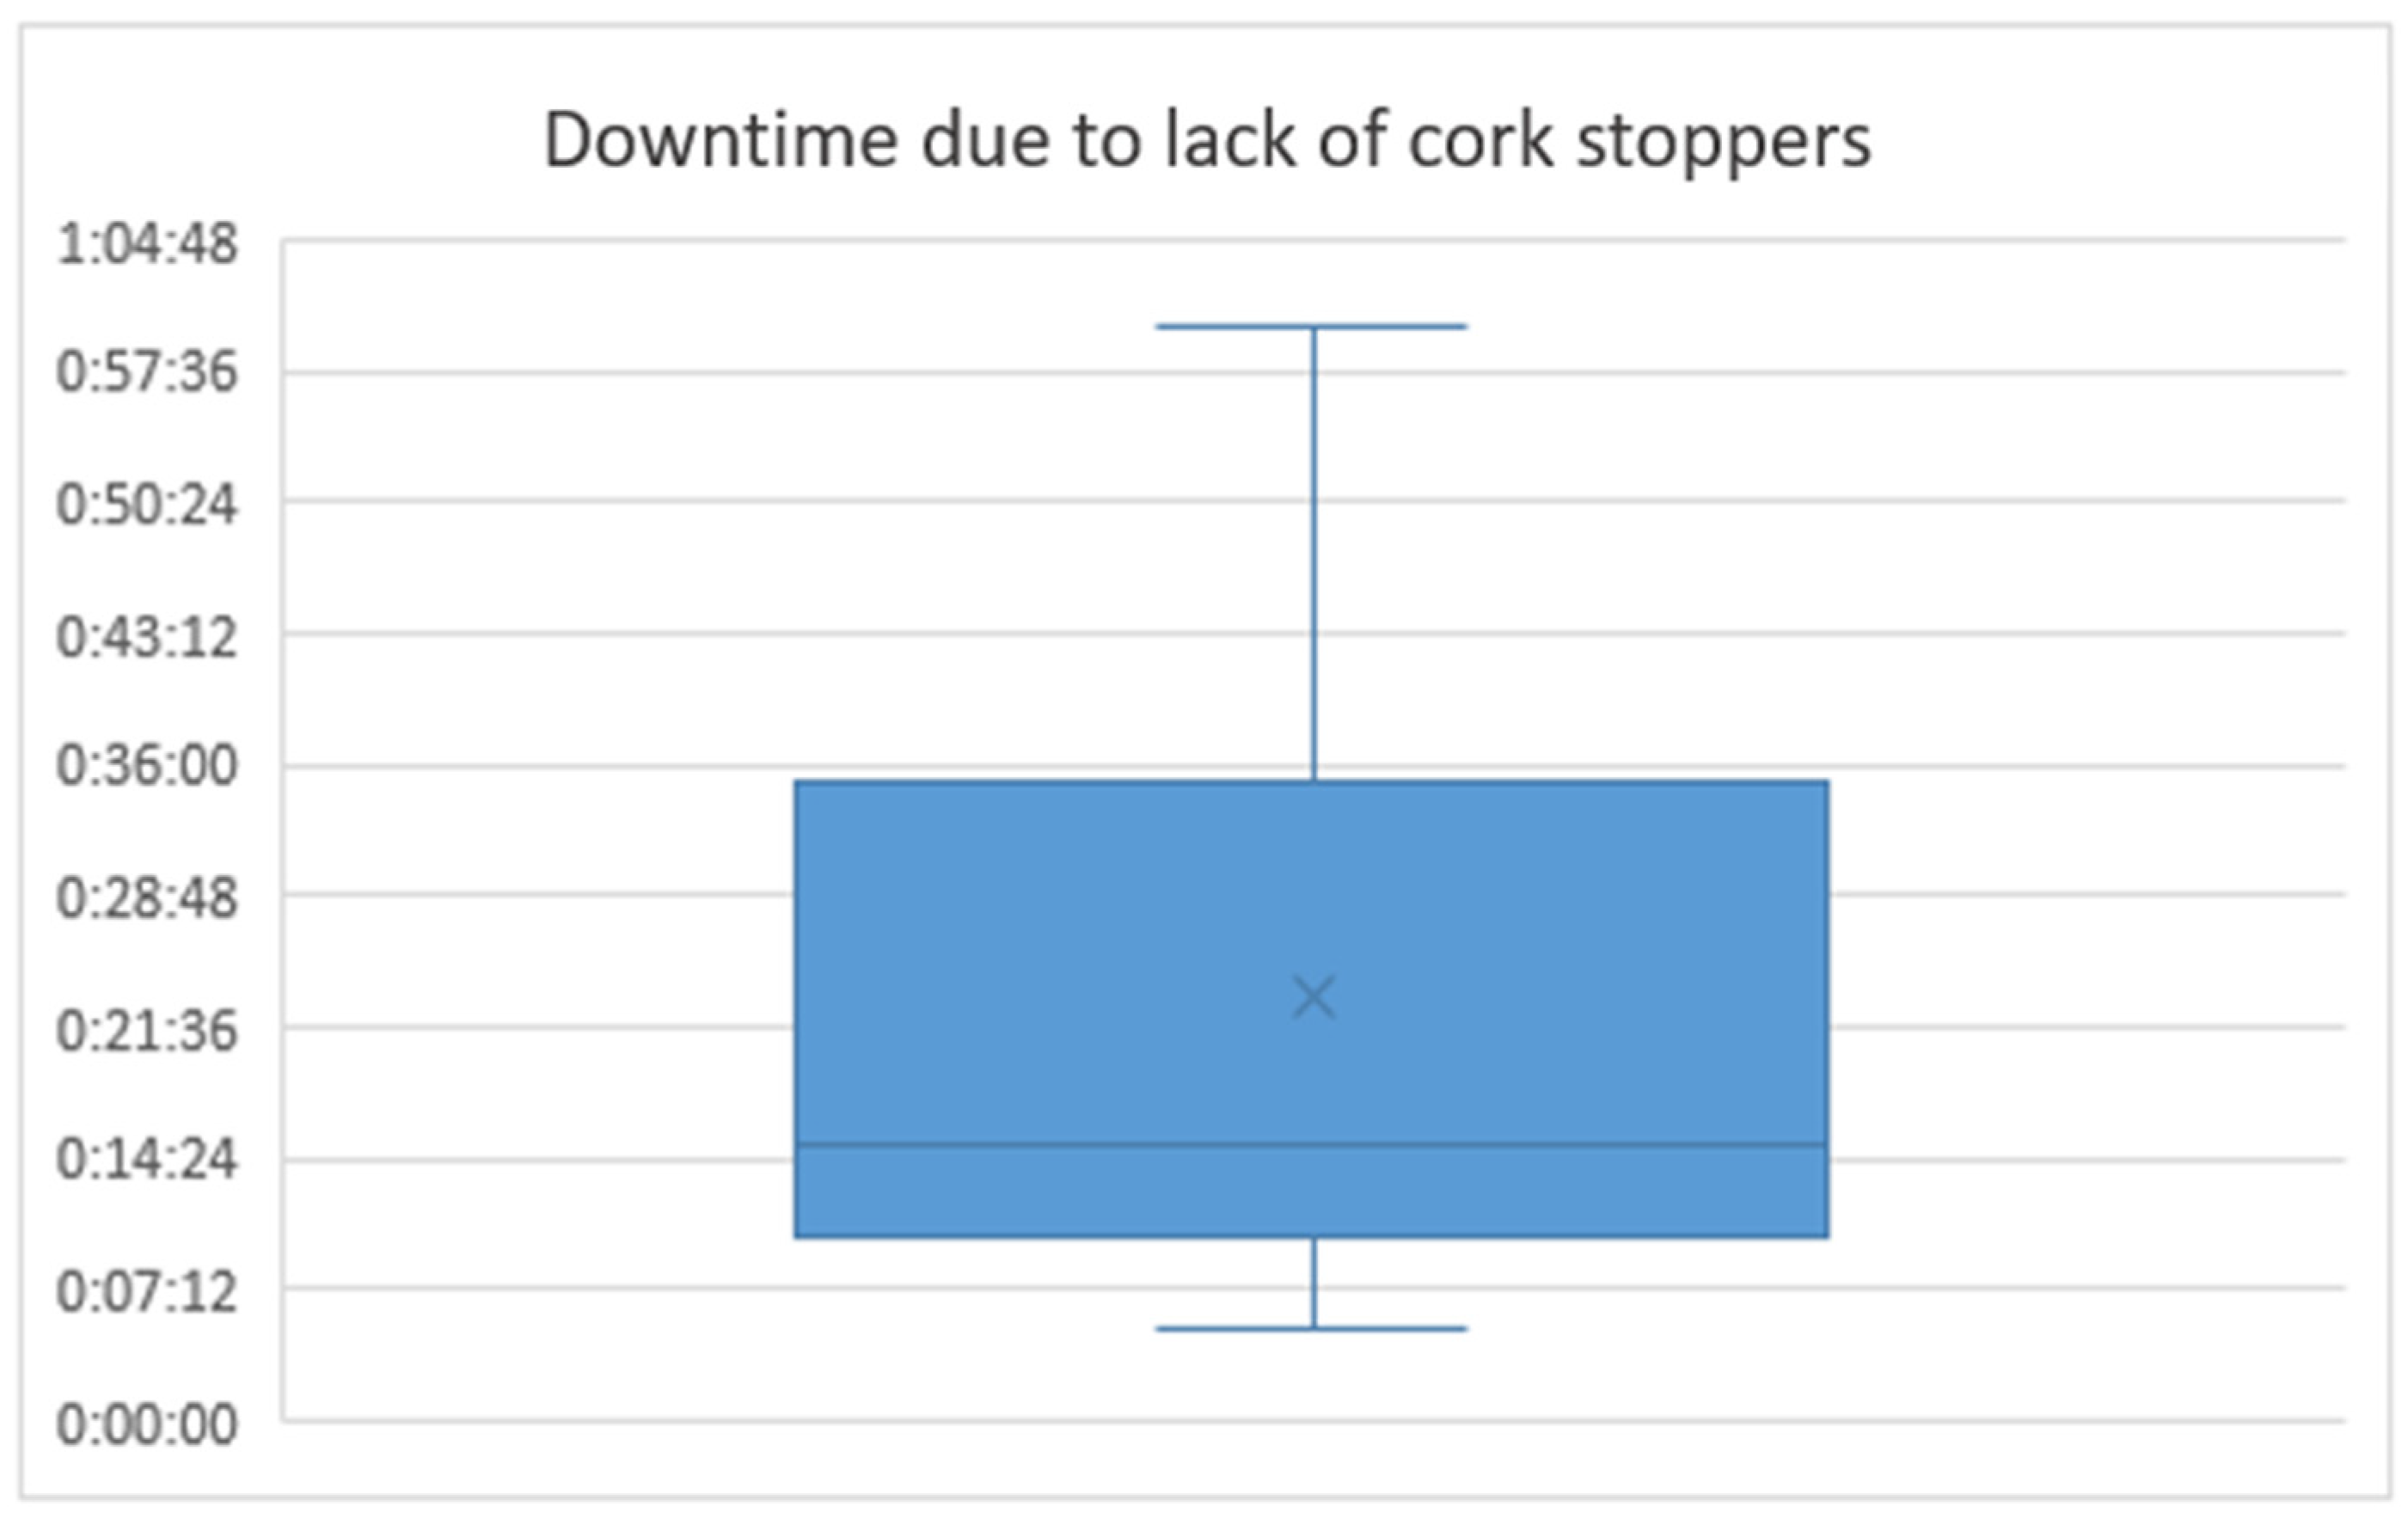
In the second scenario, it is necessary to check if there are similar corks in the buffer and, if this does not happen, communicate to the production office so that the material can be requested from the warehouse. Through a random data collection (N = 19), it was possible to verify that the machines are, on average, stopped for 24 min waiting for cork stoppers to finish the order, and in 50% of the situations, the wait was longer than 15 min (
Figure 6). In this way, two wastes are evident—rework (cork stoppers requisition process) and waiting (machine inactive until the arrival of the corks to complete the order).
4.2. Identification of Improvement Opportunities
The value and value chain are verified, so waste must be identified [
14,
16,
17,
18], and consequently, opportunities for improvement must be recognized. Therefore, to promote basic stability and production and internal logistics flows, a more detailed description of various opportunities is presented below.
4.2.1. Basic Reliability
Starting with basic reliability, it is possible to identify three opportunities for improvement (
Table 7).
In order to avoid the effects of the new coronavirus SARS-COV-2 and absenteeism, it is important to obtain a team rich in skills and not have jobs dependent on a single employee. In this way, the main tasks of the various workplaces, the necessary skills, the skills acquired by employees and the training opportunities and needs must be identified. At the same time, the training of pivots is suggested, that is, employees who can replace colleagues in case of absences, unscheduled stops or increase of the capacity to respond to peaks in demand.
In addition, work instructions should be developed that facilitate training, communication and flexibility of human resources. Furthermore, the work instructions promote standard work; that is, they define the efficient sequence of carrying out the necessary activities and operations [
23].
Additionally, it is considered important to implement the 5S method in various sectors to avoid resistance to change and promote a spirit of continuous improvement. As suggested by Coimbra [
23], the implementation of 5S’s promotes changes in the workplace with visible results. Thus, employees will feel involved and empowered. Therefore, it is expected that this will be the starting point for the implementation of several improvements.
In addition to the spirit of continuous improvement, employee motivation is also important. During the course of the study and through informal conversations, it was possible to see that employees were unmotivated with the indicator and objective that was proposed to them—production—because it was dependent on customer demand and subject to seasonality. For this reason, it is suggested to change the indicator to the level of service, as it reflects the rate of fulfillment of customer demand. Therefore, employees will perceive what is asked of them and will feel that they can act. In addition, it is an important indicator of competitiveness [
2,
4].
4.2.2. Production and Internal Logistics Flows
Through a more detailed analysis of the initial situation, it was possible to identify several opportunities for improvement that influence production and internal logistics flows (
Table 8).
Given the above,
Figure 7 was constructed with the data from the work measurement. It is evident that the baskets have a higher workload when compared to carts, except for transport in the treatment. This is because the carts are transported one by one from the stabilization buffer to the machines, while the baskets can be transported several simultaneously.
Thus, using carts as a transport unit, employees would have more availability for control activities, with the exception of the treatment sector, which can be filled with the implementation of mizusumashi (carrying more than one cart on each trip), as will be shown later. Thus, it would be possible to detect any quality problem more rapidly. Note that quality problems can result in various waste—defects, reprocessing and/or waiting—as well as lost sales, image degradation and reduced production capacity [
29]. In addition, the carts already have adequate capacity for each treatment cycle; that is, they are adapted to the production equipment, which allows for the adequate one-piece flow, as mentioned by Coimbra [
23].
Although the workload is balanced in the treatment sector (
Figure 7), the same is not true in the branding sector. Thus, it is suggested that the allocation of machines does not occur in line (
Figure 3) but in the mirror (
Figure 8), with a balance between machines that use carts and machines that use baskets.
Thus, through the data collected and presented in
Section 4.1, four possible scenarios emerge (
Figure 9). As seen above (
Figure 8), initially, there were four employees in the sector—2 were allocated to machines that use carts and the rest to machines that use baskets, totaling six machines per employee. As the objective is to adjust the workload and increase productivity without compromising quality, it is important to have a maximum of 4 employees.
Thus, in the first scenario considered (4 employees in baskets + carts), the working conditions are the same as those that were initially in force, except for the employee–machine distribution, which takes place according to
Figure 8. Consequently, if only carts are used (improvement opportunity 1—production flows and internal logistics), we are faced with the second scenario presented.
That said, the reduction of one employee in this sector was considered, resulting in the third and fourth scenarios presented, like the previous ones. Therefore, in the third scenario, the operation of the machines is the same as the current one. However, there is one less employee. In the fourth scenario, it is considered that only carts are used, and there are only three employees.
Therefore, in order to have a better balance of the workload without compromising the time for quality control, it is considered that the most appealing scenario is the fourth, as it uses only three employees and has a good rate of time for control.
As shown above (
Figure 7), the time spent on transport cannot be neglected and is part of the activities of the various employees. Thus, it is suggested to concentrate all transport on a single human resource and to implement a mizusumashi—one of the improvements advocated by Coimbra [
23] to promote the internal logistics flow. Therefore, the intention is to eliminate this waste from several employees and concentrate it in one.
So, starting with the branding sector, after a study, two good scenarios were found. It should be noted that the objective is not to increase the number of human resources but rather to improve the use of capacities without detracting from quality.
The first considers the implementation of improvement opportunity 2, that is, man–machine allocation in the mirror. However, only three employees are responsible for these tasks, and the fourth will be responsible for transport.
The other scenario is similar; however, it considers that only carts are used as a means of transport, that is, the opportunity for improvement 1. Nevertheless, this scenario can only be implemented after improvement opportunities 1 and 2.
It is also possible to concentrate transport on a single resource in the treatment sector. Ideally, the only moving unit should be the carts, and several carts should be transported simultaneously. However, it is possible to implement this action with the conditions currently in effect.
With this opportunity for improvement, it is possible to increase the concentration of human resources on machines, which promotes control, and value-added activities. Thus, the identification of anomalies can occur in advance, which can avoid quality problems.
Therefore, there are two possibilities: using a single resource to make the transports between the branding, the stabilization buffer and the treatment sector, but it will not be possible to combine all the scenarios presented; or using two resources, one to do the transports between the branding sector and the stabilizing buffer and the other to do the transports between the stabilizing buffer and the treatment sector. Thus, it is considered that the most appropriate will be to use two resources because it allows greater flexibility. So, it is possible to create a pivot that can replace the various colleagues in case of absence (as already described in the opportunity for improvement 1 of basic stability) and because there is a requirement in the stabilization period between branding and treatment. It should be noted that, in the various scenarios presented, the currently existing means of transport were considered due to the proximity of the sectors. However, as soon as the project is successfully implemented and accepted by the various collaborators, it is suggested to invest in a transport mechanism with carriages in order to increase transport efficiency.
As mentioned in the previous improvement opportunity, the availability of materials is very important. However, in the marking sector, cork stoppers are sometimes lacking. Therefore, to avoid downtime (
Figure 6), it is suggested that a supermarket be created for the most used cork stoppers in order to avoid rework and waiting times. In addition, with this measure, the less suitable scenario on the part of employees is avoided—ignoring that a fault has occurred.
In short, with the opportunities for improvement described above, it is intended to promote production and logistics flows through the elimination or reduction of waste, through the border of line, standard work, supermarkets, mizusumashi and standardization of containers. Note that, as the company performs the customization of cork stoppers, production planning is already performed under a pull logic, that is, only based on the customer’s request and not based on forecasts. In the same sense, synchronization is verified through junjo, as the materials circulating in the industrial unit are customized and not mass-produced. In addition, there is no need for leveling because the lots produced are equal to those consumed [
49].
4.3. Implementation of Improvement Opportunities and Analysis of Results
Given all the above, some identified opportunities for improvement were implemented. It should be noted that not all opportunities were implemented to not encourage resistance to change and because there was a need to request budgets and manage the investment plan. Therefore, the strategy was not to implement actions simultaneously and to leave a period to prove the expected results and to be accepted by employees.
4.3.1. Basic Reliability
All opportunities to improve basic stability were implemented, which allowed for increasing the reliability of the workforce, methods and machines.
In the following text, the opportunities are described in the order they were implemented.
The development of the skills matrix made it possible to identify the skills of the various employees, the skills needed for the jobs and training needs. In addition, the development of work instructions for the various workstations facilitated training and communication. Additionally, it was possible to promote the existence of a polyvalent team that gives greater flexibility and, consequently, allows to respond to demand. With this action, it was possible to promote the stability of the workforce and of the methods.
To encourage the spirit of continuous improvement, training was given to demonstrate that there is a possibility to do better, to foster a critical spirit and avoid the thought, “let’s do it this way because it has always been like this”. Subsequently, the 5S’s were implemented in various sectors (
Figure 10). Consequently, it allowed the elimination of waste, as well as improved production and internal logistics, flows.
It is not only important to ensure that employees are present, but it is also important that they are motivated and focused on achievable goals that promote success. Thus, changing the indicator of the entire industrial unit to the level of service resulted in more motivated employees focused not only on production but also on quality.
4.3.2. Production and Internal Logistics Flows
While the actions are taken to improve basic reliability also allow for improved production and internal logistics flows, other steps have been taken to make progress. In addition, some actions have the function of eliminating or reducing some wastes, which, although it does not form part of the methods described in the various pillars of the TFM, are important to promote flows, as described by Coimbra [
23].
A more detailed description of the implemented actions follows.
The first action was to level the workload in the branding sector; that is, the allocation of machines to employees is no longer online (
Figure 3) and becomes a mirror (
Figure 8), that is, the first scenario presented in
Figure 9. After this analysis, it was possible to see that it would be possible to maintain a level workload and adequate control time with only three employees (
Figure 11), so we are faced with the third scenario in
Figure 9.
Thus, after the work measurement by sampling, in random periods for 1 month, for a confidence level of 90% and with an error of 6%, it is possible to see that employees spend 50% of their time in quality control, 15% changing baskets/carts and the rest in transport (
Table 9 and
Figure 12). However, it should be noted that, with the implementation of mizusumashi (improvement opportunity 3 of production and internal logistics flows), the time currently used for transport will be used for control. Furthermore, with the implementation of only carts, the control rate will be even higher—the fourth scenario in
Figure 9.
In this way, it was possible to level the workload of employees, increase production (since instead of 1 h/day for cleaning, 30 min/day are needed) and reduce human resources without harming quality. However, this employee was not dismissed, but assigned to transport, as will be presented later.
Therefore, there was a reorganization of tasks among employees, which allowed a leveling of the workload without harming quality, in addition to an increase in productivity, as will be presented in the next topic. Thus, it was possible to improve the production flow.
Finally, as suggested earlier, the transport was concentrated on a single resource (freed from the branding sector). However, this implementation is not over yet.
In order not to harm the production flow, it is important that materials are available. Thus, a Pareto analysis of the consumed products was carried out and some more critical products that should be available to respond to shortages of cork stoppers and, consequently, avoid machine stoppages were defined (
Figure 6).
Therefore, the implementation of a small supermarket for these obligated products occurred. In the first week of implementation, cork stoppers of this type were used five times; that is, the downtimes were avoided at least five times.
4.3.3. Performance Indicators
As is frequently said, “If you can’t measure it, you can’t improve it”. In addition, measurements provide guidance on decision-making and assess progress [
50]. Thus, the indicators must be comparable and understood by all and must promote a change of behavior in favor of better values [
50]. So, in this subsection, an evaluation of the results achieved with the improvements presented before is presented. Regarding the actions to improve the production and internal logistics flows, people were allocated to machines in the mirror in the branding, and a supermarket for Class A products was created. Finally, the third scenario of
Figure 9 was implemented, that is, the allocation of machines to 3 employees in the mirror. Therefore, the fourth employee was responsible for transport.
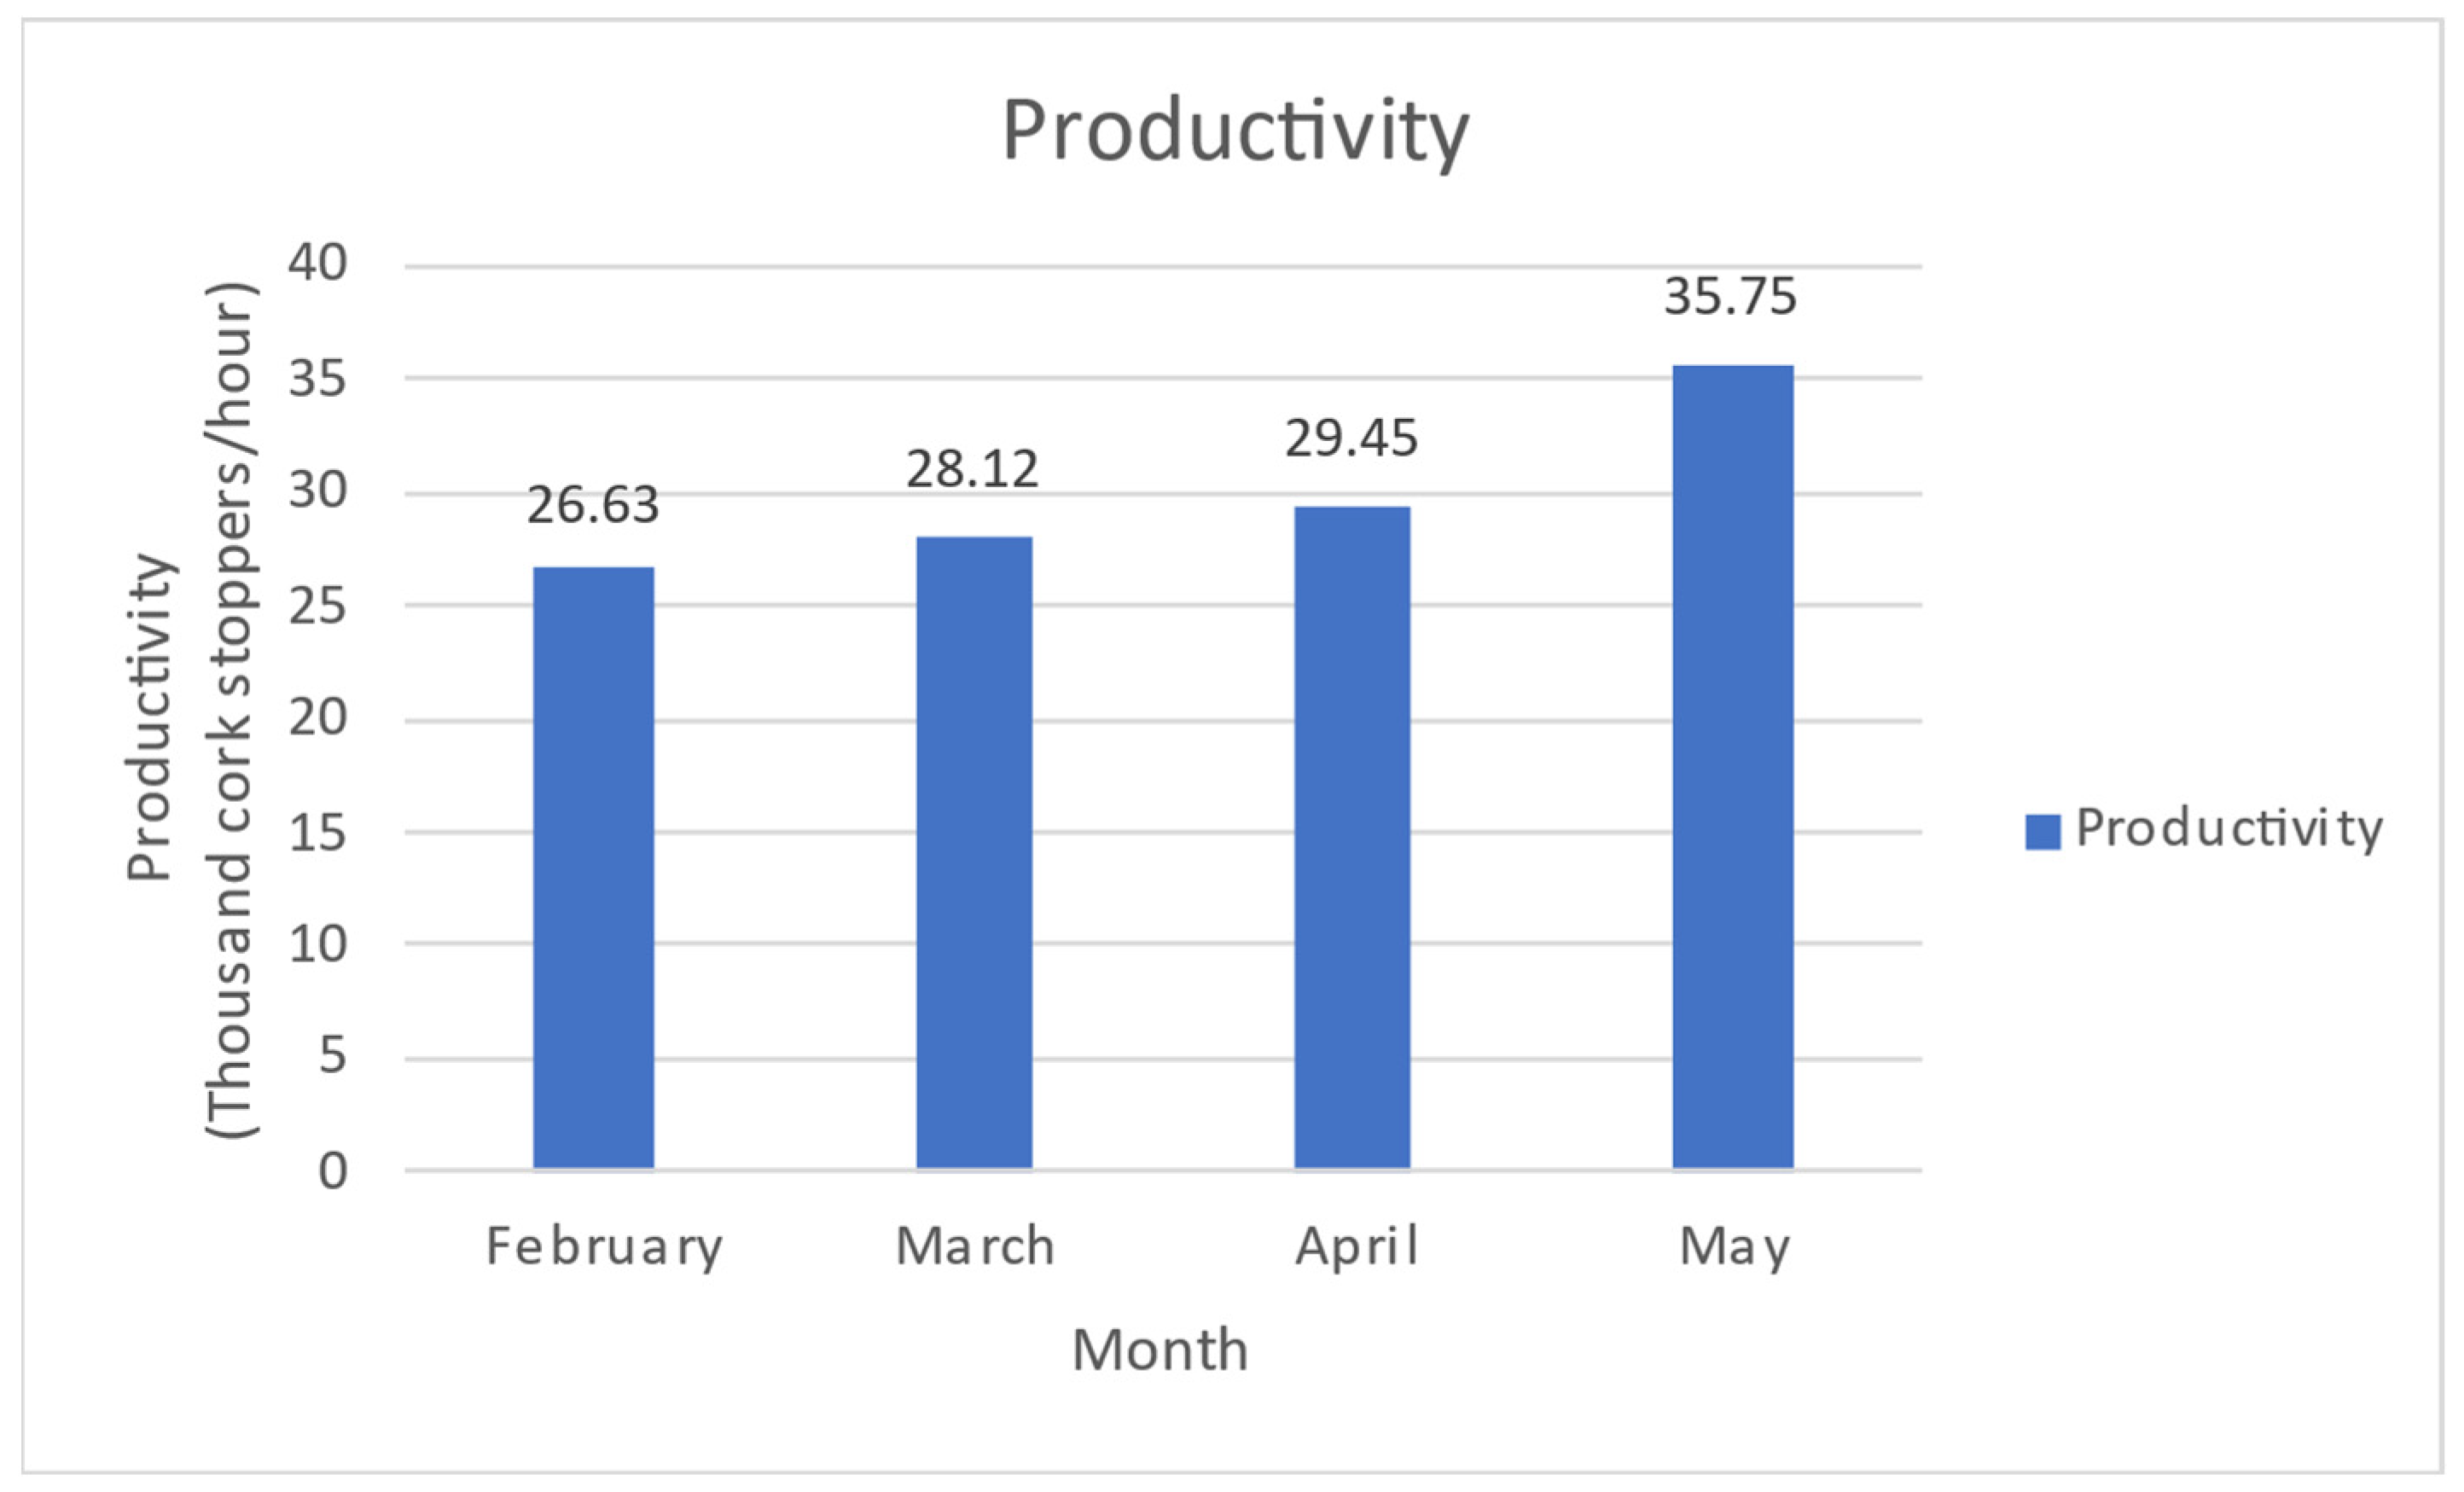
To evaluate the performance of this project, two indicators were considered: the lead time—which was 16 days in the initial situation—and monthly productivity, calculated using the formula described by Stevenson [
42]. Note that the main change occurred in the branding sector, so will only be measured the productivity of this sector.
As shown in
Figure 13, there was an increase in the productivity of the branding sector from February to May, which is due to the reallocation of machines to employees and the reduction in the time required for cleaning. However, the increase in productivity in May is higher, and this is due to the reduction of one employee in this sector, who was responsible for transport. Note that there were no fires but reuse of capacities.
In addition, there was a change in the cycle times of the various sectors (
Appendix B), and consequently, the lead time was reduced to 12 days (
Figure 14). Furthermore, it should be noted that the new cycle times present favorable values when compared to the takt time.
These values are the result of all the work developed during the project, which not only improved production and internal logistics flows but also resulted in greater employee motivation, improved workplaces, promoted greater flexibility and encouraged the spirit of continuous improvement
5. Discussion
This project demonstrated the impact of implementing continuous improvement practices, which was also an objective of Berhe [
29]. To this end, similarly to the article by Wang et al. [
30], there was an improvement in processes that, as in the project by Khan et al. [
14], went through the identification of problems, causes and their resolution. Additionally, as in Ghosh & Lever [
12], Khan et al. [
14], Singh & Singh [
33] and Al-Hyari et al. [
2], during the project, several wastes and actions to eliminate or reduce them were identified. In this way, it was possible to reduce the lead time, which was also an objective addressed by Ghosh & Lever [
12], and improve productivity, which was also a goal of Singh & Singh [
33], Gupta & Jain [
31] and Benjamin et al. [
32].
This was possible through the implementation of the TFM model developed by the Kaizen Institute. Despite the potential significant gains, TFM is still poorly implemented in practice. The projects developed by Alves [
34] and Canastro [
36] address the identification of improvements in the internal logistics and production flows of a new sector. However, the authors did not address the implementation of the identified measures.
In the same sense, Coelho [
37] identified opportunities for improvement related to production and internal logistics flows. However, the analysis was purely theoretical, as only qualitative data were available. Therefore, the author does not address the implementation of any improvements.
On the other hand, Amorim [
35] identifies and implements various opportunities for improvement related to production and internal logistics flows in a new sector. However, she does not present the impact of the actions or the results after implementation.
Moreover, Almeida [
38] and Silva [
39] identify, implement and evaluate actions to improve production flows, as well as Marques [
40] did regarding the internal logistics flow.
However, none of the authors addressed basic reliability or mechanisms to motivate and improve the use of employees’ skills. In addition, no author identified opportunities for improvement, implemented and assessed the impact of actions related to production and internal logistics flows in existing sectors. Thus, this project responds to the gap identified in the literature so it stands out from the others.
In addition to TFM, several methods and tools were used that allowed the project to succeed. The VSM was used to map the initial situation and, consequently, as a starting point for improvement since it highlighted the sectors involved in the value chain, as happened in the works of Singh & Singh [
33], Ghosh & Lever [
12] and Jasti et al. [
4].
On the other hand, through the spaghetti diagram, several movements by employees were identified, as happened in the problem studied by Bevilacqua et al. [
51] and Jessome [
52]. Then, work measurement was used to quantify and yamazumi to balance tasks, such as Marksberry et al. [
53]. Finally, the 5S’s were implemented to improve workplaces, efficiency and effectiveness, as happened in the publications of Randhawa & Ahuja [
54] and Gupta & Jain [
31].
In short, this project not only responded to the gap in the literature identified but also demonstrated the simultaneous use of several methods and tools applied in various contexts in favor of continuous improvement. Thus, significant improvements were possible on the factory floor, as well as improving employee motivation their personal development and encouraging the focus on continuous improvement.
6. Concluding Remarks
Analyzing the company’s initial situation, it was possible to identify a lack of motivation for continuous improvement on the part of all employees and modes of operandi focused on the motto “everything has been improved; there is no way to improve anymore”. However, in a more detailed analysis, several wastes and overloads were identified that affect production and internal logistics flows. More specifically, work overloads were identified, not only associated with transport units but also due to man–machine allocation, highly decentralized transport, and waiting times for lack of material.
That said, through the TFM model, it was possible to situate the industrial unit in relation to the flows of materials and information and identify waste. In addition, the VSM was useful not only for mapping the initial situation but also for identifying the value chain, and other methods and tools were used to complement the analysis. Therefore, through the reallocation of tasks and supermarkets, it was possible to balance workloads, reduce waste and improve production and internal logistics flows. Consequently, there was a reduction in lead time by 4 days and an increase in the productivity of the branding sector from 26.63 mL/h to 35.75 mL/h in four months. Additionally, a mizusumashi began to be implemented; however, by the end of the project, it was not possible to complete the implementation or assess the impact.
It is clear that the good results achieved were also a consequence of the beginning of a cultural change. Employees began to become more receptive, especially when they perceived improvements in their work through the implementation of actions. In addition, the 5S method was extremely useful because it not only improved the workplace, material and information flows but also involved the various employees, so they felt useful and enthusiastic to implement more actions. Additionally, as a result of the implementation of the skills matrix, it was possible a rotation of employees across the various workstations, which resulted in a reduction of the dependence on a single human resource.
Therefore, with this project, it was possible to demonstrate that, to improve, no financial investment is necessary since the actions implemented during this work had no associated costs and promoted good results. In addition, this project demonstrated a practical application of Total Flow Management involving all pillars, with the exception of external logistics, with good results in the cork industry. Finally, the employees were not forgotten, and the development of their skills and motivation was sought, as well as the growth of the spirit of continuous improvement.
As a result, this project demonstrated the use of various methods and tools to implement continuous improvement; practical implementation of TFM regarding basic reliability, production and internal logistics flow. Thus, significant improvements were possible on the gemba, as well as improving employee motivation their personal development and encouraging the focus on continuous improvement. It was possible to change the company’s culture. Therefore, it responds to the gap identified in the literature and to the necessity of the factory.
Despite the good results achieved, during data collection, the level of confidence and error was not as low as desirable, and more observations would be needed. Therefore, the data may not fully characterize the reality. In this sense, to overcome this limitation, it would be necessary to carry out more observations for their validation.
Additionally, it was not possible to complete the implementation of mizusumashi, given the end of the project. Consequently, the impact of centralizing transport on a single resource has not been confirmed either.
Finally, it was not possible to implement the use of a single transport unit (carts), as they had associated a financial investment. Nevertheless, it should be noted that these actions were included in the company’s action plan.
That said, it is suggested that, in future work, the implementation of mizusumashi be completed and its impact assessed. Naturally, this action will have repercussions on the other employees, so a new assessment of the workload and distribution of tasks must take place. Finally, as we are facing a continuous improvement project, new cycles of data collection and analysis, planning, implementation and evaluation of actions must occur to promote the search for perfection.


