
Multiple Linear Regression Analysis of Canada’s Freight Transportation Framework


 , and
, and
Abstract
:1. Introduction
1.1. Background
1.2. Research Contribution
2. Materials and Methods
2.1. Dataset
2.2. Methods
3. Discussion
3.1. Analysis of Freight Transportation Mode Choice Factors
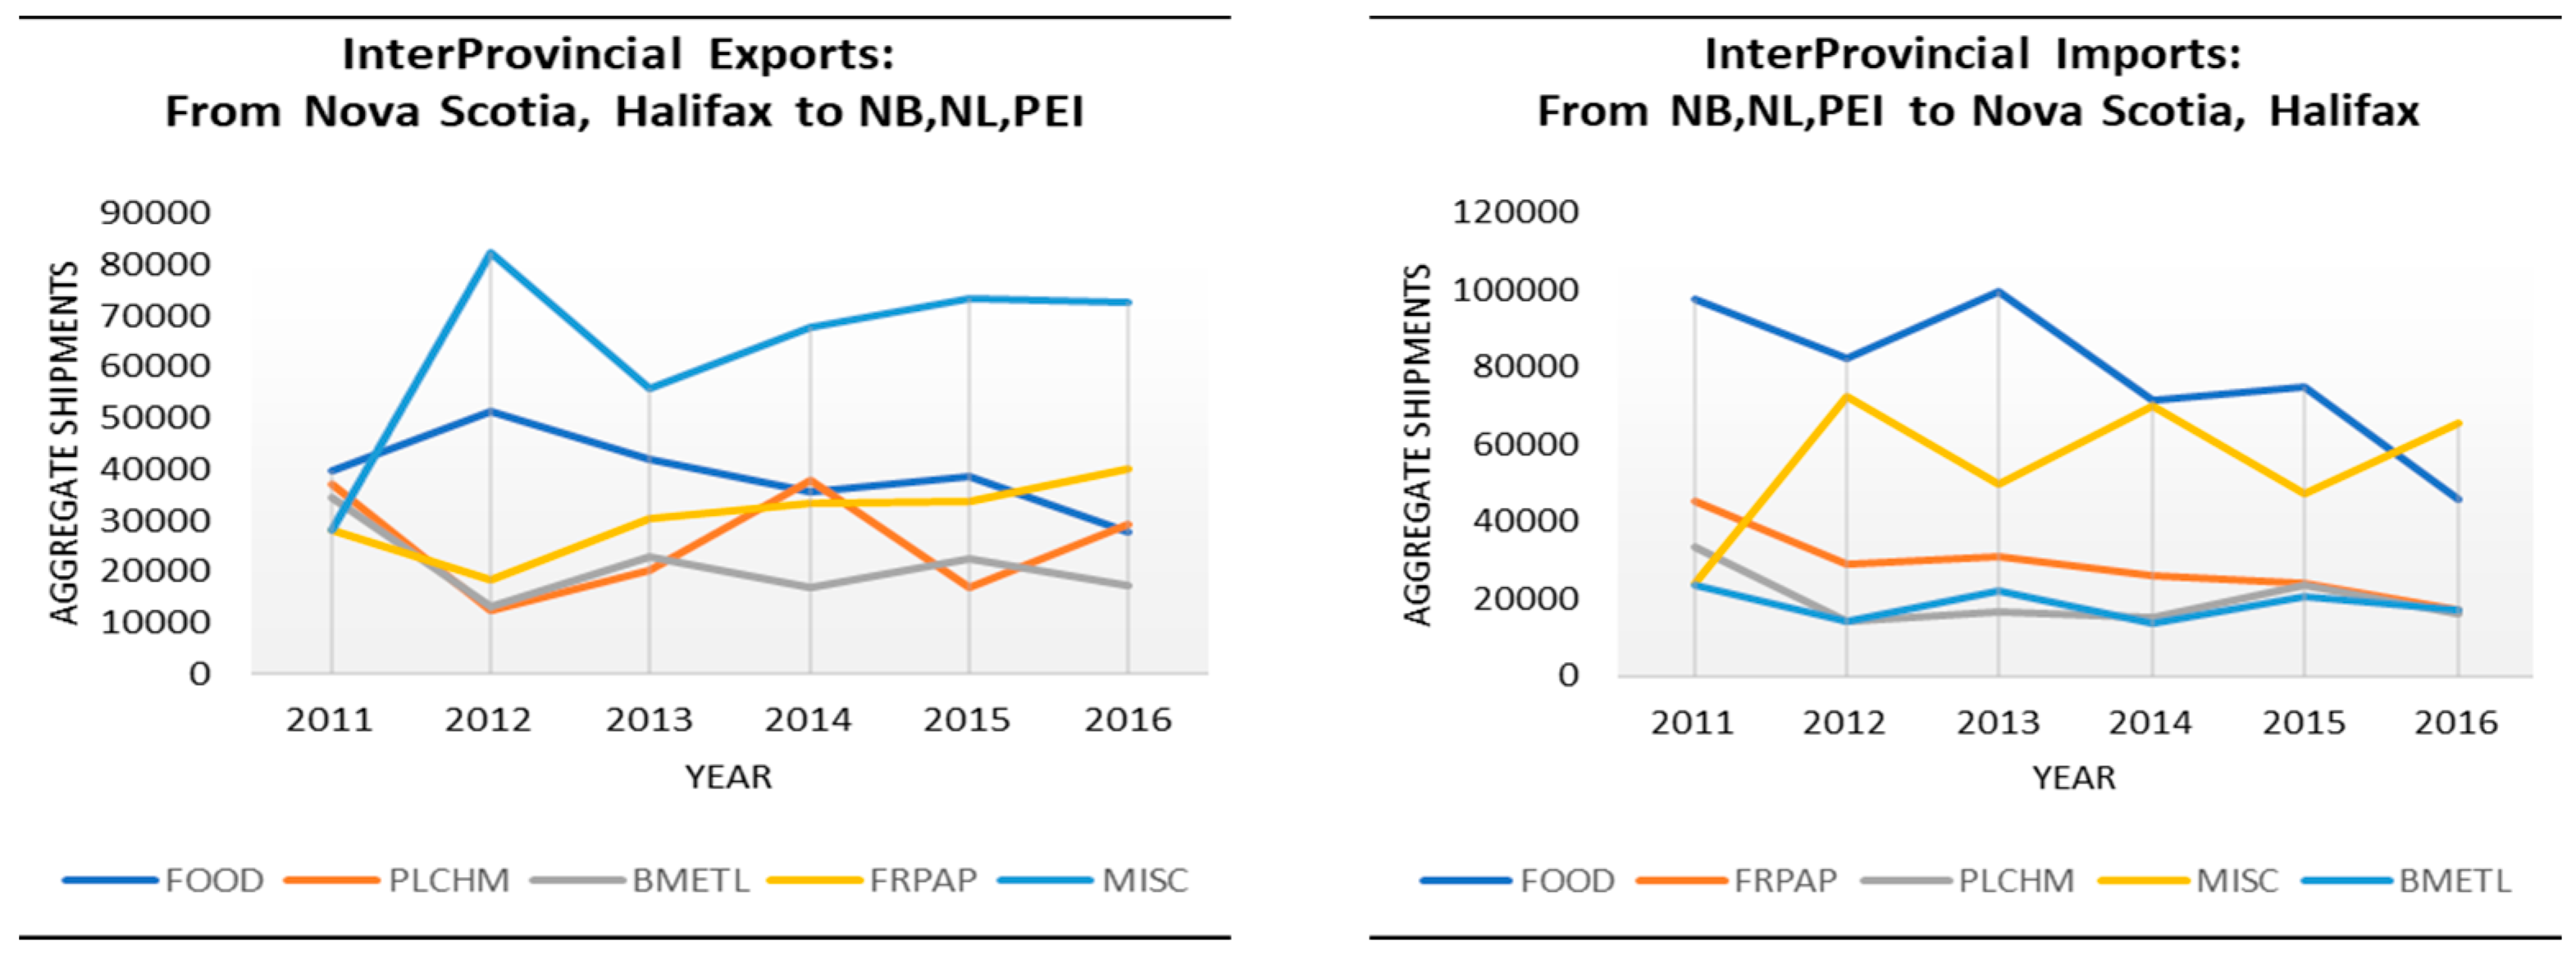
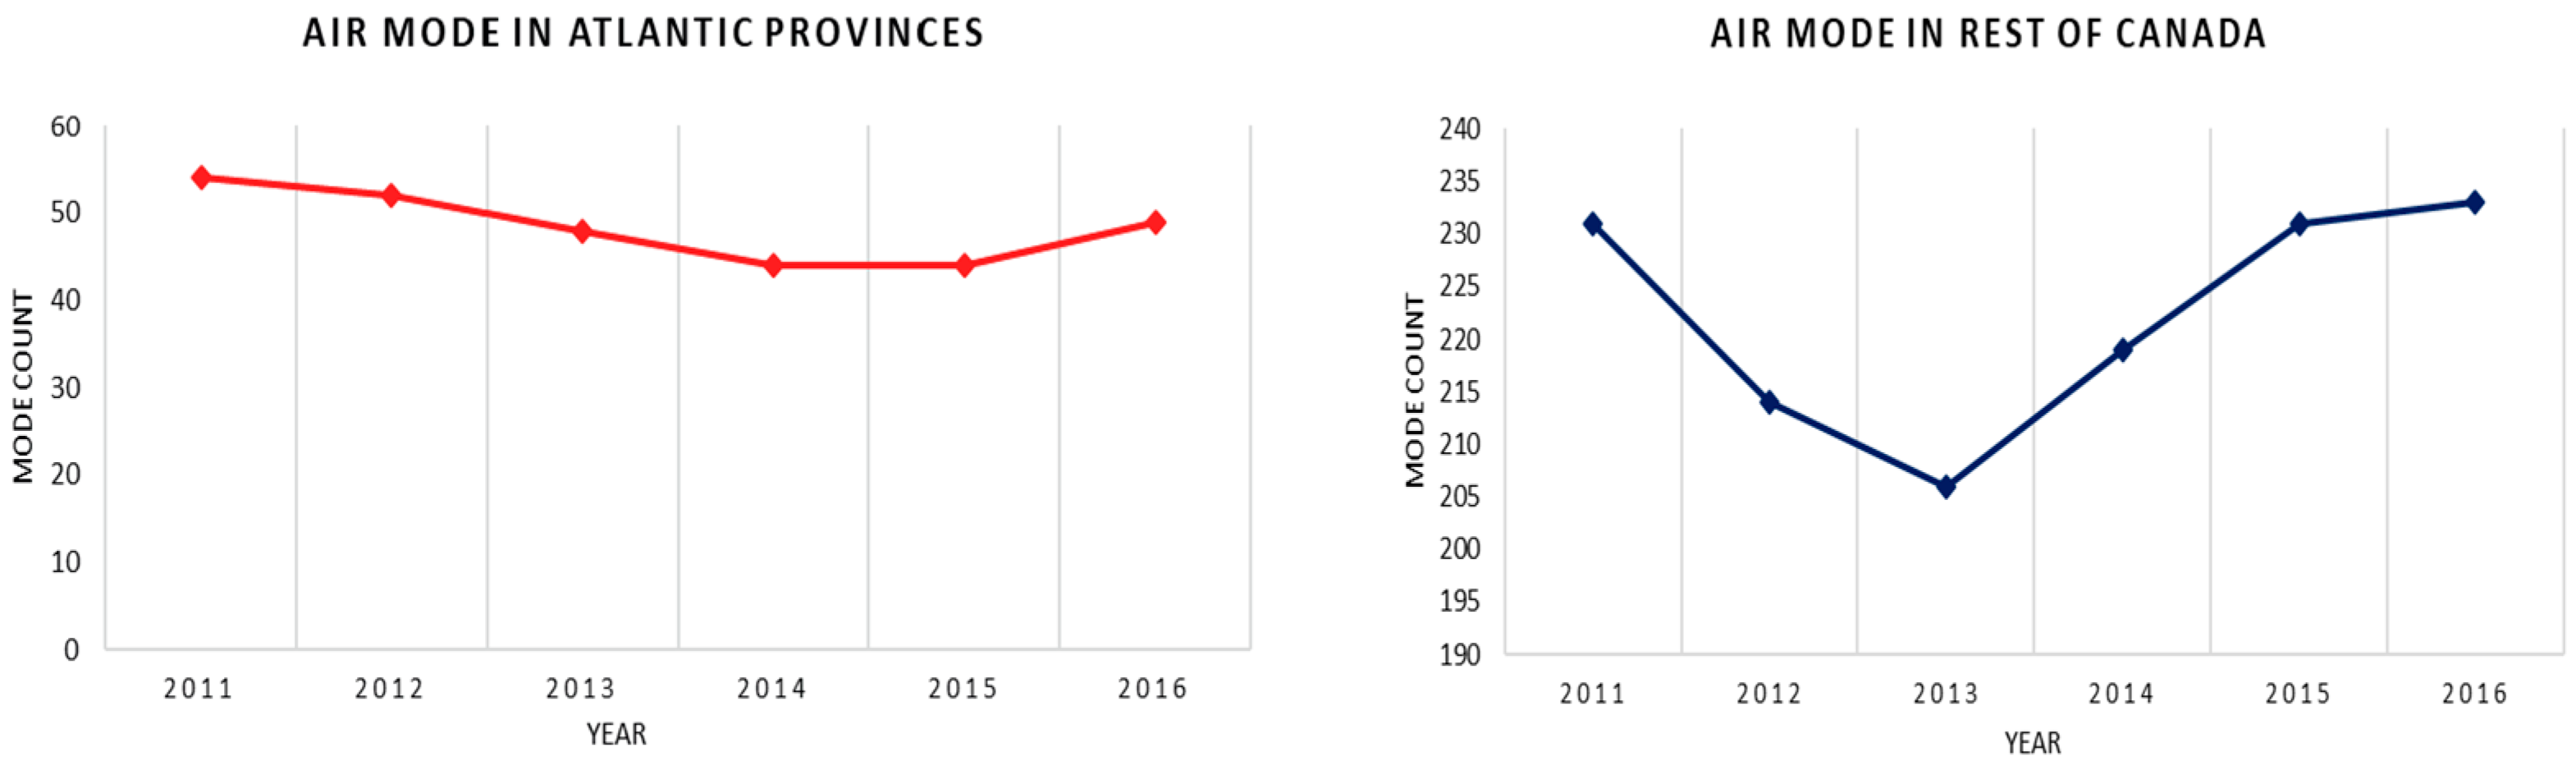
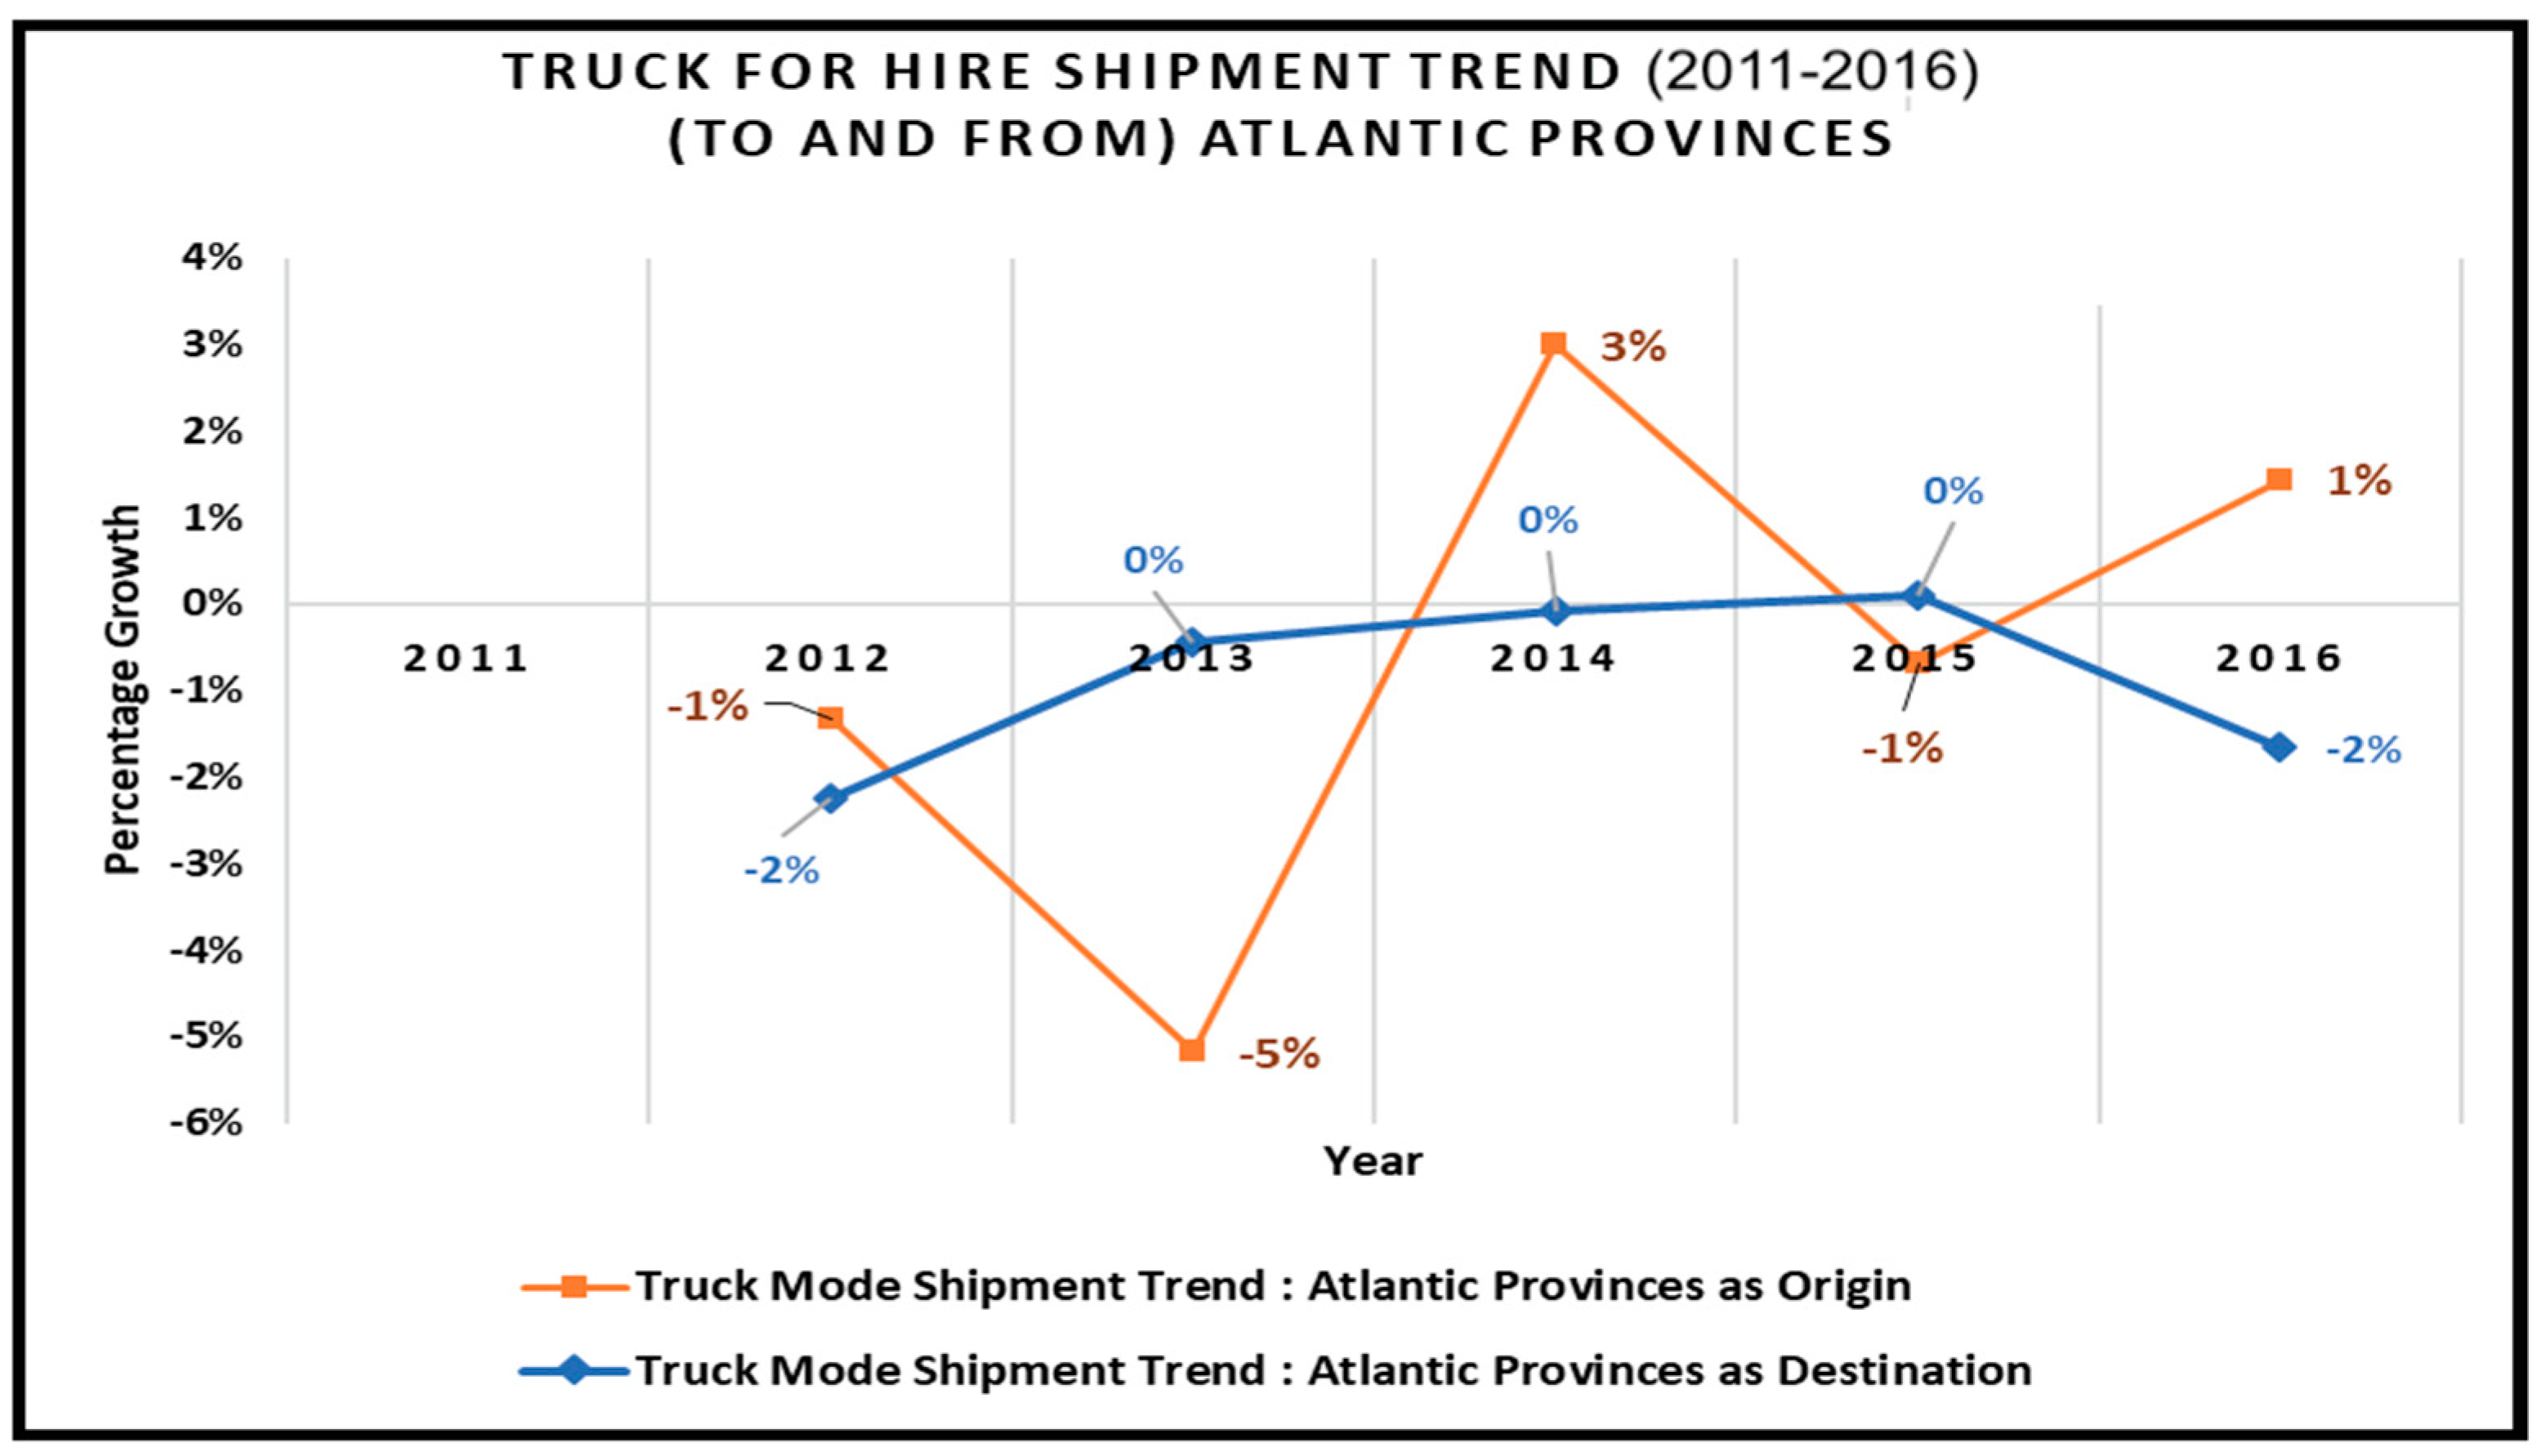
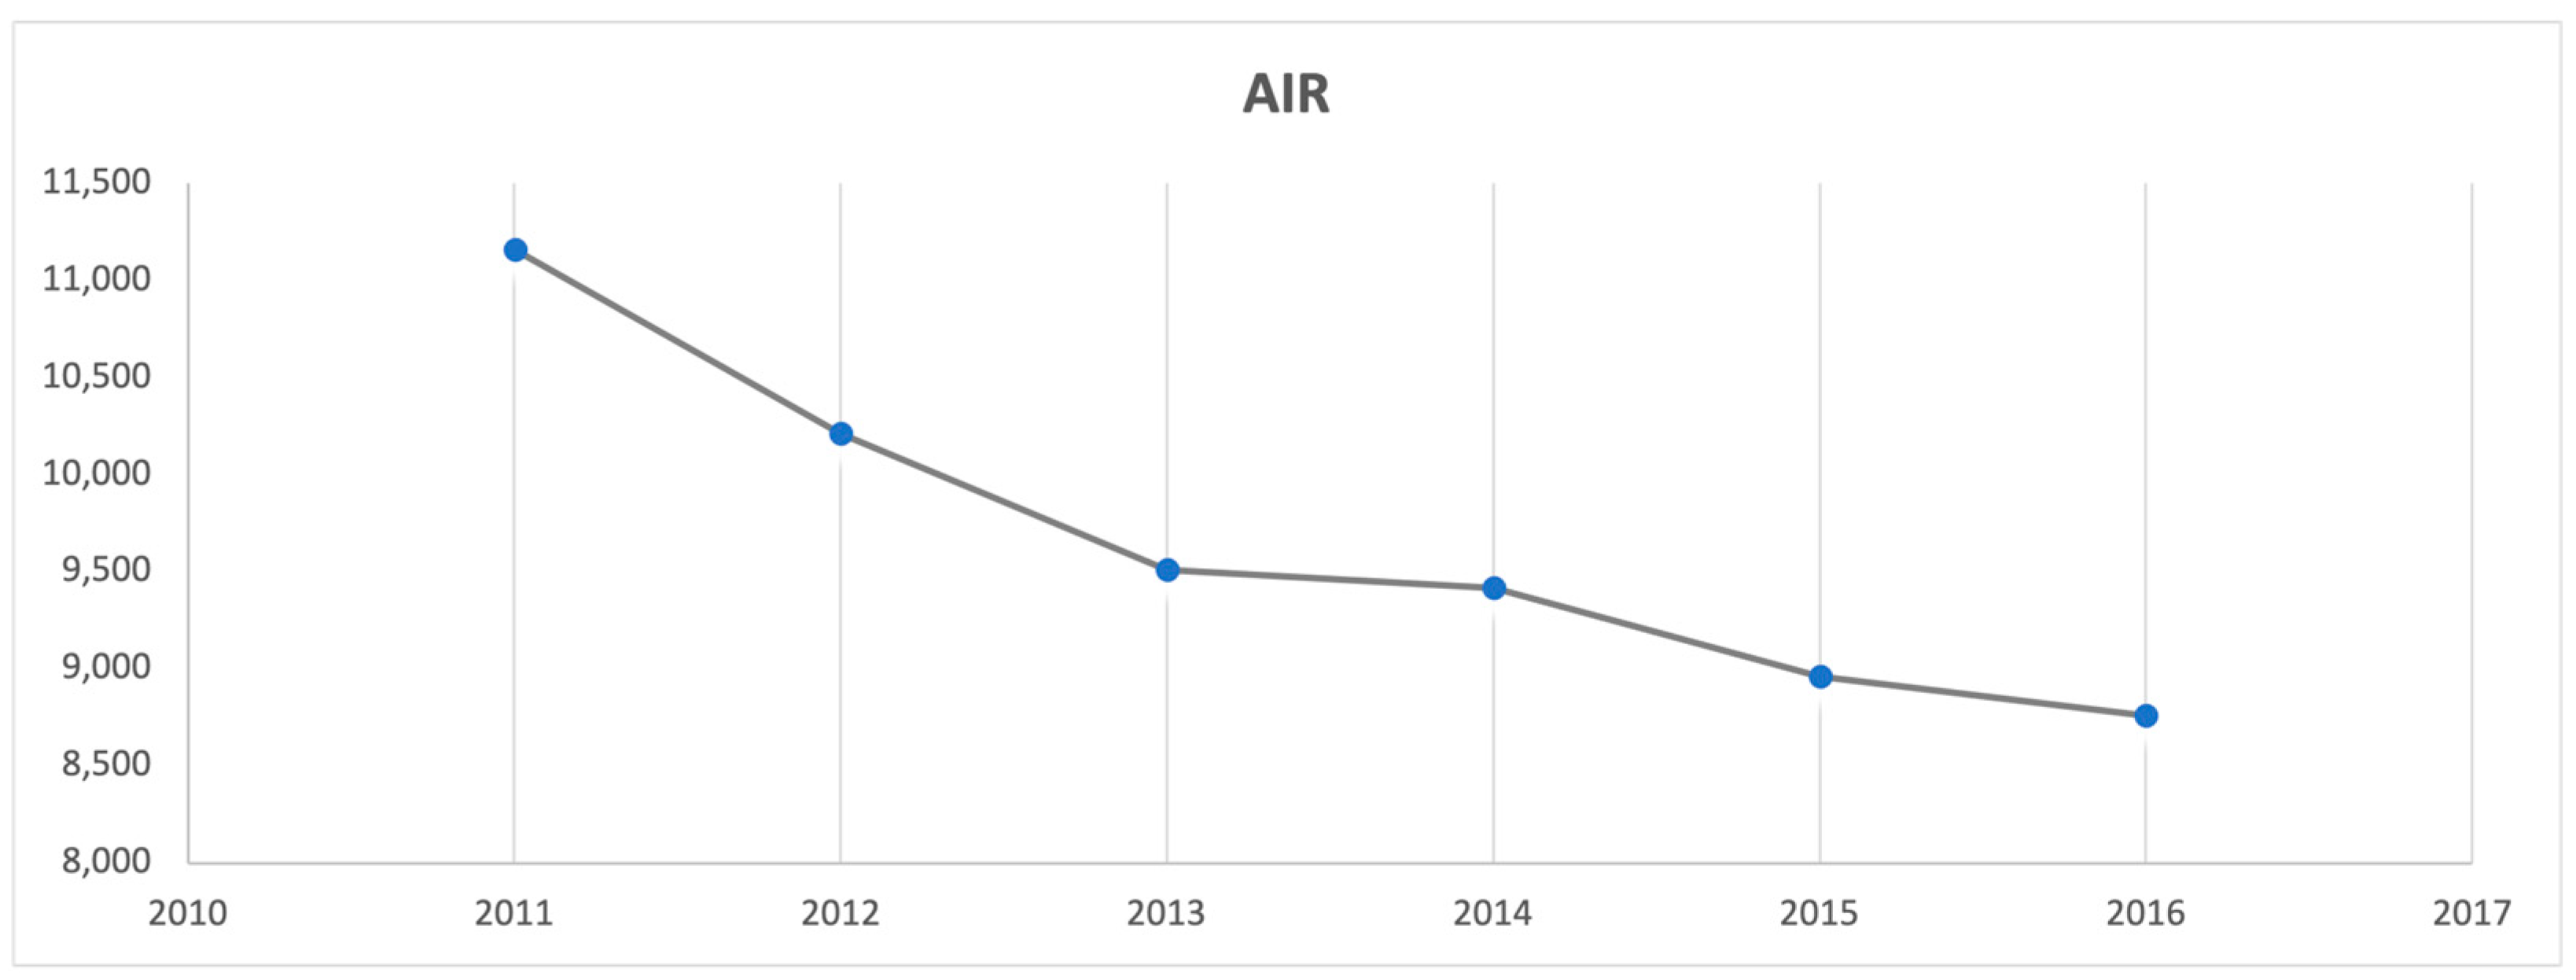
3.2. Comparing Atlantic Provinces
3.2.1. Nova Scotia
3.2.2. New Brunswick
3.2.3. Newfoundland and Labrador
3.2.4. Prince Edward Island
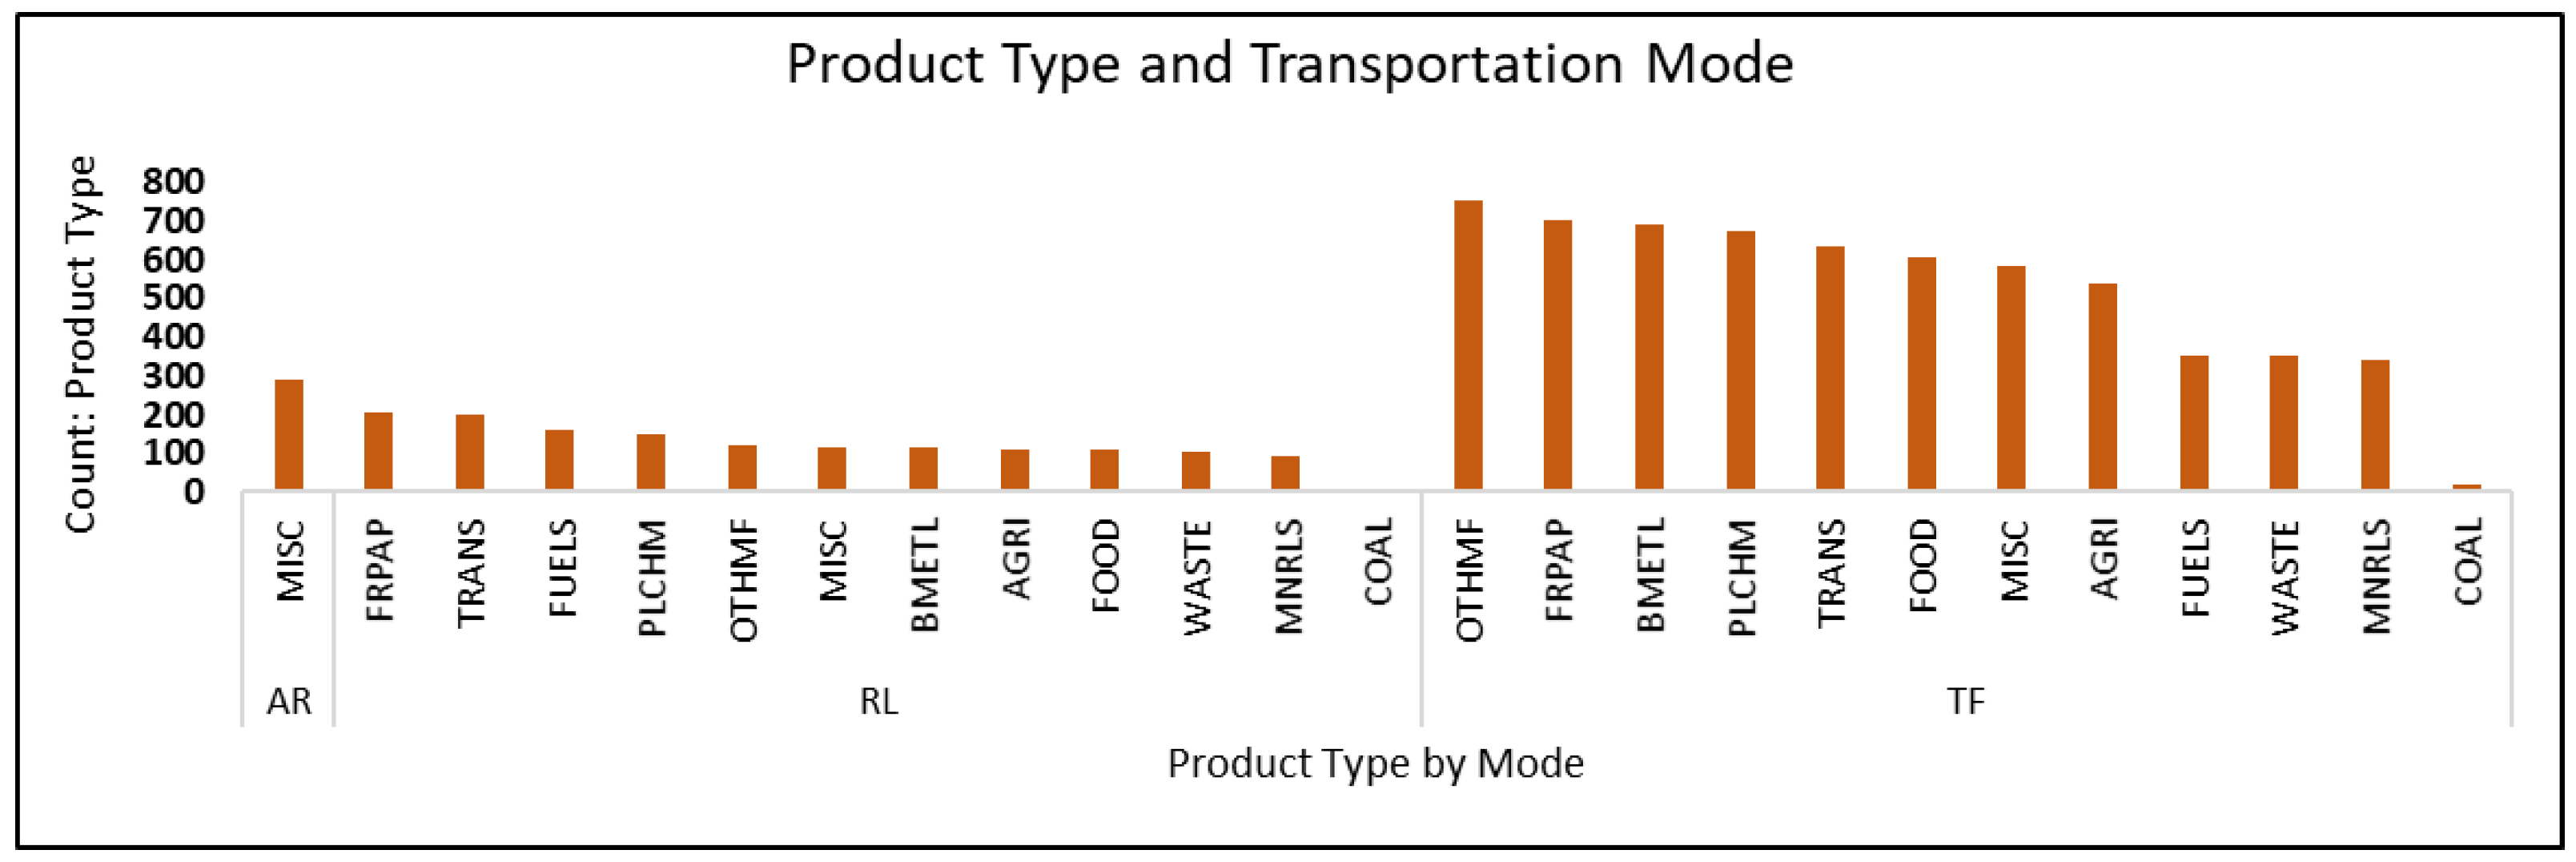
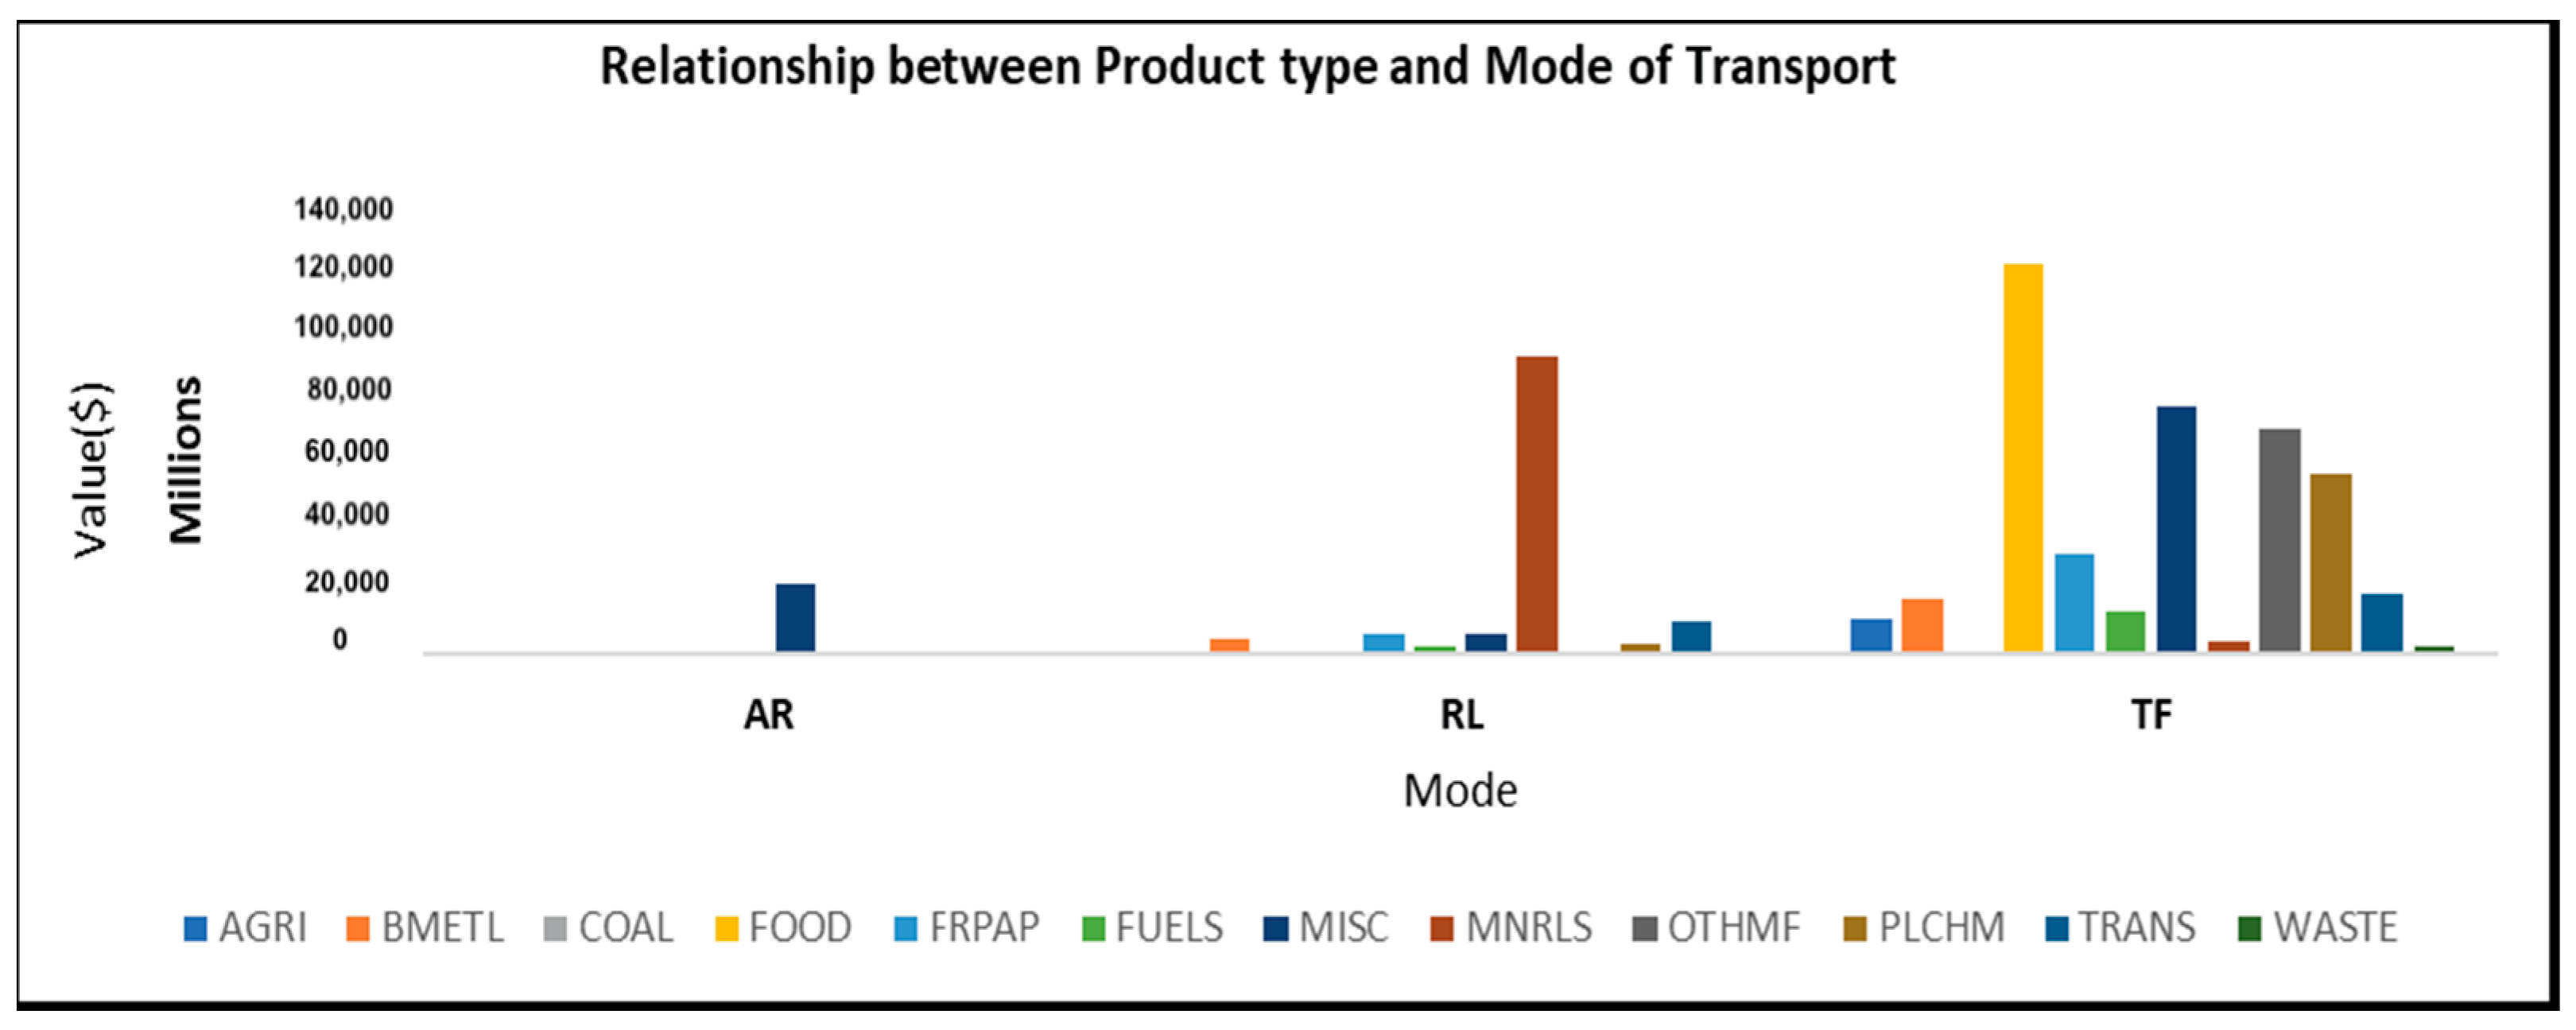
3.3. Relationship between Product Type and Transportation Mode
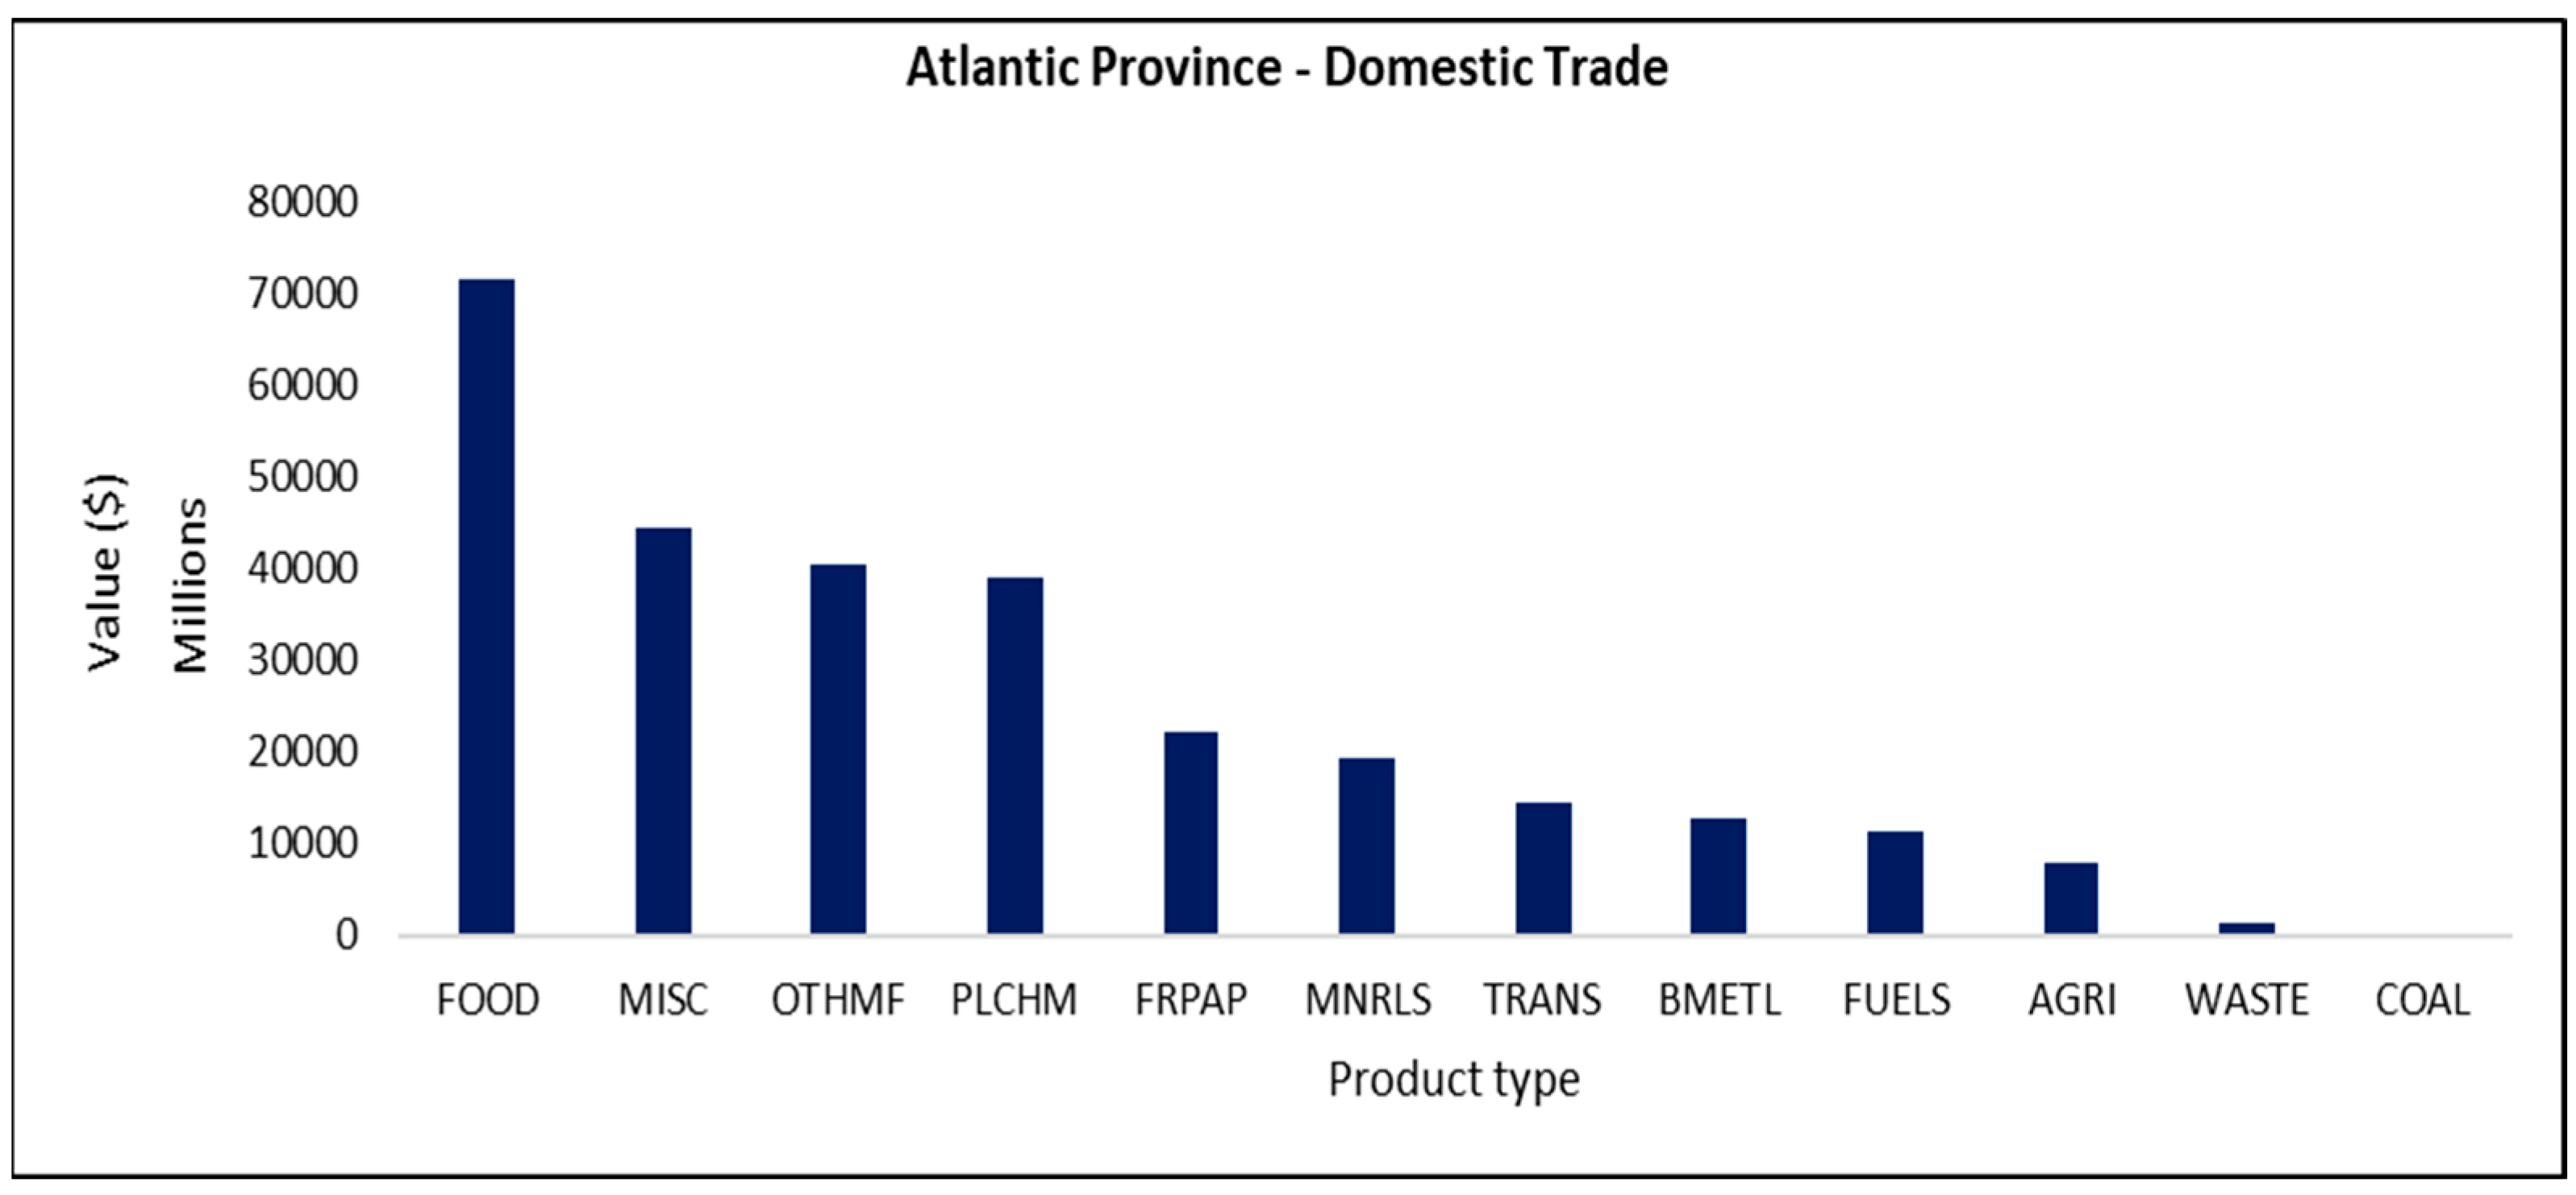
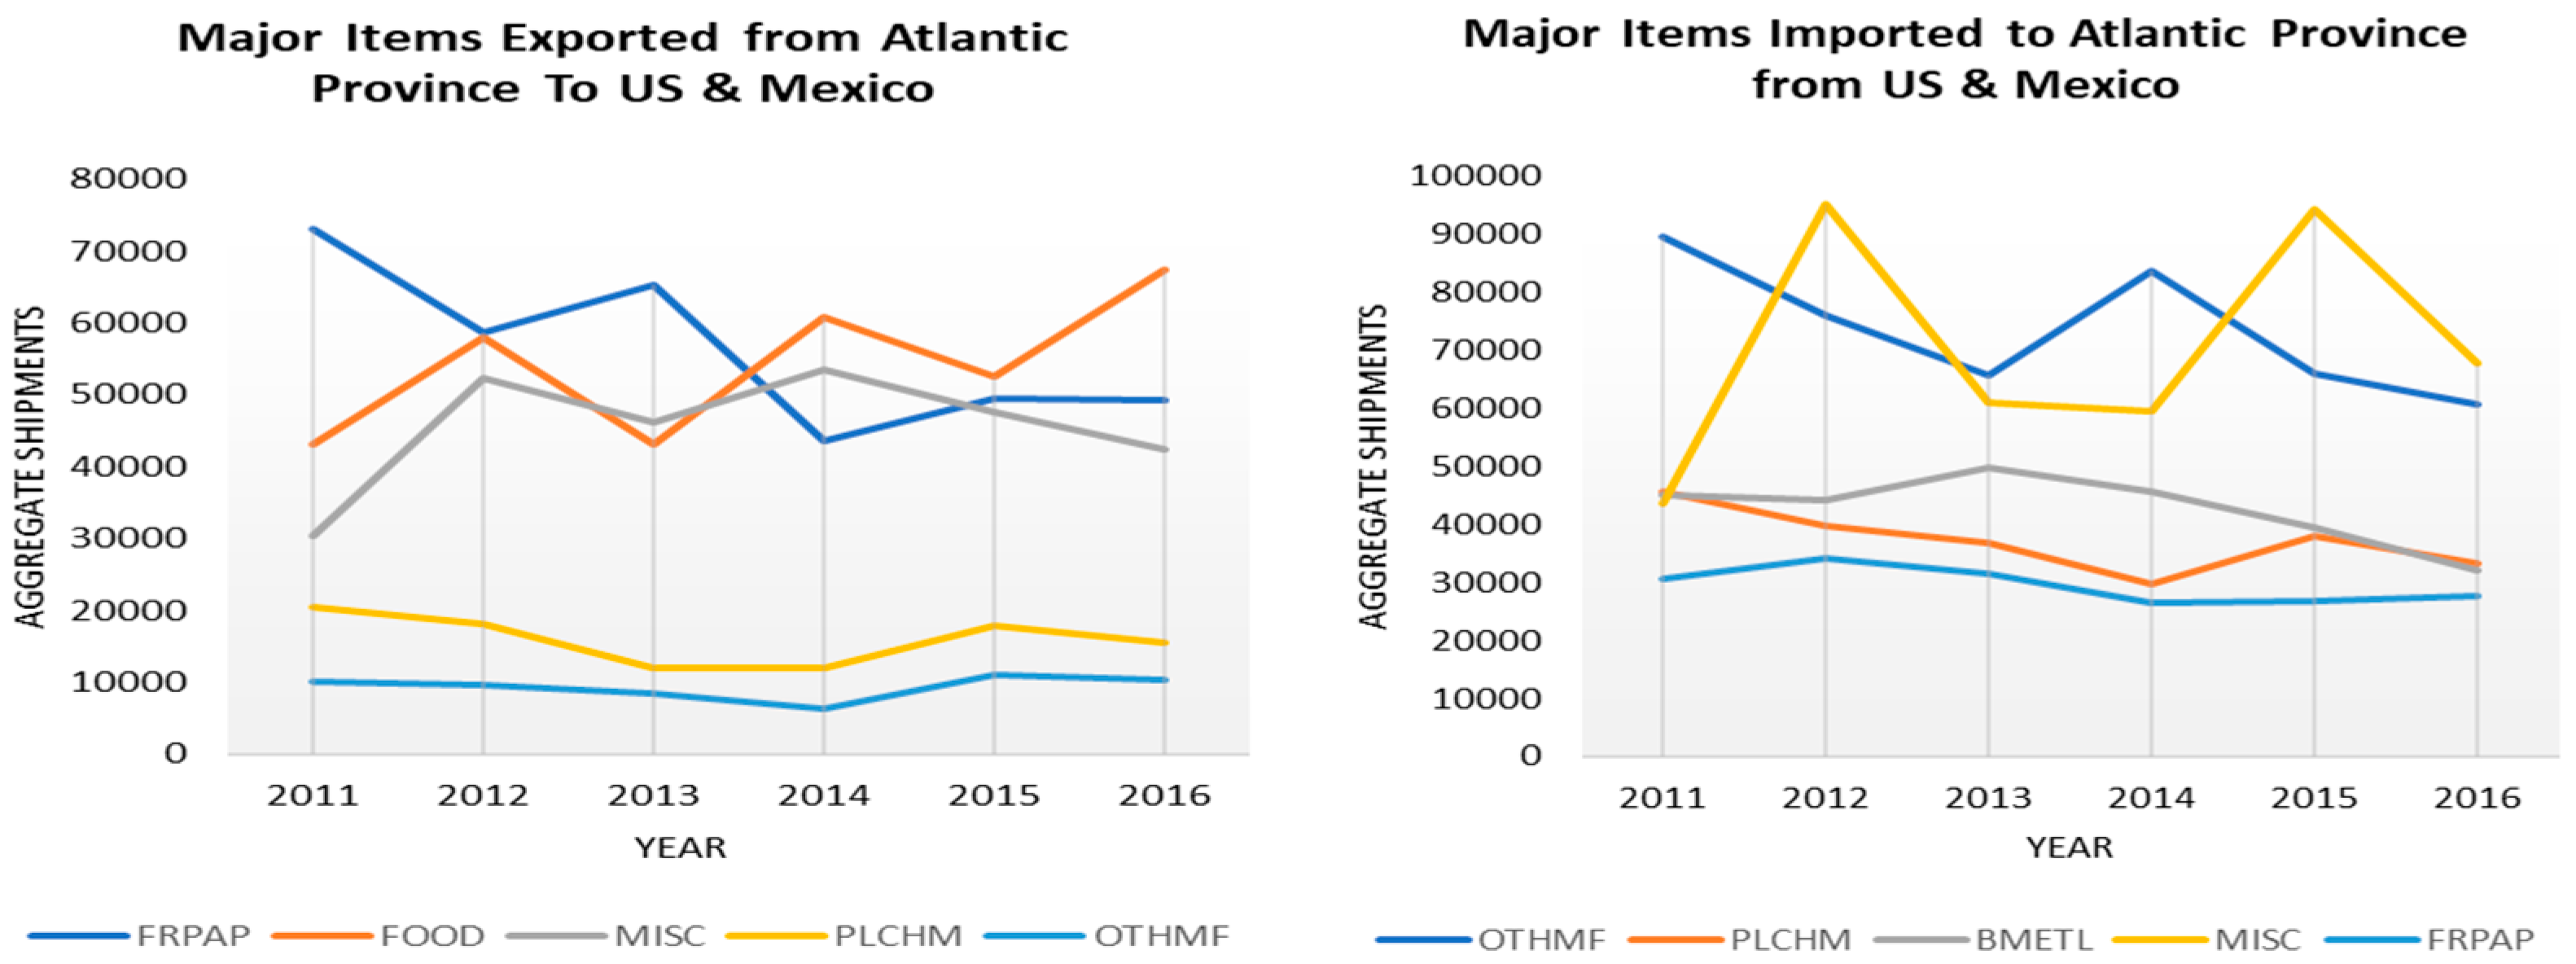
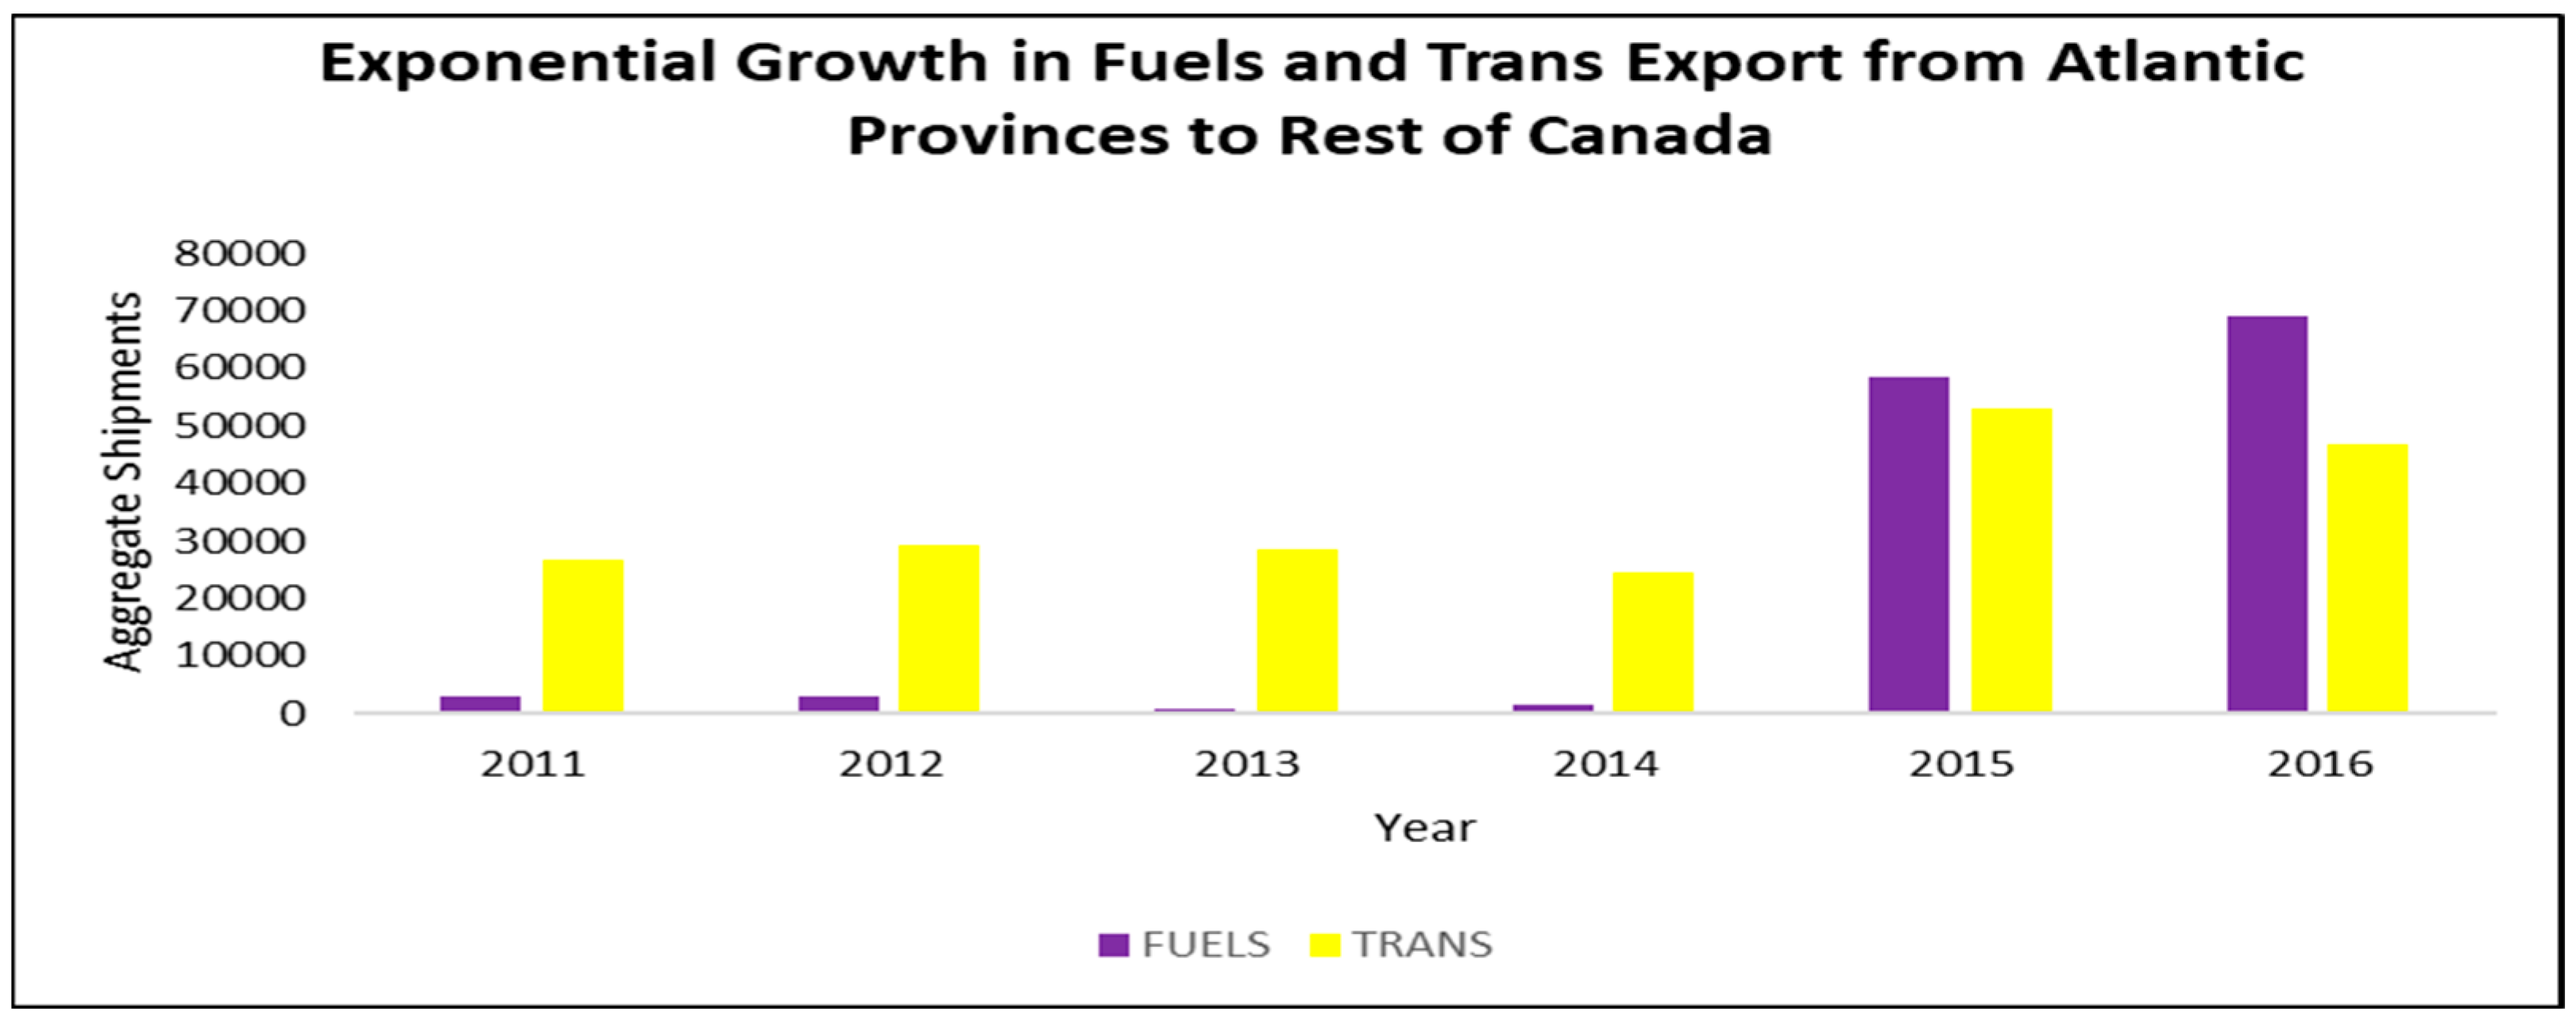
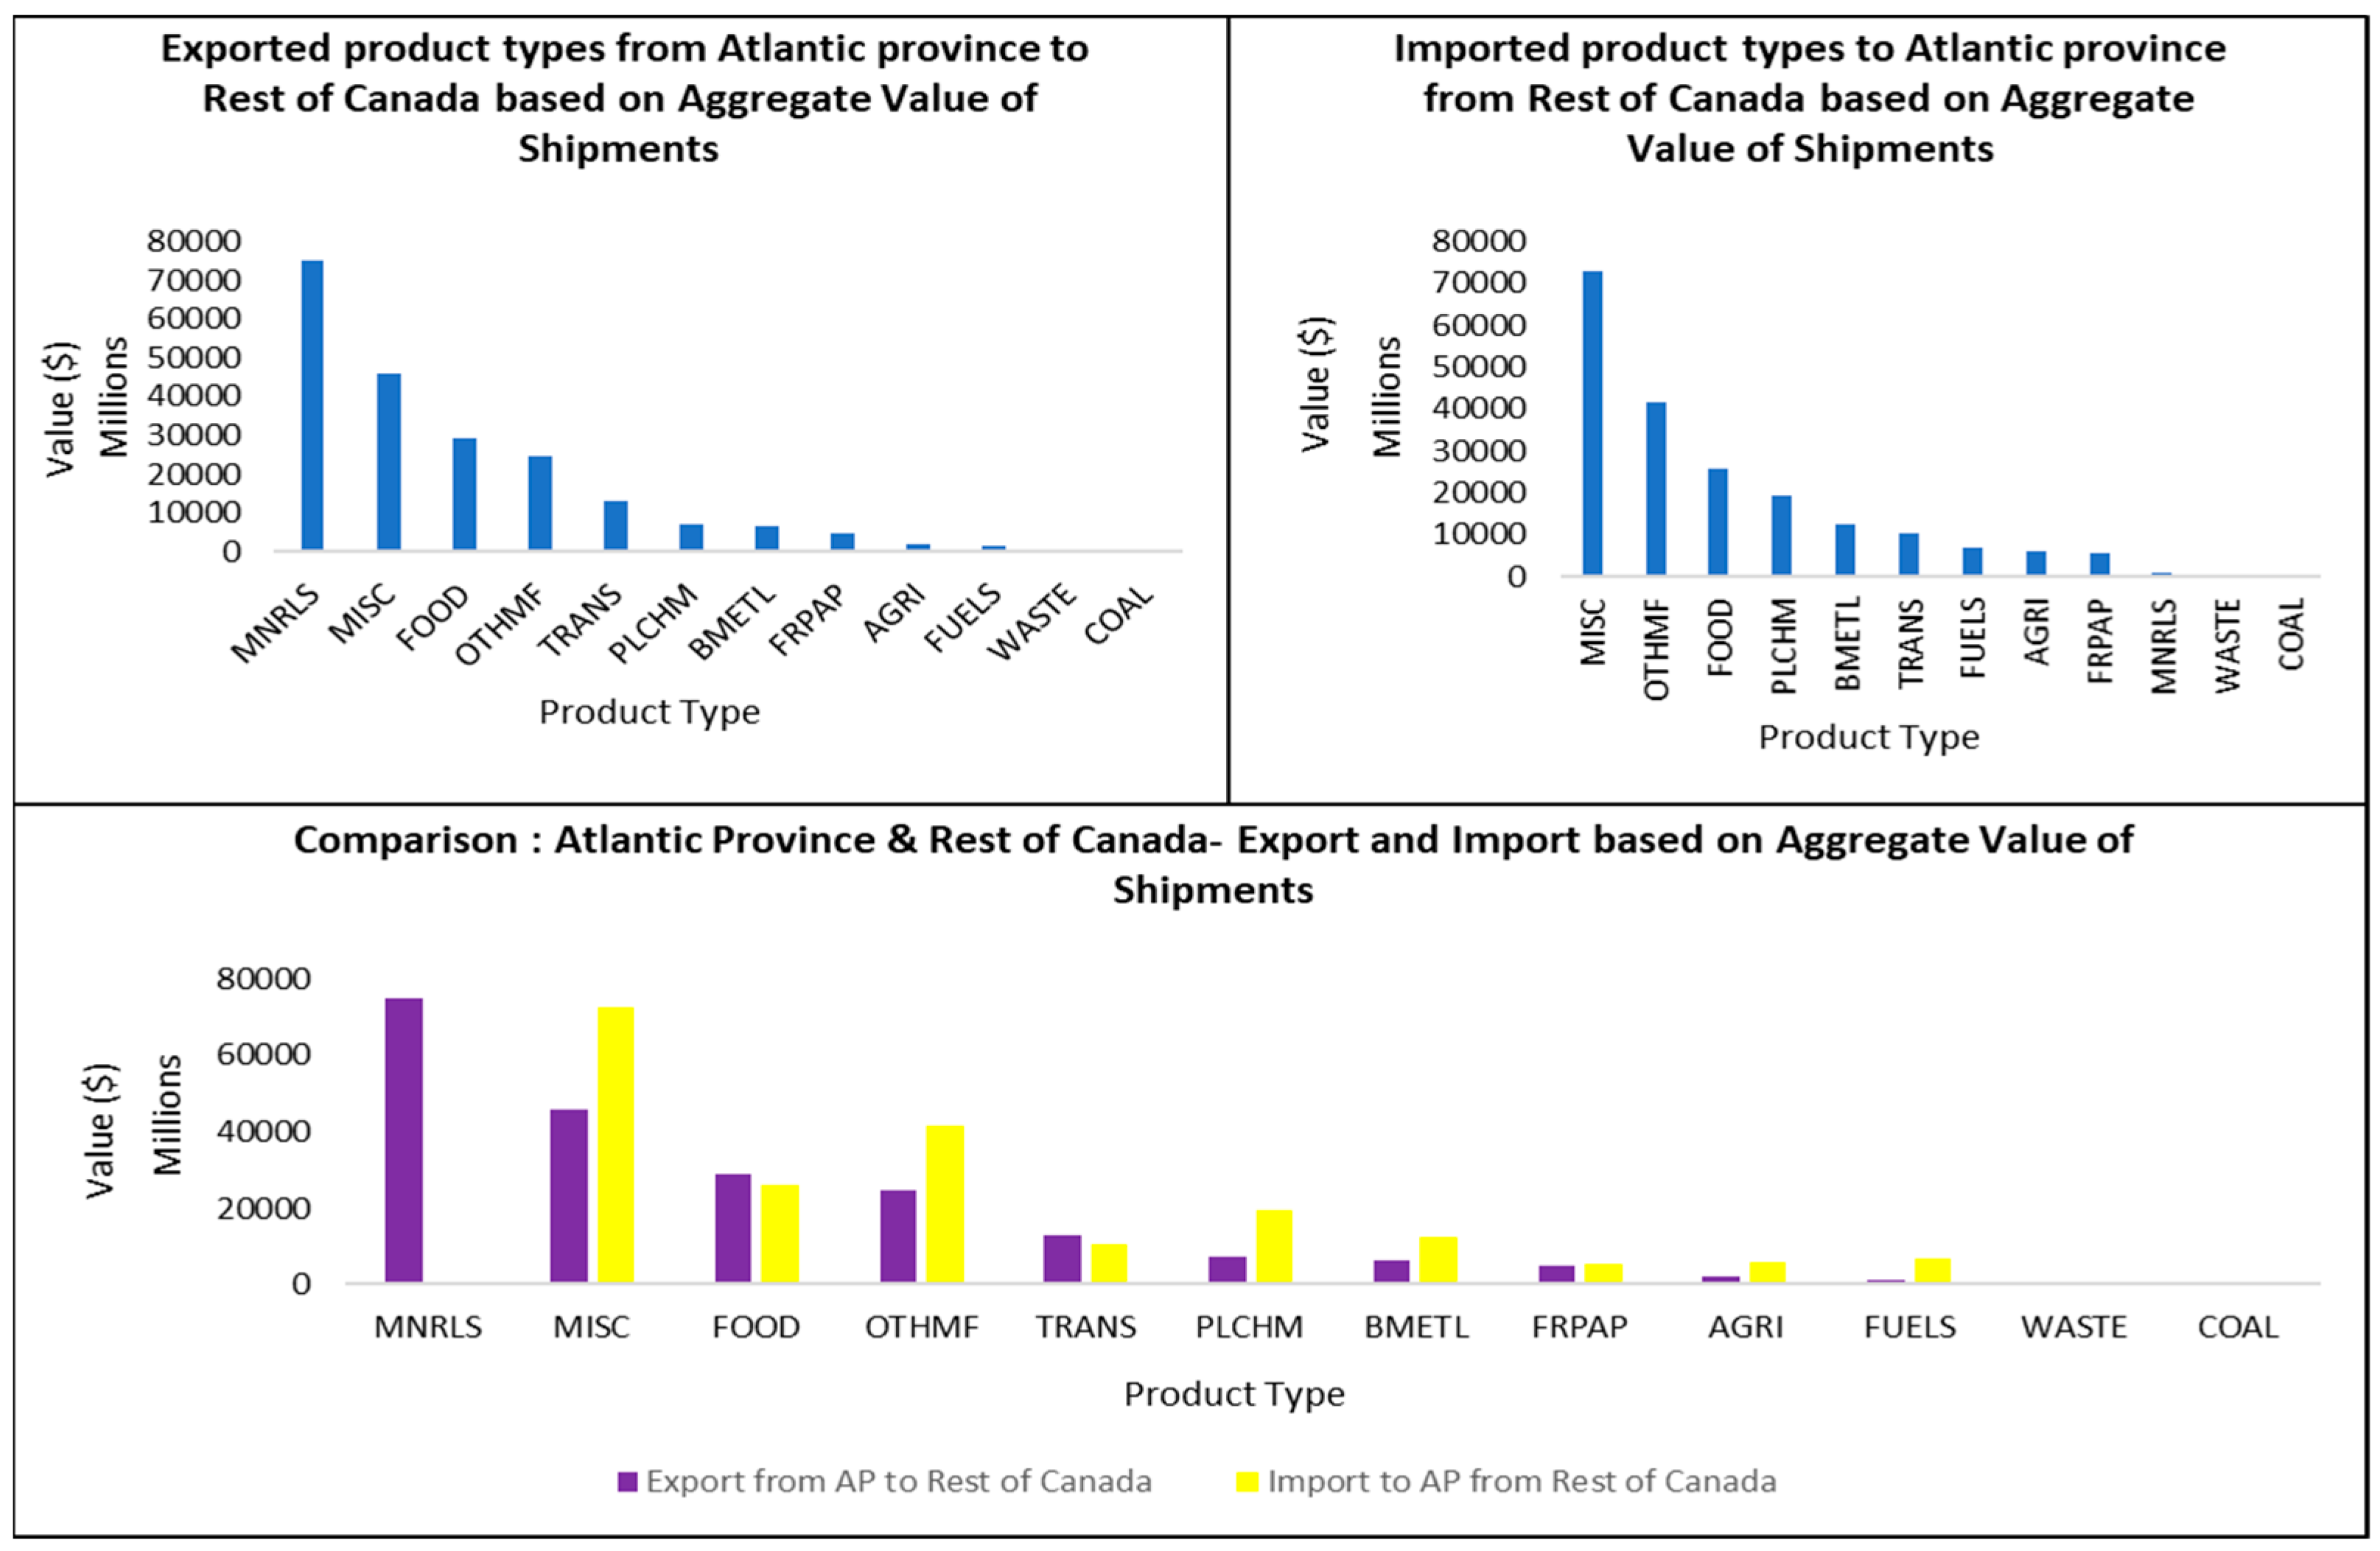
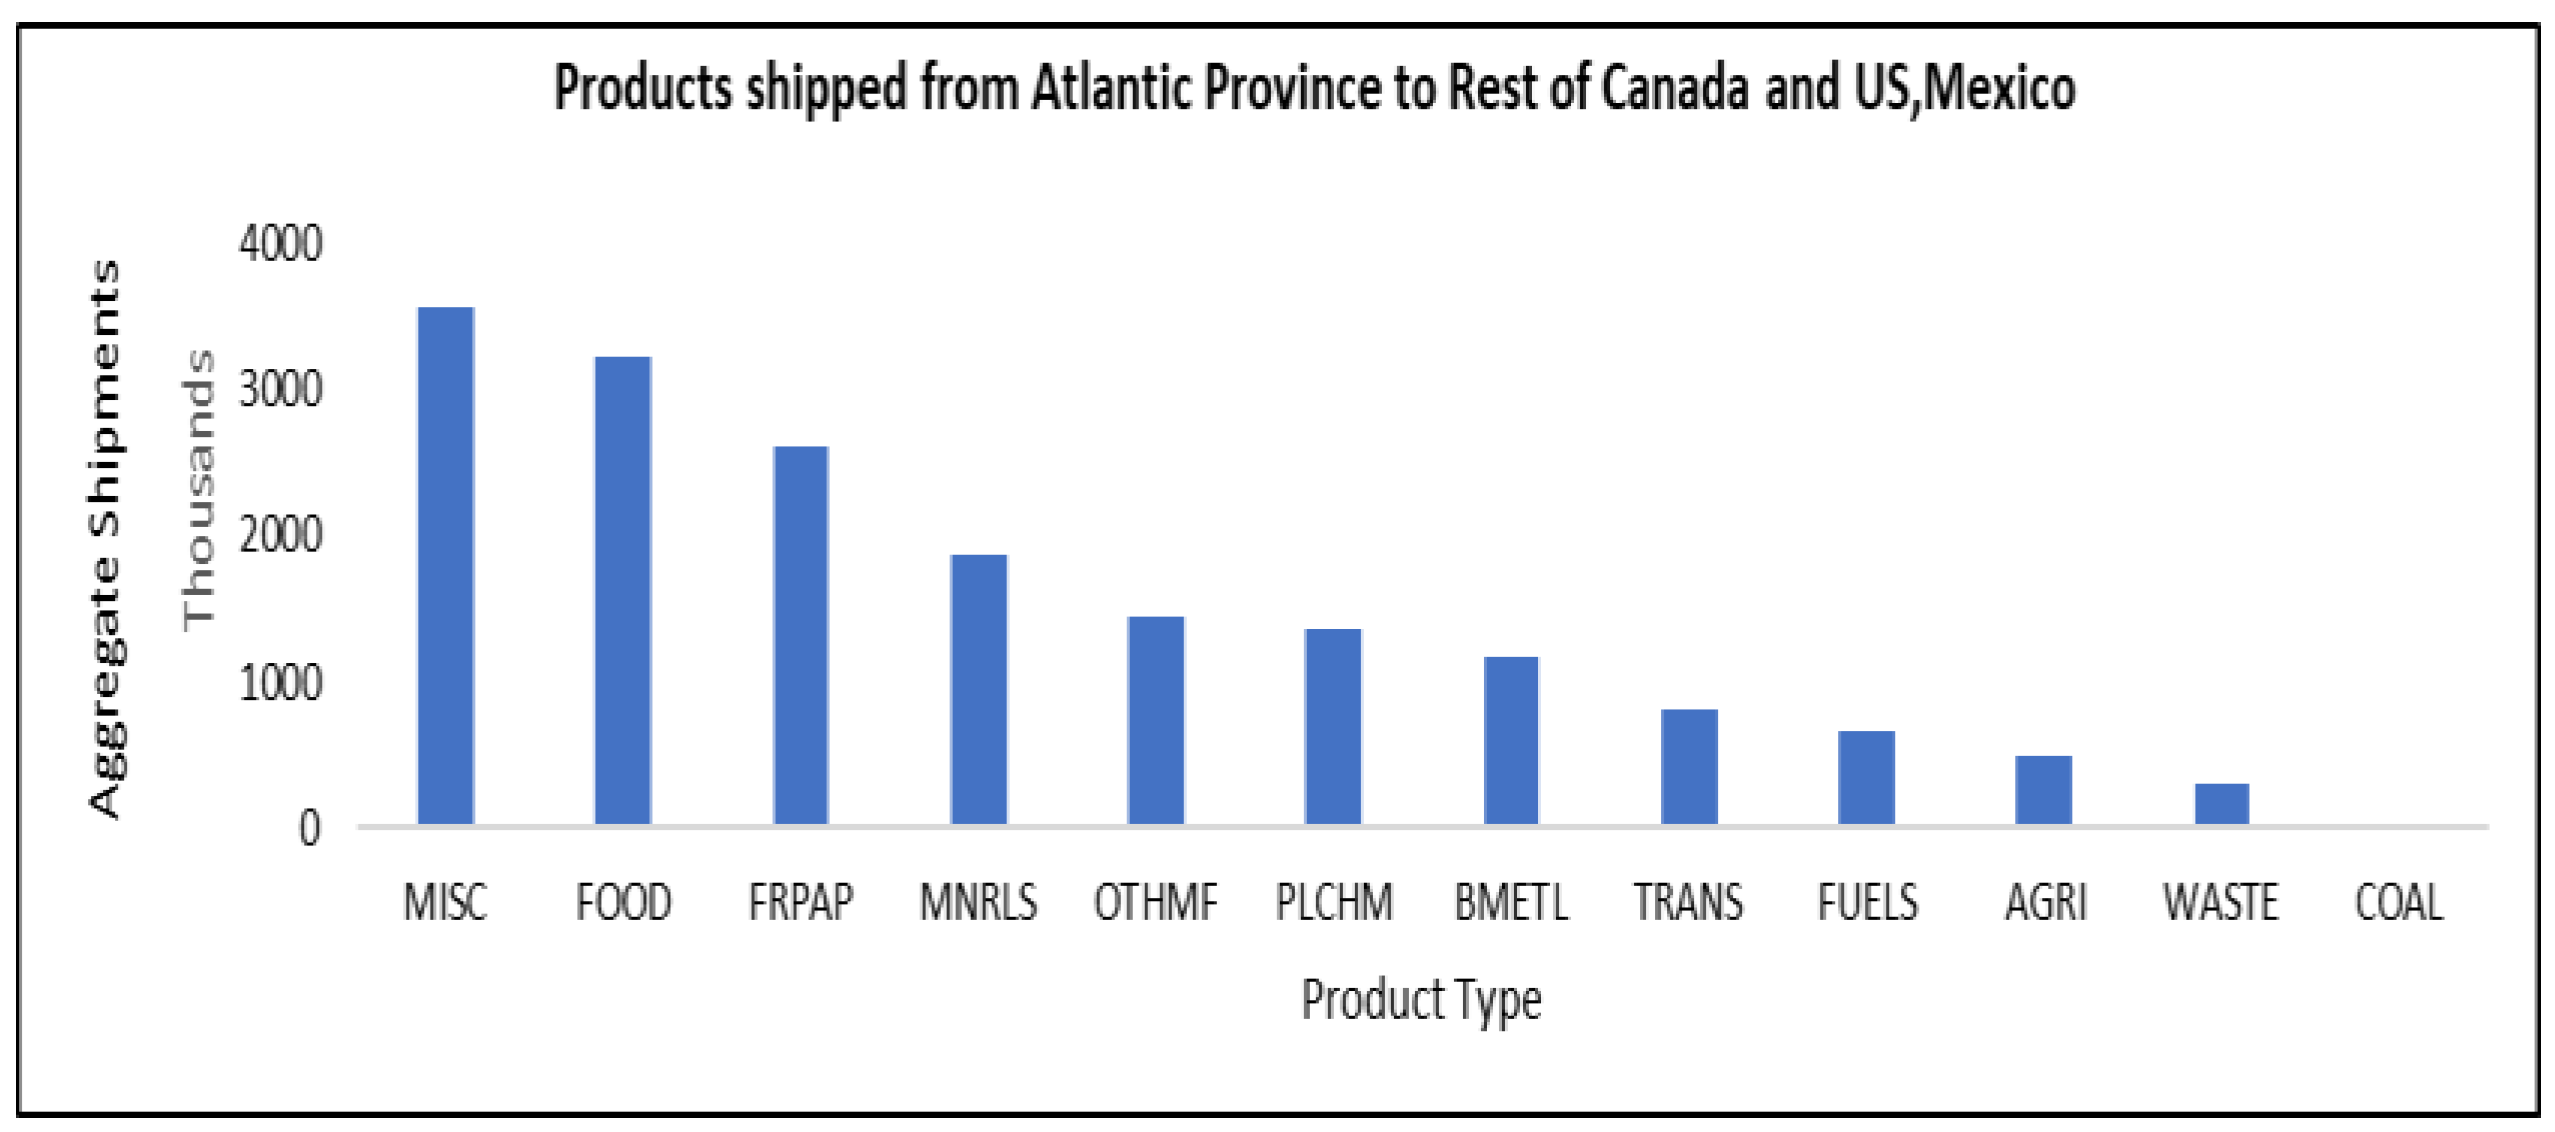
3.4. Analysis of Freight Based on the Product Type
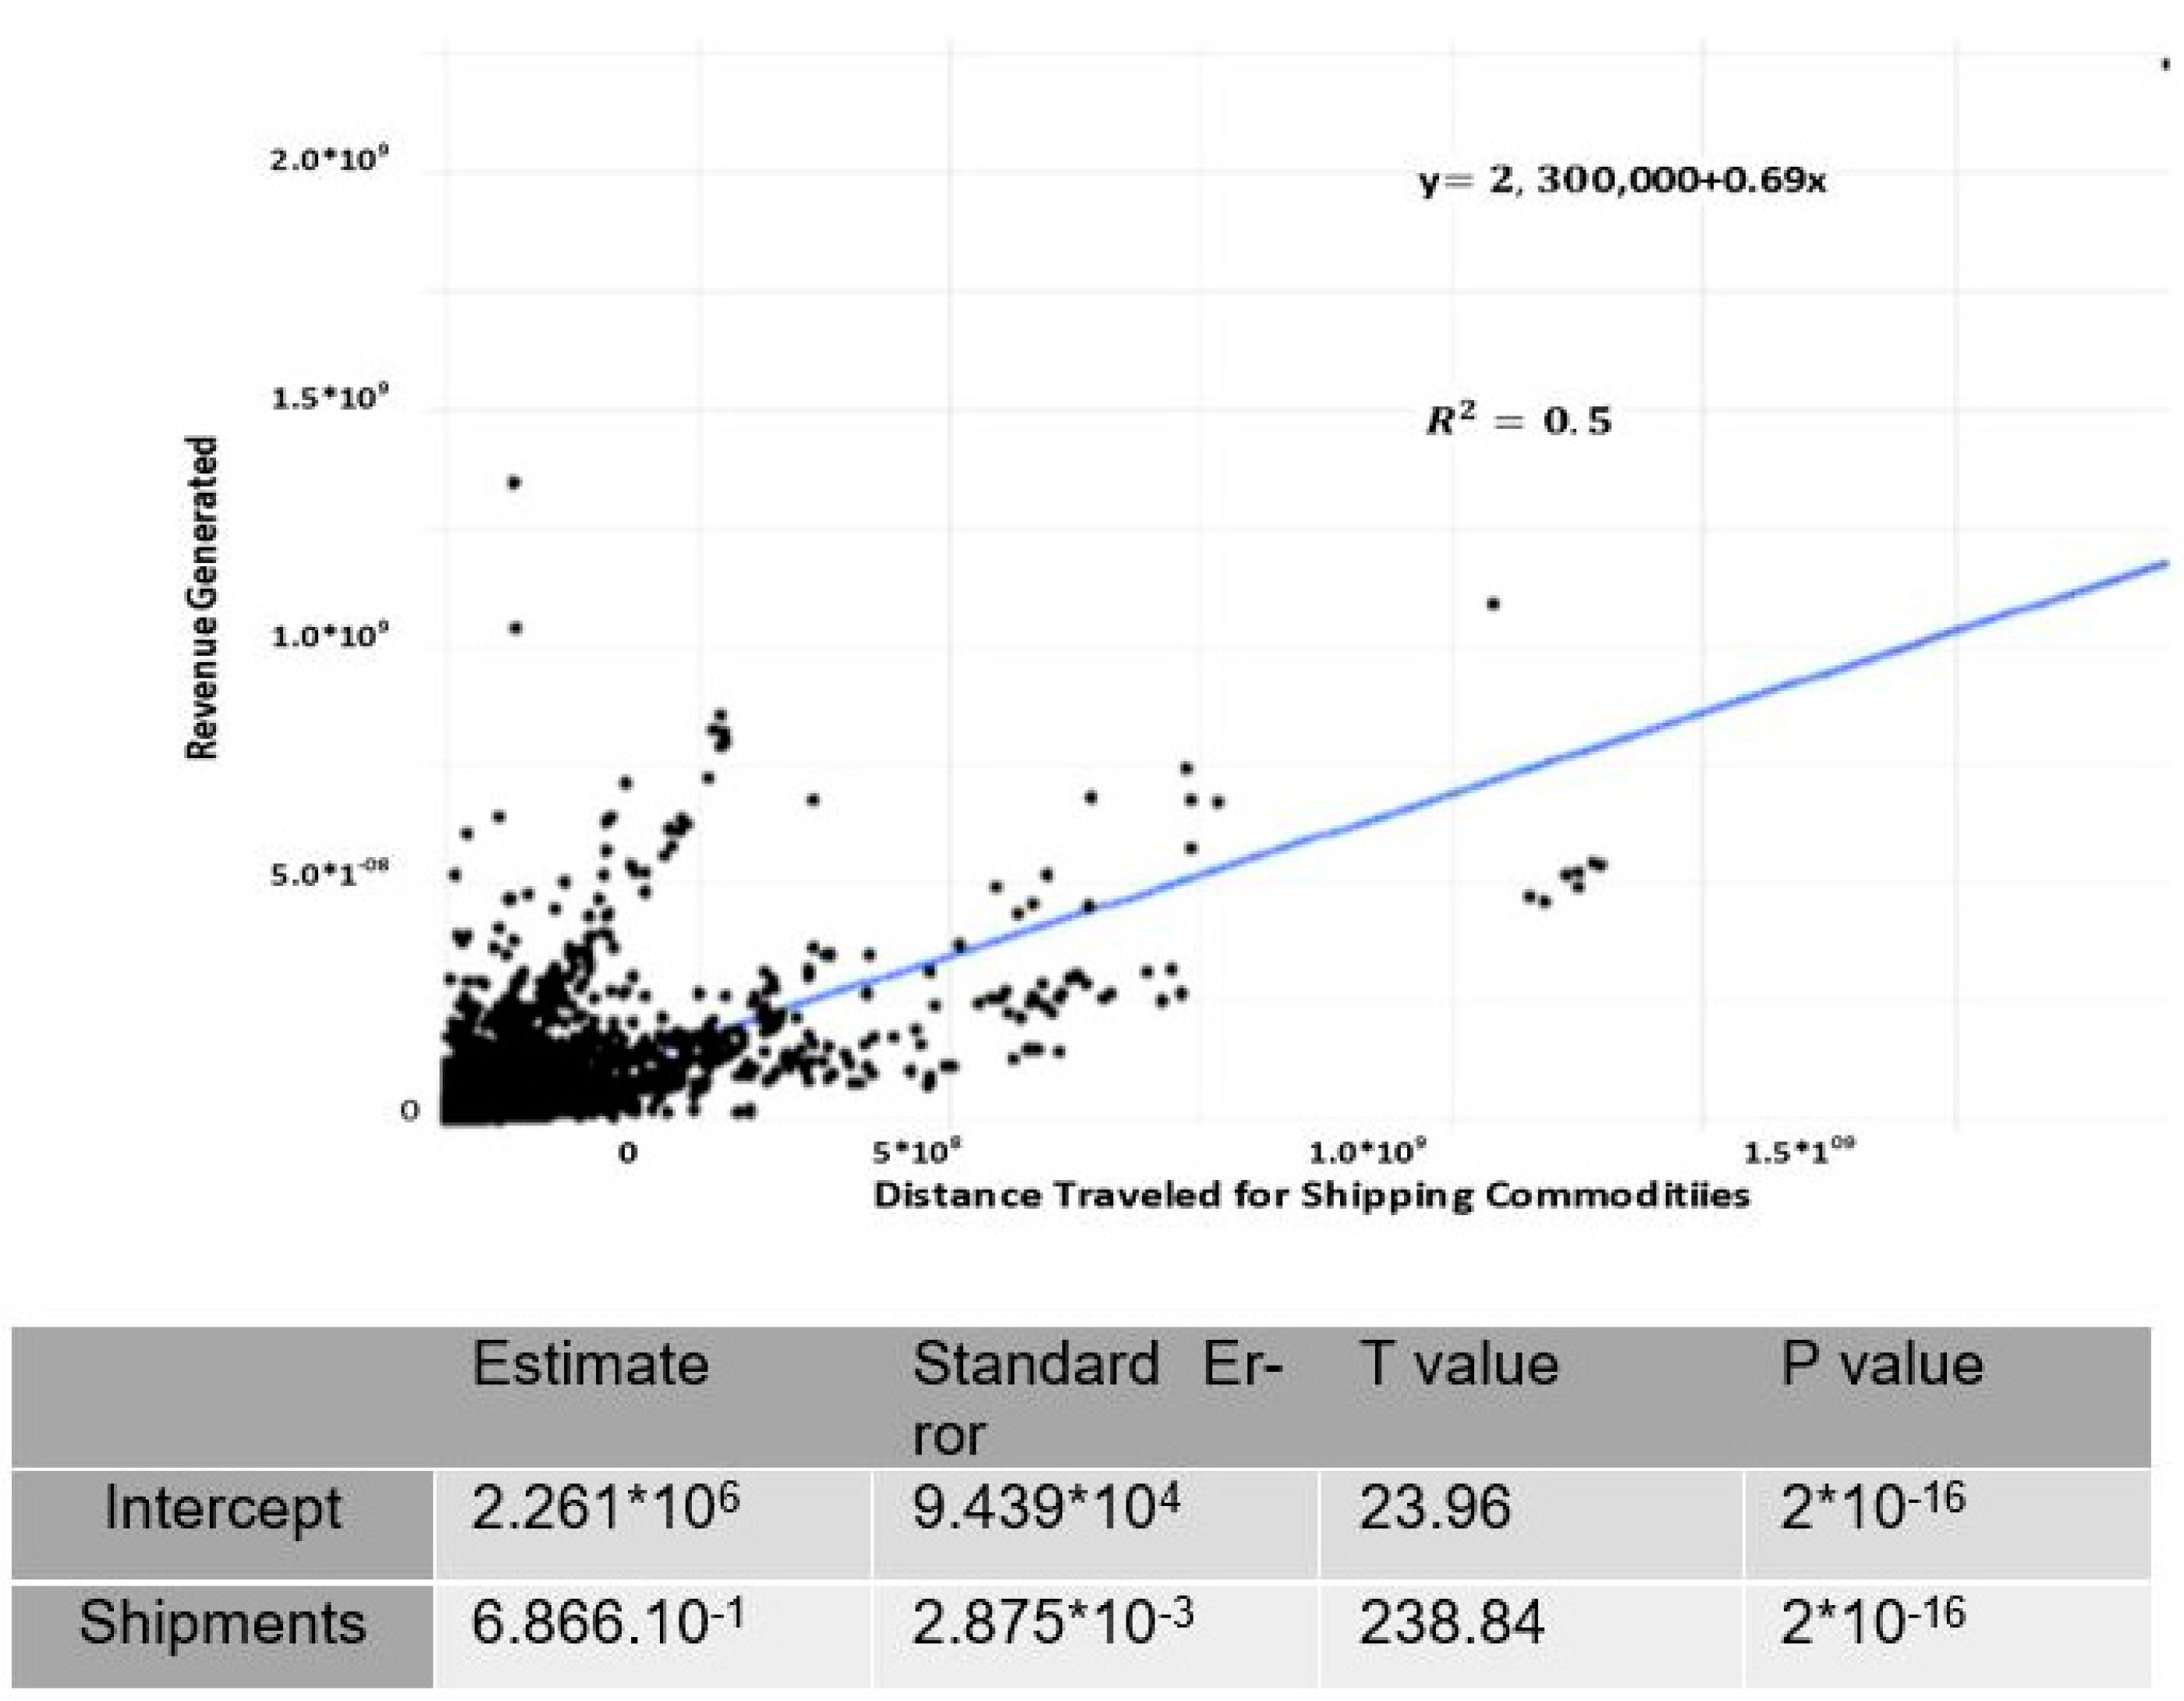
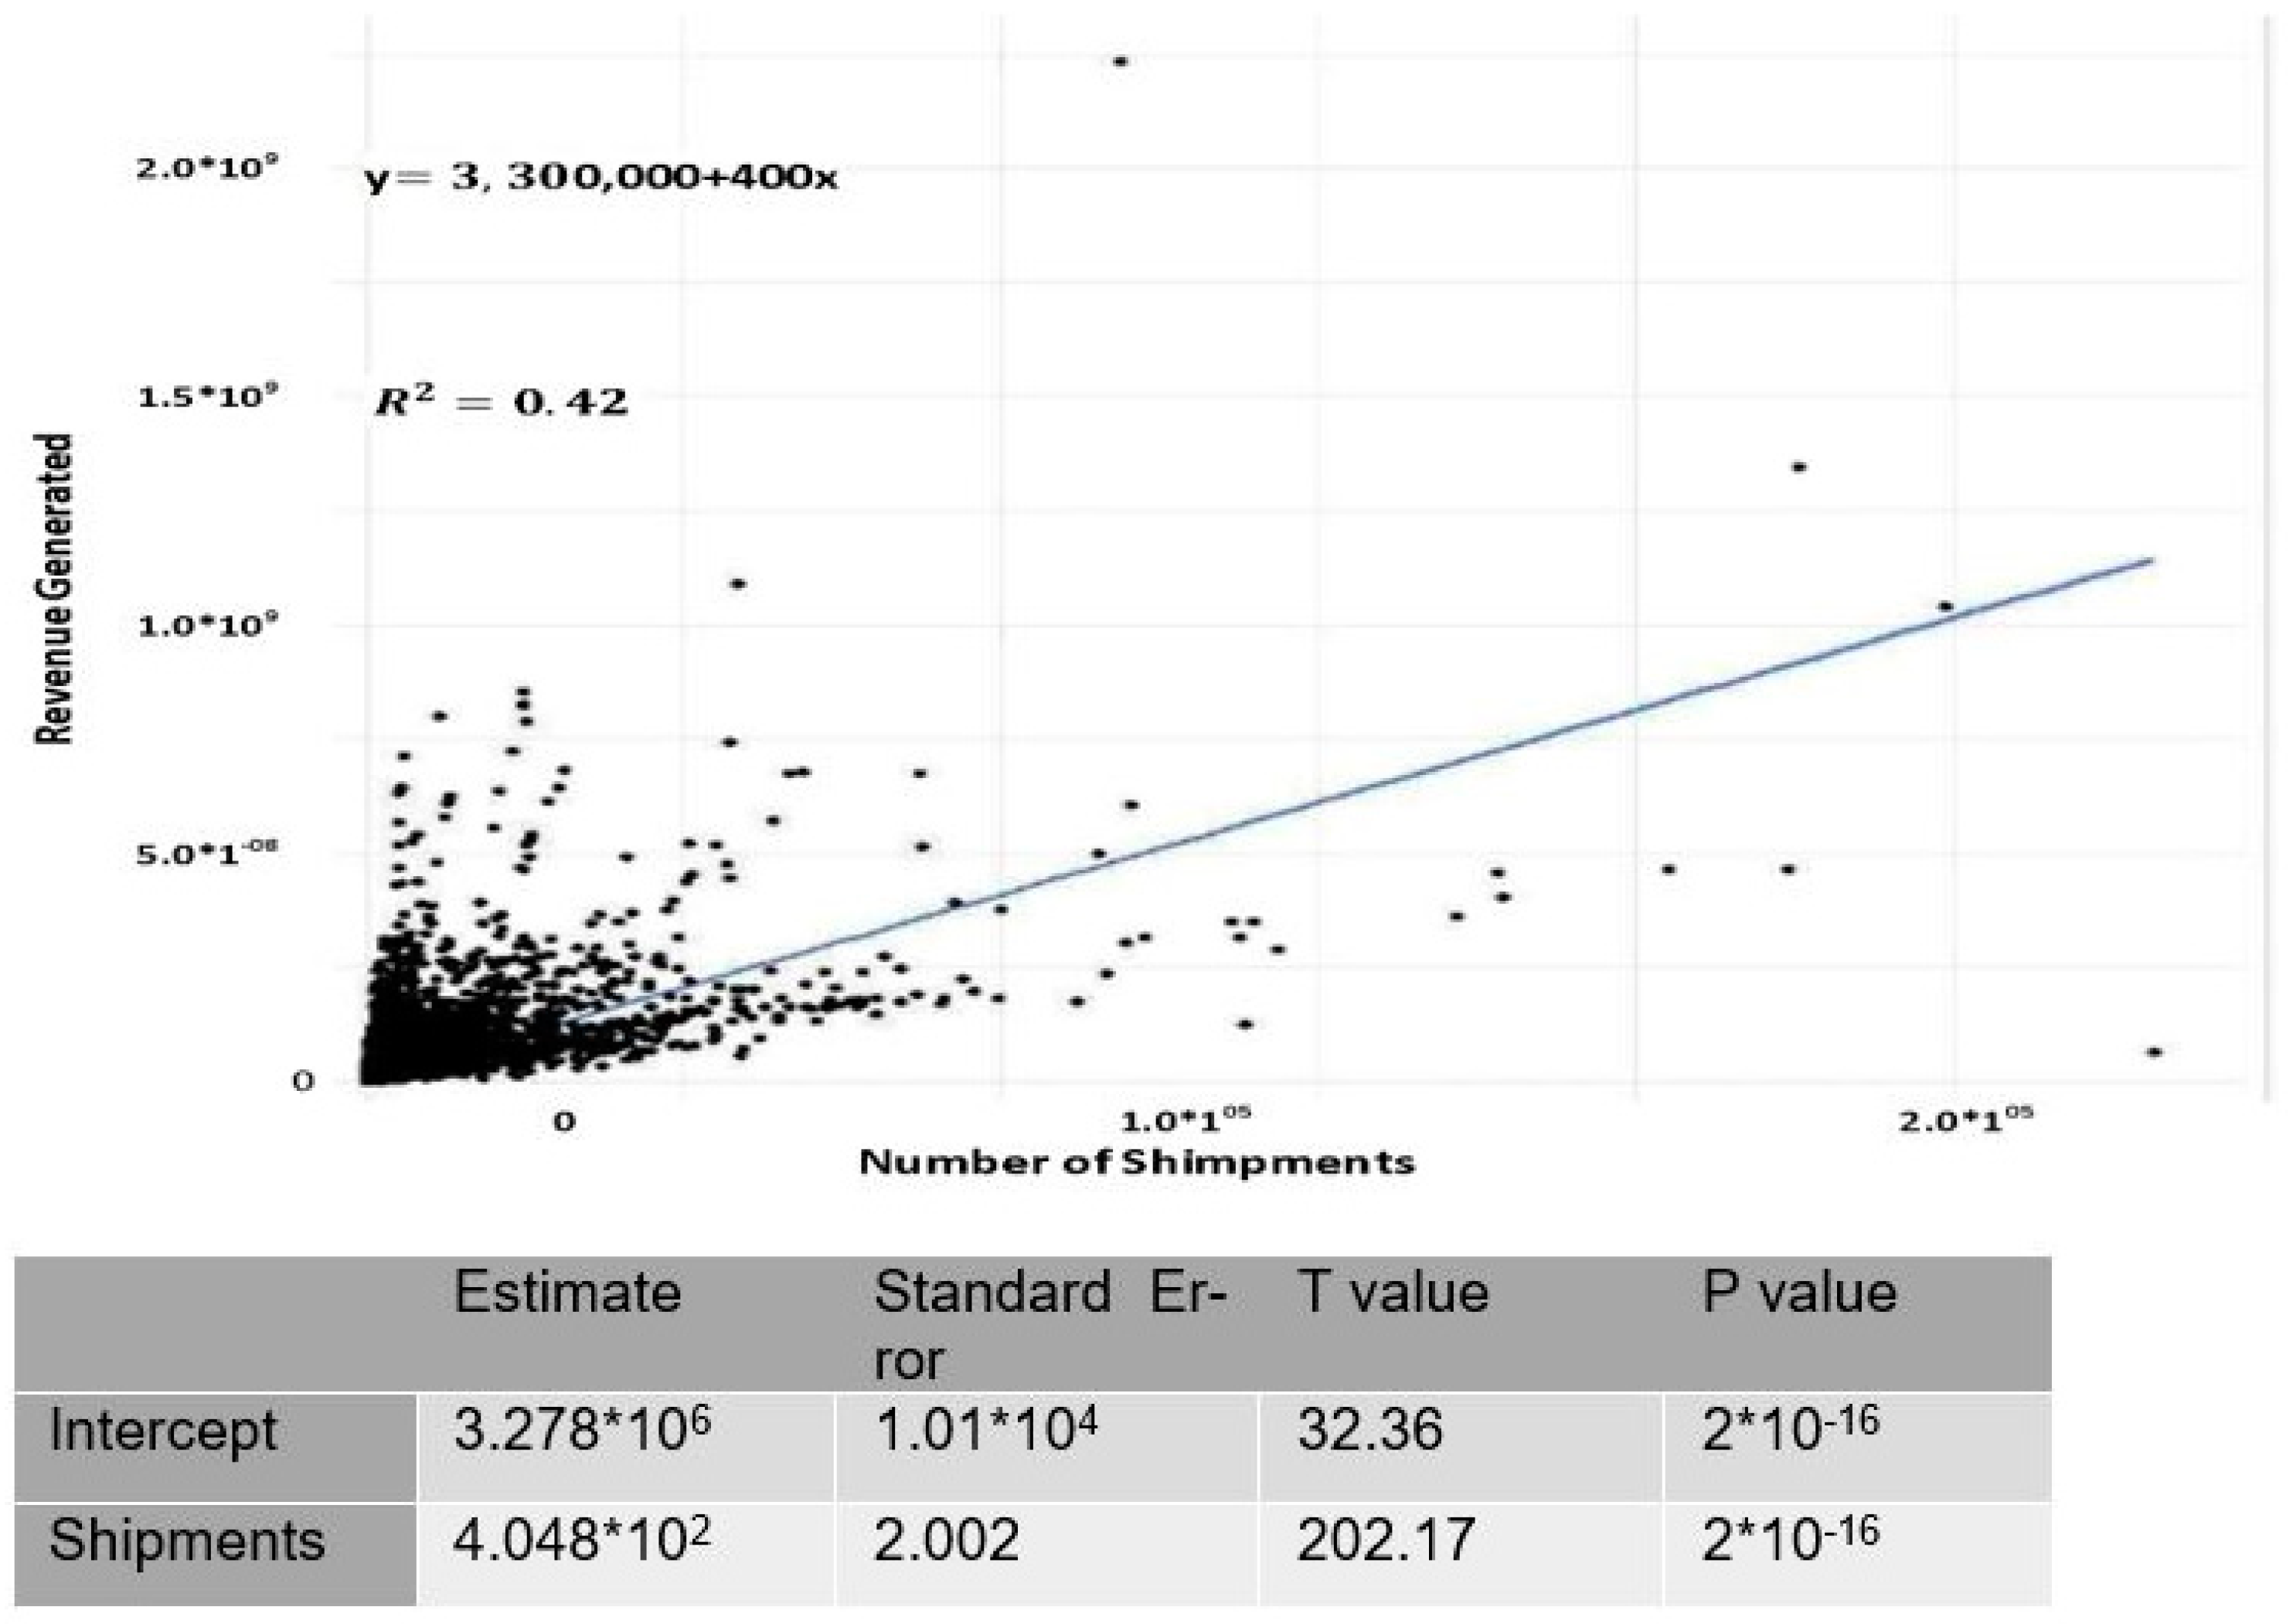
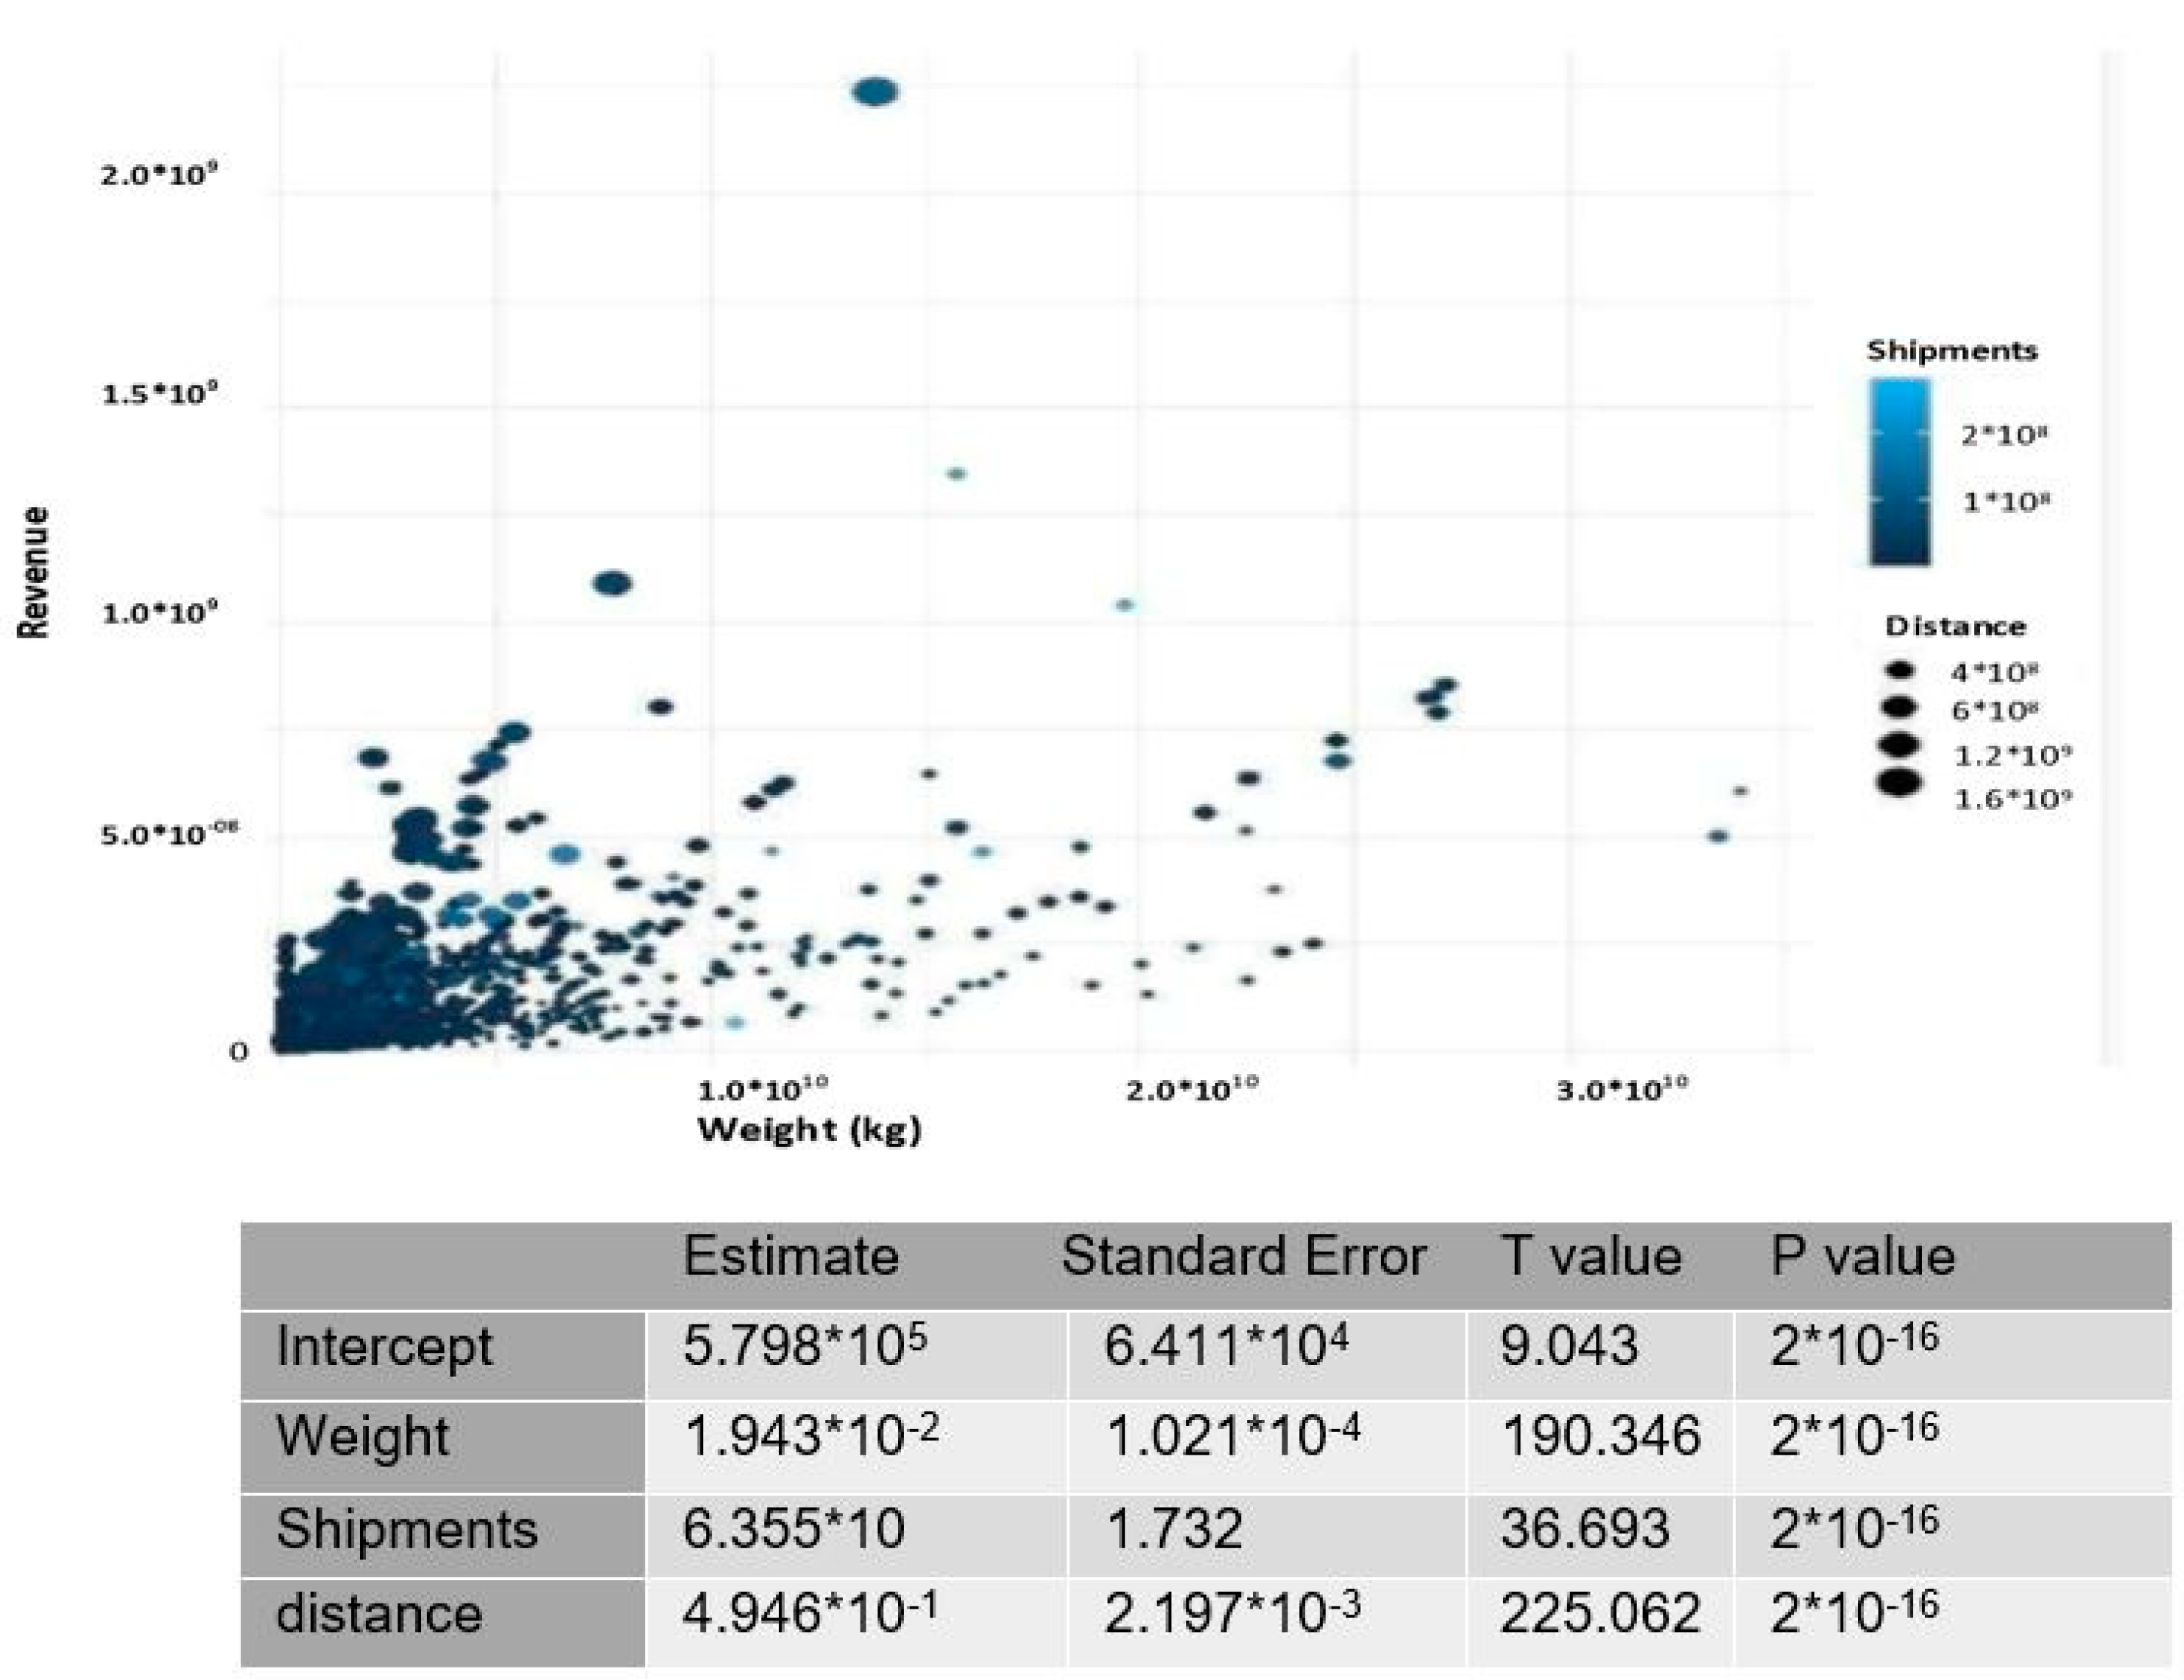
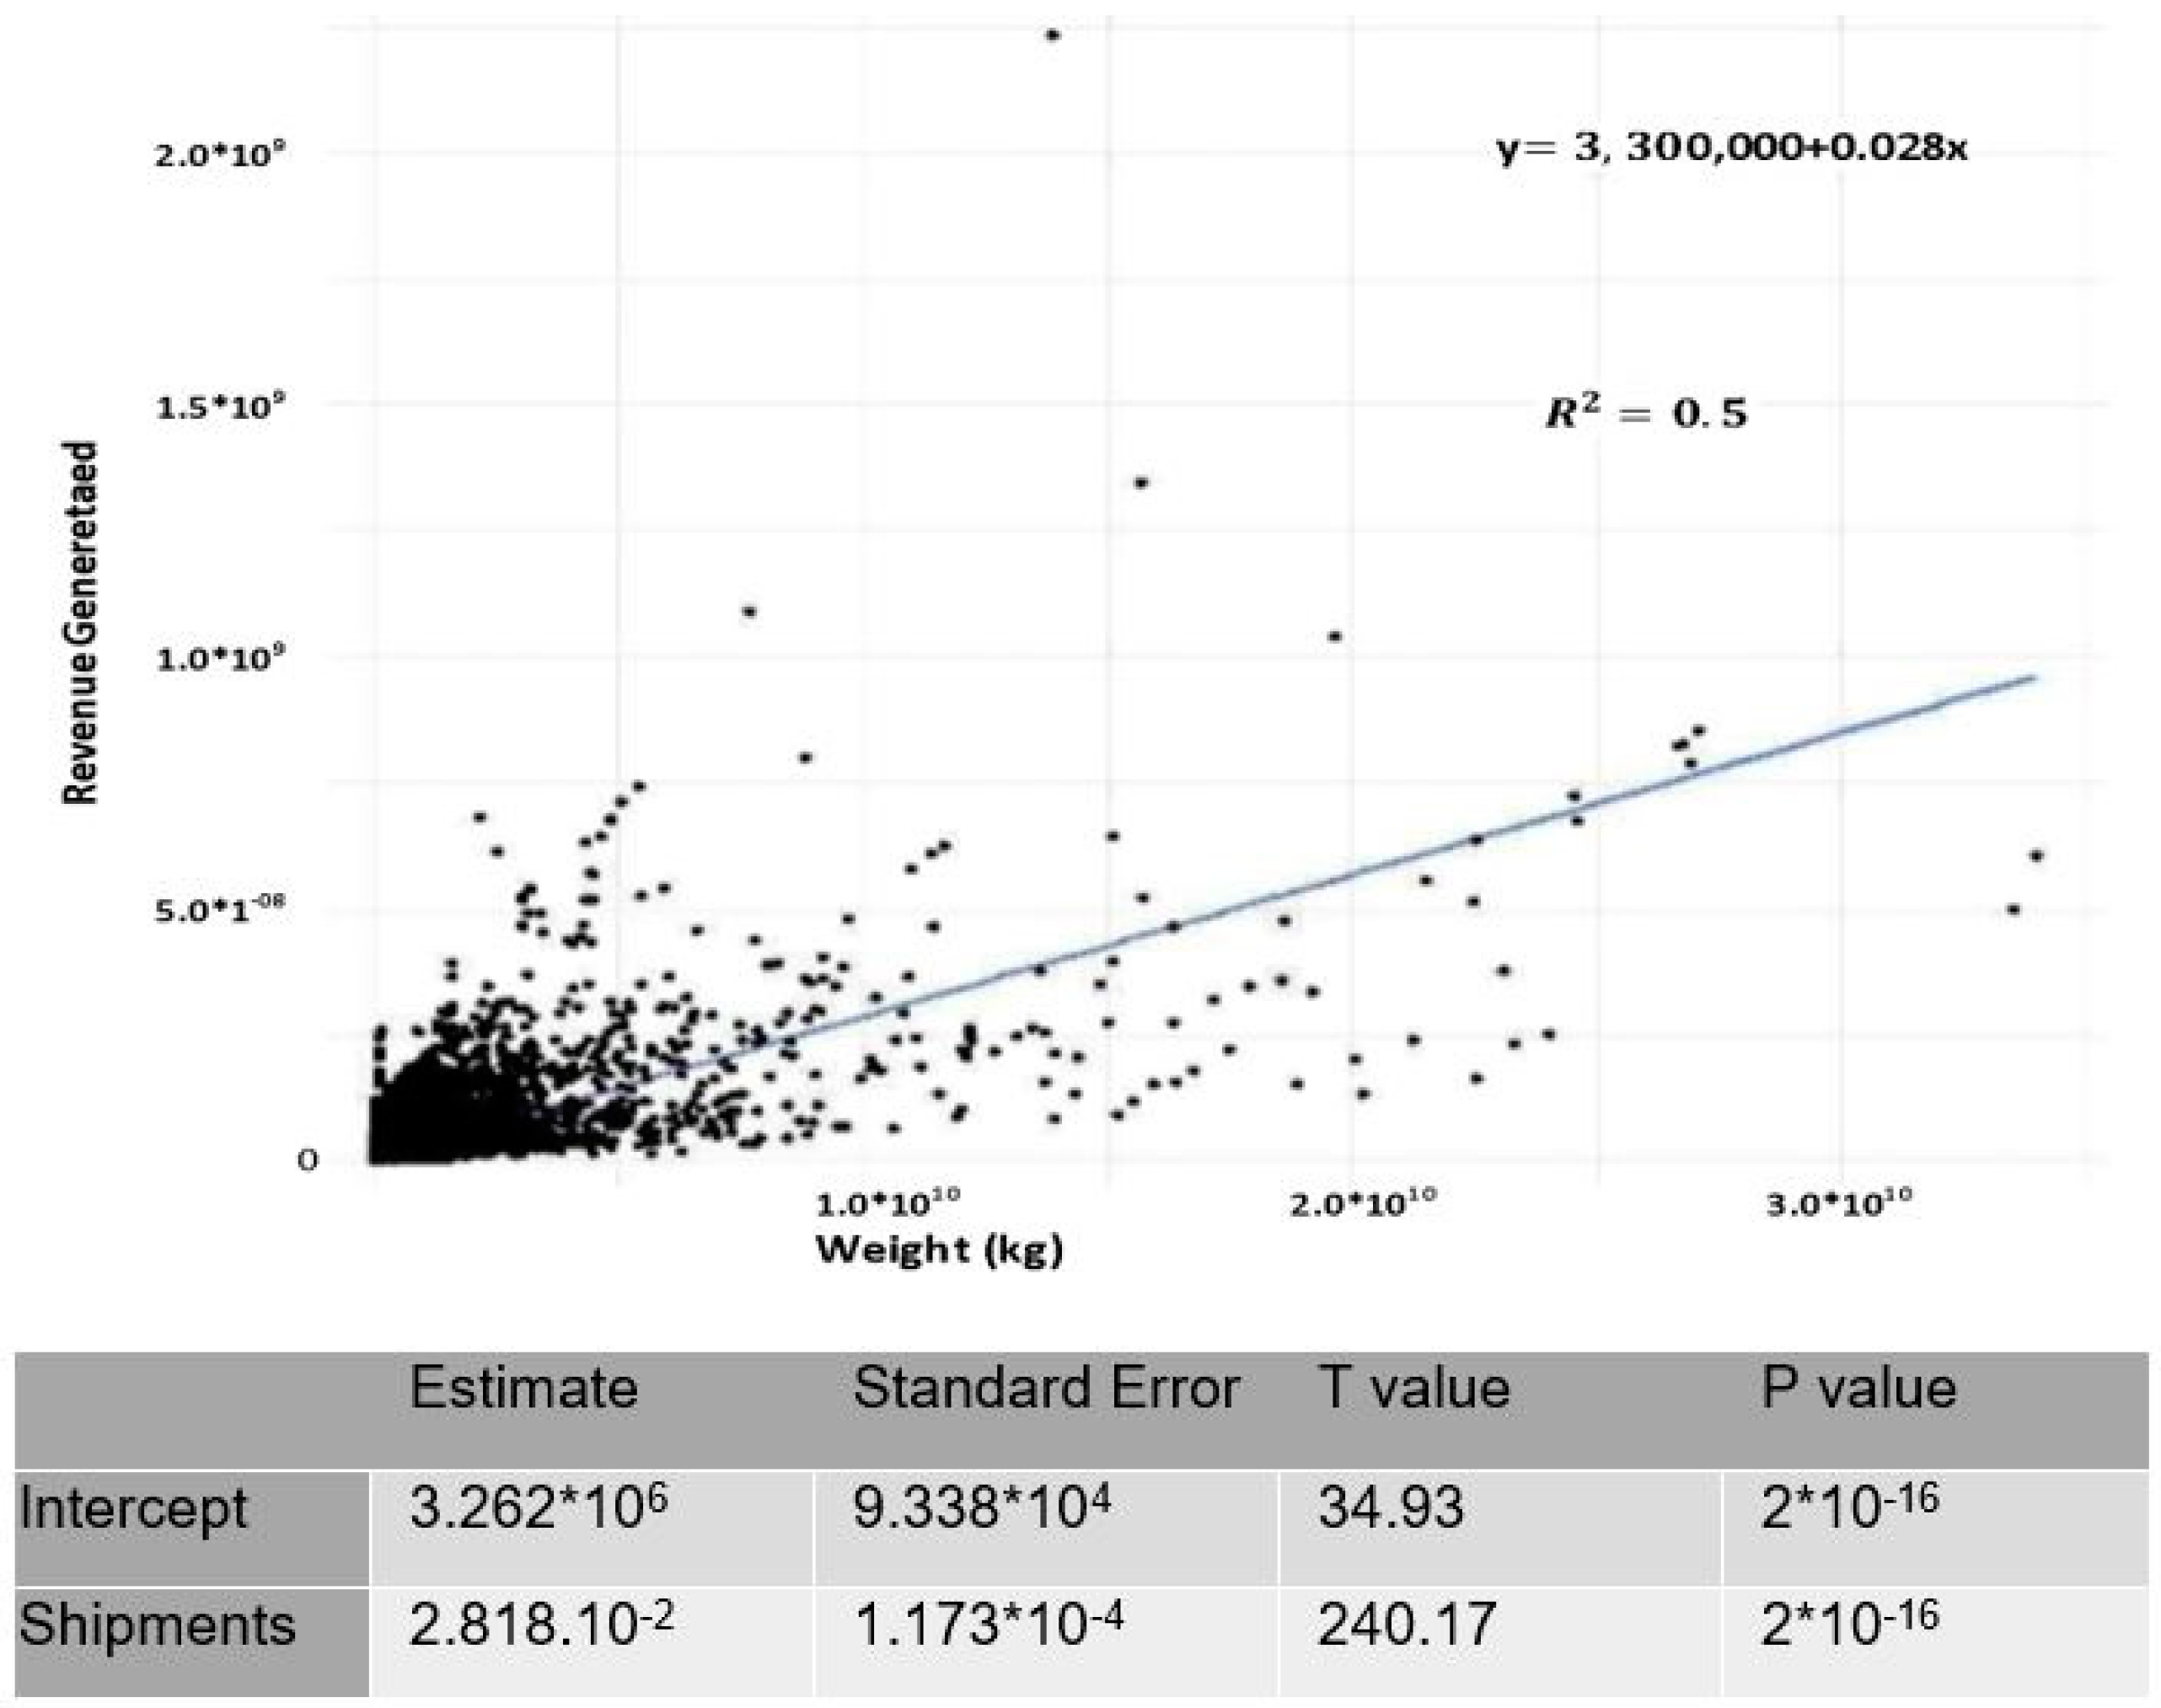
3.5. Simple and Multiple Linear Regression Analysis
4. Conclusions
Author Contributions
Funding
Data Availability Statement
Conflicts of Interest
References
- Murphy, P.R., Jr.; Knemeyer, A.M. Contemporary Logistics, 11th ed.; Pearson Education: London, UK, 2015. [Google Scholar]
- Department of Transportation. Atlantic Canada Transportation Strategy 2008–2018; Department of Transportation: Frederiaton, NB, Canada.
- Hassanzadeh Amin, S.; Yan, N.; Morr, D. Analysis of Transportation Modes by Evaluating SWOT Factors and Pairwise Comparisons: A Case Study. Multi-Criteria Methods Tech. Appl. Supply Chain Manag. 2018, 57, 57–76. [Google Scholar]
- Brooks, M.; Trifts, V. Short Sea Shipping in North America: Understanding the Requirements of Atlantic Canadian Shippers. Marit. Policy Manag. 2008, 35, 145–158. [Google Scholar] [CrossRef]
- Tagawa, H.; Kawasaki, T.; Hanaoka, S. Conditions influencing the choice between direct shipment and transshipment in maritime shipping network. J. Shipp. Trade 2021, 6, 4. [Google Scholar] [CrossRef]
- Brooks, M.R.; Hodgson, J.R.; Frost, J. Short Sea Shipping on the East Coast of North America: An Analysis of Opportunities and Issues; Canada–Dalhousie University: Halifax, NS, Canada, 2006. [Google Scholar]
- Atlantic Transport Action, 2015. Available online: http://transportactionatlantic.ca/cape-breton-rail-line-ceases-operation-but-its-not-over-yet/ (accessed on 10 June 2022).


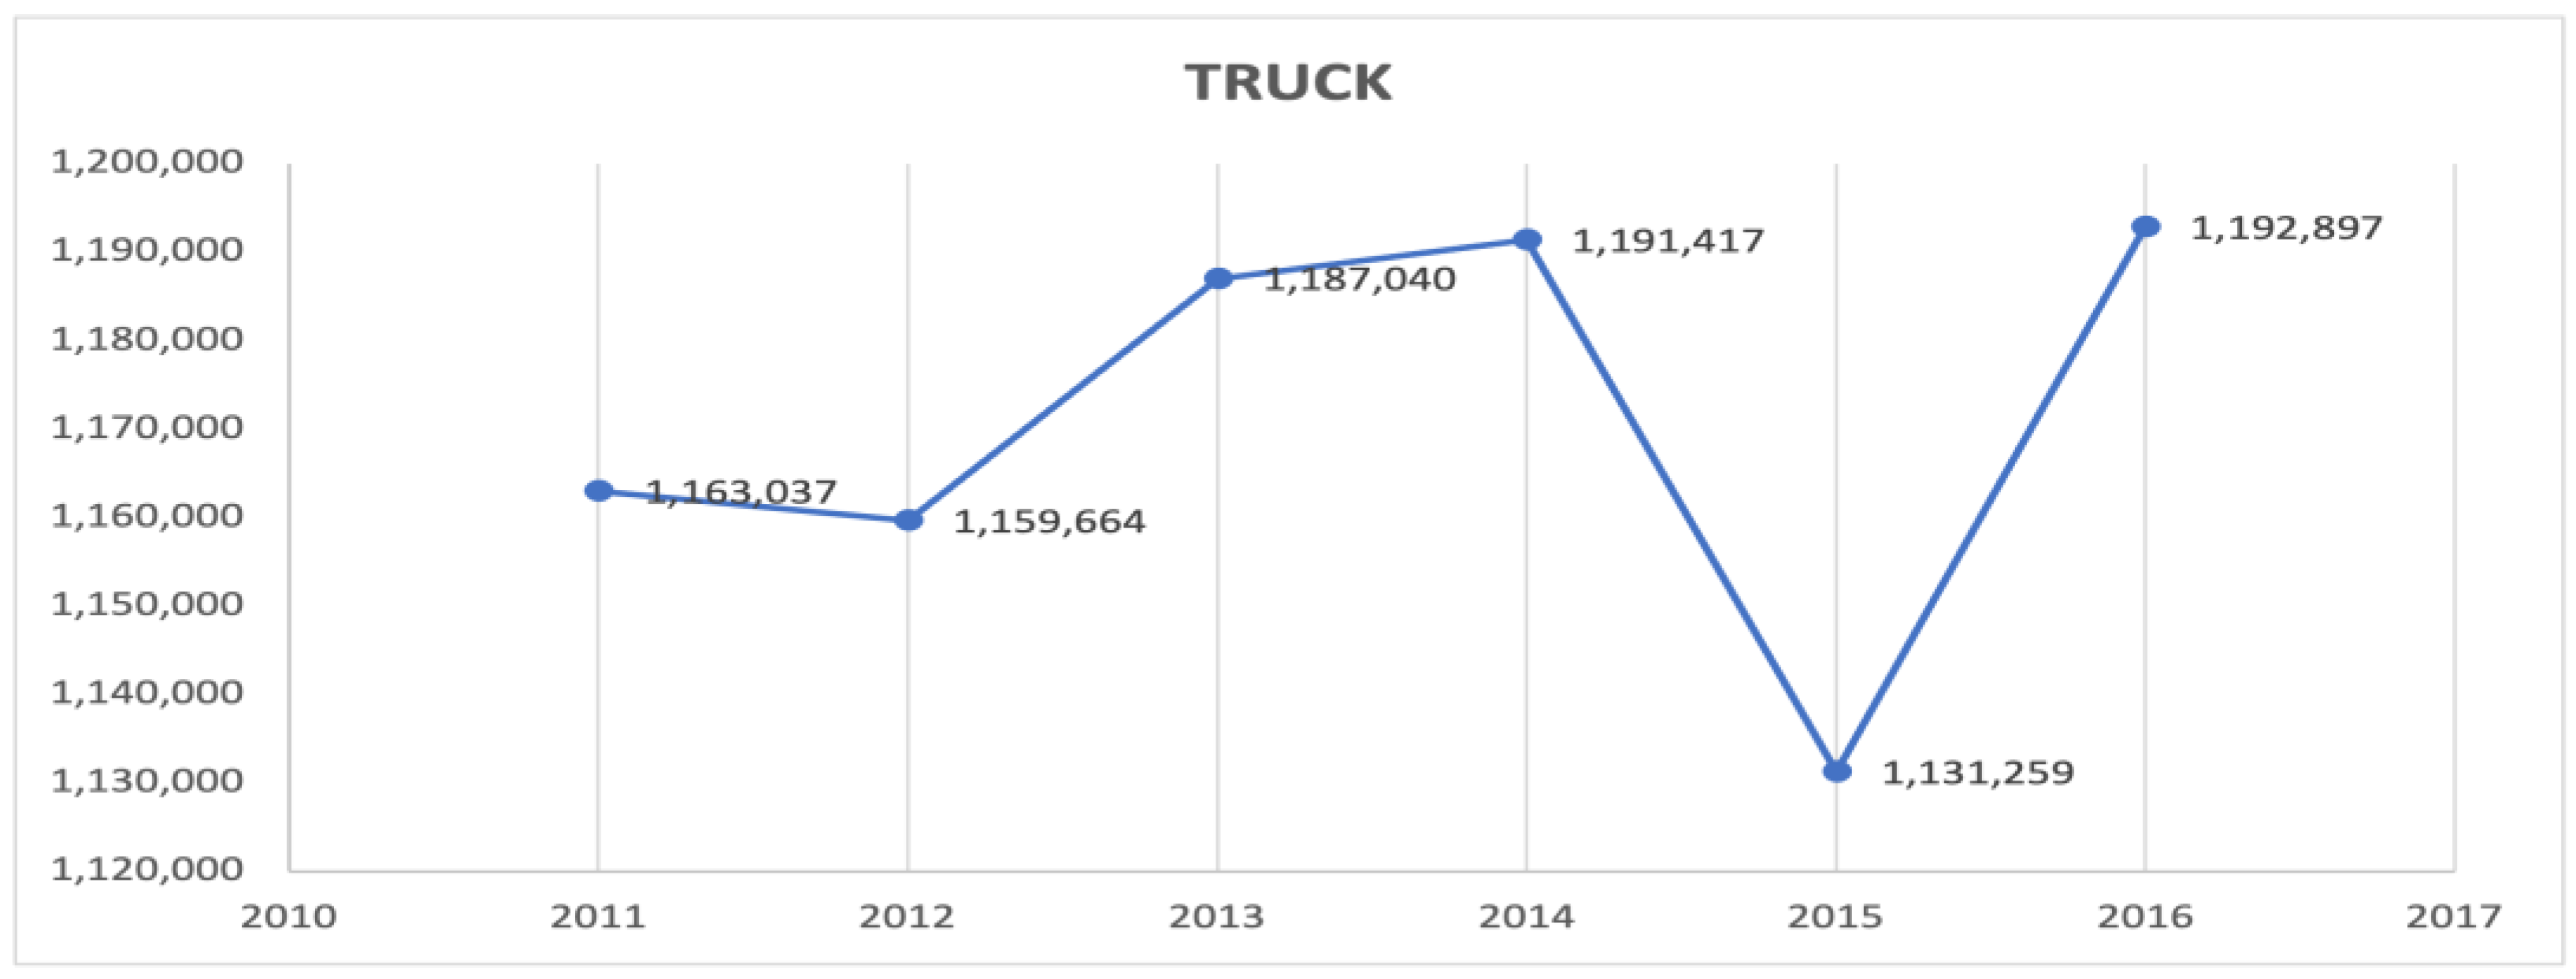
| Year | Total Number of Shipments | Total TonneKm | Total Shipment Value | Total Revenue Earned by Carriers |
|---|---|---|---|---|
| 2011 | 1,253,482 | 7,047,863,934 | CAD 28,031,035,422 | CAD 666,859,119 |
| 2012 | 1,245,306 | 6,689,204,634 | CAD 31,780,643,580 | CAD 687,348,190 |
| 2013 | 1,272,170 | 7,142,635,806 | CAD 30,324,182,403 | CAD 696,063,403 |
| 2014 | 1,273,006 | 6,667,215,334 | CAD 27,955,593,227 | CAD 675,826,517 |
| 2015 | 1,223,374 | 6,988,450,358 | CAD 28,427,268,761 | CAD 631,229,644 |
| 2016 | 1,295,798 | 7,202,189,787 | CAD 32,498,050,364 | CAD 718,559,814 |
| Year | Total Number of Shipments | Total TonneKm | Total Shipment Value | Total Revenue Earned by Carriers |
|---|---|---|---|---|
| 2011 | 1,234,620 | 7,515,101,458 | CAD 36,430,490,469 | CAD 640,167,051 |
| 2012 | 1,298,787 | 10,631,655,193 | CAD 35,109,593,370 | CAD 826,373,068 |
| 2013 | 1,228,205 | 11,004,461,194 | CAD 32,382,113,308 | CAD 832,571,179 |
| 2014 | 1,306,707 | 12,197,146,309 | CAD 32,156,352,025 | CAD 942,739,350 |
| 2015 | 1,298,803 | 13,227,500,230 | CAD 37,642,259,953 | CAD 963,812,314 |
| 2016 | 1,315,961 | 13,711,836,472 | CAD 37,602,132,494 | CAD 940,842,139 |
| Year | Total Number of Shipments | Total TonneKm | Total Shipment Value | Total Revenue Earned by Carriers |
|---|---|---|---|---|
| 2011 | 591,526 | 3,489,099,196 | CAD 17,735,759,898 | CAD 451,043,471 |
| 2012 | 701,395 | 3,611,128,539 | CAD 16,761,951,282 | CAD 495,442,219 |
| 2013 | 880,072 | 2,623,420,883 | CAD 9,273,539,031 | CAD 421,056,463 |
| 2014 | 649,701 | 3,720,469,944 | CAD 12,316,758,786 | CAD 535,362,614 |
| 2015 | 597,303 | 3,067,894,755 | CAD 9,521,704,507 | CAD 467,525,016 |
| 2016 | 577,610 | 3,592,056,138 | CAD 11,776,422,595 | CAD 405,310,459 |
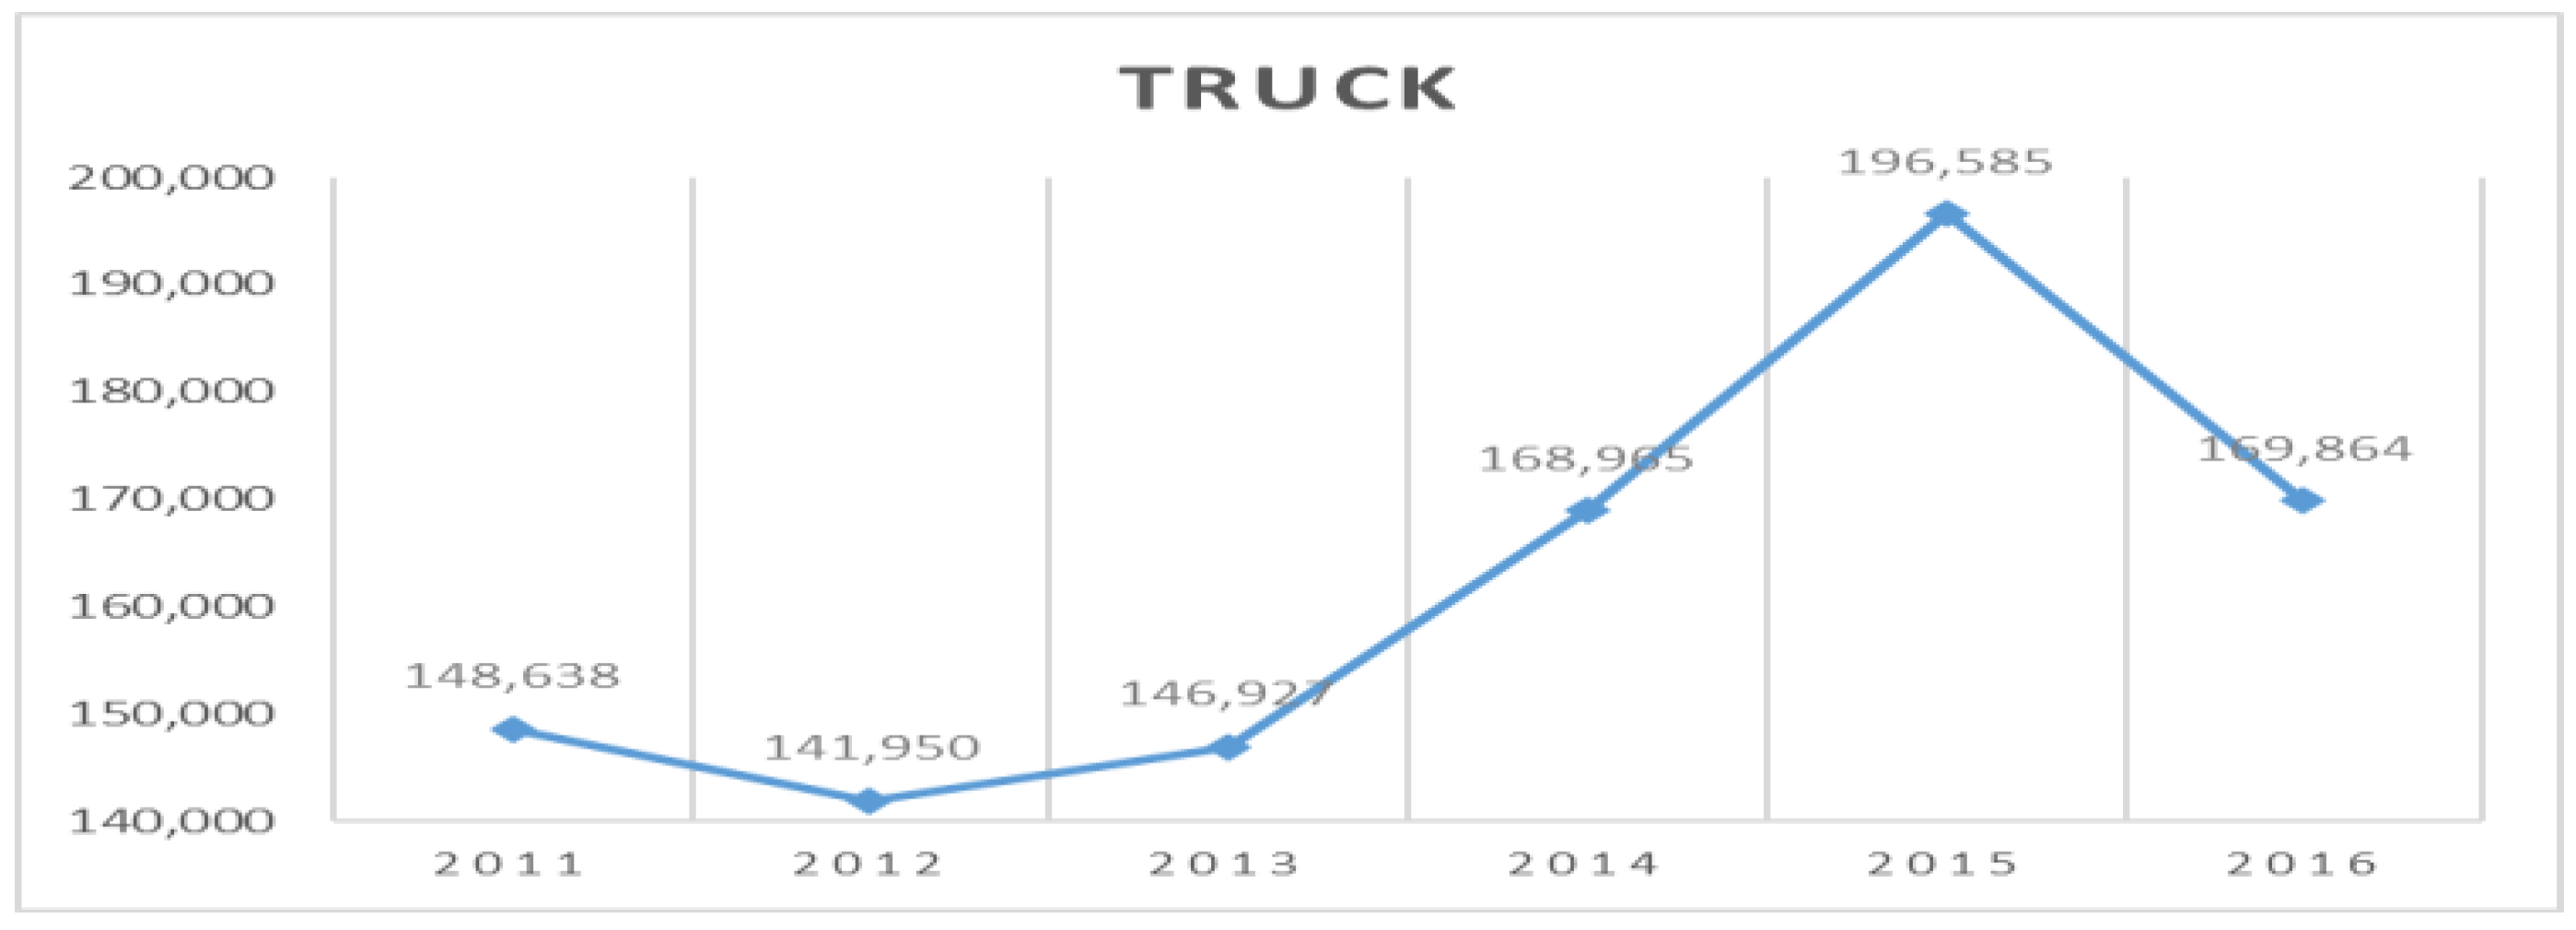
| Year | Total Number of Shipments | Total TonneKm | Total Shipment Value | Total Revenue Earned by Carriers |
|---|---|---|---|---|
| 2011 | 148,638 | 405,460,885 | CAD 2,535,132,534 | CAD 54,494,308 |
| 2012 | 141,950 | 441,455,616 | CAD 3,347,252,745 | CAD 61,442,118 |
| 2013 | 146,927 | 261,411,418 | CAD 2,845,936,534 | CAD 44,070,637 |
| 2014 | 168,967 | 341,713,525 | CAD 3,151,889,070 | CAD 60,807,620 |
| 2015 | 196,585 | 389,635,337 | CAD 4,337,280,456 | CAD 59,685,575 |
| 2016 | 169,878 | 535,876,762 | CAD 3,972,637,034 | CAD 68,011,597 |
Disclaimer/Publisher’s Note: The statements, opinions and data contained in all publications are solely those of the individual author(s) and contributor(s) and not of MDPI and/or the editor(s). MDPI and/or the editor(s) disclaim responsibility for any injury to people or property resulting from any ideas, methods, instructions or products referred to in the content. |
© 2023 by the authors. Licensee MDPI, Basel, Switzerland. This article is an open access article distributed under the terms and conditions of the Creative Commons Attribution (CC BY) license (https://creativecommons.org/licenses/by/4.0/).
Share and Cite
Yousefi, J.; Ashtab, S.; Yasaei, A.; George, A.; Mukarram, A.; Sandhu, S.S. Multiple Linear Regression Analysis of Canada’s Freight Transportation Framework. Logistics 2023, 7, 29. https://doi.org/10.3390/logistics7020029
Yousefi J, Ashtab S, Yasaei A, George A, Mukarram A, Sandhu SS. Multiple Linear Regression Analysis of Canada’s Freight Transportation Framework. Logistics. 2023; 7(2):29. https://doi.org/10.3390/logistics7020029
Chicago/Turabian StyleYousefi, Jamileh, Sahand Ashtab, Amirali Yasaei, Allu George, Ali Mukarram, and Satinderpal Singh Sandhu. 2023. "Multiple Linear Regression Analysis of Canada’s Freight Transportation Framework" Logistics 7, no. 2: 29. https://doi.org/10.3390/logistics7020029
APA StyleYousefi, J., Ashtab, S., Yasaei, A., George, A., Mukarram, A., & Sandhu, S. S. (2023). Multiple Linear Regression Analysis of Canada’s Freight Transportation Framework. Logistics, 7(2), 29. https://doi.org/10.3390/logistics7020029