Abstract
Background: The purpose of this study is to analyse the role of the main 50 US cargo airports and 25 air cargo airlines in the logistics of e-commerce companies from 2000 to 2020, to highlight the importance of airports in the logistics and e-commerce industries. Methods: A review of the relevant literature on airports, air cargo carriers, logistics, and e-commerce sectors was undertaken to understand the link between them. The data were collected using four criteria: airport category, airport location, top 25 air cargo carriers, and other relevant data from the Federal Aviation Administration, International Air Transport Association, Organization for Economic Co-operation and Development, US Department of Transportation, amongst many others. Results: The findings reveal that there is a consolidated relationship between airports, air cargo airlines, and e-commerce, which has been especially evident during the COVID-19 pandemic. Airports and air cargo carriers are identified as the most relevant partners in the e-commerce industry. This is because of the e-commerce sector and its users’ demand for speed and reliability in the interaction between the demand for and supply of products and services. Conclusions: The pandemic has changed the way in which organizations operate and is likely to create new demand from companies and users in the aviation and e-commerce industries. E-commerce companies are highly dependent on the quality and efficiency of air cargo airlines and airports because they need to provide a good shipping service for their products to customers.
1. Introduction
While many studies and organizations saw darkness in the COVID-19 pandemic period, this study shows how the pandemic crisis brought new challenges and opportunities to the aviation and e-commerce sectors. Airports encourage the establishment of companies in cities. They also play an important role in tourism, air cargo, the logistical development of companies around the airport, and global, regional, and local economies [1,2]. The development of e-commerce has promoted growing demand for air cargo around the world [3,4,5,6]. In 2019, e-commerce represented 15% of air cargo [7]. Airlines, forwarders, integrators, and airports are trying to increase their share in this growing market, and all of them are developing strategies to attract as many e-commerce activities as possible [8]. Indeed, the pandemic has highlighted the relevance of airports and the air cargo industry to e-commerce organizations and consumers. As stated by Leung et al., [9] it is necessary to provide a virtual market for agents of the air cargo industry, enabling them to develop and engage in logistics integration, with the aim of improving aviation logistics performance [10]. Collaboration between organizations relies on the development of appropriate performance measurement systems.
According to the Organization for Economic Co-operation and Development (OECD), the pandemic crisis has enhanced dynamism in the e-commerce landscape across countries and has expanded the scope of e-commerce worldwide [11]. It also indicates how e-commerce transactions by individuals in many countries have increased in essential goods and services. Air cargo is an integral part of most passenger airline operations, although not in the case of low-cost airlines [12]. Further research in this regard is needed, which may assist stakeholders in global air cargo markets and international supply chains [13], where there is plenty of evidence that air transport creates opportunities as well as risks [14].
The ubiquitous pattern of online consumer purchases followed by the dispatch of products and services is revolutionizing the way in which airports, air cargo firms, and logistics industries are operating logistically. There is thus an opportunity for transformation in the symbiotic business relationship between the air cargo industry and e-commerce. According to the International Air Transport Association (IATA), 52% of consumers increased their online spending during the COVID-19 crisis. Air cargo is the most suitable means to deal with for this logistical challenge in distance–time terms [7]. Electronic forms of communication play a complementary role in the transport and infrastructure system, and show positive externalities like a high speed of accessibility and information, especially in peripheral areas. As regards negative externalities, an immediate effect is strong competition among the networks of transport modalities and worldwide pollution phenomena [15,16]. Airports’ management must integrate the commercial perspective, since commercial income is a significant source of financing capabilities [17].
Baltazar et al. [18] revealed that airports create value in economic and social terms where these are operating. Notwithstanding, existing evidence of the economic effects of airports is limited, due in part to the difficulties inherent in measuring the effects [19]. A critical literature review is necessary to evaluate the impact of airports on the e-commerce industry. Many studies have been conducted to examine the direct effects of airports on the logistics of e-commerce companies’ development; however, there is little solid evidence on spatial spillover effects, and much less in the context of airport systems and the business knowledge of air cargo logistics [10,20]. To fill this gap, the main challenge of this study is to analyze the role of the main 50 US cargo airports (see Figure 1) and air cargo airlines in the logistics of e-commerce companies from 2000 to 2020, to highlight the importance of airports in the logistics and e-commerce industries, before and during the pandemic crisis. Hence, this study uses a combination of qualitative and quantitative data from airports, air cargo firms, and e-commerce companies to tackle future issues in the business relationship between them, as well as to generate operational strategies for those who would like to manage aviation and e-commerce logistics in a more efficient and effective way.
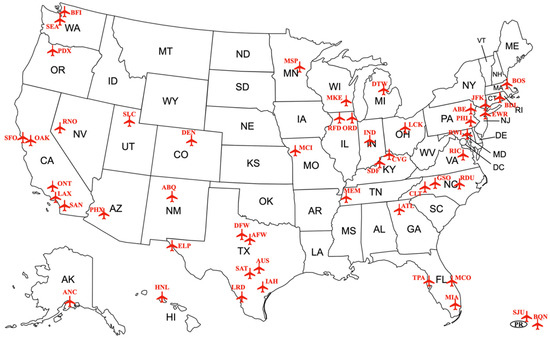
Figure 1.
Location of top 50 US cargo airports analyzed in this study.
2. Literature Review
2.1. E-Commerce Companies in the Pandemic
The COVID-19 pandemic has caused significant changes in e-commerce companies like ZARA, Amazon, Ebay, TESCO, Walmart, Apple, Nike, Adidas, etc., and among users. Online firms are adapting to this new situation and firms are seeking digital solutions for their business-to-business (B2B) e-commerce challenges. Hussain et al. [21] indicate that B2B is essential for a rapidly changing business environment and increases companies’ overall performance. Particularly, the Internet of Things (IoT) has created numerous opportunities and has extended supply chains; in fact, one of the outcomes of the combination of e-commerce and the IoT is the B2B spot commodity market [22,23]. For instance, Florido-Benítez [24] suggests universalizing firms’ brand apps with the aim of increasing the number of users in direct contact with the firm, and promoting products and services internationally in a more immediate way. As stated by Kumar and Petersen [25], there is a direct correlation between the use of e-commerce and improved customer service. In particular, e-commerce companies have reduced response times and lower service costs, and have effectively raised customer satisfaction and the level of service that customers expect to receive. The growth in home deliveries is one of the most tangible impacts of e-commerce, as consumers switch a share of their consumption to purchases made online [26].
Considered as one of the world’s most important consumer-driven economies, the United States (US) accounts for 13.6% of global imports. US consumers spent over US$4.3 trillion on products in 2018 [27], with approximately 15% imported by air from foreign nations [28]. According to the OECD [11], in the US the share of e-commerce in total retail spiked to 16.1% between the first and second quarters of 2020. A similar development occurred in the United Kingdom, where the share of e-commerce in retail rose from 17.3% to 20.3% between the first quarter of 2018 and the first quarter of 2020, and then rose significantly to 31.3% between the first and second quarters of 2020 (see Panel A of Figure 2). The transition towards e-commerce is in direct competition with conventional retail outlets. Accordingly, Rodrigue [29] claims that significant changes in the footprint of the retail sector have taken place, which is shifting from commercially accessible locations towards transportation-accessible locations. Firms source goods and services in complex, global supply chains [30].
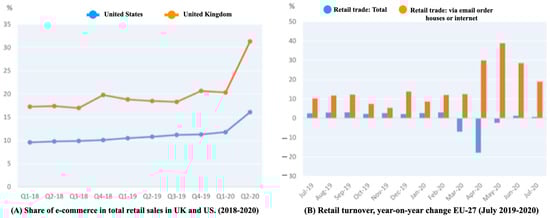
Figure 2.
The increasing of e-commerce in total retail during the COVID-19 pandemic [11]. Author’s own elaboration from OECD (2020).
Similar changes were also observed for the 27 European Union countries, where retail sales via mail order firms or the Internet in April 2020 increased by 30% compared with April 2019, while total retail sales diminished by 17.9% (see Panel B of Figure 2). Many authors have acknowledged how the advent of e-commerce has profoundly affected logistics in most industrialized nations [31,32]. Jiao [33] claims that a developing e-commerce market heavily depends on logistics for the successful execution of online transactions. Thanks to the increasing globalization of world trade, the logistics industry has been reshaped by burgeoning freight demand, expanded regional markets, and enhanced transportation connections [34]. Sometimes, we must rethink the policy imperative of improving accessibility, connectivity, and mobility [35,36], because the supplier is an important resource for managing product variety and complexity [37].
2.2. Airport Location: An Added Value to Airlines and Company Logistics
From a strategic point of view, the location of airports is essential in economic and intermodal accessibility, and in tourist and air cargo terms, to negotiate with airlines seeking to make the airport more internationally accessible [38]. The location of logistics companies and warehouses is highly dependent on the proximity of airports [39,40]. Logistics systems are the conveyor belts of the global system of trade, commerce, and production [41]. Airports need to share the potential market in their catchment area with an increasing number of other airports [42]. The larger catchment area of cargo airports relies on road feeder services for the ground leg, owing to the soaring importance of e-commerce and next-day delivery [43]. A comprehensive study undertaken by Azadian [44] demonstrated that larger airports tended to attract cargo traffic away from smaller airports in their proximity. For instance, the main hubs of FedEx and UPS are localized in Memphis and Louisville respectively, because these cities provide geographically good access to the rest of the US. Hall [45] notes that the central location relative to the US population was a key factor for FedEx and UPS managers when they decided to settle on these two cities.
A market economy could not function without the capacity of transportation to link supply and demand [46]. The airport’ location is used to analyze indicators such as the influence that local demand and weather have on the initial location decision of freight operators. Gardiner et al. [47] revealed that the location of an airport was the top-level factor that first attracts the attention of a freight operator, ‘being that one of the main motives why airport operators are constantly on the lookout for new niche markets, with the aim of increasing revenue’ [4]. A good relationship with management and interoperability in the improvement of air connectivity by airports and stakeholders provide added value for business and operability knowledge-sharing [48]. Airports are considered as particularly strategic because of the increasing importance of air transport in connecting territories [49]. On the contrary, the number of connections with other airports is not the best proxy to assess the relevance of an airport in the air cargo transport network [43,50]. However, airports need to act beyond their daily operations by collaborating with different stakeholders who are part of the airport ecosystem and thus influence it [51].
Other relevant indicators of overall air cargo volumes for most airports are the size and scope of the local origin–destination market. This is because freight operators choose airports that will yield more cargo to make better use of their fleet capacity [52,53], and local demand. In fact, air cargo transport is subject to unpredictable changes in expected demand, necessitating adjustments to itinerary planning to recover from such disruptions [47,54,55,56,57], and operational availability. For example, the weather record of an airport is very important for cargo operators, as shipments tend to be time-sensitive, with the carriers having to offer a reliable and efficient service, often at night. The unique feature of overnight air transportation is the requirement that all shipments be completed within a limited timeframe [12]. Moreover, the relevance of 24/7 operations for cargo activities [4,48,58,59] must be taken into account. Freight movements are an increasingly important determinant of warehouse and distribution space demand. In particular, the rising use of marine container terminals in the global movement of goods is a major contributor to demand in the US [60]. The importance of ports as critical nodes in global transport networks and supply chains has been researched in multiple disciplines [61,62].
Nevertheless, Larrodé et al. [59] found that the growth of air cargo logistics at airports was influenced by many factors like the presence of logistics operators inside and outside of airports, airports charges, and competition between cargo airlines. Another factor to consider is sales tax in the US. States with low sales taxes or small customer bases are especially attractive locations for e-retail logistics [63]. For instance, in the state of California, combined shipping and handling charges are generally taxable, while charges for electronic delivery are generally exempt [64], or the tax rate applied to user’s order will be the combined state and local rates of the address to which the user’s order is delivered, or from where it is fulfilled [65]. IATA and the International Civil Aviation Organization (ICAO) are concerned with the problems faced by international airlines in relation to taxation on income imposed by States in which they operate other than their own fiscal domicile [66]. Figure 3 shows the main factors in air cargo logistics according to the literature review, with the aim of increasing its attractiveness at cargo airports. Durach et al. [67] argue that the effectiveness of a review type depends on the prior state of theory, which ranges from nascent, to intermediate, to mature.
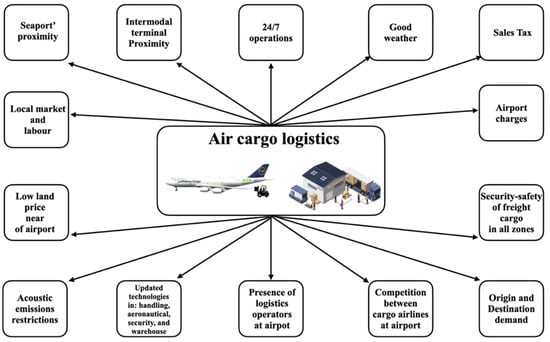
Figure 3.
The main factors in the growth of air cargo logistics. Source. Own elaboration.
Kang [68] examined the location choices of warehousing facilities in Los Angeles (US), and found that the most influential factors were local market, labour, the proximity of seaports, lower land price and airport charges, and intermodal terminal proximity. The location of warehouses, as part of supply chains, are strategically chosen based on productivity-enhancing location attributes [69,70]. The organization of modern economies is built upon an efficient transport system and the logistics sector plays an important role in time and distance terms in supply chains [71].
Distribution refers to the steps involved in the transportation and storage of goods, from supplier to customer in a supply chain [72,73]. A supply chain is a network of suppliers, manufacturers, warehouses, and retailers intended to minimize total cost and satisfy service level requirements by producing and distributing the right quantity of goods at the right time [74]. The performance of a supply chain deeply relies on the efficient management of logistics decisions and operations [75,76]. Based on a review of the previous literature, Figure 4 presents the e-commerce process from consumer to parcel delivery. The pandemic and the relevant precautionary measures to limit its spread had clear implications for the aviation, e-commerce, and logistics sectors. For example, manufacturing industries show a preference for all-cargo carriers [44].
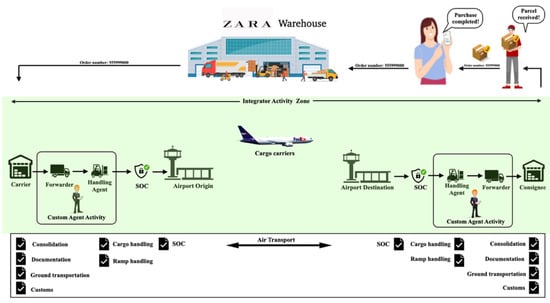
Figure 4.
E-commerce process from consumer to parcel delivery. Source: Author’s own elaboration.
Regarding safety and security at airports, the security and safety departments of airports are designing strategic cybersecurity plans and implementing Security Operations Centres (SOC) to guarantee all the air and land operations of their airports, and the safety of all passengers [77]. Moreover, Florido-Benítez [77] detected an interoperability deficit between public and private organizations. Cybersecurity protocols facilitate the internationalization of large companies. Among the many decisions involved in internationalization of companies, one of the first is the choice of airport location. ‘Managing international operations is a critical component of many firms’ strategy nowadays’ [78]. In order to optimize air cargo connectivity, supporting operations are needed like e-freight implementation, airport facilitation, airline activities, and ramp operations, as well as the enhanced optimal use of airport and airline operations [79]. Airports, trucking, rail, and supporting logistics facilities contribute to improving a country’s logistics systems [80].
2.3. Cargo Airline Connectivity Improves E-Commerce Companies’ Dispatch Services
Improved air connectivity is a significant component of economic growth and development through air cargo transport [79], as the goal is to achieve a distributional hierarchy of facilities to access consumer markets. Indeed, Boonekamp and Burghouwt [81] claim that a few studies have addressed connectivity in air freight networks. The air cargo industry consists of time-sensitive air express couriers and time-insensitive airlines. Federal Express, UPS, and DHL are the top three global air express delivery couriers [55]. The airline’s core physical products are in-flight products, the customer service infrastructure in the airport, and the destinations in a route network, and these cannot be digitized [82]. The relationship between sector distance and unit costs is one of the fundamental rules of airline economics [12]. One of the key strengths of air cargo carriers is the transport of perishable products around the world, in distance-time terms [13,83,84]. Synchronizing and optimizing cargo traffic flows during the planned period on the airline network is vital for cargo carriers to make a profit [85]. Full-service carriers tend to localize in airport hubs, to distinguish their brand image by providing more connectivity and frequency, and premium in-flight services [86].
High frequencies provide airlines with greater flexibility in planning schedules, thereby enabling them to increase aircraft and crew utilization [12]. A shipper is concerned that the shipment arrives at destination within the expected time [87]. For instance, procurement and fulfilment requires multiple steps, so Amazon’s e-commerce platform has the capability to offer goods as a function of stochastic demand [29]. According to Jindal et al. [88], delivering on a ‘promised’ date is as effective as, if not better than, quicker delivery. Moreover, these authors showed that, in the omnichannel battle between Amazon and Walmart in the US, the home delivery of online orders placed at Amazon.com seemed to be preferred by customers, who placed high importance on assortment, price, convenience, freshness, and quality validation of products and services, as well as on purchase experience, customer service, and product delivery. As stated by Suwanwong et al. [79], the aviation sector needs to improve competitiveness and to provide customers with enriched shipping quality and service, and better predictability.
In the NetScan connectivity model of air freight, the most relevant network characteristics of a single connection are frequency, transport time, and connecting time, all of which are brought together into a single indicator: the connectivity index. This indicator expresses the connectivity of an airport (see Figure 5) and to what extent an airport connects the local market to the rest of the world, directly or indirectly, as well as the extent to which different world regions are connected via hub connectivity [81,89]. In this study, we added subsidiary connectivity as a new factor to improve organizations (e.g., forwarders, integrators, cargo airlines, airports, online companies, amongst many others) in their operational processes, business performance, customer experience, and safety and security. For example, Brussels airport (BRU) in Belgium has launched a new consultancy subsidiary, Airport Intelligence, to share its operational and commercial expertise with other companies globally [90], or the international connectivity enlargement and infrastructures of regional airports, with the aim of ensuring sufficient capacity to meet the expected growth of air freight by local and regional territories.
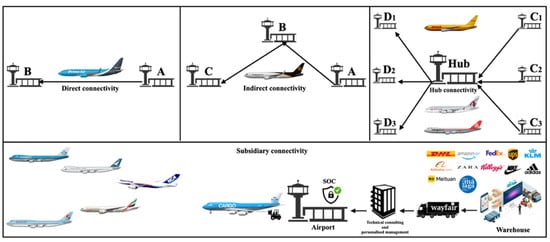
Figure 5.
The choice of Cargo airport connectivity category by freight forwarders and online companies. Source: Author’s own elaboration.
3. Methods
3.1. Data Collection
This research focuses on the role of the top 50 US cargo airports and air cargo airlines, and how they interact with the logistics and e-commerce sectors. This study uses direct content analysis to identify and analyse airports’ and cargo airlines’ impact on e-commerce companies, with the aim of improving operational strategies for those who would like to manage airports, cargo airlines, and e-commerce logistics in a more efficient and effective way. In the literature review, this study has shown some factors that may increase the competitive advantage of airports to host e-commerce operations. In addition, this research suggests that the improvement of air connectivity is a relevant factor of e-commerce growth and development through air cargo transportation. From a strategic point of view, the methodology of this research tries to analyse the commercial relationship amongst actors involved in the air cargo, logistics, and e-commerce sectors, to get a better global vision of their operability, and recognize the importance of these sectors for their country’s socio-economic development, and for consumers.
When airports and airlines operators share their information, it is good for the aviation industry. Tracking differences and fluctuations in data helps the industry recognize what drives changes in their management processes and business activities. Wong et al. [91] claim that collaboration and resources orchestration can be more effective when process integration and information systems are in place to facilitate the exchange of information (knowledge) and tracking of activity performance. The benchmarking of airports has gained considerable interest in both the academic literature and within the practitioner community [92]. The 50 US airports selected for this research were chosen from a database provided by the Federal Aviation Administration (FAA). We collected US airport data from 2000 to 2020 because data from 2021 was not available. Indeed, we decided to rely on the most recent and best dataset available. Data were collected on the basis of four criteria:
- Airport category: Airports were selected according to their categories. US law categorizes airports by type of activities, including commercial service, primary, cargo service, reliever, and general aviation [93]. Table 1 shows the category of the top 50 US cargo airports selected in this study. Airport categorizations offer a basis to derive representative scenarios for air-traffic-related simulation purposes [94] and competitive advantage that are related to passenger and cargo activities like spatial and facility factors [95,96]. Kazda et al. [97] suggest a five-parameter classification: geography of the airport, size/capacity of the airport, airport territory, connectivity, ownership, and participation in an airport network. The choice of an airport for freight forwarders depends on the type of air freight: local cargo, gateway cargo, or hub cargo. Local cargo includes shipments to or from the local market, whereas gateway cargo is shipments transported to the respective airport from another area by other modes of transport. Hub cargo is transshipped air-to-air cargo [98]. Moreover, the overall proportion of total freight tons carried by 50 airports (2000–2020) is shown in Table 2, and Figure 6 displays the evolution of total freight tons carried in % by 50 airports.
 Table 1. Airport category.
Table 2. Top 50 US cargo airports and cargo airline operations (2000–2020).
Table 1. Airport category.
Table 2. Top 50 US cargo airports and cargo airline operations (2000–2020).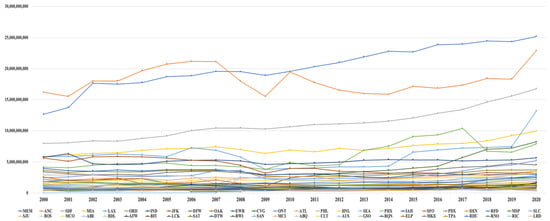 Figure 6. Freight tons carried (million) by 50 airports from 2000 to 2020. Source: Author’s own elaboration from FAA [108]. Lehigh Valley International (ABE) airport, data not available from 2000 to 2007.
 - Airport location: The proximity of the airport to distribution facilities and smaller airports at a distance from major metropolitan areas are part of vertical integration between airports and cargo airlines. In Figure 1 the location map of 50 US airports is shown. Mueller and Aravazhi [99] found that the geographical location of an airport was a driver of an airport’s connectivity. Highly accessible airports are more competitive [96]. Table 2 displays the location of the top 50 US cargo airports by state, with each airport category according to FAA, and cargo airlines that operate at the 50 airports selected for this study. Specifically, we show characteristics linked to airport location and total freight of major tenants in landed weight terms from 2000 to 2020. The latest available data was extracted from the FAA, which represented a bonanza period when the aviation industry reported positive operating profits for the first time since the effects of the 2008 recession.
- Top 25 cargo airlines: The data showed in the cargo and freight traffic ranking were collected from the IATA, FAA, and US Department of Transportation [100]. These are shown in Table 3. These data present the total scheduled traffic (domestic + international), excluding no scheduled or charter traffic that did not have pre-established schedules according to the IATA [101]. The US air cargo industry is among the most developed air cargo industries in the world [102], meaning it heavily influences the growth in or reduction of global air cargo [103]. Some cargo airlines are opening new markets and routes to new hubs and cities [104,105]. We focused on the top 25 air cargo airlines because they operate in the 50 US airports analysed in this research, and these are part of the value chain of US airports.
Table 3. Top 25 cargo airlines worldwide from 2020 to 2014 (Scheduled Cargo Tonne Km ‘CTK’ terms, and International + Domestic flight), and Year-on-Year (YoY).
- Other data relevant to the study: E-commerce retail in the US, UK, and EU-27, global air cargo, global goods growth, air cargo rates and revenues, the main cargo airlines operating in the US, US air cargo revenue, the global increase in cargo demand, amongst many other data from the US and worldwide were included, drawn from the Bureau of Transportation Statistics, Aircargo News, FAA, IATA, the US Department of Transportation, Airport Technology, Bureau of Economic Advice, OECD, and United States Census Bureau organizations, with the aim of giving readers a global vision of the aviation industry and e-commerce sectors. As stated by Lam and Mckercher [106], having relevant and high-quality market information is critical in today’s competitive environment. In the air logistics industry, data are an important indicator to manage the operations of the company because these help with quick response operations [107].
3.2. Data Analysis
3.2.1. Airports and E-Commerce: A Long-Term Commercial Relationship
Data analysis involved data checks and the placing of each airport in a category. These were then analysed and quantified by freight tons carried. Table 1 provides the category of the 50 US cargo airports selected in this study, that is, the top 50 cargo airports in the US. Initially, 24 hub airports were categorized in this paper, followed by 13 medium airports, six small airports, and five no-hub airports. The Fort Worth Alliance airport (AFW) in the state of Texas is not categorized by FAA organizations. An airport may be both a commercial service and a cargo service airport.
Concerning the top 50 US cargo airports selected in this study, Table 2 and Figure 6 display how Memphis International airport (IATA code: MEM) is the most important US airport in terms of tons of cargo handled, with 424 million tons, and this increased by 3.4% in comparison with 2019, followed by Ted Stevens Anchorage airport (ANC) with 380 million tons, which increased by 25% compared with the previous year. These are followed by Louisville Muhammad Ali airport (SDF) with 232 million tons (7.4% year-on-Year), Miami International (MIA) with 152 million (7.5% YoY), Los Angeles International (LAX) with 128 million tons (76.5% YoY), Chicago O’Hare (ORD) with 121 million tons (20.4% YoY), and, in seventh place, Indianapolis International airport (IND) with 108 million tons (6.6%YoY). The rest of the hub, medium, small, and non-hub airports are below the 90 million ton level, but their localization and strategic operability are key to cargo airlines, online companies, and the synchronization and optimization of cargo traffic flows.
In 2020, according to the FAA [108,109], Guam International (GUM) airport had the highest growth in air cargo by percentage, with 407.2%. It is localized in Oceania, and it is on the largest island of the Mariana Islands and Micronesia. It is an organized, unincorporated territory of the US. In March 2020, United operated more than 4000 cargo-only flights, moving more than 130 m pounds of cargo. United Cargo helped to move 190,000 pounds of fresh produce to Guam for the US Department of Agriculture’s Coronavirus Farm Assistance Program. The airline worked with food-logistics specialist Commodity Forwarders Inc. to transport the produce from Los Angeles (LAX) to Guam (GUM) on United’s new cargo-only flight, a route added to meet cargo demand during the COVID-19 crisis [110]. The air cargo industry plays a significant role in creating a framework of bilateral agreement between regions’ or countries’ economies, and it contributes significantly to better productivity in the economy and the well-being of the population. In addition, as we saw earlier, Los Angeles International (LAX) airport ranked second with an increase of 76.5% on the previous year, followed by Ellington (EFD) airport with 64.82%, the Fort Worth Alliance (AFW) airport with 63.8%, and in fourth place was the Theodore Francis Green State (PVD) airport with 59.5%.
In the light of Table 2, it is clear that the interoperability between airports and cargo airlines operators enabled by the existence of a national and international network is essential for strategic and commercial positioning of cargo airlines and their main competitors. FedEx, UPS, DHL, or Amazon air cargo airlines are geographically and commercially well positioned in these 50 airports, and according to the strong potential in the industrial, commercial, and services sectors around airports, these sectors provide daily inputs, outputs, and specific services to cargo airlines and online companies. For instance, Amazon, UPS, and FedEx have their own fleets because these companies are focused on the end customer, thus eliminating the intermediation of other cargo companies.
Nevertheless, airports face numerous difficulties in capital planning because of instability and unpredictable demand. Some trends such as excess bellyhold capacity have depressed demand for dedicated cargo flights, whereas others, like the growth in e-commerce, are stimulating demand unevenly among airports [111]. Suwanwong et al. [79] indicate that the current problems and bottlenecks block the ability to perform well in air connectivity in Thailand, which has e-freight, ground handlers, and airline bottlenecks. The occurrence of short-shipped cargo causes delays in delivering cargo and increases waiting times that would reduce connectivity [112]. Moreover, we should add that warehousing jobs pay poorly, and many of them are temporary and unstable. Studies find that about 60% of warehouse workers employed at facilities in Southern California worked temporarily in a very tough working environment, often with no health benefits or guarantee of hours [113].
Indeed, each airport faces different challenges, owing to the heterogeneity of the cargo business such as international or national cargo, new business models, and airports focused on e-commerce and warehouse logistics. For example, the Lehigh Valley International ‘ABE’ airport is the Amazon Air operational base and is focused on the air cargo activity of this company. Moreover, Memphis International airport registered over 4 million metric tons in 2013, in this airport over 90% is air cargo domestic [114]. This pronounced emphasis of air cargo domestic is related to the geography of the American continent [115]. Therefore, Memphis will be affected differently by changes in the market environment from Hong Kong airport, which is highly dependent on international air cargo [116]. This might be one of the main reasons why Memphis International airport, with 15.4%, is the most important cargo airport in the US (see Table 2), followed by Ted Stevens Anchorage airport (ANC) with 13.8%, where the location strategic and operations are unique in this State, and it has an operational advantage over international air carriers as a supplement to its well-established geographical advantage [117]. In third place is Louisville Muhammad Ali airport (SDF) with 8.5%. We must remember that the main hubs of FedEx and UPS are localized in Memphis and Louisville respectively, because these cities provide geographically good access to the rest of the US, that is, these airports are mainly focused on domestic air cargo.
As concerns most of air cargo operations in Florida state, Miami International airport (MIA) with 5.5% is the air cargo hub for many major air cargo carriers and has a distinguished position in the nation as an air cargo import and export gateway [44], while Orlando International airport (MCO) with 0.8% is the second airport in domestic air cargo traffic in Florida. Los Angeles airport (LAX) with 4.7% is the hub cargo par excellence in California, which serves as a metro hub for FedEx Express. This is among three other important cargo airports: Hollywood Burbank (BUR), Long Beach (LGB) and John Wayne (SNA) in California state [118]. The rest of the airports contribute to improving the global air cargo transport network in the US, and where all actors are considered as a key piece of the stability of the domestic and international air transport systems. Conversely, Bombelli et al. [43] argue that assessing the relevance of an airport in the air cargo transport network must be conducted using overall cargo capacity.
Air cargo is employed for the mid- to long-distance transportation of urgent goods. Its selling position is speed and reliability. The air cargo market is served by three types of providers: all-cargo airlines, combination carriers, and integrators. The latter focus on the express market and provide door-to-door service including not only air transport but also truck deliveries [115]. Cargo airlines provide freight forwarders and shippers with services, including consultation, capacity booking, pickup, receiving, packaging, sorting, loading, transportation, dispatching, and cargo tracking and tracing. Air cargo service is classified into different levels according to the priority level, such as speed and reliability, required by the shipper [119]. With the aim of having a better global vision of main cargo carriers, Table 3 provides the top 25 freight carriers in the world from 2020 to 2014, which is dominated by FedEx with 12.3% in 2020. FedEx and UPS with 11.9% are the dominant companies in domestic air freight [120], followed by Qatar Airways with 5.5%. This company connects businesses to more than 60 dedicated cargo destinations from Doha [121], and the Gulf location is a pivotal point on the global aviation map, while its natural resources provide the necessary means to support the growth of air transportation [122].
Emirates SkyCargo with −20.6% in air cargo shows how the pandemic crisis impacted considerably on this company, owing to the high connection with international cargo around the world. This carrier provides the air accessibility network for Dubai (United Arab Emirates). Emirates began operations at Dallas/Fort Worth, Seattle, and Washington, D.C., and has a total of seven trade lanes in the US, which also include Houston, Los Angeles, New York, and San Francisco [123]. Cathay Pacific takes fifth place with −20.6% in the top 25 freight carriers, and the same consideration may be made for this company: it is the flag carrier of Hong Kong and provides the main air accessibility network for this destination. Again, we must point out that the remaining freight carriers are part of the air cargo networks of US airports, in which they provide good air connectivity in essential goods and services transactions through the e-commerce industry.
Moreover, as we can see in Table 3, DHL is one of the world’s leading logistics companies and it specializes in international freight [124], but is not in the top 25 freight carriers. However, DHL operates in around 220 countries and its main market is Asia. DHL acquired Air Express International in 2000, to enter the US market. Today, this alliance has helped it to gain a foothold in the US market [125].
The pandemic crisis has provoked a demand imbalance which occurred owing to changes in domestic and international cargo demand and in in cargo capacity. According to Shaban et al. [126], the airline faces the problem whereby its fixed capacity from one route cannot cover the sum of freight forwarders’ orders, named hot-selling routes, while the freight forwarders’ total orders from the substituting route are much less than its capacity, named underutilized routes.
3.2.2. Initial Impact of the Pandemic on Air Cargo and Airports
The importance of accessibility is dependent on activity category and situation, especially in air cargo airlines owing to the pandemic crisis and their dependence on the international market. According to the IATA [101], at the end of 2020, industry-wide cargo ton–kilometres (CTKs) had returned close to pre-crisis values. Nevertheless, the yearly decline in CTKs was still the largest since the global financial crisis in 2009, at a sizeable 9.1% year on year increased in 2020 (see Panel A of Figure 7). In 2020, the lack of cargo capacity compared with the resilient demand for goods, and the congestion at airports and other parts of the supply chains, combined with the need for rapid e-commerce shipments and transport of personal protective equipment (PPE), put significant pressures on air freight rates. Based on previously published research and the empirical research reported in this paper, it was found that there is a direct correlation between the use of e-commerce and improved customer service.
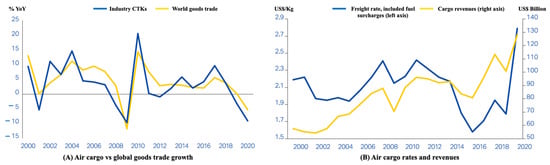
Figure 7.
The initial impact of the pandemic on air cargo, rates, and revenues from 2000 to 2020. Source: Author’s own elaboration from IATA [101].
Panel B of Figure 7 shows that the air freight rates increased dramatically during the peak of the supply chain disruption from March to May 2020 and moderated somewhat during the middle of the year, before climbing again during the peak cargo season in Q4. As a result, air freight rates were 55.9% higher overall in 2020 compared with 2019, at 2.79 $/kg. Combined with the relatively resilient outcome in air cargo volumes (down 9.1% year-on-year in 2020), this means revenues from transporting goods by air rose by 27.2% in 2020. At $128.2 bn, this is a new all-time high. We cannot forget that the cost of freight transportation is determined by two major factors: the distance inputs and outputs travel, and the cost per mile of transport [127]. Operators of airports, airlines, and organizations must adapt to new circumstances, be efficient, and plan the use of their resources according to demand. Airports facing insolvency are mainly regional airports, which serve and are integral to local communities. Many airlines have decided to close bases or relocate them, close and reduce routes, and lay off employees to adjust costs to current demand [128].
4. Discussion
Global Vision of Results Data on US Cargo Airports, Carriers, and E-Commerce Sales
This paper seeks to analyse the role of the top 50 US cargo airports and air cargo airlines in the logistics of e-commerce companies in one of the world’s largest economies, the US. The global financial crisis had a significant impact on consumer spending and as a result, on demand in air cargo markets. International trade with the US remains a significant concern for many foreign trading partners [13]. Surprisingly, air cargo in US airports has continued to grow, despite the 9/11 terrorist attacks, the financial crisis of 2007, and the great US recession in 2011 (see Figure 8). Although the World Health Organization (WHO) declared the coronavirus a global pandemic on 11 March 2020, the air cargo sector is recovering step by step towards the air freight levels seen before the pandemic. This continued growth is closely linked to the growth of retail e-commerce industry in the past 10 years (see Figure 9 and Figure 10), thanks to new advances in technological devices, which facilitate the purchase of products and services by users in e-commerce companies.

Figure 8.
Average of evolution of freight tons carried in % by 50 airports (2000–2020). Source: Author’s own elaboration from FAA [108]. Note: WHO declared the coronavirus a global pandemic on March 11 2020.
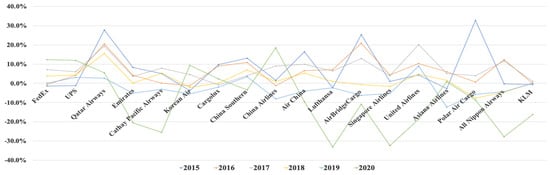
Figure 9.
Evolution of total percentage freight tons carried by 16 cargo airlines (2015–2020). Source: Author’s own elaboration from IATA [101]. Note: This graph shows only air cargo airlines with completed data from 2015 to 2020 (Silk Way West Airlines, Ethiopian Airlines, EVA Air, Aerologic, Kalitta Air, Atlas Air, and Turkish Airlines were excluded).
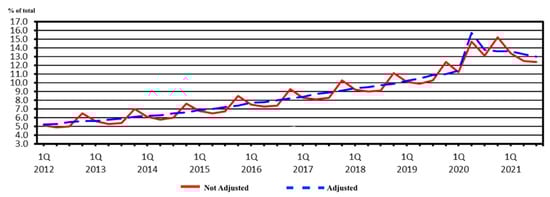
Figure 10.
Quarterly retail e-commerce sales in US from 2012 to 3rd quarter 2021. Source: US Department of Commerce [129]. Note: Statement regarding COVID-19 impact: The Census Bureau continues to monitor response and data quality and has determined that estimates in this release meet publication standards.
However, the US Department of Commerce [129] reported that total retail sales for the third quarter of 2021 were estimated at $1,5 billion, a decrease of 1.1% (±0.2%) from the second quarter of 2021. The e-commerce estimate for the third quarter of 2021 increased by 6.6% (±0.9%) over the third quarter of 2020, while total retail sales increased 13.1% (±0.7%) in the same period. E-commerce sales in the third quarter of 2021 accounted for 13% of total sales in the US. An interesting study carried out by Florido-Benítez [130] demonstrated that air freight in the largest airports in the British Isles endured well during the pandemic and the Brexit crisis, especially Heathrow and East Midlands airports.
As stated by Islam et al. [131], during the COVID-19 pandemic, perceived arousal has a significant positive relationship with impulsive and obsessive buying. The risks of going outside, COVID-19 outbreaks among employees of local retail stores, and health professionals’ recommendations to stay at home led to impulsive buying behavior [132]. Hylton and Ross [111] suggest that that e-retail may reconfigure distribution networks and boost cargo volume at some airports, opening up opportunities to gain market share for airports that are new to e-retail.
Moreover, such growth between airports and e-commerce does not come of its own accord. Air cargo carriers have been fundamental in the internationalization of airports and online companies. Van Asch et al. [8] argue that e-commerce has become a real game-changer in the air cargo industry and is forecast to be the main growth driver in future years. Figure 10 shows the evolution of total freight tons carried by 16 cargo airlines in percentage terms. The omnipresent FedEx carrier had a sustained growth in the past five years, despite the pandemic crisis. FedEx took the decision in 2019 to not renew its US domestic contract with Amazon, in order to focus on serving the broader e-commerce market [133].
After FedEx, UPS is the second largest air cargo carrier in the world, followed by Qatar Airways. These three companies are crowned as the best integrated carriers in the world. The rest of the carriers have an evolution of ups and down as far as air cargo transport is concerned over the past five years. The unique selling propositions of air transport are speed and reliability [115], which includes goods such as pharmaceuticals, electronics, perishables, urgent shipments, valuables, and e-commerce [134]. Four global carriers (DHL, TNT, FedEx, and UPS) operate in this market, which is characterized by low switching barriers thereby facilitating customer defections [135]. Nevertheless, if air cargo operators want to exploit their competitive advantages against their main competitors, they need to optimize the flow of inputs on a just-in-time basis to meet demand in time and costs terms. The efficiency of operations, loading time, and lowering costs by airport operators in air cargo loading are key factors in the cost–benefit analysis and traffic forecasting of air cargo operators.
Figure 11 shows how a good geographical location of airport, and a stable interaction zone between an airport and cargo market, provide a global input/output connectivity for goods and services, operational efficiency, and personalized operations by airports, forwarders, and integrators through air cargo airlines. As regards air cargo carriers, they provide speed and reliability of services to online companies and users in shopping and returns terms, as well as optimized synchronization of traffic flows, frequency of flights, and order settlement to online companies and users. This figure displays the role of airports and air cargo airlines in the logistics of e-commerce companies. It is a fact that recent operations through e-commerce have highlighted the interaction between demand and supply during COVID-19, and how e-commerce is one of the growth drivers of the present air cargo industry and is expected to stay an important market. The results show that e-commerce companies are highly dependent on the quality and efficiency of air cargo airlines and airports, with the aim of providing a good shipping service for their products.
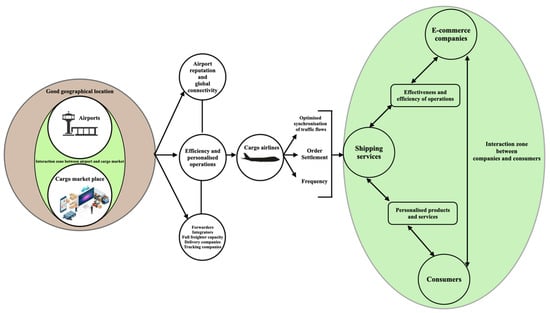
Figure 11.
Overall research model. Source: Author’s own elaboration.  Shopping and returns by companies or consumers.
Shopping and returns by companies or consumers.
5. Conclusions
In this study, 50 US cargo airports, air cargo carriers, and the logistics and e-commerce sectors have been presented and analyzed from a complex theory perspective and examining the interactive context between them, from which we can obtain plenty of information on our major findings and these are critically discussed as follows.
Initially, this paper provides a consolidated airport, air cargo, and e-commerce relationship, especially in the pandemic period. Airports and air cargo carriers are identified as the most relevant partners in the e-commerce industry. This is owing to the e-commerce sector whose users demand speed and reliability in the interaction between the demand and supply of products and services. We can forget that the e-commerce industry provides large revenues to airports and carriers, and that this sector has not stopped growing in the past 10 years. After an extensive literature review, several indicators were identified as driving factors of e-commerce at an airport. These factors were a good geographical location of the airport, a cargo market close to the airport, international connectivity, efficiency of operations, personalized services by airports and carriers, optimized synchronization of traffic flows, and frequencies of flights by air cargo carriers. Airport operators and air cargo airlines are developing new co-operative approaches to service provision in the e-commerce market. Airport operators need to diversify their business models [136,137].
The trend of e-commerce companies is outsourcing personalized services through air cargo carriers and airports worldwide to provide a better service for their customers and reducing shipping costs. Moreover, this study revealed that air cargo in US airports has continued to grow despite the COVID-19 pandemic, and the air cargo sector is recovering step by step to the air freight levels seen before the pandemic. Therefore, the findings of this research confirm previous studies on the commercial relationship between airports, air cargo carriers, and e-commerce sectors. In fact, we claim that the competitiveness of cargo airports within the air freight market depends on a wide variety of factors, as we have seen during this research. Now, in the 21st century, we combine physical media with interactive media and the objective is to attract our target customers and satisfy their wants and needs [48].
Finally, this study may be useful for airports and airline operators, online company managers, and stakeholders. The pandemic has changed the way in which organizations operate, and it is likely to create new demands for companies and the aviation and e-commerce industries. These two sectors are highly dependent on their commercial interaction relationship, because they provide products and services of primary necessity such as food, pharmaceuticals, electronics, perishables, and urgent shipments. We should be aware that recovery will not be immediate or result in an instant return to the record 2019 figures. The most logical goal would be to return to a level comparable to an average of the years leading up to the COVID-19 pandemic.
6. Theoretical and Practical Implications
In this study, we have analyzed previous studies that use diverse methodological approaches to airports, air cargo carriers, and warehouse logistics sectors. The paper contributes to the aviation and logistics literature in several areas. First, this research demonstrates a way to analyze an airport category based on air carriers, online companies’ interests and location, and the air cargo market in a specific region, firmly grounded in empirical data, to lay out products and services customized by airports and carriers. Second, the study reveals that the proximity of warehouse logistics adds value to airports and air cargo carriers, which can help aviation literature reviews in future studies. Third, this study employed up-to-date studies and data, spatial analysis, and airport locations to deal with the data in the most comprehensive way. The findings of this study can help practitioners and researchers to understand new joint commercial strategies by airports, air cargo airlines, and online companies. According to the IATA [138], the Omicron variant may also encourage consumers stuck at home to buy more goods, as was the case during previous lockdowns.
Apart from the above rich theoretical contributions, this research has fruitful practical implications for aviation and e-commerce managers. Based on the results of research, this study encourages the improvement of commercial alliances between online companies and air cargo carriers, with the aim of improving the quality of shipping and personalized services, distribution channels, efficiency of distribution, logistics distribution information optimization, and the development of futures alliances in the logistics industry. Kumar and Petersen [25] revealed that internet and e-commerce allowed the complete integration of all business elements including suppliers, customer service networks, and manufacturing units. Onstein et al. [139] indicated that the design of a spatial distribution structure was of strategic importance for companies, in order to meet required customer service levels and to keep logistics costs as low as possible. Airports’ products and services should be customized depending on business environments and location contexts [140]. Many executives are developing supply-chain partnerships to reduce costs, improve service, and gain competitive advantage [141].
7. Limitations and Future Research
A major limitation of the present study is that large online companies and airports have not provided important data to help to this study, such as up-to-date data regarding air cargo operations and air cargo carriers’ activities, which air cargo carriers are preferred by online companies, and the reasons for this. Moreover, another limitation of this study is that it used only the FAA database, whereas future research could focus on different countries, airports, and air cargo carriers, especially in the Asia and Pacific region where the relationship between airports and e-commerce has not reached its maximum potential. While a very few giants (e.g., FedEx, UPS, and DHL) dominate express logistics in Western countries, the burgeoning Asian express market has literally thousands of providers [142]. Therefore, we hope that future studies will note the appropriate metrics to measure and evaluate the main performance indicators of the logistics and air freight industries, to improve the quality and efficiency of air cargo airlines and airports.
Funding
This research received no external funding.
Data Availability Statement
Not applicable.
Conflicts of Interest
The author declares no conflict of interest.
References
- Florido-Benítez, L. How Málaga’s airport contributes to promote the establishment of companies in its hinterland and improves the local economy. Int. J. Tour. Cities 2021, 8, 393–411. [Google Scholar] [CrossRef]
- Florido-Benítez, L. Málaga Costa del Sol airport and its new conceptualization of hinterland. Tour. Crit. Pract. Theory 2021, 2, 195–221. [Google Scholar] [CrossRef]
- Zhang, A.; Hui, G.W.; Leung, L.C.; Cheung, W.; Van Hui, Y. Air Cargo in Mainland China and Hong Kong; Routledge: London, UK, 2004. [Google Scholar] [CrossRef]
- Merkert, R.; Van de Voorde, E.; de Wit, J. Making or breaking-Key success factors in the air cargo market. J. Air Transp. Manag. 2017, 61, 1–5. [Google Scholar] [CrossRef]
- Li, T. A SWOT analysis of China’s air cargo sector in the context of COVID-19 pandemic. J. Air Transp. Manag. 2020, 88, 101875. [Google Scholar] [CrossRef] [PubMed]
- Atayah, O.F.; Dhiaf, M.M.; Najaf, K.; Frederico, G.F. Impact of COVID-19 on financial performance of logistics firms: Evidence from G-20 countries. J. Glob. Oper. Strat. Source 2021, 15, 172–196. [Google Scholar] [CrossRef]
- IATA. An Opportunity for Transformation. 2021. Available online: https://www.iata.org/contentassets/d22340c37e0c4cfd8fc05ca6ebf6cc9f/ecom-article-covid.pdf (accessed on 22 October 2022).
- Van Asch, T.; Dewulf, W.; Kupfer, F.; Cárdenas, I.; Van de Voorde, E. Cross-border e-commerce logistics—Strategic success factors for airports. Res. Transp. Econ. 2019, 79, 100761. [Google Scholar] [CrossRef]
- Leung, L.; Cheung, W.; Van Hai, Y. A framework for a logistics e-commerce community network: The Hong Kong air cargo industry. IEEE Trans. Syst. Man Cybern.-Part A Syst. Hum. 2000, 30, 446–455. [Google Scholar] [CrossRef]
- Wu, P.; Yang, C. Unstructured big data analytics for air cargo logistics management. Proceedings of 2018 IEEE International Conference on Service Operations and Logistics, and Informatics (SOLI), Singapore, 31 July–2 August 2018; pp. 274–278. [Google Scholar] [CrossRef]
- OECD. E-Commerce in the Time of COVID-19. 2020. Available online: https://www.oecd.org/coronavirus/policy-responses/e-commerce-in-the-time-of-covid-19-3a2b78e8/ (accessed on 17 August 2022).
- Doganis, R. Flying off Course: Airline Economics and Marketing; Routledge: London, UK, 2019. [Google Scholar]
- Alexander, D.; Merkert, R. Applications of gravity models to evaluate and forecast US international air freight markets post-GFC. Transp. Policy 2020, 104, 52–62. [Google Scholar] [CrossRef]
- Gössling, S. Risks, resilience, and pathways to sustainable aviation: A COVID-19 perspective. J. Air Transp. Manag. 2020, 89, 101933. [Google Scholar] [CrossRef]
- Leinbach, T.R.; Capineri, C. Globalized Freight Transport: Intermodality, E-Commerce, Logistics and Sustainability; Edward Elgar: Cheltenham, UK, 2007. [Google Scholar]
- Burritt, R.L.; Schaltegger, S. Measuring the (un-)sustainability of industrial biomass production and use. Sustain. Account. Manag. Policy J. 2012, 3, 109–133. [Google Scholar] [CrossRef]
- Florido-Benítez, L. New Marketing Strategy: Mobile Applications as a Marketing Tool in Airports. In Chapter of Book: Handbook of Research on Applied AI for International Business and Marketing Applications; IGI GLOBAL Publisher of Timely Knowledge: London, UK, 2021; pp. 14–29. [Google Scholar]
- Baltazar, M.E.; Silva, J.; Vaz, M.; Allee, V.; Marques, T. Interrelationships among Airports and the Hinterland Players. A Value Network Analysis Approach. In Proceedings of the 52nd Congress of the European Regional Science Association: ‘Regions in Motion Breaking the Path’, Bratislava, Slovakia, 21–25 August 2012. [Google Scholar]
- Sheard, N. Airport Size and Urban Growth. Economica 2019, 86, 300–335. [Google Scholar] [CrossRef]
- Chen, X.; Xuan, C.; Qiu, R. Understanding spatial spillover effects of airports on economic development: New evidence from China’s hub airports. Transp. Res. Part A Policy Pract. 2020, 143, 48–60. [Google Scholar] [CrossRef]
- Hussain, A.; Shahzad, A.; Hassan, R.; Doski, S.A.M. COVID-19 impact on B2B e-commerce: A multi-group analysis of sports and surgical SME’s. Pakis. J. Commer. Soc. Sci. 2021, 15, 166–195. [Google Scholar]
- Ma, S.; Li, G.; Liu, M. Procurement competition in the presence of IoT-enabled B2B E-commerce. Electron. Commer. Res. Appl. 2021, 49, 101091. [Google Scholar] [CrossRef]
- Adams, F.G.; Graham, K.W. Integration, knowledge creation and B2B governance: The role of resource hierarchies in financial performance. Ind. Mark. Manag. 2017, 63, 179–191. [Google Scholar] [CrossRef]
- Florido-Benítez, L. International mobile marketing: A satisfactory concept for companies and users in times of pandemic. Benchmark. Int. J. 2021, 29, 1826–1856. [Google Scholar] [CrossRef]
- Kumar, S.; Petersen, P. Impact of e-commerce in lowering operational costs and raising customer satisfaction. J. Manuf. Technol. Manag. 2006, 17, 283–302. [Google Scholar] [CrossRef]
- Gössling, S. ICT and transport behavior: A conceptual review. Int. J. Sustain. Transp. 2018, 12, 153–164. [Google Scholar] [CrossRef]
- Bureau of Economic Advice. The 2019 Annual Update of the National Income and Product Accounts. 2019. Available online: https://apps.bea.gov/scb/2019/08-august/0819-nipa-update.htm (accessed on 22 October 2022).
- United States Census Bureau. Open Skies Agreements Currently Being Applied. 2019. Available online: https://www.transportation.gov/policy/aviation-policy/open-skies-agreements-being-applied (accessed on 1 October 2022).
- Rodrigue, J.-P. The distribution network of Amazon and the footprint of freight digitalization. J. Transp. Geogr. 2020, 88, 102825. [Google Scholar] [CrossRef]
- Wiedmer, R.; Griffis, S.E. Structural characteristics of complex supply chain networks. J. Bus. Logist. 2021, 42, 264–290. [Google Scholar] [CrossRef]
- Giuffrida, M.; Mangiaracina, R.; Perego, A.; Tumino, A. Cross-border B2C e-commerce to Greater China and the role of logistics: A literature review. Int. J. Phys. Distrib. Logist. Manag. 2017, 47, 772–795. [Google Scholar] [CrossRef]
- Choy, K.L.T.; Gunasekaran, A.; Lam, H.Y.; Chow, K.H.; Tsim, Y.C.; Ng, T.W.; Tse, Y.K.; Lu, X.A. Impact of information technology on the performance of logistics industry: The case of Hong Kong and Pearl Delta region. J. Oper. Res. Soc. 2014, 65, 904–916. [Google Scholar] [CrossRef]
- Jiao, Z. Modes and Development Characteristics of China’s Cross-Border E-Commerce Logistics. In Contemporary Logistics in China: Proliferation and Internationalisation; Liu, B., Wang, L., Lee, S., Liu, J., Qin, F., Jiao, Z., Eds.; Springer: Berlin, Germany, 2015; pp. 211–232. [Google Scholar]
- Yang, C.; Chen, M.; Yuan, Q. The geography of freight-related accidents in the era of E-commerce: Evidence from the Los Angeles metropolitan area. J. Transp. Geogr. 2021, 92, 102989. [Google Scholar] [CrossRef]
- Axhausen, K.W. Activity Spaces, Biographies, Social Networks and their Welfare Gains and Externalities: Some Hypotheses and Empirical Results. Mobilities 2007, 2, 15–36. [Google Scholar] [CrossRef]
- Batty, M.; Axhausen, K.W.; Giannotti, F.; Pozdnoukhov, A.; Bazzani, A.; Wachowicz, M.; Ouzounis, G.; Portugali, Y. Smart cities of the future. Eur. Phys. J. Spéc. Top. 2012, 214, 481–518. [Google Scholar] [CrossRef]
- Enz, M.G.; Schwieterman, M.A.; Lambert, D.M. Stock keeping unit rationalization: A cross-functional, cross-firm perspective. Int. J. Logist. Manag. 2019, 30, 994–1015. [Google Scholar] [CrossRef]
- Pacagnella, A.C.; Hollaender, P.S.; Mazzanati, G.V.; Bortoletto, W.W. Efficiency drivers of international airports: A worldwide benchmarking study. J. Air Transp. Manag. 2020, 90, 101960. [Google Scholar] [CrossRef]
- Gingerich, K.; Maoh, H. The role of airport proximity on warehouse location and associated truck trips: Evidence from Toronto, Ontario. J. Transp. Geogr. 2018, 74, 97–109. [Google Scholar] [CrossRef]
- Shang, X.; Yang, K.; Wang, W.; Wang, W.; Zhang, H.; Celic, S. Stochastic Hierarchical Multimodal Hub Location Problem for Cargo Delivery Systems: Formulation and Algorithm. IEEE Access 2020, 8, 55076–55090. [Google Scholar] [CrossRef]
- Hesse, M. Logistics: Situating flows in a spatial context. Geogr. Compass 2020, 14, e12492. [Google Scholar] [CrossRef]
- Lieshout, R.; Malighetti, P.; Redondi, R.; Burghouwt, G. The competitive landscape of air transport in Europe. J. Transp. Geogr. 2016, 50, 68–82. [Google Scholar] [CrossRef]
- Bombelli, A.; Santos, B.F.; Tavasszy, L. Analysis of the air cargo transport network using a complex network theory perspective. Transp. Res. Part E Logist. Transp. Rev. 2020, 138, 101959. [Google Scholar] [CrossRef]
- Azadian, F. Assessing the effect of urban socioeconomic factors and the financial crisis of 2008 on domestic air cargo traffic in Florida. Transportation 2018, 47, 223–241. [Google Scholar] [CrossRef]
- Hall, R. Alternative Access and Locations for Air Cargo; Department of Industrial and Systems Engineering, University of Southern California: Los Angeles, CA, USA, 2002. [Google Scholar]
- Rodrigue, J.-P. The Geography of Transport Systems; Routledge: New York, NY, USA, 2020. [Google Scholar]
- Gardiner, J.; Humphreys, I.; Ison, S. Freighter operators’ choice of airport: A three?stage process. Transp. Rev. 2005, 25, 85–102. [Google Scholar] [CrossRef]
- Florido-Benitez, L. Seville airport: A success of good relationship management and interoperability in the improvement of air connectivity. J. Tur. Est. Pract. 2020, 5, 1–30. [Google Scholar]
- Percoco, M. Airport Activity and Local Development: Evidence from Italy. Urban Stud. 2010, 47, 2427–2443. [Google Scholar] [CrossRef]
- Bombelli, A. Integrators’ global networks: A topology analysis with insights into the effect of the COVID-19 pandemic. J. Transp. Geogr. 2020, 87, 102815. [Google Scholar] [CrossRef]
- Puls, R.; Wittmer, A. Managing Airports. In Aviation Systems. Classroom Companion: Business; Wittmer, A., Bieger, T., Müller, R., Eds.; Springer: Cham, Switzerland, 2021. [Google Scholar] [CrossRef]
- Zhang, A.; Zhang, Y. Issues on liberalization of air cargo services in international aviation. J. Air Transp. Manag. 2002, 8, 275–287. [Google Scholar] [CrossRef]
- Adenigbo, J.A. Factors influencing cargo agents choice of operations in Abuja airport, Nigeria. J. Air Transp. Manag. 2016, 55, 113–119. [Google Scholar] [CrossRef]
- Delgado, F.; Mora, J. A matheuristic approach to the air-cargo recovery problem under demand disruption. J. Air Transp. Manag. 2020, 90, 101939. [Google Scholar] [CrossRef]
- Lin, C.-C.; Chen, Y.-C. The integration of Taiwanese and Chinese air networks for direct air cargo services. Transp. Res. Part A Policy Pract. 2003, 37, 629–647. [Google Scholar] [CrossRef]
- Delgado, F.; Sirhan, C.; Katscher, M.; Larrain, H. Recovering from demand disruptions on an air cargo network. J. Air Transp. Manag. 2020, 85, 101799. [Google Scholar] [CrossRef]
- Lee, H.; Choi, Y.; Yang, F.; Debbarma, J. The governance of airports in the sustainable local economic development. Sustain. Cities Soc. 2021, 74, 103235. [Google Scholar] [CrossRef]
- Kupfer, F.; Kessels, R.; Goos, P.; Van de Voorde, E.; Verhetsel, A. The origin–destination airport choice for all-cargo aircraft operations in Europe. Transp. Res. Part E Logist. Transp. Rev. 2016, 87, 53–74. [Google Scholar] [CrossRef]
- Larrodé, E.; Muerza, V.; Villagrasa, V. Analysis model to quantify potential factors in the growth of air cargo logistics in airports. Transp. Res. Procedia 2018, 33, 339–346. [Google Scholar] [CrossRef]
- McGowan, M. The Impact of Shifting Container Cargo Flows on Regional Demand for U.S. Warehouse Space. J. Real Estate Portf. Manag. 2005, 11, 167–185. [Google Scholar] [CrossRef]
- Ducruet, C. The geography of maritime networks: A critical review. J. Transp. Geogr. 2020, 88, 102824. [Google Scholar] [CrossRef]
- Guerrero, D.; Letrouit, L.; Pais-Montes, C. The container transport system during COVID-19: An analysis through the prism of complex networks. Transp. Policy 2022, 115, 113–125. [Google Scholar] [CrossRef]
- Keogh, B. E-Retail Faces Patchwork of State Sales-Tax Laws. The Wall Street Journal. 2014. Available online: http://www.yettertax.com/review/wp-content/uploads/2014/05/E-Retail-Faces-Patchwork-of-State-Sales-Tax-Laws-Wall-Street-Journal.pdf (accessed on 13 August 2022).
- Cole, G. How to Handle Sales Tax on Shipping: A State-by-State Guide. 2020. Available online: https://www.avalara.com/blog/en/north-america/2018/11/how-to-handle-sales-tax-on-shipping-a-state-by-state-guide.html (accessed on 2 December 2022).
- Amazon.com About US State Sales and Use Taxes. 2022. Available online: https://www.amazon.com/gp/help/customer (accessed on 27 October 2022).
- IATA. Guidelines for Taxation of International Air Transport Profits. 2015. Available online: https://www.iata.org/contentassets/a72d8d3cfaf84529bcdef6b2dc59f224/taxation_intl_air_transport20profits_final.pdf (accessed on 3 October 2022).
- Durach, C.F.; Kembro, J.H.; Wieland, A. How to advance theory through literature reviews in logistics and supply chain management. Int. J. Phys. Distrib. Logist. Manag. 2021, 51, 1090–1107. [Google Scholar] [CrossRef]
- Kang, S. Warehouse location choice: A case study in Los Angeles, CA. J. Transp. Geogr. 2018, 88, 102297. [Google Scholar] [CrossRef]
- Sivitanidou, R. Warehouse and Distribution Facilities and Community Attributes: An Empirical Study. Environ. Plan. A Econ. Space 1996, 28, 1261–1278. [Google Scholar] [CrossRef]
- Yuan, Q. Location of Warehouses and Environmental Justice. J. Plan. Educ. Res. 2018, 41, 282–293. [Google Scholar] [CrossRef]
- Holl, A.; Mariotti, I. The Geography of Logistics Firm Location: The Role of Accessibility. Netw. Spat. Econ. 2017, 18, 337–361. [Google Scholar] [CrossRef]
- Chopra, S. Designing the distribution network in a supply chain. Transp. Res. Part E Logist. Transp. Rev. 2003, 39, 123–140. [Google Scholar] [CrossRef]
- Esmizadeh, Y.; Parast, M.M. Logistics and supply chain network designs: Incorporating competitive priorities and disruption risk management perspectives. Int. J. Logist. Res. Appl. 2020, 24, 174–197. [Google Scholar] [CrossRef]
- Simchi-Levi, D.; Kaminsky, P.; Simchi-Levi., E. Designing and Managing the Supply Chain: Concepts, Strategies, and Case Studies, 3rd ed.; McGraw-Hill/Irwin: Boston, MA, USA, 2008. [Google Scholar]
- Lai, K.-H.; Ngai, E.; Cheng, T. An empirical study of supply chain performance in transport logistics. Int. J. Prod. Econ. 2004, 87, 321–331. [Google Scholar] [CrossRef]
- Wang, G.; Gunasekaran, A.; Ngai, E.W.T.; Papadopoulos, T. Big data analytics in logistics and supply chain management: Certain investigations for research and applications. Int. J. Prod. Econ. 2016, 176, 98–110. [Google Scholar] [CrossRef]
- Florido-Benítez, L. Identifying cybersecurity risks in Spanish airports. Cyber Secur. 2021, 4, 267–291. [Google Scholar]
- Jiménez, A.; Herrero, Á. Selecting Features that Drive Internationalization of Spanish Firms. Cybern. Syst. 2019, 50, 25–39. [Google Scholar] [CrossRef]
- Suwanwong, T.; Sopadang, A.; Hanaoka, S.; Rodbundith, T. Evaluation of air cargo connectivity and policy in Thailand. Transp. Policy 2018, 72, 24–33. [Google Scholar] [CrossRef]
- Cui, J.; Dodson, J.; Hall, P.V. Planning for Urban Freight Transport: An Overview. Trans. Ver. Inter. J. Pro. Res. 2015, 58, 7565–7592. [Google Scholar] [CrossRef]
- Boonekamp, T.; Burghouwt, G. Measuring connectivity in the air freight industry. J. Air Transp. Manag. 2017, 61, 81–94. [Google Scholar] [CrossRef]
- Hanke, M. Airline E-Commerce: Log On. Take Off, 1st ed.; Routledge: London, UK, 2016. [Google Scholar]
- Merkert, R.; Alexander, D. The Air Cargo Industry. In The Routledge Companion to Air Transport Management; Routledge: Oxon, UK, 2018; pp. 29–47. [Google Scholar]
- IATA. Perishables. 2021b. Available online: https://www.iata.org/en/programs/cargo/perishables/ (accessed on 3 September 2022).
- Voitsehovskiy, V.; Grygorak, M.; Lytvynenko, S.; Gabrielova, T.; Lytvynenko, L. Designing Integrated Cargo Delivery Systems on Logistics Principles. In Safety in Aviation and Space Technologies; Springer: Cham, Switzerland, 2022; pp. 73–82. [Google Scholar] [CrossRef]
- Maung, Y.S.Y.; Douglas, I.; Tan, D. Identifying the drivers of profitable airline growth. Transp. Policy 2021, 115, 275–285. [Google Scholar] [CrossRef]
- Ohashi, H.; Kim, T.-S.; Oum, T.H.; Yu, C. Choice of air cargo transshipment airport: An application to air cargo traffic to/from Northeast Asia. J. Air Transp. Manag. 2005, 11, 149–159. [Google Scholar] [CrossRef]
- Jindal, R.P.; Gauri, D.K.; Li, W.; Ma, Y. Omnichannel battle between Amazon and Walmart: Is the focus on delivery the best strategy? J. Bus. Res. 2020, 122, 270–280. [Google Scholar] [CrossRef]
- Burghouwt, G.; Redondi, R. Connectivity in air transport networks: An assessment of models and applications. J. Transp. Econ. Policy 2013, 41, 35–53. [Google Scholar]
- Airport Technology. Brussels Airport Launches New Subsidiary to Organize Consultancy Services. 2021. Available online: https://www.airport-technology.com/news/brussels-airport-consultancy-services/ (accessed on 27 October 2022).
- Wong, C.Y.; Wong, C.W.; Boon-itt, S. Integrating environmental management into supply chains: A systematic literature review and theoretical framework. Int. J. Phys. Dis. Log. Manag. 2015, 45, 43–68. [Google Scholar] [CrossRef]
- Merkert, R.; Odeck, J.; Brathen, S.; Pagliari, R. A Review of Different Benchmarking Methods in the Context of Regional Airports. Transp. Rev. 2012, 32, 379–395. [Google Scholar] [CrossRef]
- FAA. Airport Categories. 2021. Available online: https://www.faa.gov/airports/planning_capacity/categories (accessed on 2 September 2022).
- Öttl, G.; Böck, P. An Approach to Airport Categorization—Category Definition and Quantification for Air Traffic Related Simulation Purpose. J. Aerosp. Oper. 2011, 1, 155–170. [Google Scholar] [CrossRef]
- Park, Y. An analysis for the competitive strength of Asian major airports. J. Air Transp. Manag. 2003, 9, 353–360. [Google Scholar] [CrossRef]
- Bao, D.; Hua, S.; Gu, J. Relevance of airport accessibility and airport competition. J. Air Transp. Manag. 2016, 55, 52–60. [Google Scholar] [CrossRef]
- Kazda, A.; Turiak, M.; Gotz, K. Airport typology for LCC policy changes: A European perspective. Aeronautic 2020, 24, 90–98. [Google Scholar] [CrossRef]
- Zhang, A. Analysis of an international air-cargo hub: The case of Hong Kong. J. Air Transp. Manag. 2003, 9, 123–138. [Google Scholar] [CrossRef]
- Mueller, F.; Aravazhi, A. A new generalized travel cost based connectivity metric applied to Scandinavian airports. Transp. Res. Part D Transp. Environ. 2020, 81, 102280. [Google Scholar] [CrossRef]
- US Department of Transportation. Department of Transportation Resources. 2021. Available online: https://www.transportation.gov/infrastructure (accessed on 30 November 2022).
- IATA. WATS+ World Air Transport Statistics 2021. 2021. Available online: https://www.iata.org/contentassets/a686ff624550453e8bf0c9b3f7f0ab26/wats-2021-mediakit.pdf (accessed on 23 October 2022).
- Aircargo News. United Cargo: Making Friends and Taking a Cautious Approach. 2021. Available online: https://www.aircargonews.net/airlines/united-cargo-making-friends-and-taking-a-cautious-approach/ (accessed on 1 December 2022).
- Jain, T.; Menon, V.; Nease, D.; Robins, C.; Sattary, K. An Analysis of COVID-19′s Impact on U.S. Aviation. NASA.GOV. 2020. Available online: https://ntrs.nasa.gov/api/citations/20205011851/downloads/NASA-CR-20205011851.pdf (accessed on 27 September 2022).
- Bureau of Transportation Statistics (2021), “Air Cargo Summary Data”. Available online: https://www.transtats.bts.gov/freight.asp?20=E (accessed on 1 December 2021).
- Hotle, S.; Mumbower, S. The impact of COVID-19 on domestic U.S. air travel operations and commercial airport service. Transp. Res. Interdiscip. Perspect. 2020, 9, 100277. [Google Scholar] [CrossRef]
- Lam, C.; McKercher, B. The tourism data gap: The utility of official tourism information for the hospitality and tourism industry. Tour. Manag. Perspect. 2013, 6, 82–94. [Google Scholar] [CrossRef]
- Choi, T.-M.; Zhang, J.; Cheng, T.C.E. Quick Response in Supply Chains with Stochastically Risk Sensitive Retailers. Decis. Sci. 2017, 49, 932–957. [Google Scholar] [CrossRef]
- FAA. Passenger Boarding (Enplanement) and All-Cargo Data for U.S. Airports. 2021. Available online: https://www.faa.gov/airports/planning_capacity/passenger_allcargo_stats/passenger/ (accessed on 30 September 2022).
- FAA. Passenger Boarding (Enplanement) and All-Cargo Data for U.S. Airports Airports in 2020. 2021. Available online: https://www.faa.gov (accessed on 6 December 2022).
- Aircargo News. United Cargo Ships Food Aid Flight to Guam. 2020. Available online: https://www.aircargonews.net/airlines/united-cargo-in-food-aid-flight-to-guam/ (accessed on 1 December 2022).
- Hylton, P.; Ross, C.L. Air Cargo Forecasting in an Age of Electronic Retail. Transp. Res. Rec. J. Transp. Res. Board 2018, 2672, 48–58. [Google Scholar] [CrossRef]
- Van Asch, T.; Dewulf, W.; Kupfer, F.; Meersman, H.; Onghena, E.; Van De Voorde, E. Air Cargo and Airport Competitiveness. J. Air Transp. Stud. 2019, 10, 48–75. [Google Scholar] [CrossRef]
- Kirkham, C. Inland Empire Sees Surge in Warehouse Jobs, but Many Are Low-Pay, Temporary. Los Angeles Times. 2015. Available online: http://www.latimes.com/business/la-fi-inland-empire-warehouses-20150419-story.html (accessed on 3 December 2022).
- ACI. ACI Annual World Airport Traffic Report Airports Council International, Montreal. 2014. Available online: https://aci.aero (accessed on 1 August 2022).
- Lange, A. Does cargo matter? The impact of air cargo operations on departure on-time performance for combination carriers. Transp. Res. Part A Policy Pract. 2018, 119, 214–223. [Google Scholar] [CrossRef]
- Mayer, R. Airport classification based on cargo characteristics. J. Transp. Geogr. 2016, 54, 53–65. [Google Scholar] [CrossRef]
- Prokop, D. The logistics of air cargo co-mingling at Ted Stevens Anchorage International Airport. J. Air Transp. Manag. 2002, 8, 109–114. [Google Scholar] [CrossRef]
- Lakew, P.A.; Tok, Y.C.A. Determinants of air cargo traffic in California. Transp. Res. Part A Policy Pract. 2015, 80, 134–150. [Google Scholar] [CrossRef]
- Feng, B.; Li, Y.; Shen, Z.-J.M. Air cargo operations: Literature review and comparison with practices. Transp. Res. Part C Emerg. Technol. 2015, 56, 263–280. [Google Scholar] [CrossRef]
- Pagano, A.M. Factors and Trends Affecting the Parcel Delivery Industry. J. Transp. Res. Forum 2001, 40, 123–132. [Google Scholar]
- Pratap, J. Qatar Airways Cargo Posts Revenue Growth of 34.4% in Fiscal 2018. Gulf Times Business. 2018. Available online: https://m.gulf-times.com/content/pdf/Business/Business2018_9_19388684.PDF (accessed on 1 October 2022).
- Petcu, C. The Role of Qatar Airways in the Economic Development of Qatar: Before and During the Gulf Crisis. In The 2017 Gulf Crisis. Gulf Studies; Zweiri, M., Rahman, M.M., Kamal, A., Eds.; Springer: Singapore, 2021. [Google Scholar] [CrossRef]
- Stratton, S. Emirates’ Growing. 2012. Available online: http://www3.alpa.org/portals/alpa/magazine/2012/Dec2012_Emirates.pdf (accessed on 1 December 2022).
- De Giovanni, P. Digitalization, Quality, and Supply Chain Cooperation. In Dynamic Quality Models and Games in Digital Supply Chains; Springer: Cham, Switzerland, 2021. [Google Scholar] [CrossRef]
- Dhir, S.D.H.L. Flexible Systems Management. In Cases in Strategic Management; Springer: Singapore, 2019. [Google Scholar] [CrossRef]
- Shaban, I.A.; Chan, F.T.S.; Chong, S.H. A mixed wholesale-option-contract to fix the demand imbalance between substitutable air cargo routes: A cooperative game approach. Exp. Syst. Appl. 2021, 182, 115300. [Google Scholar] [CrossRef]
- O’Sullivan, A. Urban Economics, 9th ed.; McGraw Hill Education: New York, NY, USA, 2019. [Google Scholar]
- Florido-Benítez, L. The effects of COVID-19 on Andalusian tourism and aviation sector. Tour. Rev. 2021, 76, 829–857. [Google Scholar] [CrossRef]
- US Department of Commerce Quarterly Retail E-Commerce Sales 3rd Quarter 2021. Available online: https://www.census.gov/retail/mrts/www/data/pdf/ec_current.pdf (accessed on 2 December 2022).
- Florido-Benítez, L. COVID-19 and BREXIT crisis: British Isles must not kill the goose that lays the golden egg of tourism. Gran Tour 2022, 6, 61–100. [Google Scholar]
- Islam, T.; Pitafi, A.H.; Aryaa, V.; Wang, Y.; Akhtar, N.; Mubarik, S.; Xiaobei, L. Panic buying in the COVID-19 pandemic: A multi-country examination. J. Retail. Consum. Serv. 2020, 59, 102357. [Google Scholar] [CrossRef]
- Naeem, M. Understanding the customer psychology of impulse buying during COVID-19 pandemic: Implications for retailers. Int. J. Retail. Distrib. Manag. 2020, 49, 377–393. [Google Scholar] [CrossRef]
- Grover, D. Top 25 Cargo Airlines: FedEx Retains the Top Spot as Qatar Gains. 2020. Available online: https://cargonewswire.com/top-25-cargo-airlines-fedex-retains-the-top-spot-as-qatar-gains/ (accessed on 30 November 2022).
- Alkaabi, K.A.; Debbage, K.G. The geography of air freight: Connections to U.S. metropolitan economies. J. Transp. Geogr. 2011, 19, 1517–1529. [Google Scholar] [CrossRef]
- Tsai, M.C.; Merkert, R.; Wang, J.F. What drives freight transportation customer loyalty? Diverging marketing approaches for the air freight express industry. Transportation 2021, 48, 1503–1521. [Google Scholar] [CrossRef]
- Florido-Benítez, L. The impact of tourism promotion in tourist destinations: A bibliometric study. Int. J. Tour. Cities 2022, 8, 844–882. [Google Scholar] [CrossRef]
- Florido-Benítez, L. The Safety-Hygiene Air Corridor between UK and Spain Will Coexist with COVID-19. Logistics 2022, 6, 52. [Google Scholar] [CrossRef]
- IATA. Uptick in New Export Orders Supports Continued Air Cargo Strength. 2021. Available online: https://www.iata.org/en/iata-repository/publications/economic-reports/uptick-in-new-export-orders-supports-continued-air-cargo-strength/ (accessed on 23 December 2022).
- Onstein, A.T.C.; Ektesaby, M.; Rezaei, J.; Tavasszy, L.A.; van Damme, D.A. Importance of factors driving firms’ decisions on spatial distribution structures. Int. J. Logist. Res. Appl. 2019, 23, 24–43. [Google Scholar] [CrossRef]
- Florido-Benítez, L. THE WORLD AIRPORT AWARDS AS A QUALITY DISTINCTIVE AND MARKETING TOOL FOR AIRPORTS. J. Airl. Oper. Aviat. Manag. 2022, 1, 54–81. [Google Scholar] [CrossRef]
- Lambert, D.M.; Emmelhainz, M.A.; Gardner, J.T. Developing and Implementing Supply Chain Partnerships. Int. J. Logist. Manag. 1996, 7, 1–18. [Google Scholar] [CrossRef]
- Chen, H. A message to Asian SCM and logistics scholars from IJPDLM. Int. J. Phys. Distrib. Logist. Manag. 2015, 45, 1. [Google Scholar] [CrossRef]


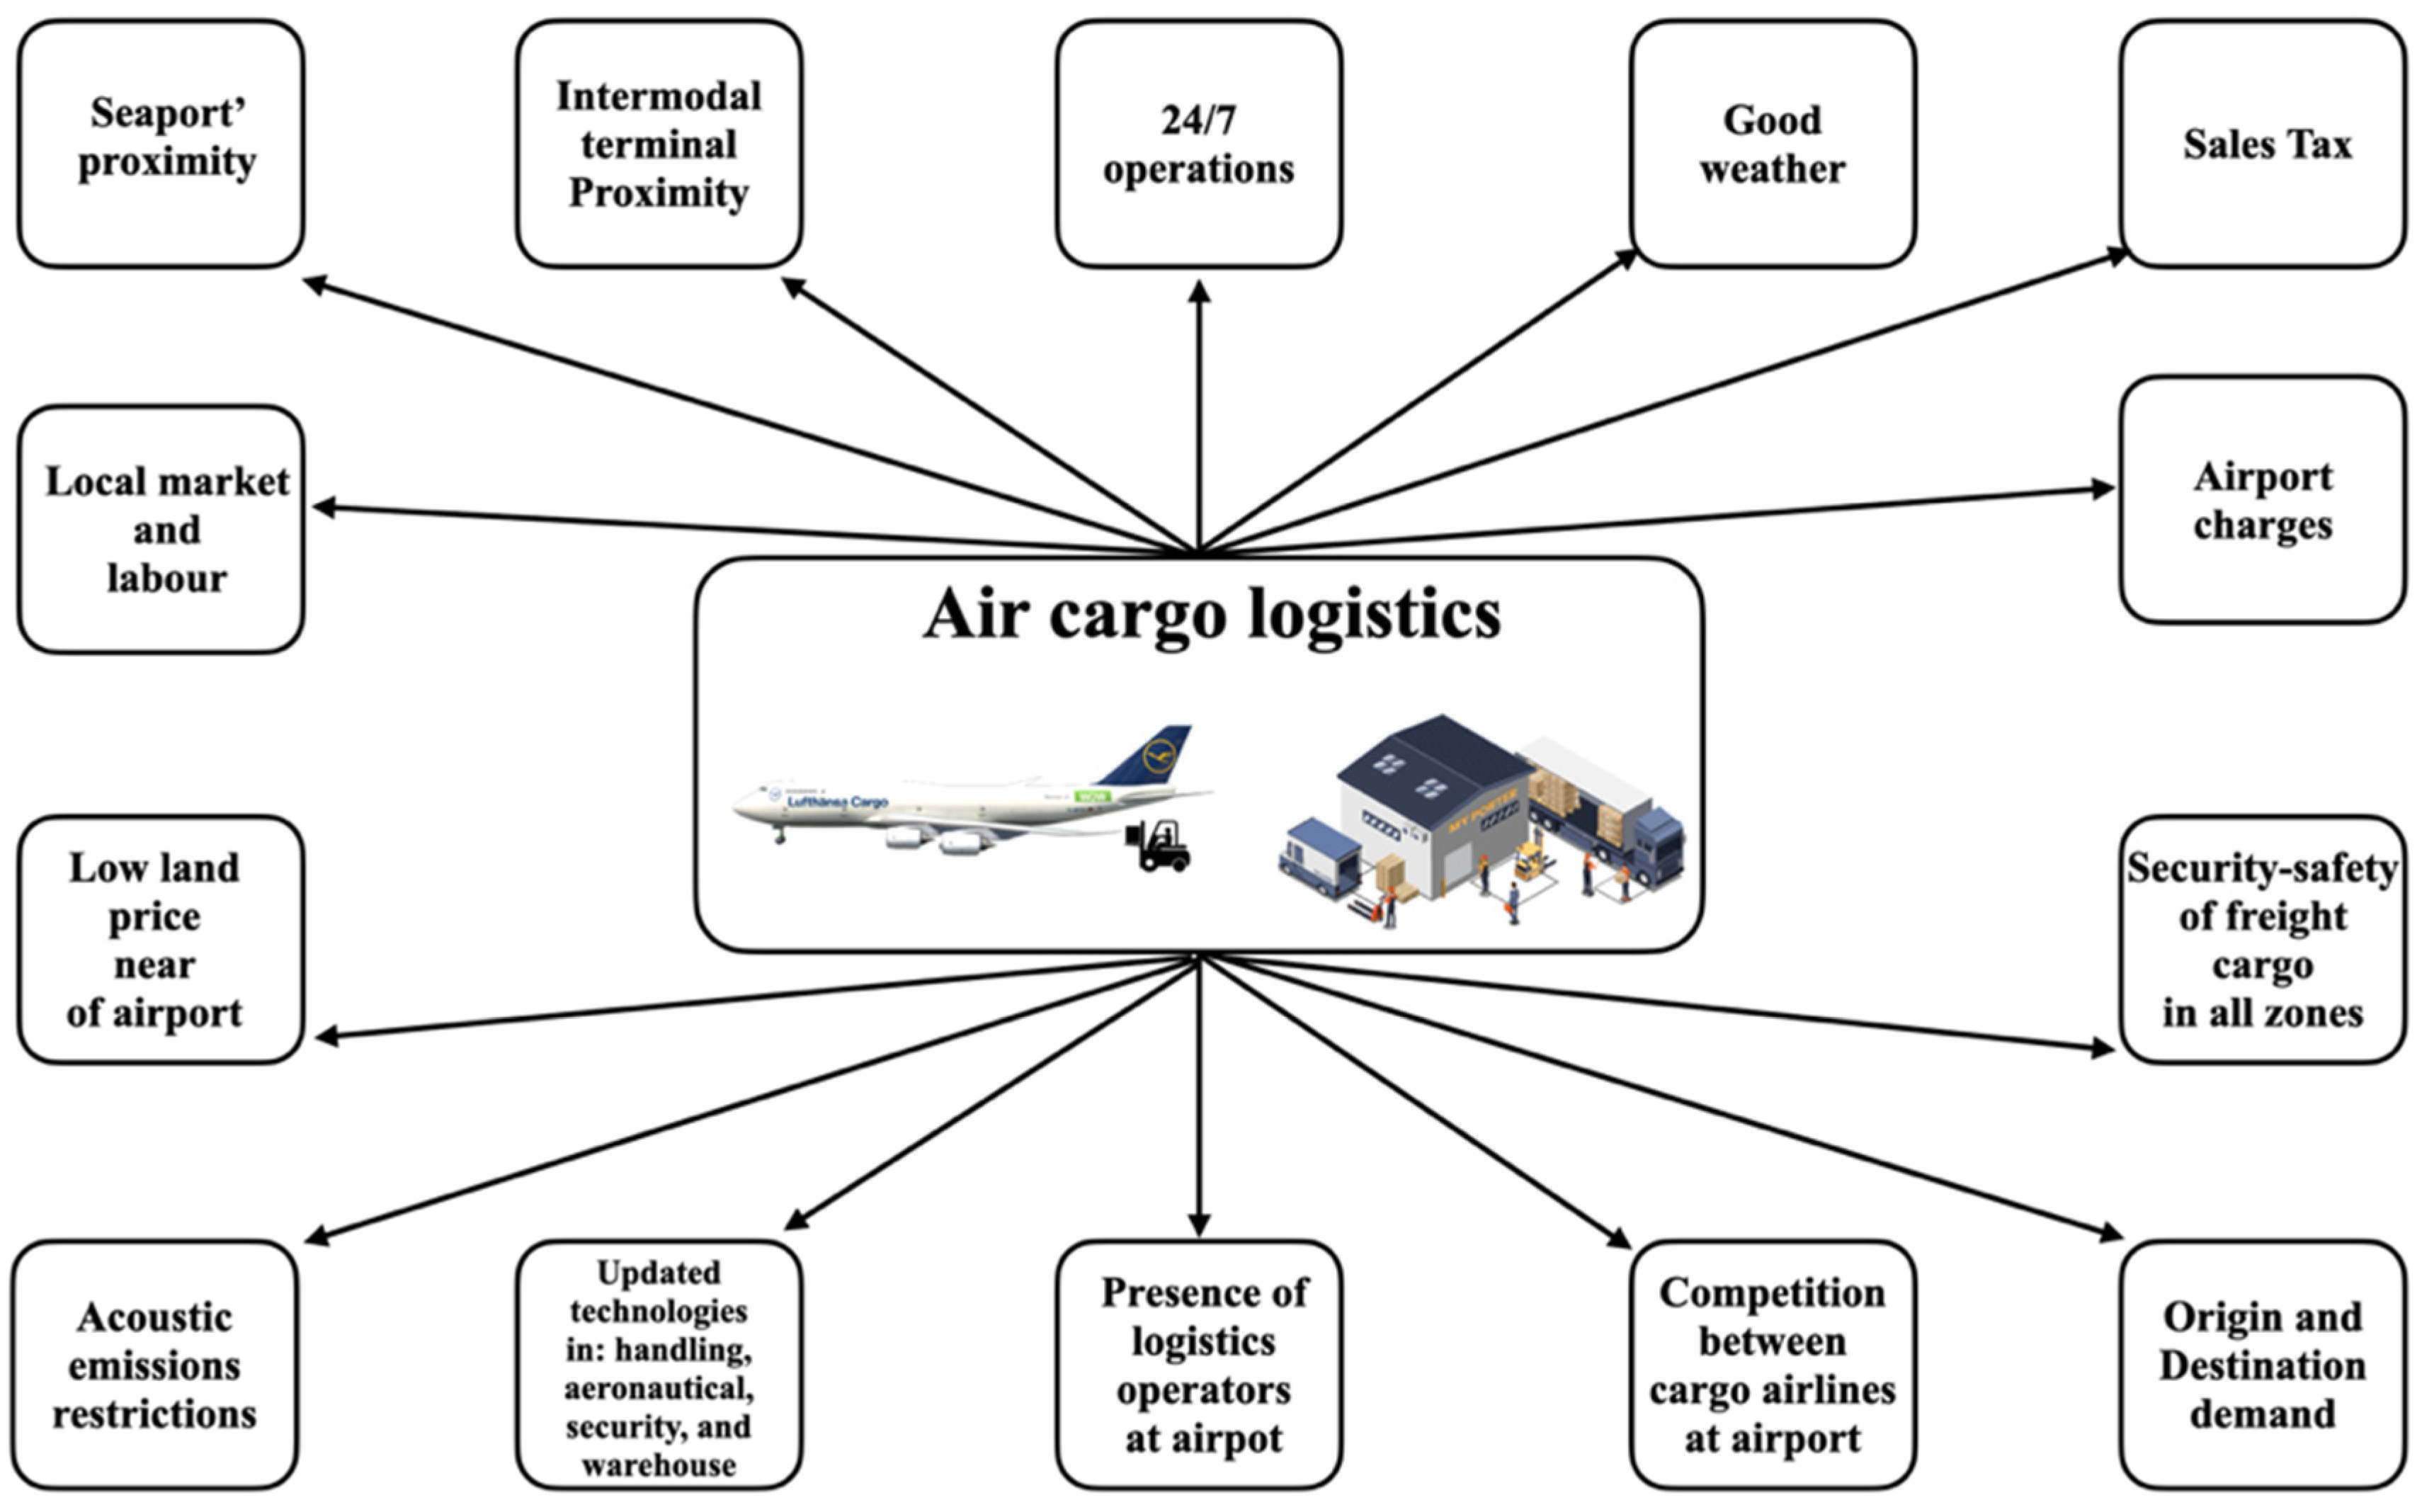
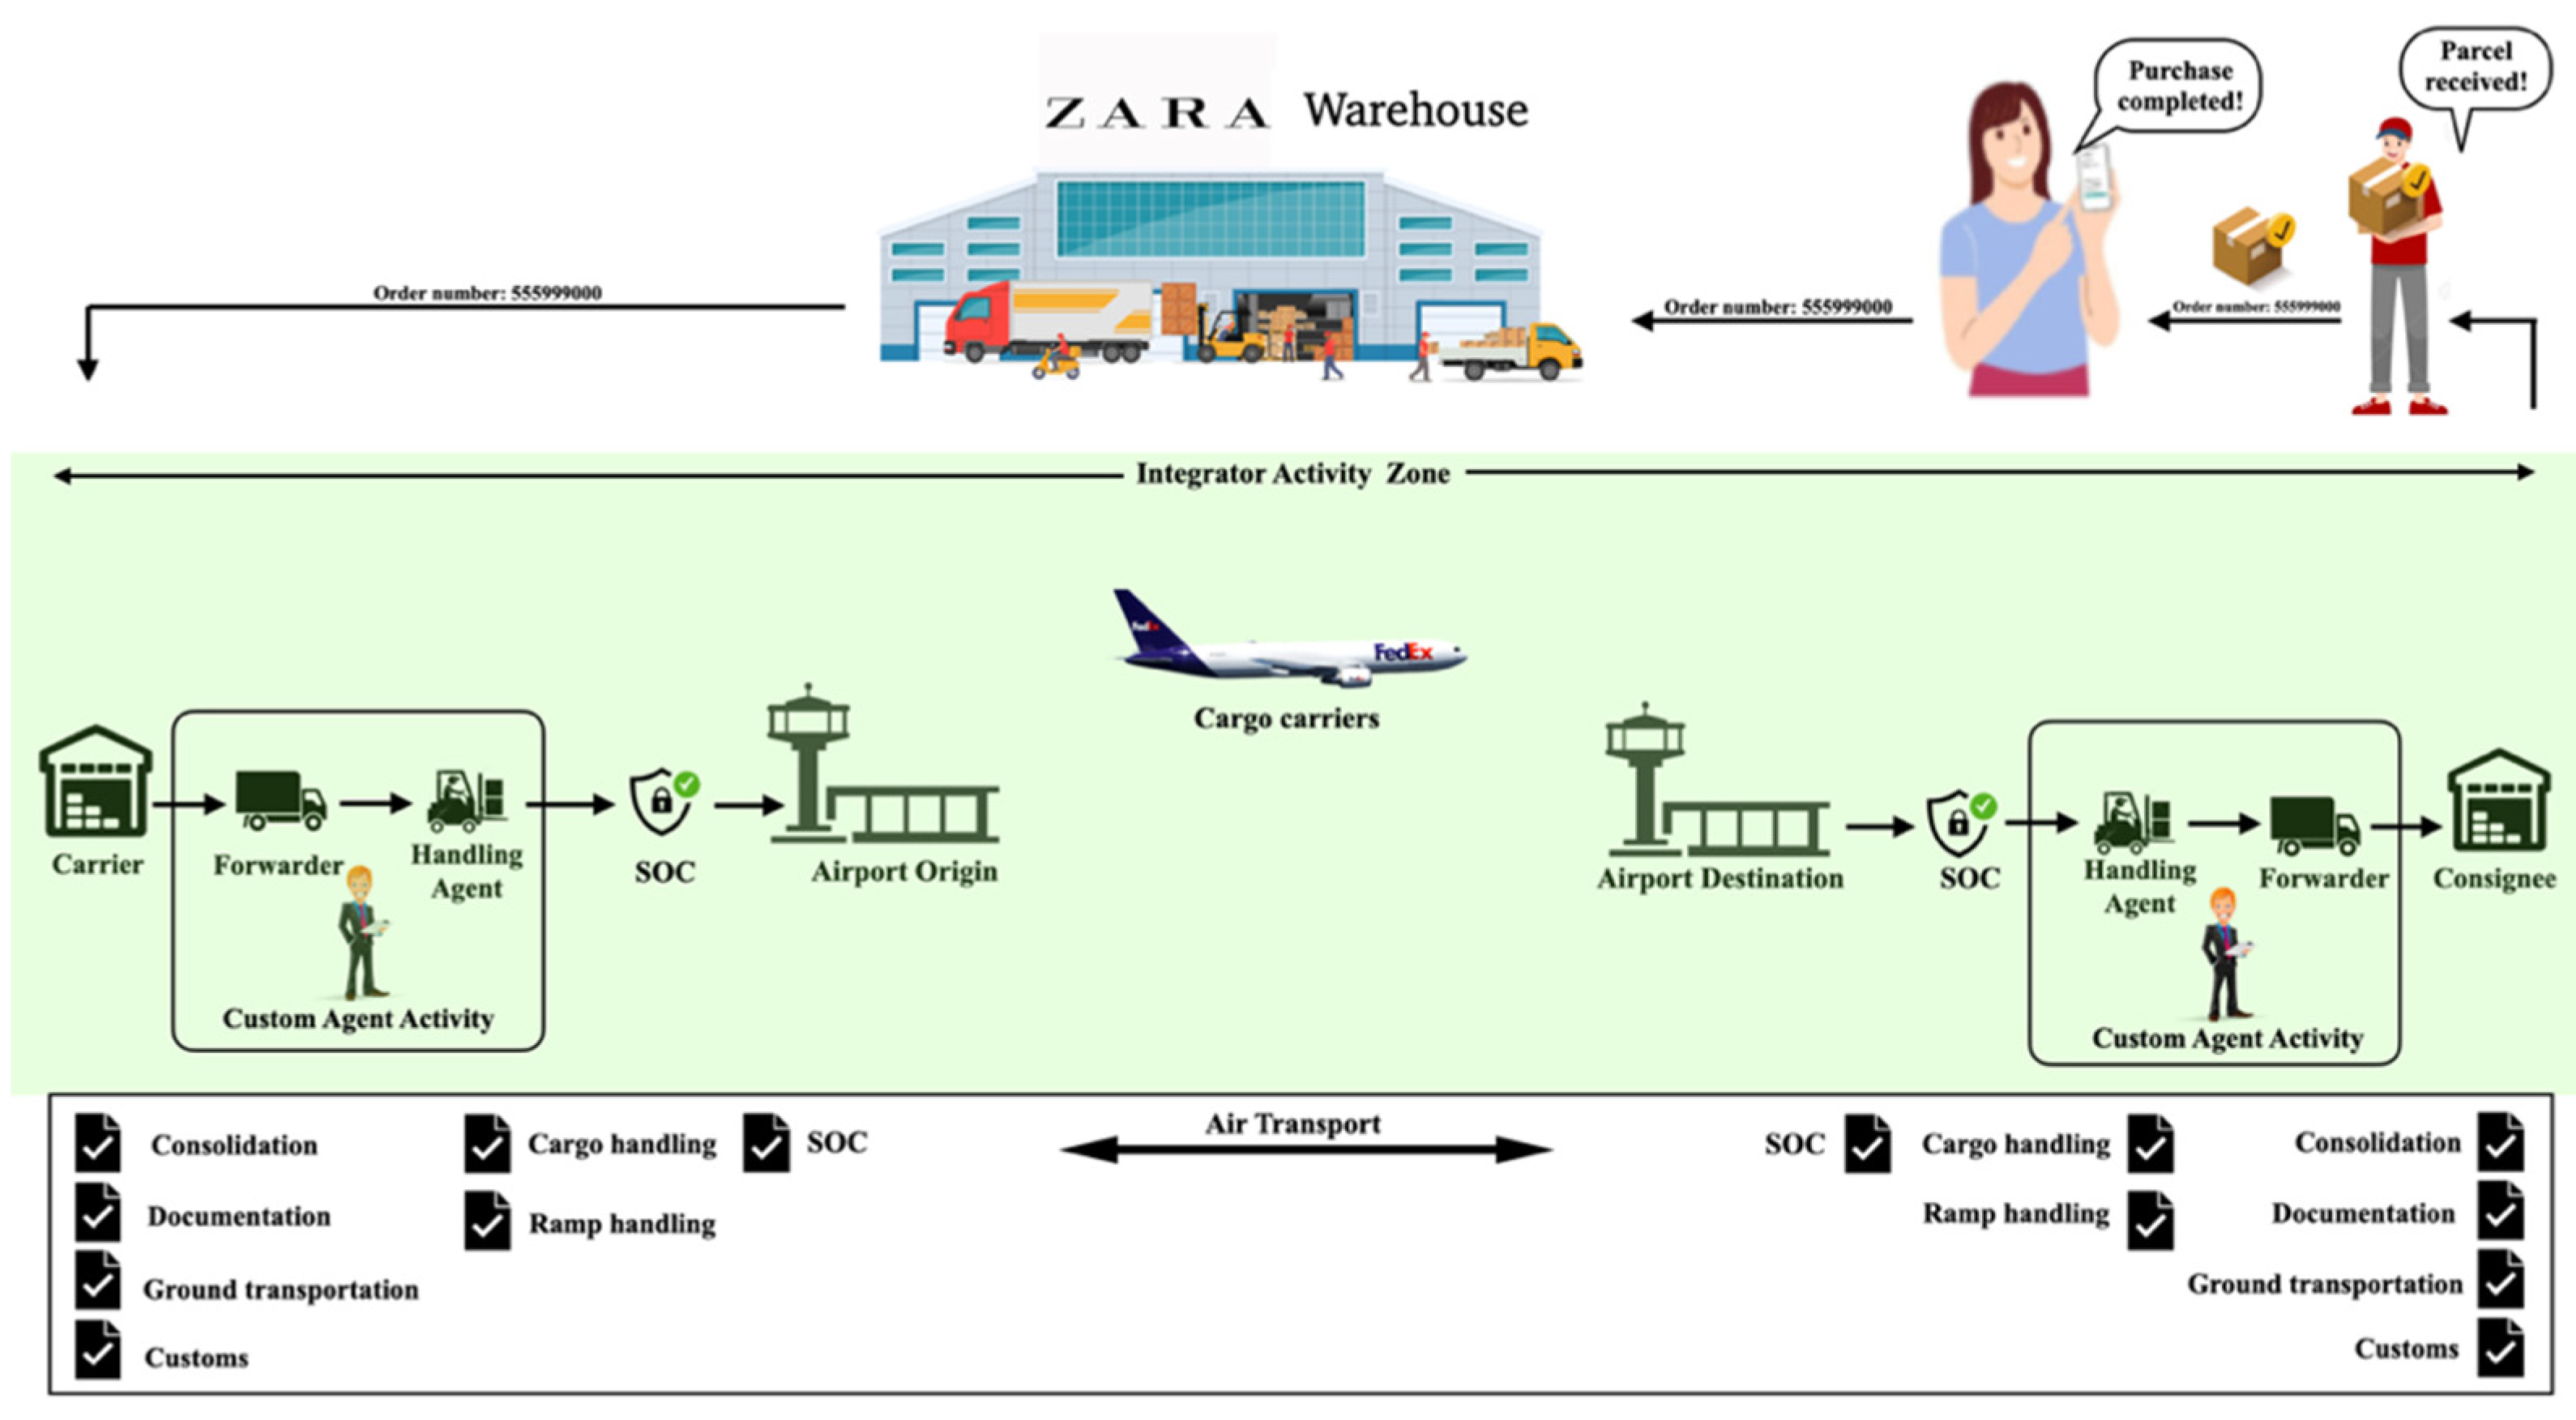
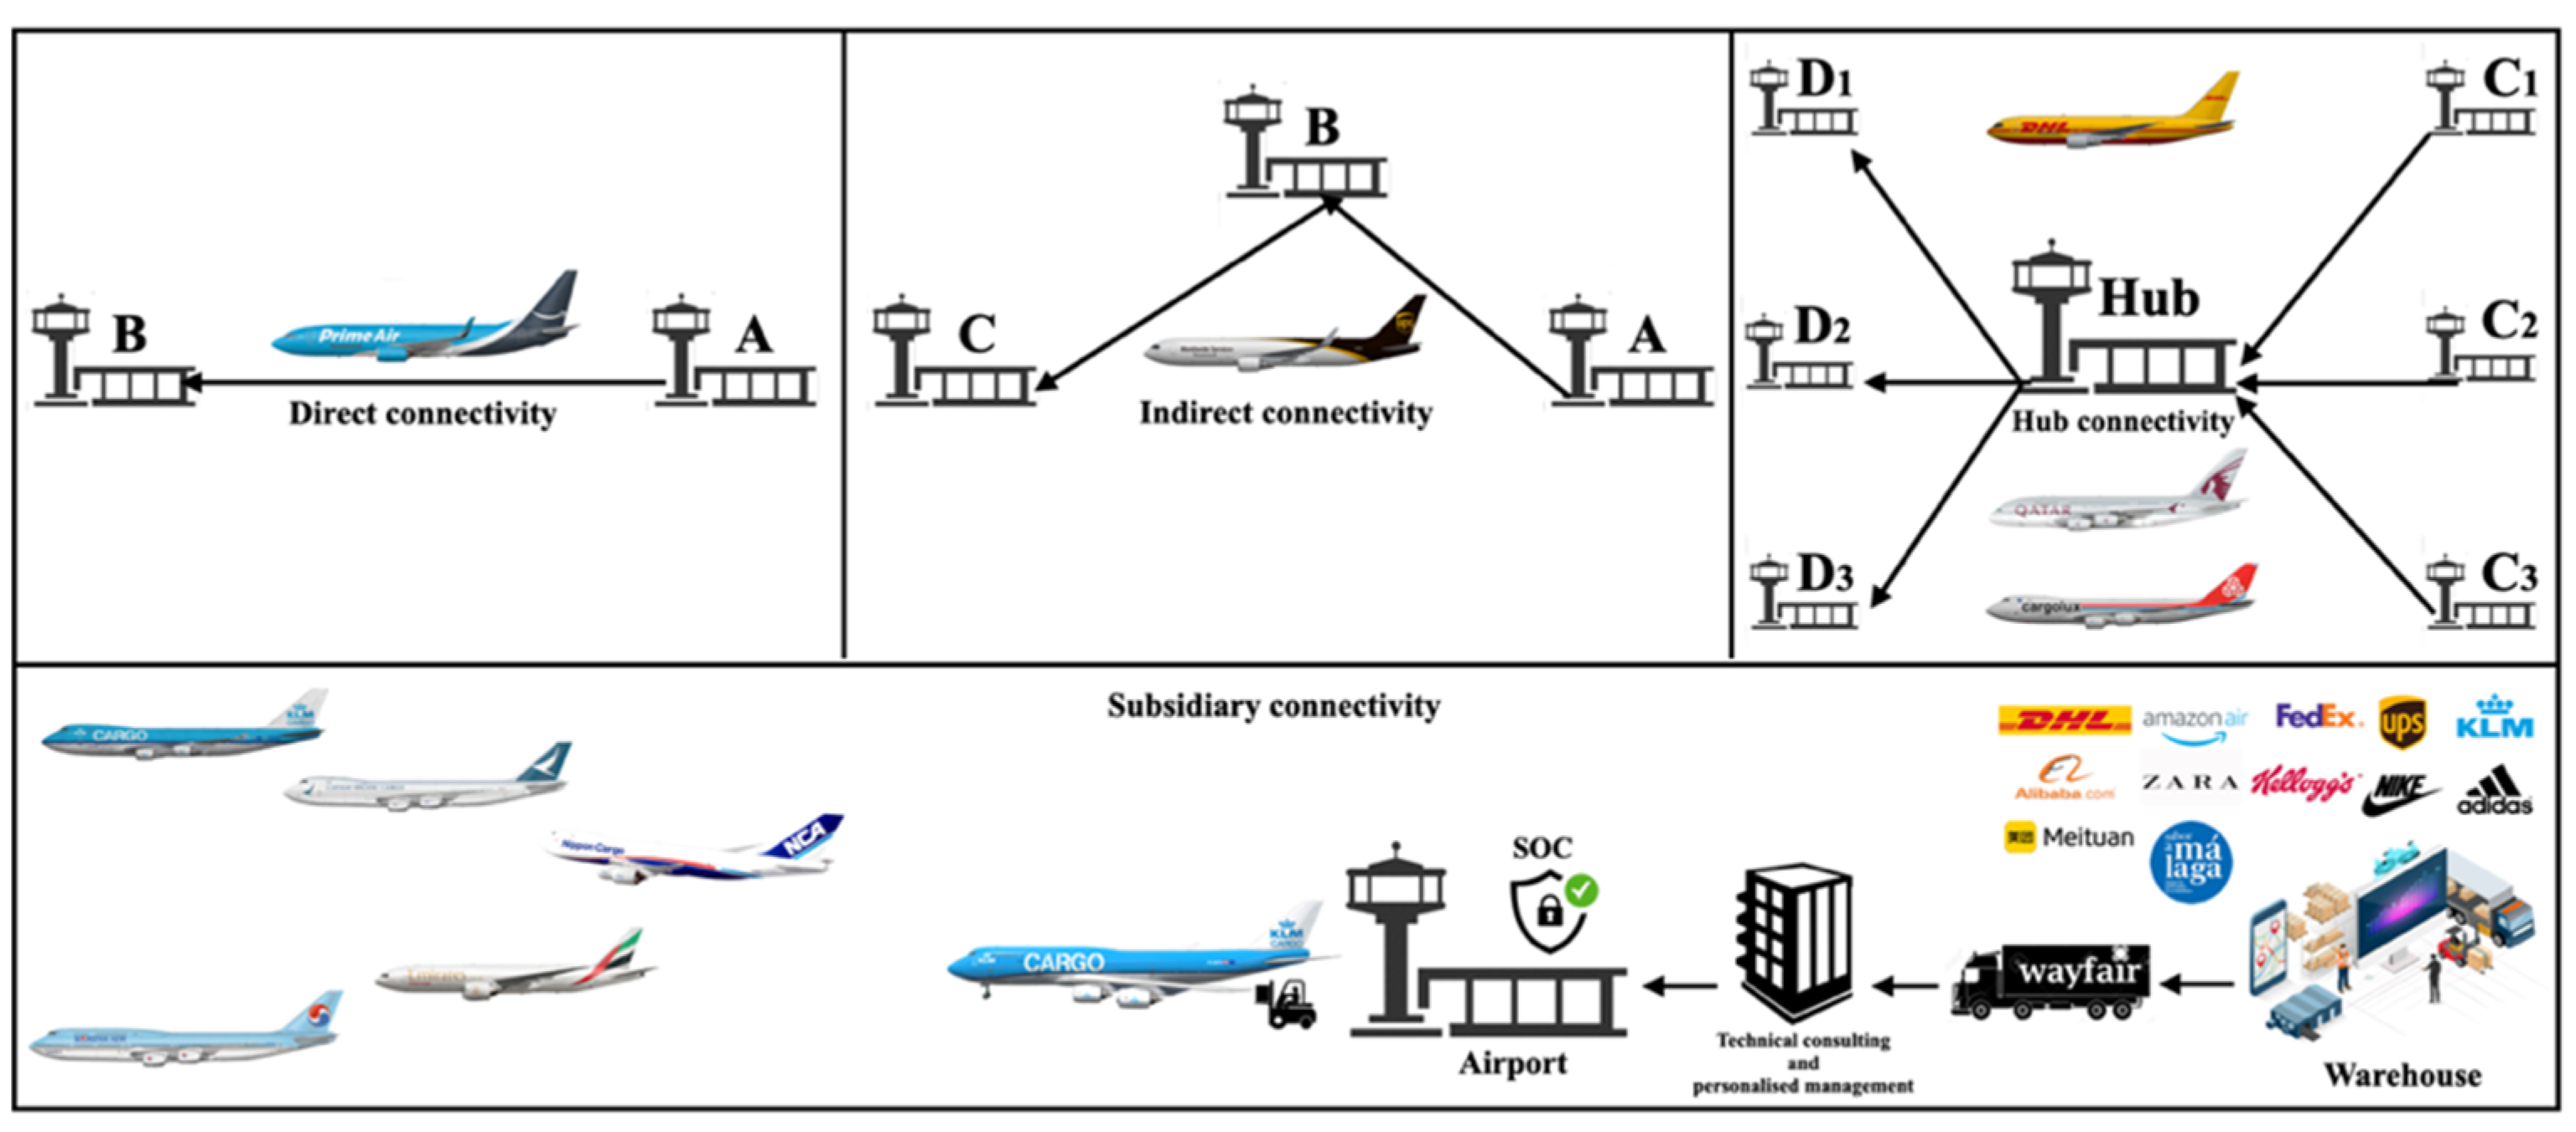
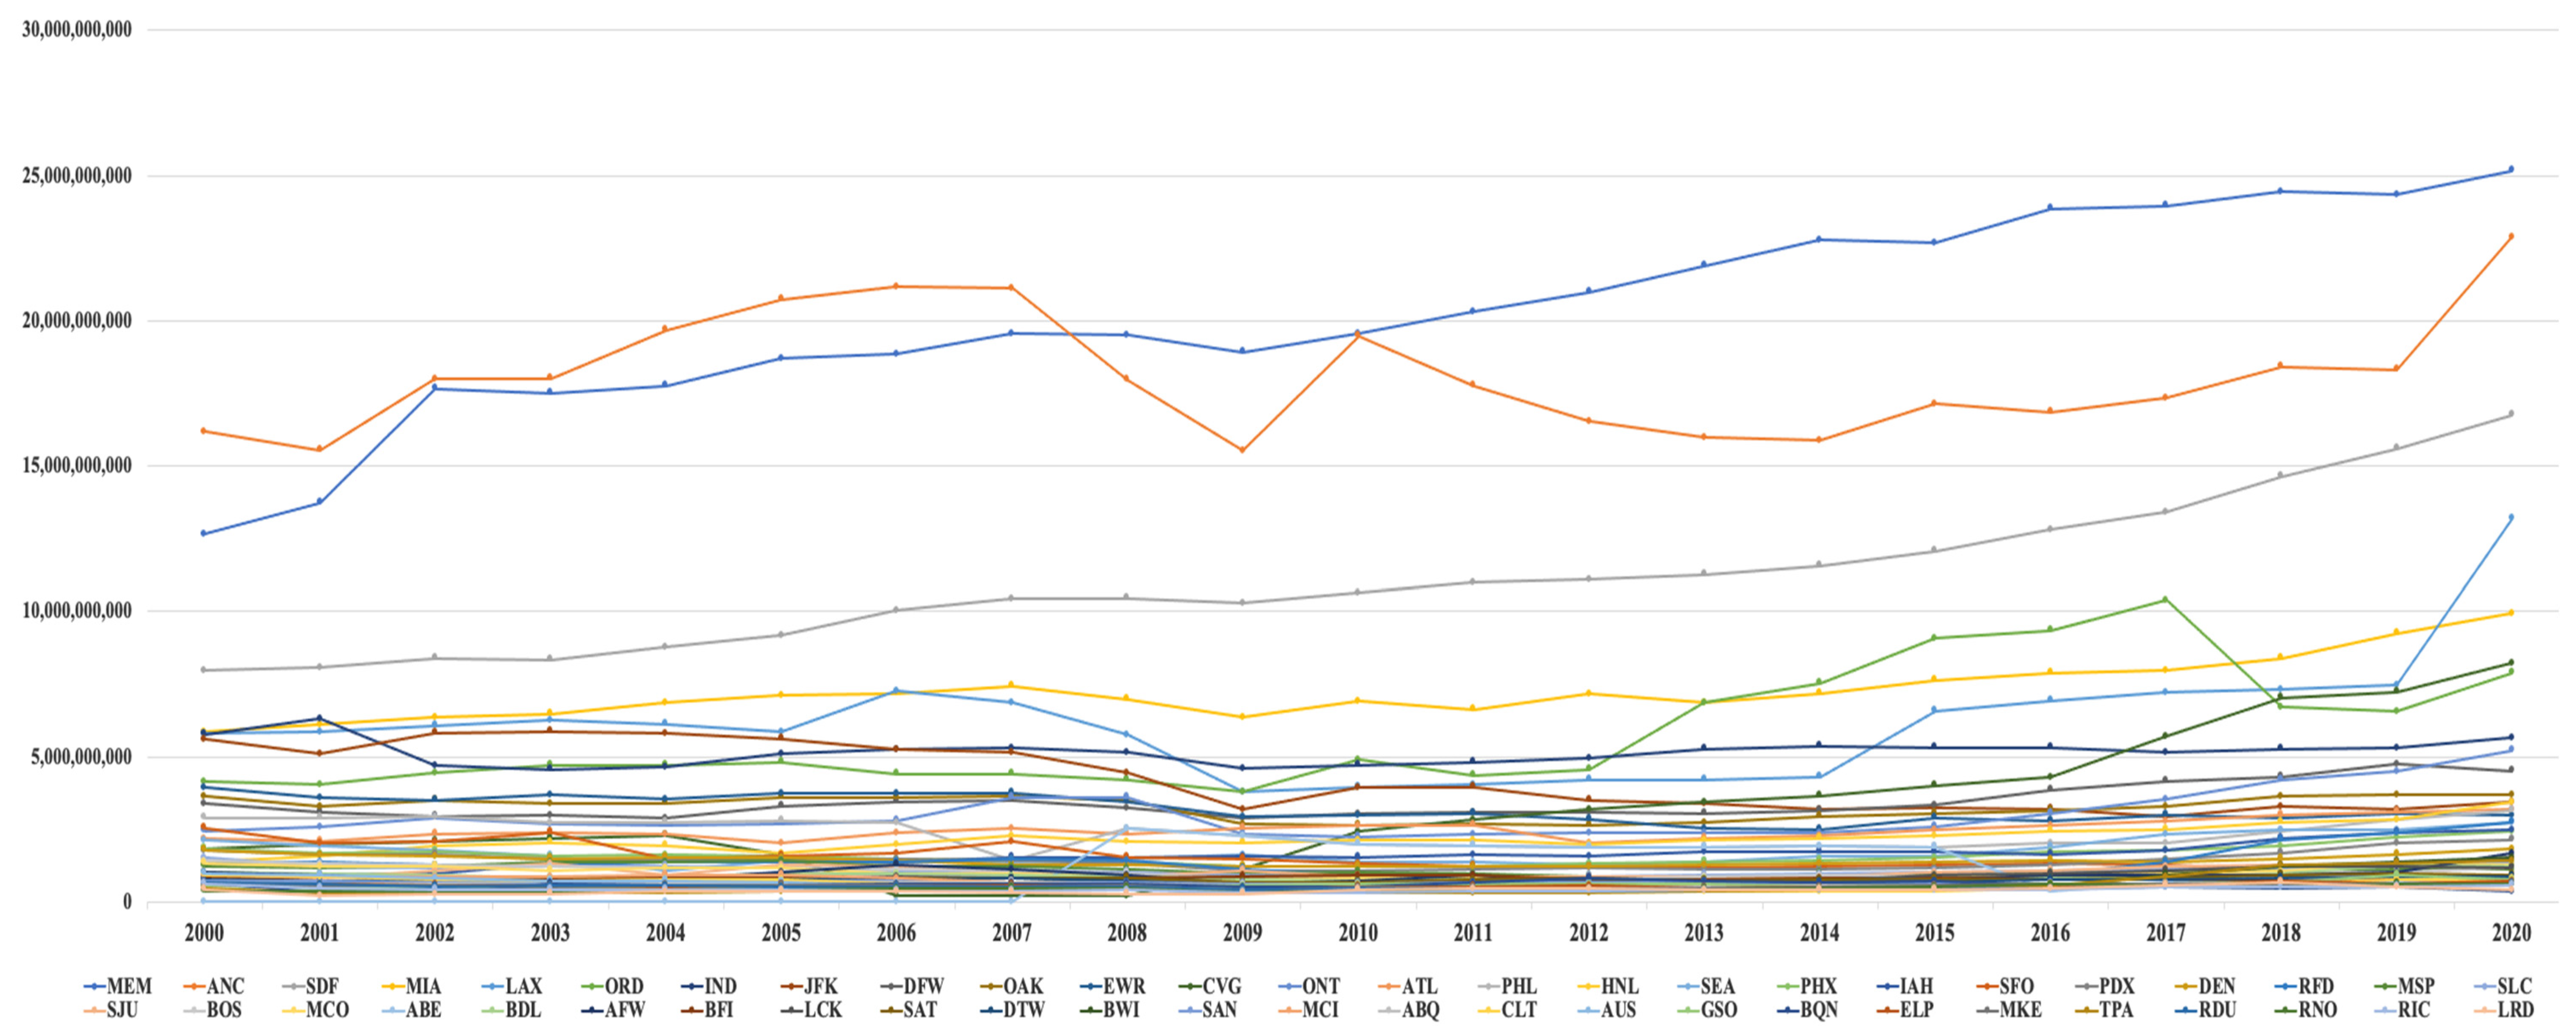
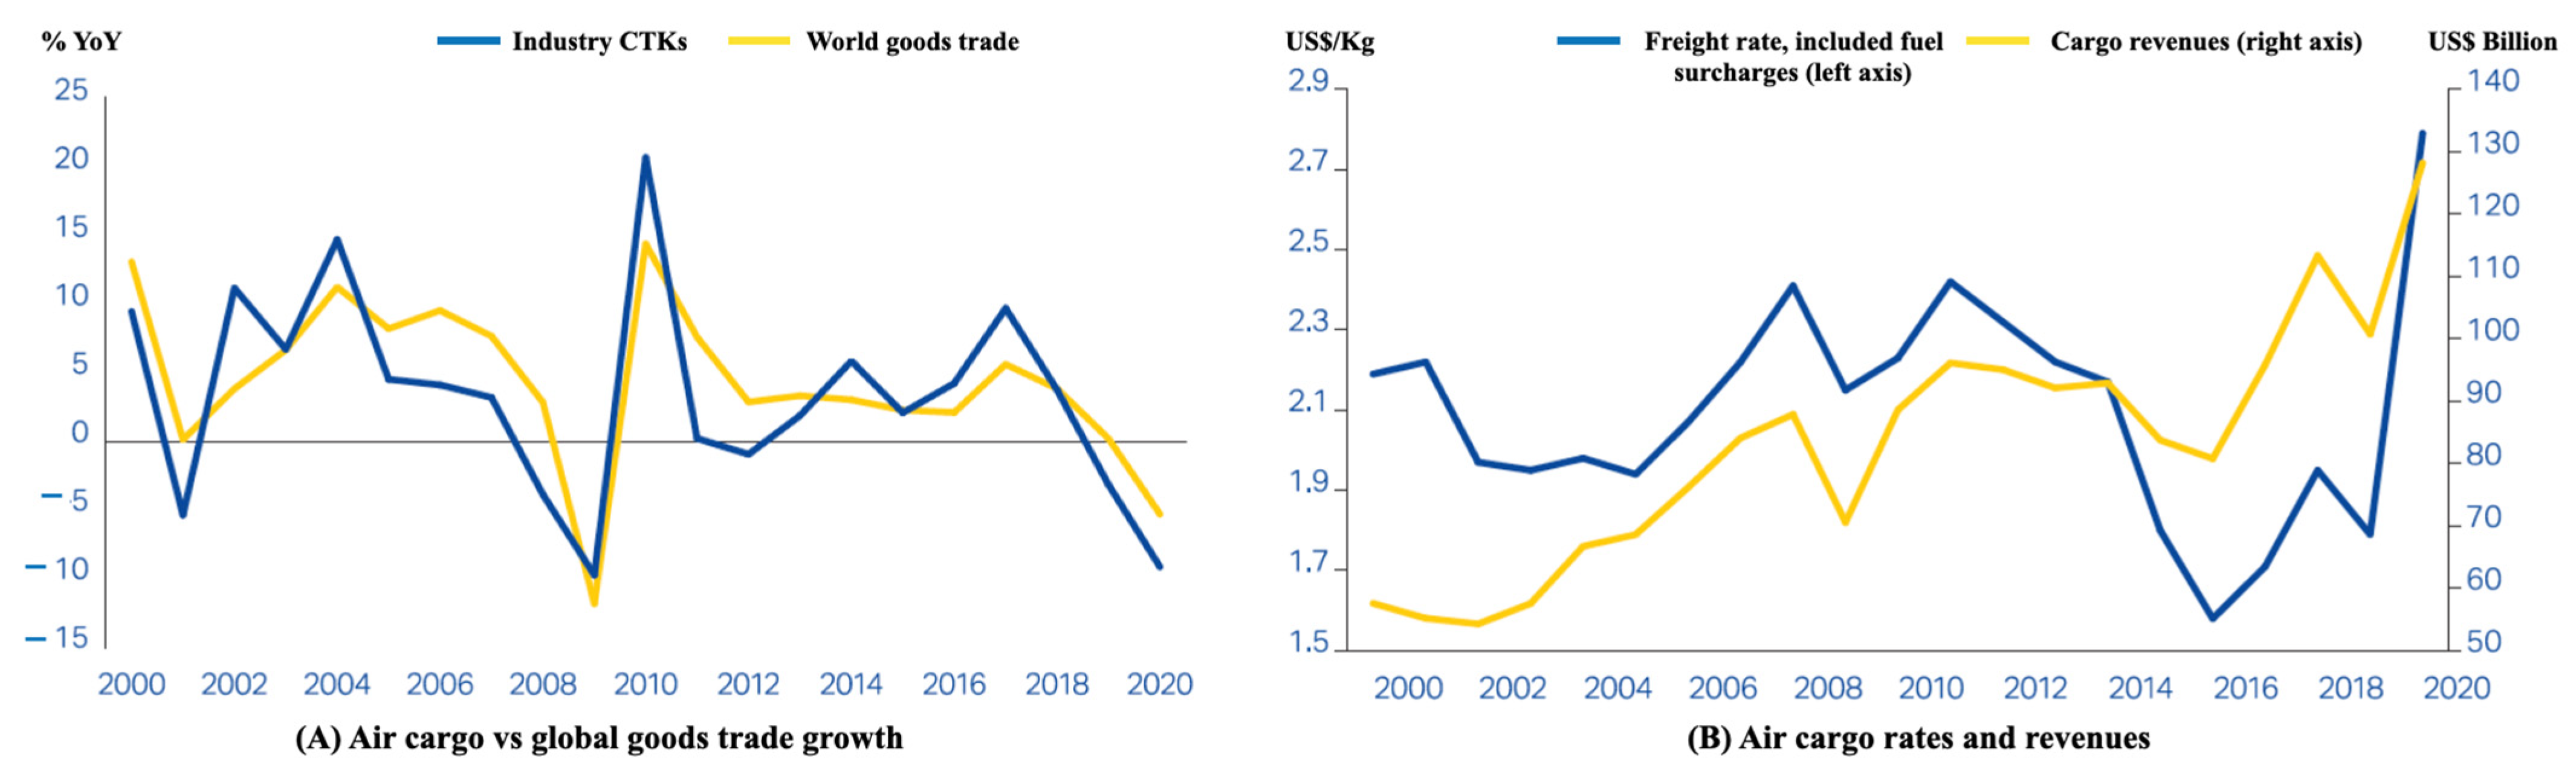
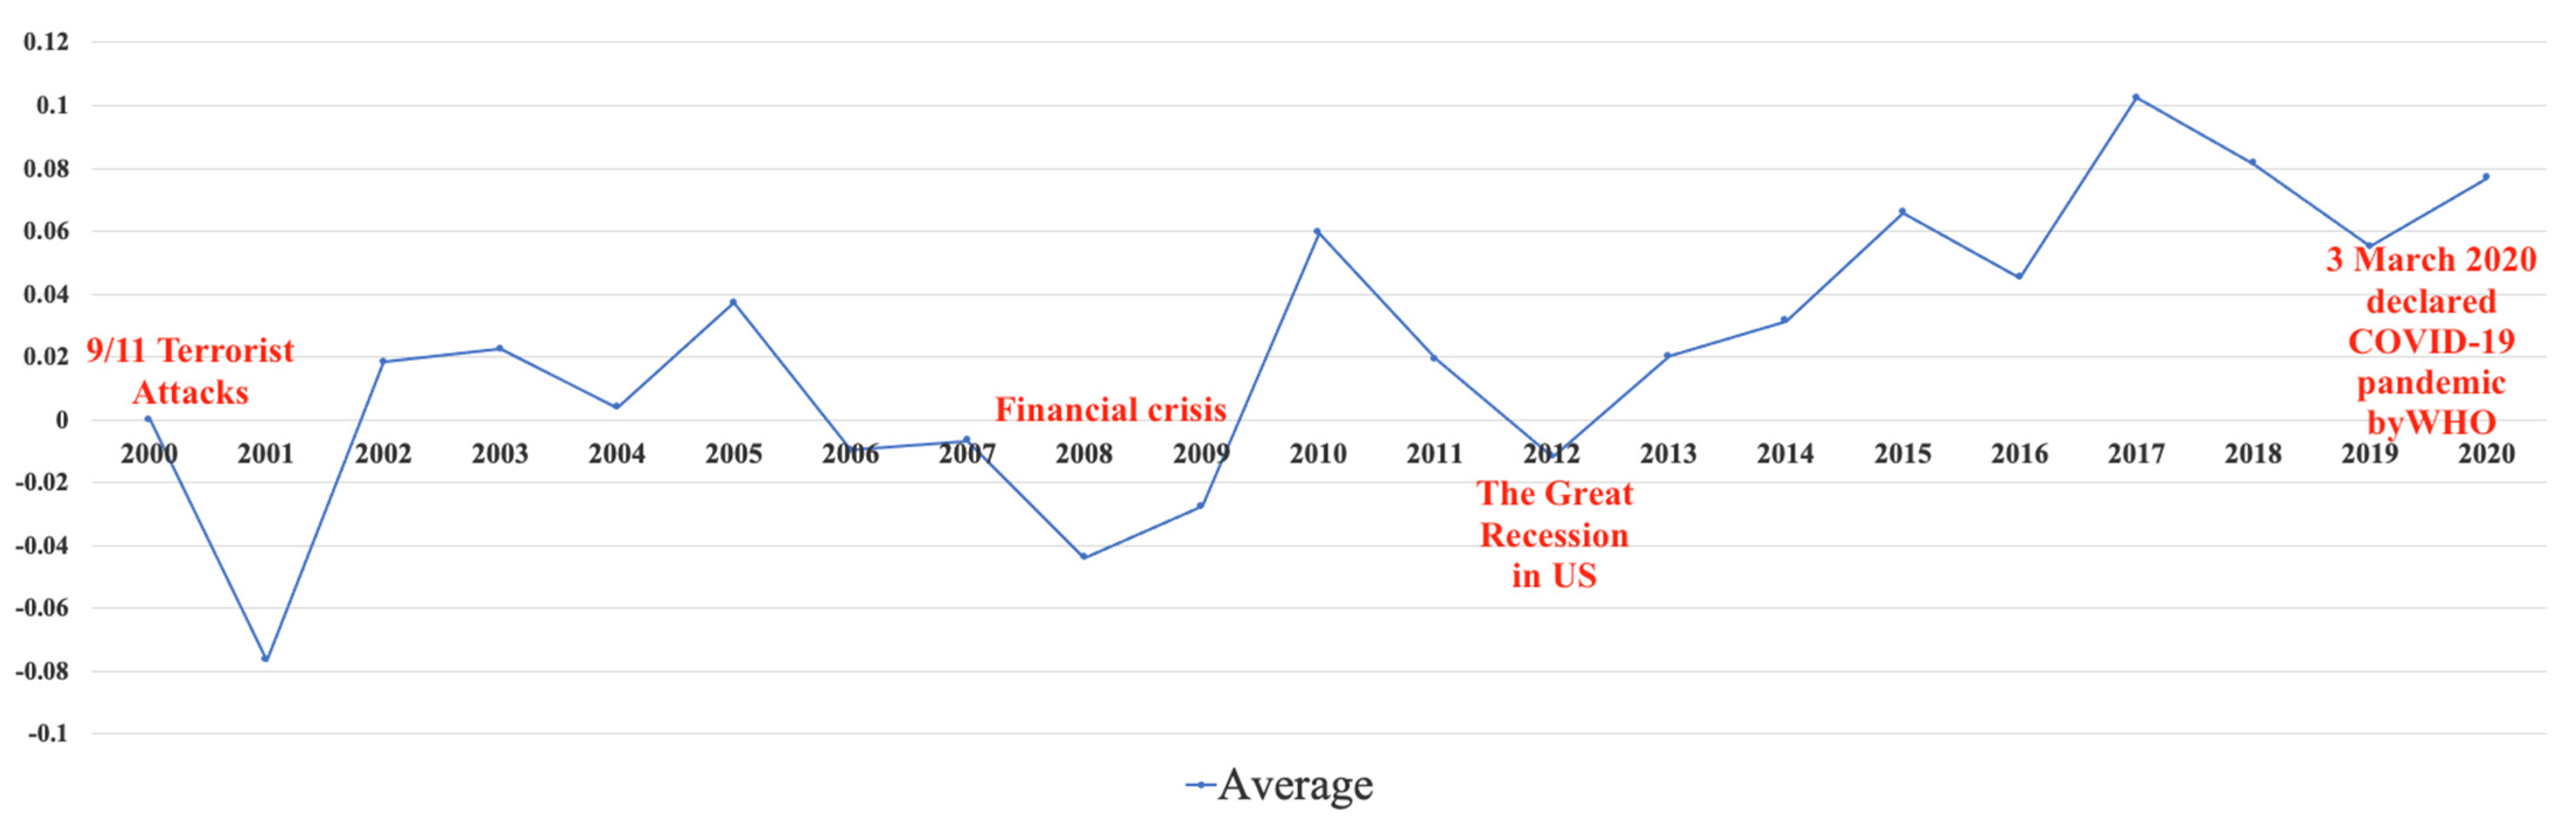
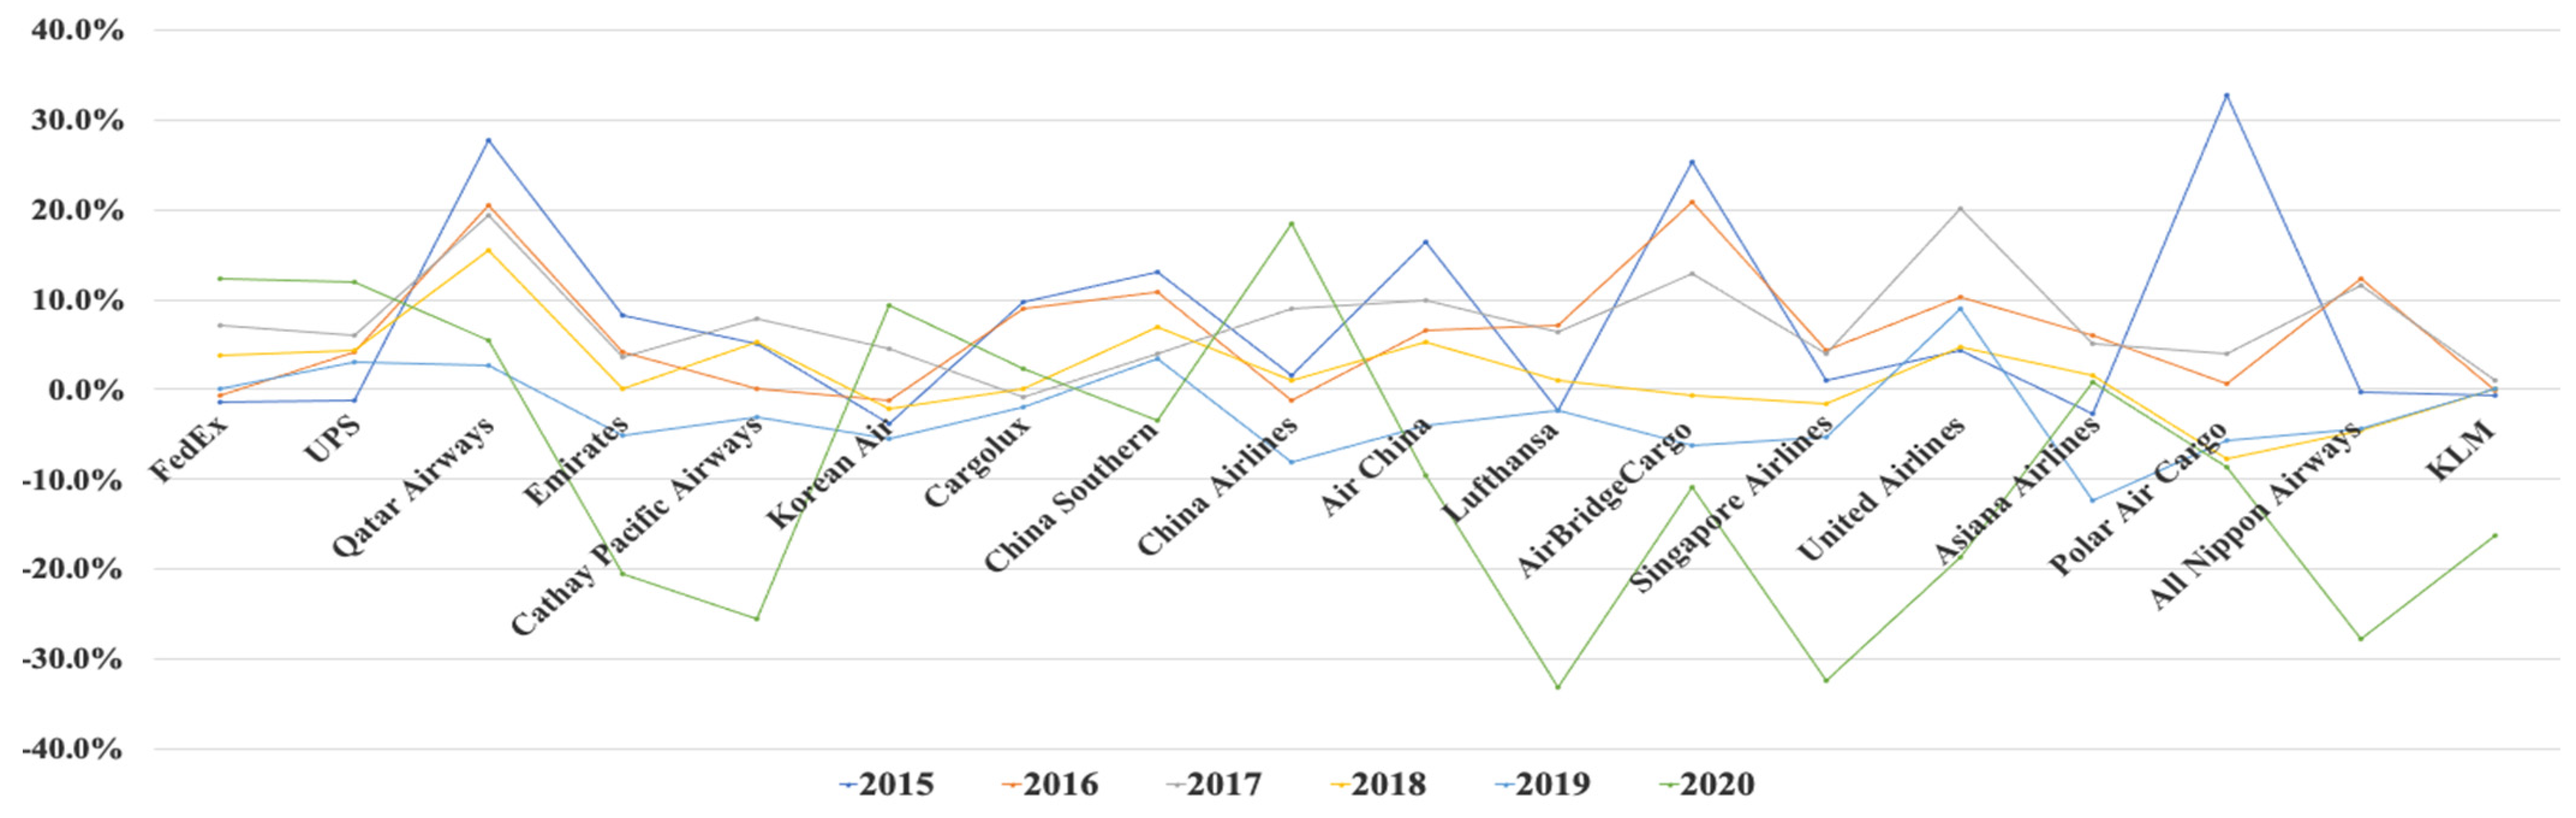
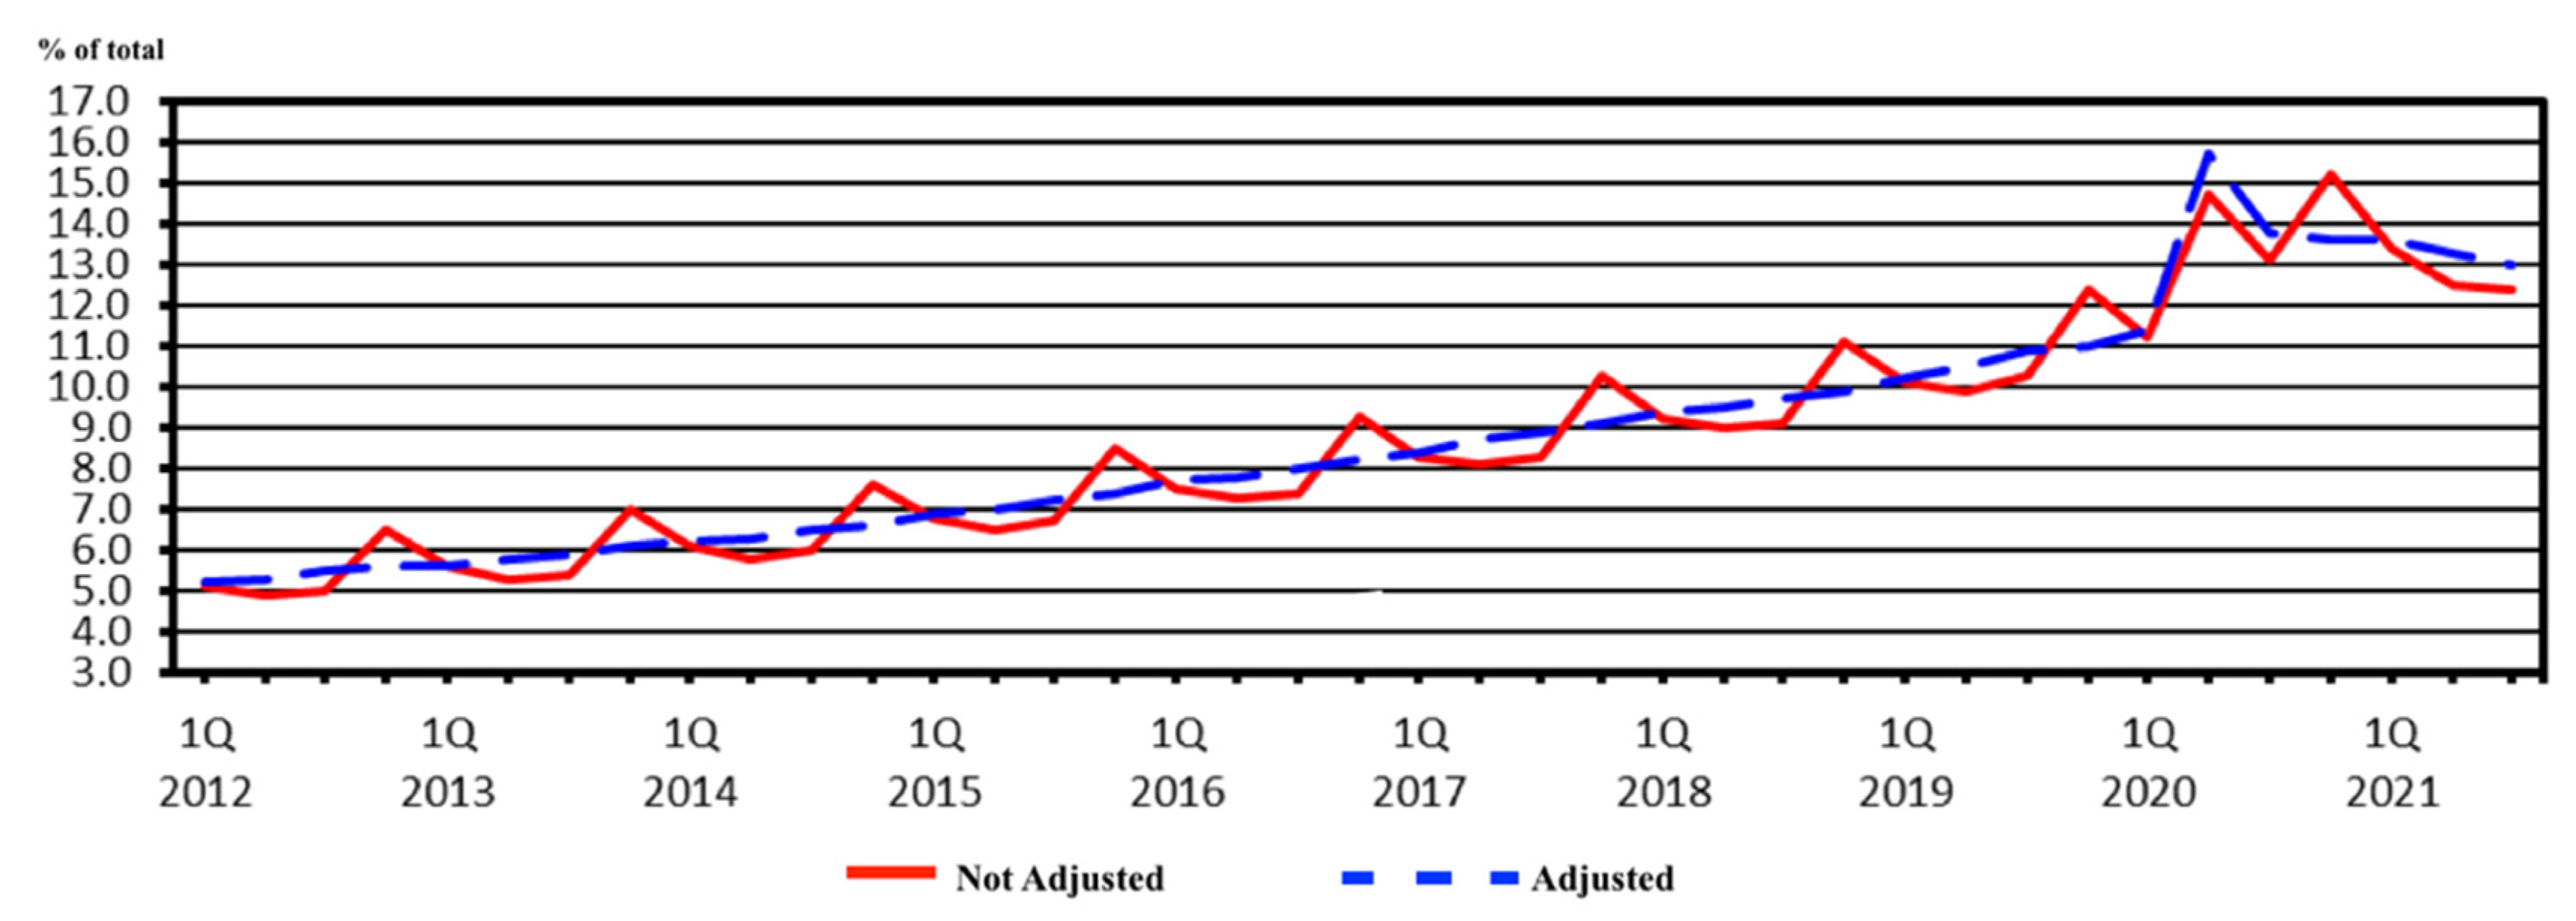
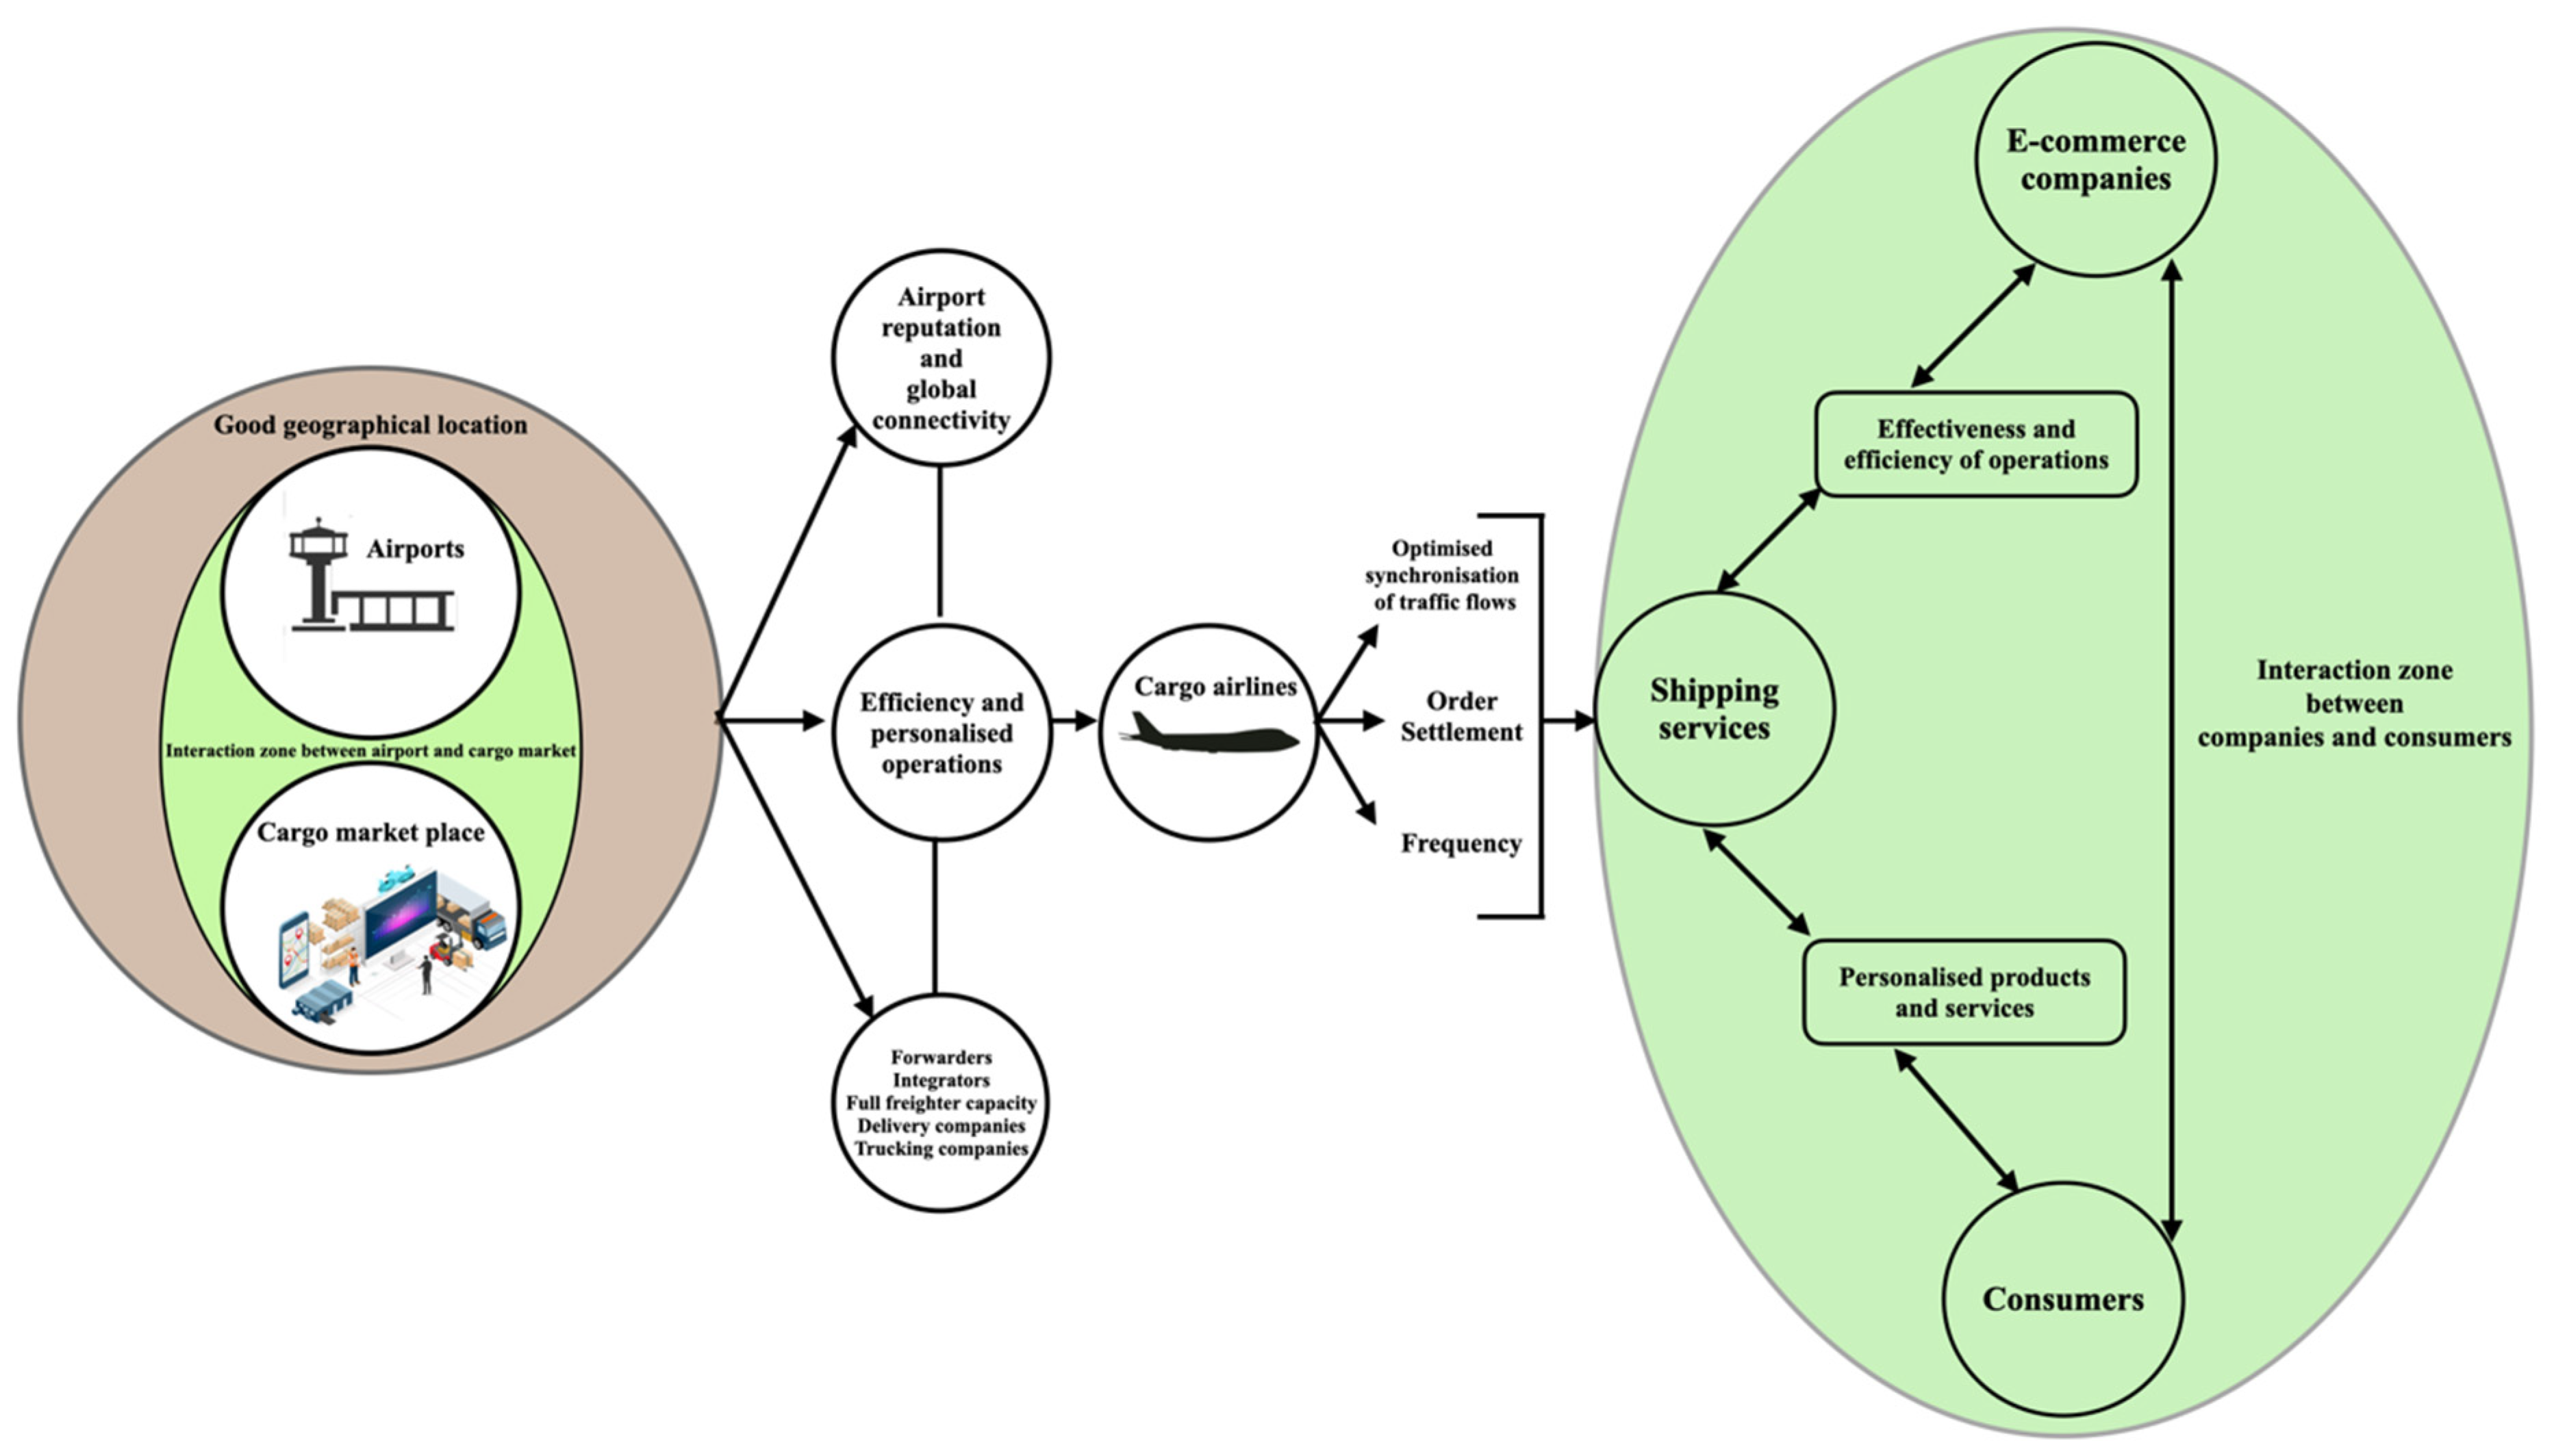
Disclaimer/Publisher’s Note: The statements, opinions and data contained in all publications are solely those of the individual author(s) and contributor(s) and not of MDPI and/or the editor(s). MDPI and/or the editor(s) disclaim responsibility for any injury to people or property resulting from any ideas, methods, instructions or products referred to in the content. |
© 2023 by the author. Licensee MDPI, Basel, Switzerland. This article is an open access article distributed under the terms and conditions of the Creative Commons Attribution (CC BY) license (https://creativecommons.org/licenses/by/4.0/).