Article

Scheduling External Trucks Appointments in Container Terminals to Minimize Cost and Truck Turnaround Times

1
Department of Industrial and Manufacturing Engineering, Egypt-Japan University of Science and Technology (E-JUST), Alexandria 21934, Egypt
2
Production Engineering Department, Faculty of Engineering, Alexandria University, Alexandria 21544, Egypt
*
Author to whom correspondence should be addressed.
Logistics 2022, 6(3), 45; https://doi.org/10.3390/logistics6030045
Submission received: 27 May 2022 / Revised: 1 July 2022 / Accepted: 5 July 2022 / Published: 7 July 2022
(This article belongs to the Section Maritime and Transport Logistics)

Abstract

:
Background: Scheduling the arrival of external trucks in container terminals is a critical operational decision that faces both terminal managers and trucking companies. This issue is crucial for both stakeholders since the random arrival of trucks causes congestion in the terminals and extended delays for the trucks. The objective of scheduling external truck appointments is not only to control the workload inside the terminal and the costs resulting from the excessive waiting times of trucks but also, to reduce the truck turnaround time. Methods: A binary programming model was proposed to minimize the waiting time cost, demurrage cost, and container delivery cost. Moreover, a sensitivity analysis was performed to compare various scenarios in terms of cost and to study to what extent the workload level is affected. The mathematical model was solved using Gurobi© 8.1.0 software. Results: 30 instances found in the literature were solved and evaluated in terms of the objective function value (i.e., cost) and truck turnaround time before and after controlling the workload inside the container terminal using the new proposed constraint. Conclusions: The obtained results showed a better distribution of the terminal workload, as well as a lower truck turnaround time that reduces the total cost.

1. Introduction

The rapid growth in the worldwide shipping industry has made the process of exchanging all kinds of goods easier. Containerized shipping has become the standard model of exchanging goods in global supply chains. The core advantages of depending on a sustainable freight mean of transport can be summed up as cost-effectiveness, time-saving, and higher reliability. Trucks are mainly responsible for the transportation operations from/to the container terminal. According to the International Chamber of Shipping [1], almost 90% of raw materials, foods, vehicles, manufacturing equipment, and products are shipped by sea around the world. Containerized trade using vessels is considered the lifeblood of the worldwide economy. Therefore, Container Terminals (CTs) have received a great deal of attention from researchers and responsible authorities who seek to manage their activities. CTs constitute a complicated network aiming to move goods among the world countries [2]. CTs consist of three essential areas: the landside, the yard area, and the seaside. Transport areas commonly link those three vital areas. The seaside has a group of quay cranes that perform discharging/charging inbound/outbound operations on deck, respectively. Internal trucks play an essential role in moving containers from/to the quayside to/from the yard area. Yard cranes are used for discharging containers transported by internal trucks. These containers are stacked in the yard area for a dwell time until they are carried by external trucks. External trucks are dedicated to picking up/delivering containers from/to the CT. At the landside area, external trucks are inspected, and handling containers takes place [3]. Figure 1 depicts the main areas of a CT and the cycle of the trucks while performing the dispatching tasks [4].
Due to the increasing demand for transporting containers to/from the terminals, trucking companies devote their trucks to performing the loading or dropping off tasks. Having various trucking companies send their trucks during the same time slots results in high arrival rates of trucks. Therefore, congestion levels rise at the terminal gates, causing excessive waiting times for the trucks and resulting in harmful emissions that increase global warming. According to [5], because of the massive amount of emissions, the international maritime organization in 2018 stated that reducing the amount of greenhouse gases resulting from international shipping is a must. After applying some policies and regulations, it is hoped that a reduction in the total amount of CO2 emissions by 50% will be reached in 2050 compared to 2008. Besides, the traffic fluidity of the streets around the terminals may be disrupted. Meanwhile, from the container terminal’s perspective, the bottlenecks that occur during specific time slots throughout the working hours lead to an unbalanced distribution of the workload and consequently reduce the utilization of the terminal’s equipment and its efficiency of serving the received tasks. Figure 2 illustrates typical truck arrival and departure patterns at the port of Alexandria in November 2017 [6]. This figure shows how chaotic the arrival patterns of trucks are during working hours.
In light of the problem of overcrowded trucks in front of the terminal gate and the yard area, container terminals implement Truck Appointment Systems (TAS). The terminal managers are responsible for setting such appointments according to various considerations (e.g., terminal workload, vessel berthing time, quay cranes operation schedule, etc.). The idea is to alleviate the workload in high load time slots [7]. Although the truck appointment system is beneficial for trucking companies, there are some anticipated drawbacks. The main drawback is assigning the trucks to inconvenient appointments for the trucking companies. This is due to the overlap with other tasks that should be performed by the same trucking company. On the other hand, if the container terminal allows the trucks to arrive at the terminal randomly, the terminal managers will lose control of the terminal workload.
In this study, a new approach is introduced to generate the optimum appointment schedule for external trucks to avoid bottlenecks at the terminal gate. The considered costs incurred by the trucking companies include the waiting time cost of a truck (including the entry, exit, and service times), the demurrage cost, and the cost of transporting a container to the terminal from the depots and vice versa (container delivery cost). Besides, an appointment quota that is set by the terminal manager to control the truck densities inside the terminal is applied. A mathematical model is proposed and formulated as a Binary Programming model. Gurobi© software is used to solve the developed mathematical model. The objective of the proposed model is to get the optimum schedule of appointments to enhance resource utilization and smooth out the workload as well as minimize the total costs, which will result in a reduction in truck turnaround times. Besides, a constraint is formulated and added to the proposed model to level the workload inside the terminal and evaluate to what extent leveling the workload will affect the costs for trucking companies. A comparison between the two phases of the proposed model is presented along with a sensitivity analysis to test the model under different scenarios. The obtained results showed that implementing the introduced approach will benefit the trucking companies by diminishing the truck turnaround times and enhancing the utilization of their trucks. The stakeholders are responsible for balancing the trade-off between the workload inside the terminal and the total cost incurred by trucking companies.
The rest of this paper is divided as follows: Section 2 presents a concentrated literature review. A detailed definition of the truck appointment scheduling problem can be found in Section 3. Section 4 discusses the formulated binary programming model and parameters, while Section 5 gives a comprehensive presentation of the obtained results and analysis. Finally, Section 6 provides conclusions and future work.

2. Review of Literature

The truck appointment scheduling problem in CTs has attracted the interest of many researchers in the literature. Although some research studies, articles, and books have been published tackling this problem, some areas still deserve more investigation. For example, ref. [8] proposed a comprehensive review of the truck appointment scheduling problem and identified the potential research directions related to this problem. The interested readers can refer to the previous study for a wider survey of the published research articles related to the problem in addition to a discussion and comparisons between the identified approaches found in the literature which were used to tackle the external truck appointment scheduling in container terminals. Moreover, readers are encouraged to go through [9] to identify other aspects of container terminal planning and management models.
The importance of external truck appointment scheduling is concluded from the literature, the surrounded community, and the environmental perspectives. As mentioned previously, many literature review studies discussed how crucial is to schedule the appointments of external trucks in container terminals for all stakeholders involved in these networks such as ref. [8], which assured that there are still some gaps in this research area. Additionally, many studies have emerged in literature focusing on reducing the harmful emissions on one hand, and scheduling the appointment of external trucks on the other hand as in the work of [10,11]. The community perspectives put pressure on addressing the external trucks appointment scheduling, especially in the residential areas next to container terminals’ landside areas because of the congestion of trucks during rush hours [12]. The previously mentioned reasons motivated the authors to focus on the external truck appointment scheduling in container terminals.
To begin with, studies presenting rudimentary systems to manage the truck arrivals at the terminal gate, ref. [13] have laid the foundation for scheduling trucks using a decision support system to assist the terminal managers in operating the terminal efficiently. Murty et al. proposed a case study in Hong Kong that relied on dividing the working time into time slots at which groups of appointments are assigned. Later, more comprehensive methodologies were implemented to solve the problem, either by formulating the appointment scheduling problem mathematically and solving it with the aid of exact or heuristic algorithms or by simulation software. Simulation packages have witnessed a significant breakthrough nowadays through supporting 3D models that offer real-life representations. This development enables users to get more accurate results and a real description of the studied cases, in addition to determining the key performance indicators of the container terminal systems (e.g., truck turnaround times, queue lengths in the terminal gate and yard area, etc.). Moreover, in some publications, the author’s combined previous approaches to get more efficient and reliable solutions. First of all, ref. [6] conducted a simulation-based optimization study to reduce waiting times experienced by trucks, and dangerous emissions, improve utilization of terminal resources and finally reduce the inconvenience cost of the trucking companies. This cost results from the shifting of appointments from the reserved ones due to the advanced or delayed arrival of trucks. To leverage the collaboration between the CT and trucking companies, they developed a Dynamic Collaborative Truck Appointment System (DCTAS). The integrated model objective is to reduce the turnaround times of trucks considering yard and gate operations. The results revealed better workload levels in the terminal yard, less congestion and queue lengths at the terminal gate, and higher utilization of the terminal equipment. Ref. [14] proposed a study to investigate the effect of putting a cap on the truck density inside the terminal using a TAS by allowing a certain number of trucks to come during each time slot. They used mathematical modeling and simulation to illustrate the effect of employing a TAS on the truck turnaround time and the utilization of the terminal resources. The problems resulting from the lack of organization and miscommunication between quay cranes and yard trucks were investigated by [15]. A mixed-integer linear programming model was developed to reduce the idle time spent executing two consecutive tasks and was solved by a particle swarm optimization-based solution method. In order to balance the workload in the terminal, ref. [16] proposed a mixed integer programming model to determine the appointment quota optimally, regarding the appointments of vessels, barges, trains, and trucks, and the obtained results were validated using Discrete Event Simulation (DES). Ref. [17] presented a DES approach to identify the effect of arrival patterns of external trucks on the turnaround time. The results of this study showed that there is a direct impact on the waiting time by changing the arrival patterns of external trucks. Furthermore, they recommended some considerations for terminal managers to reduce the time spent by trucks at the terminal gate and yard without affecting the working hours of the terminal gate. A TAS was designed by [18] to achieve a reciprocal benefit for both the terminal and trucking companies. A mixed-integer nonlinear programming model was formulated to optimize the optimum quota per each time slot aiming at reducing truck densities in the gate and yard areas, in addition to providing the best schedule for the trucking companies to send their trucks without deviation from the reserved appointments. The obtained results revealed that the container transportation costs declined by 11.5%. Ref. [19] presented a mixed-integer programming model combined with DES to obtain a smooth workload distribution during all working hours and reduce the congested trucks at the terminal. They indicated that the collaboration between the terminal and the trucking companies improves the key performance indicators (e.g., vessel and truck turnaround times). Furthermore, the previous study deduced a more efficient TAS compared with the one proposed by ref. [20], which is why this system is more convenient to apply in reality. In this regard, ref. [21] presented an integrated DCTAS aiming at helping both the trucking companies and container terminals in sharing the decision-making process. Trucking companies are encouraged to participate in selecting their preferable arrival appointments while guaranteeing that the workload of the terminal is balanced. The proposed approach incorporated a DES model and a mixed-integer programming model to solve the problem while considering the uncertainties related to the problem. The obtained results showed that adopting DCTAS can benefit both the CT and trucking companies to improve various key performance indicators such as queue lengths and truck turnaround times. Ref. [22] used the concept of non-stationary queuing models to design a TAS in order to limit the over-crowdedness of trucks in the terminal yard by calculating the optimum number of appointments per time slot. Besides, using the yard cranes efficiently for managing the workload. The results showed a considerable reduction in the total operating cost. Ref. [12] implemented an integer linear programming model to obtain the best schedule for the received appointments of trucks. They aimed at minimizing the total cost by reducing the shifted appointments due to the delayed arrival of trucks. The presented models tested to check its performance using several scenarios from the literature. The obtained results showed a considerable reduction in truck turnaround times.
In this work, an extension of the work of ref. [23] considers more parameters, and a modified objective function is proposed. This study differs from the work of ref. [23] by introducing a linear objective function to reduce the total costs resulting from dispatching tasks of containers. Moreover, a new formulation of the problem is proposed considering more constraints to level the workload inside the terminal. The binary programming model is used to schedule the appointments of the trucks arriving at the terminal to manage the workload levels inside the terminal to avoid bottlenecks. The model will help in reducing the total costs related to the dispatch of containers from/to the terminal, in addition, it will distribute the workload evenly among all the working hours, which provides better utilization of the terminal resources, reduced turnaround times, and congestion in front of the gate and the yard areas.

3. The Truck Appointment Scheduling Problem

External truck scheduling is the process of organizing arrivals and departures of trucks according to various factors, e.g., the workload of the quay and yard areas, the available trucks in the trucking company, and the truck densities inside the terminal. Assuming that there is a set of containers that should be delivered/picked up to/from a container terminal, the trucking companies notify the terminal of the arrival time to deliver outbound containers. Likewise, the trucking companies follow the same procedure in picking-up tasks to delivering them to depots. The output of this problem is a schedule of truck appointments that will not violate the preferred arrival times submitted by truck drivers or the terminal workload distribution.
The scheduling of truck appointments is executed by an operating system called TAS. The TAS is a standard communication application that is employed to coordinate between the terminal and the trucking companies. The TAS is used by the terminal planners for determining the best appointment for trucks to come. After submitting an appointment request by a truck driver, the TAS is used to receive the workload levels from the terminal, then calculate the best schedule for drivers to come. Based on this step, the trucking companies organize their plans regarding the expected waiting times in the terminal [24]. The TAS enables the terminal managers to balance the workload level and reduce the congestion, emissions, and total costs resulting from excessive waiting times.
The proposed mathematical model seeks to reduce the total cost that is divided into three components: the container delivery cost, the demurrage cost, and the waiting time cost. According to ref. [23], the container delivery cost can be defined as the cost incurred by the trucking company to deliver containers to customers. This cost includes fuel cost, driving cost, and maintenance cost. The container delivery cost varies as it depends on the time slot at which the container is dispatched to the terminal. If the container is picked up from the terminal during rush hour time slots, the truck will spend more time delivering the container, whereas the truck will reach the depot in less time in smooth traffic conditions.
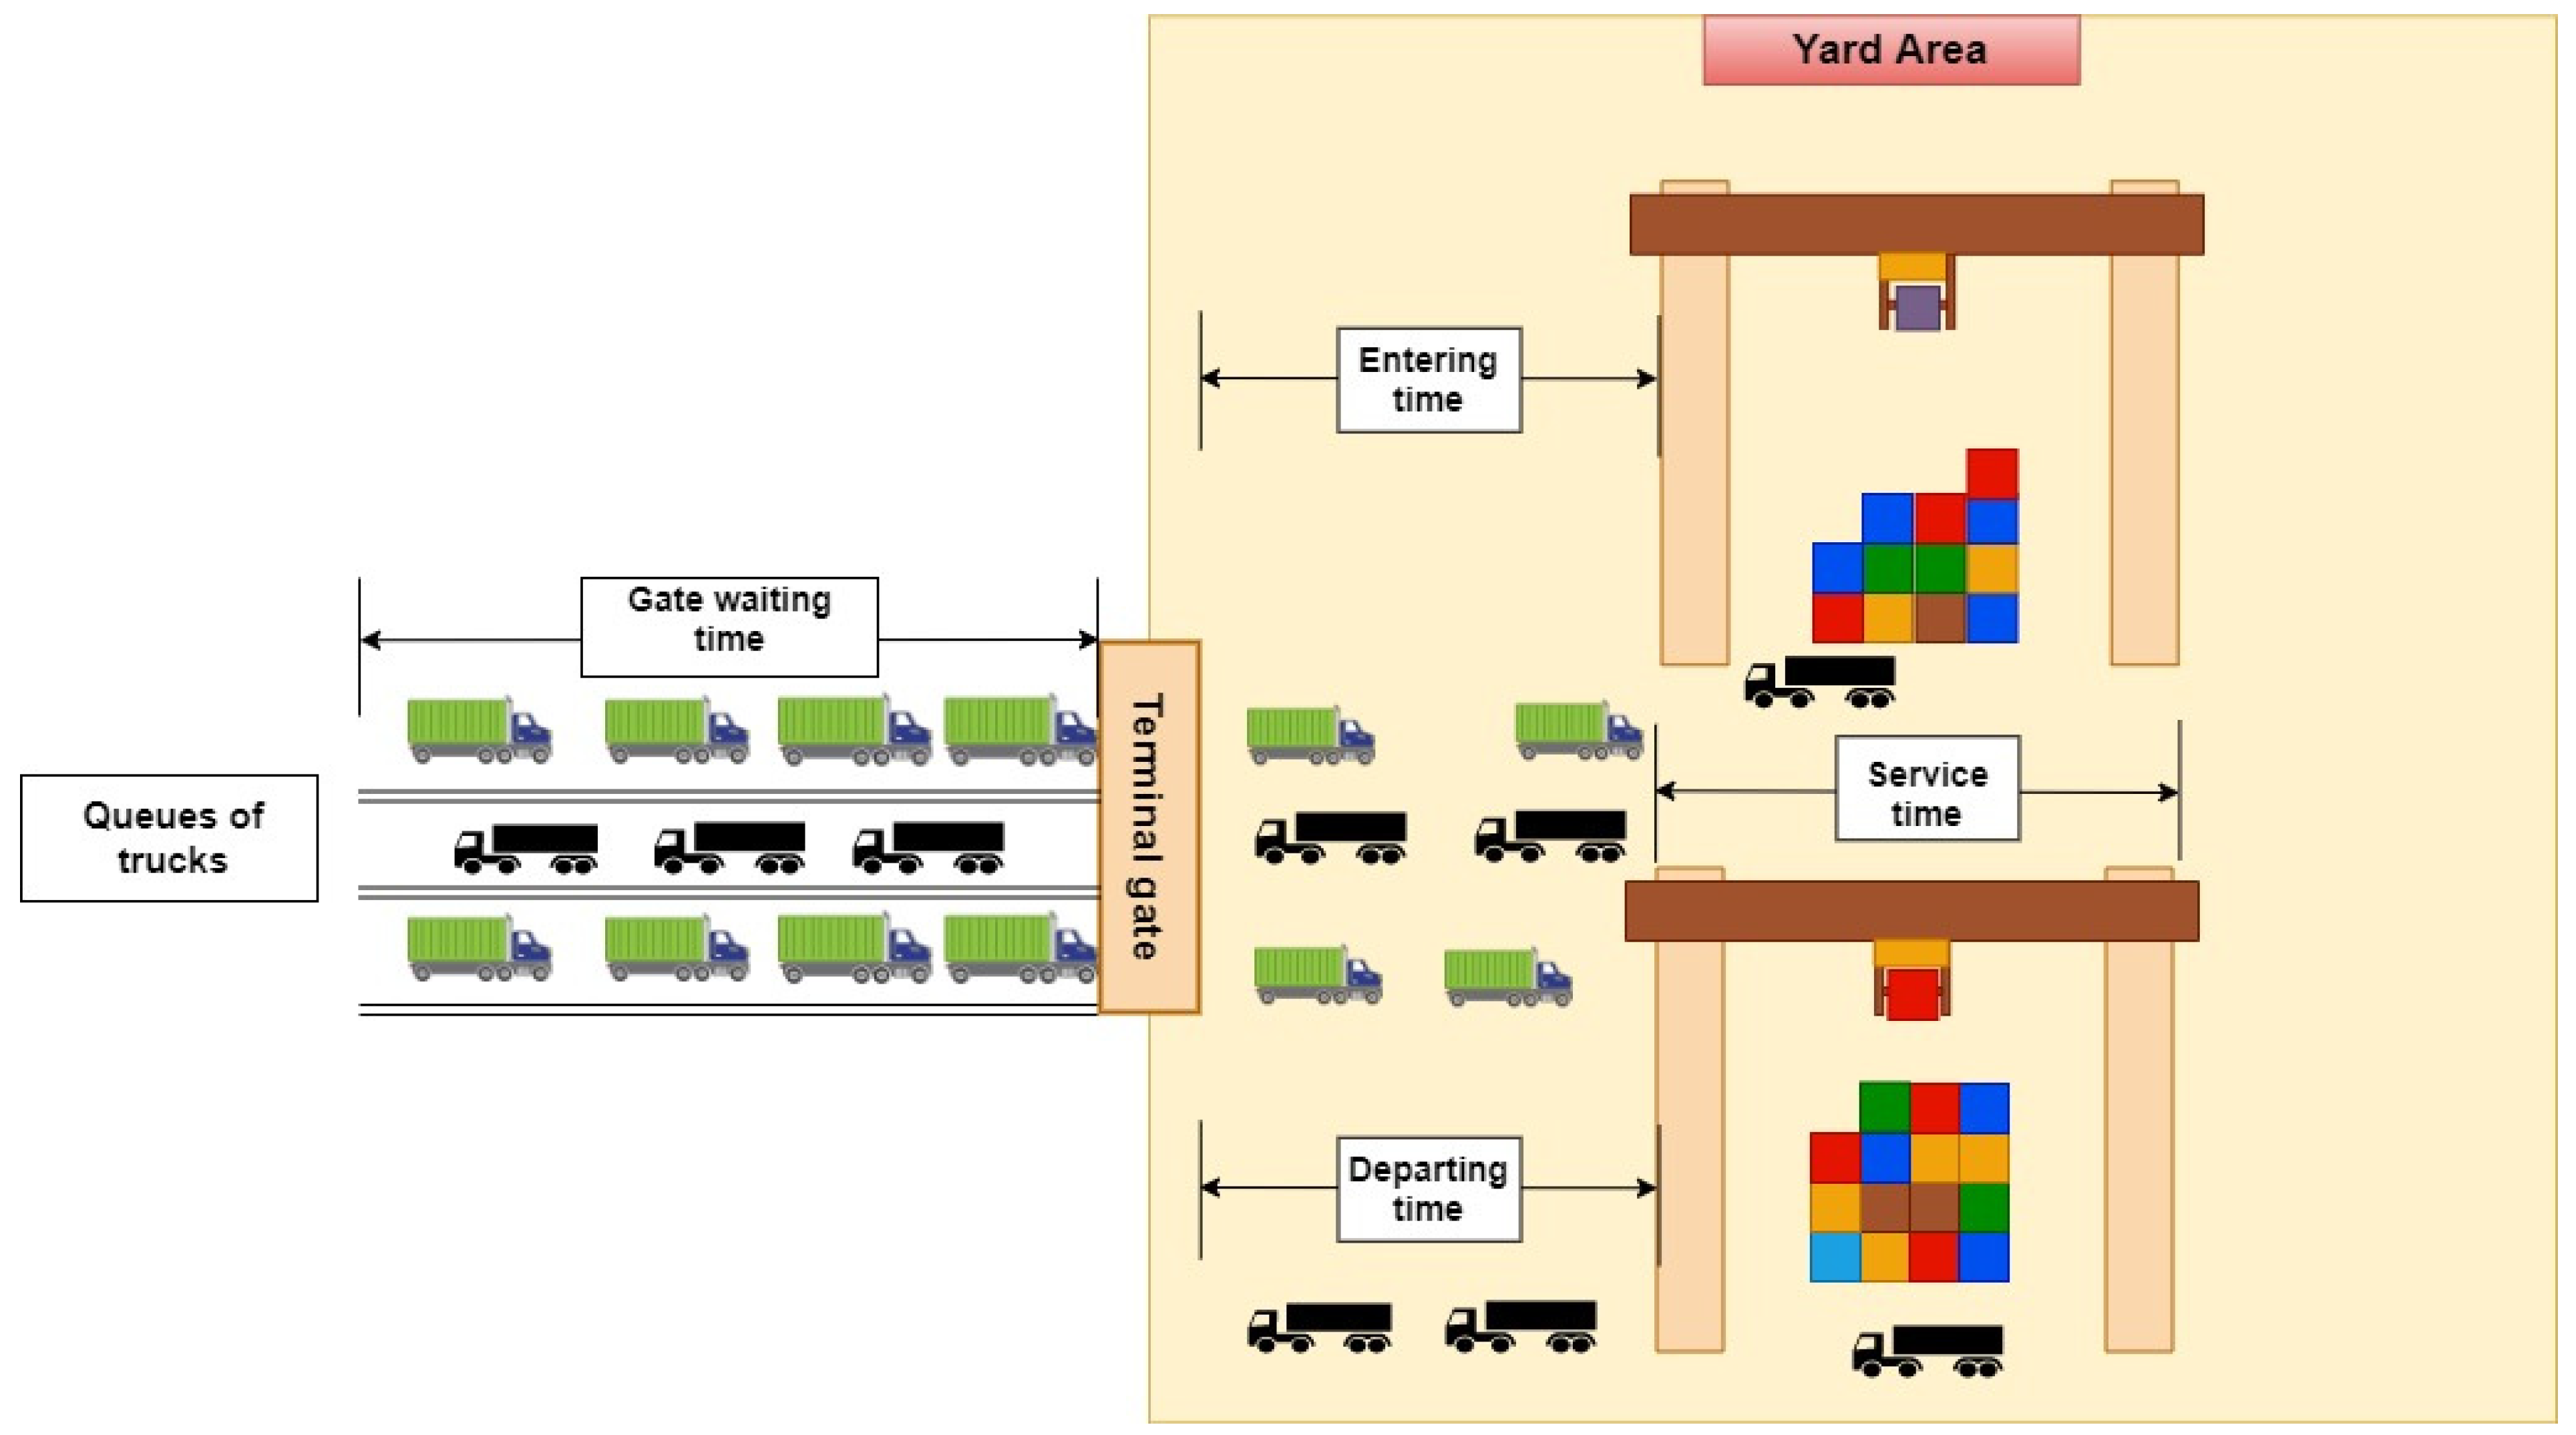
On the other hand, the demurrage cost is a penalty applied per time unit if an inbound container is picked-up after its free of charge period specified by the terminal, or if an outbound container is loaded before its free of charge period. According to the stevedoring tariff document of the Pusan East Container Terminal, the demurrage fee is imposed when an inbound container is stored for more than four days, which is free of charge. Also, the shippers have three days to load outbound containers for free [23]. Finally, the waiting time cost pertains to the entry/exit time to/from the terminal, respectively as well as the service time. Figure 3 illustrates the times spent by external trucks to deliver or pick up a container.
In the proposed case, the CT consists of seven-yard blocks. The working hours are divided into 24-time slots, and the terminal capacity is 30 trucks. The terminal manager controls the truck quota at each time slot. In this case, the maximum number per time slot is 10. It is assumed that there is one trucking company that executes the dispatching tasks of containers to the terminal.

4. The Truck Appointment Scheduling Binary Programming Model

The proposed mathematical model and parameters are presented in this section. The planning horizon is divided into 24-time slots representing 24 h. It is assumed that all cost terms are per unit of time. Parameters and sets used in the proposed model are summarized in Table 1 and Table 2.

4.1. Parameters

Table 1. Symbols and description of the used parameters.
c Cost of waiting per unit time for a truck in the container terminal.
d b s Demurrage penalty of tardiness for each truck appointed at block b at time slot s.
g Cost of transporting a container from the terminal to the depot.
v b s The maximum allowable appointment quota at block b during time slot s.
a s The average time required for a truck to move the container from the terminal to the depot at time slot s.
n b The number of containers that must be carried from block b.
t i I N The time needed for a truck i to arrive at the destination block from the terminal entrance.
t i O U T The time needed for a truck i to depart from the destination block where the task is performed to the terminal exit.
t i s The service time spent by a truck i to finish a task appointed at time slot s.
U s The number of trucks available for the trucking company during time slot s for transporting containers from the terminal.
TThe maximum service time of a truck excluding the probable waiting times. It is related to the duration at which the trucks are served.

4.2. Sets

Table 2. Sets used in the proposed model.
USet of trucks ( i   ϵ   U )
SSet of time slots (s ϵ   S )
BSet of yard blocks (b ϵ   B )

4.3. Decision Variable

X i b s = { 1 ,     i f   t r u c k   i   p i c k e d   u p   a   c o n t a i n e r   f r o m   b l o c k   b   i n   t i m e   s l o t   s 0 ,     o t h e r w i s e

4.4. Objective Function

Minimize:
T C ( X ) = i ϵ U b ϵ B s   ϵ   S [   c ( t i I N + t i O U T + t i s ) + d b s + g . a s   ]   X i b s
Subject to
i ϵ U b ϵ B X i b s U s                       s   ϵ   S
i ϵ U X i b s v b s                       s   ϵ   S ,   b   ϵ   B
i ϵ U s ϵ S X i b s = n b                       b   ϵ   B
t i I N + t i O U T + t i s X i b s   T                   i   ϵ   U ,   b   ϵ   B ,   s S
b   ϵ   B X i b s     1                       i   ϵ   U ,   s   ϵ   S
X i b s   { 0 , 1 }                       i   ϵ   U ,   b   ϵ   B ,   s   ϵ   S
First, the objective function (1) aims at minimizing the total cost resulting from the time spent by the trucks to finish the assigned tasks considering the waiting time (i.e., only inside the container terminal) cost, the demurrage cost, and the container delivery cost. Constraint (2) considers the limited number of trucks available for the trucking company to execute the assigned tasks during each time slot. The maximum quota for each block during each time slot is regarded in constraint (3). In other words, this constraint limits the total accepted appointments to a certain number that is set in advance by the terminal operator to limit congestion in the terminal.
To ensure that all the required tasks are executed, constraint (4) is presented. Constraint (5) guarantees that each truck finishes the assigned task within the allowable time. Constraint (6) provides a guarantee that each truck is assigned to one-yard block during each time slot (i.e., for each truck at a specific time slot, it is impossible to visit two-yard blocks simultaneously).

5. Numerical Experiments and Results

In order to show the performance of the proposed model, the model was tested and validated using a real dataset obtained from the literature [23] (Problem instances link: http://logistics.ie.pusan.ac.kr/logiticsie/28188/sview.do?enc=Zm5jdDF8QEB8JTJGYmJzJTJGbG9naXN0aWNzaWUlMkY1ODI1JTJGNjU2NjkxJTJGYXJ0Y2xWaWV3LmRvJTNGYmJzT3BlbldyZFNlcSzRCUymlzVmlld01pbmUlM0RmYWxzZSUyNnNyY2hDb2x1bW4lM0QlMjZwYWdlJNEMSUyNnNyY2hXcmQlM0QlMjZyZ3NCZ25kZVN0ciUzRCUyNmJic0NsU2VxJNEJTI2cGFzc3dvcmQlM0QlMjZyZ3NFbmRkZVN0ciUzRCUyNg%3D%3D) (accessed on: 11 February 2019). The data set includes 30 instances, which are solved in a computational time of less than 1 s. The numerical experiments were performed using Gurobi© 8.1.0 on an Intel® Core i7-4770 CPU @ 3.40GHz, with a 4.00 GB RAM computer. Table 3, Table 4, Table 5 and Table 6 present the input parameters for the binary programming model. The tables below indicate the number of containers to be dispatched, type of tasks (inbound or outbound), the demurrage cost, the available number of trucks during each time slot, and finally the appointment quota (i.e., the maximum number of appointments for each yard block during each time slot). As an example, Table 7 and Table 8 illustrate the number of containers to be picked up from each yard block in instances number 8 and 13, respectively. These data are taken from Pusan Terminal in Korea, and each instance represents a day. For example, in instance number 8, the trucking company should dispatch 475 containers from 7-yard blocks during 24-time slots of 1 h each.
It is assumed that the waiting time cost is c = 120   $ / hr , and the container delivery cost, g = 20 $/h. The demurrage cost is 15 $/h, which is imposed by the terminal in specific yard blocks during certain time slots as discussed in Table 4. All of these parameters are estimated based on the literature. Table 9 summarizes the values of each used parameter and the reference upon which these parameters are estimated.
Table 10 shows the total costs for each instance and the required number of tasks that should be performed. For example, the highest total cost can be found in instance number 8, which includes 475 tasks to be performed. In this case, the total cost equals $20,437.4, whereas instance 13 produces the smallest total cost of $1653.4 due to the small number of tasks to be executed. Figure 4 and Figure 5 provide the optimum workload distribution for instances number 8 and 13, respectively.
Figure 4 reveals a very restricted workload schedule due to a large number of tasks (i.e., 475 tasks) in this instance. On the other hand, Figure 5 indicates that there are no tasks to be performed in several time slots (4–10) and (16–23), which in turn, brings about significant idle times for the terminal resources.
To further investigate the results, a sensitivity analysis was performed to verify the effect of the number of trucks available at each time slot on the three cost parameters (i.e., container delivery cost, demurrage cost, and waiting time cost). The sensitivity analysis experiment is elaborated on in the next subsection.

5.1. Sensitivity Analysis

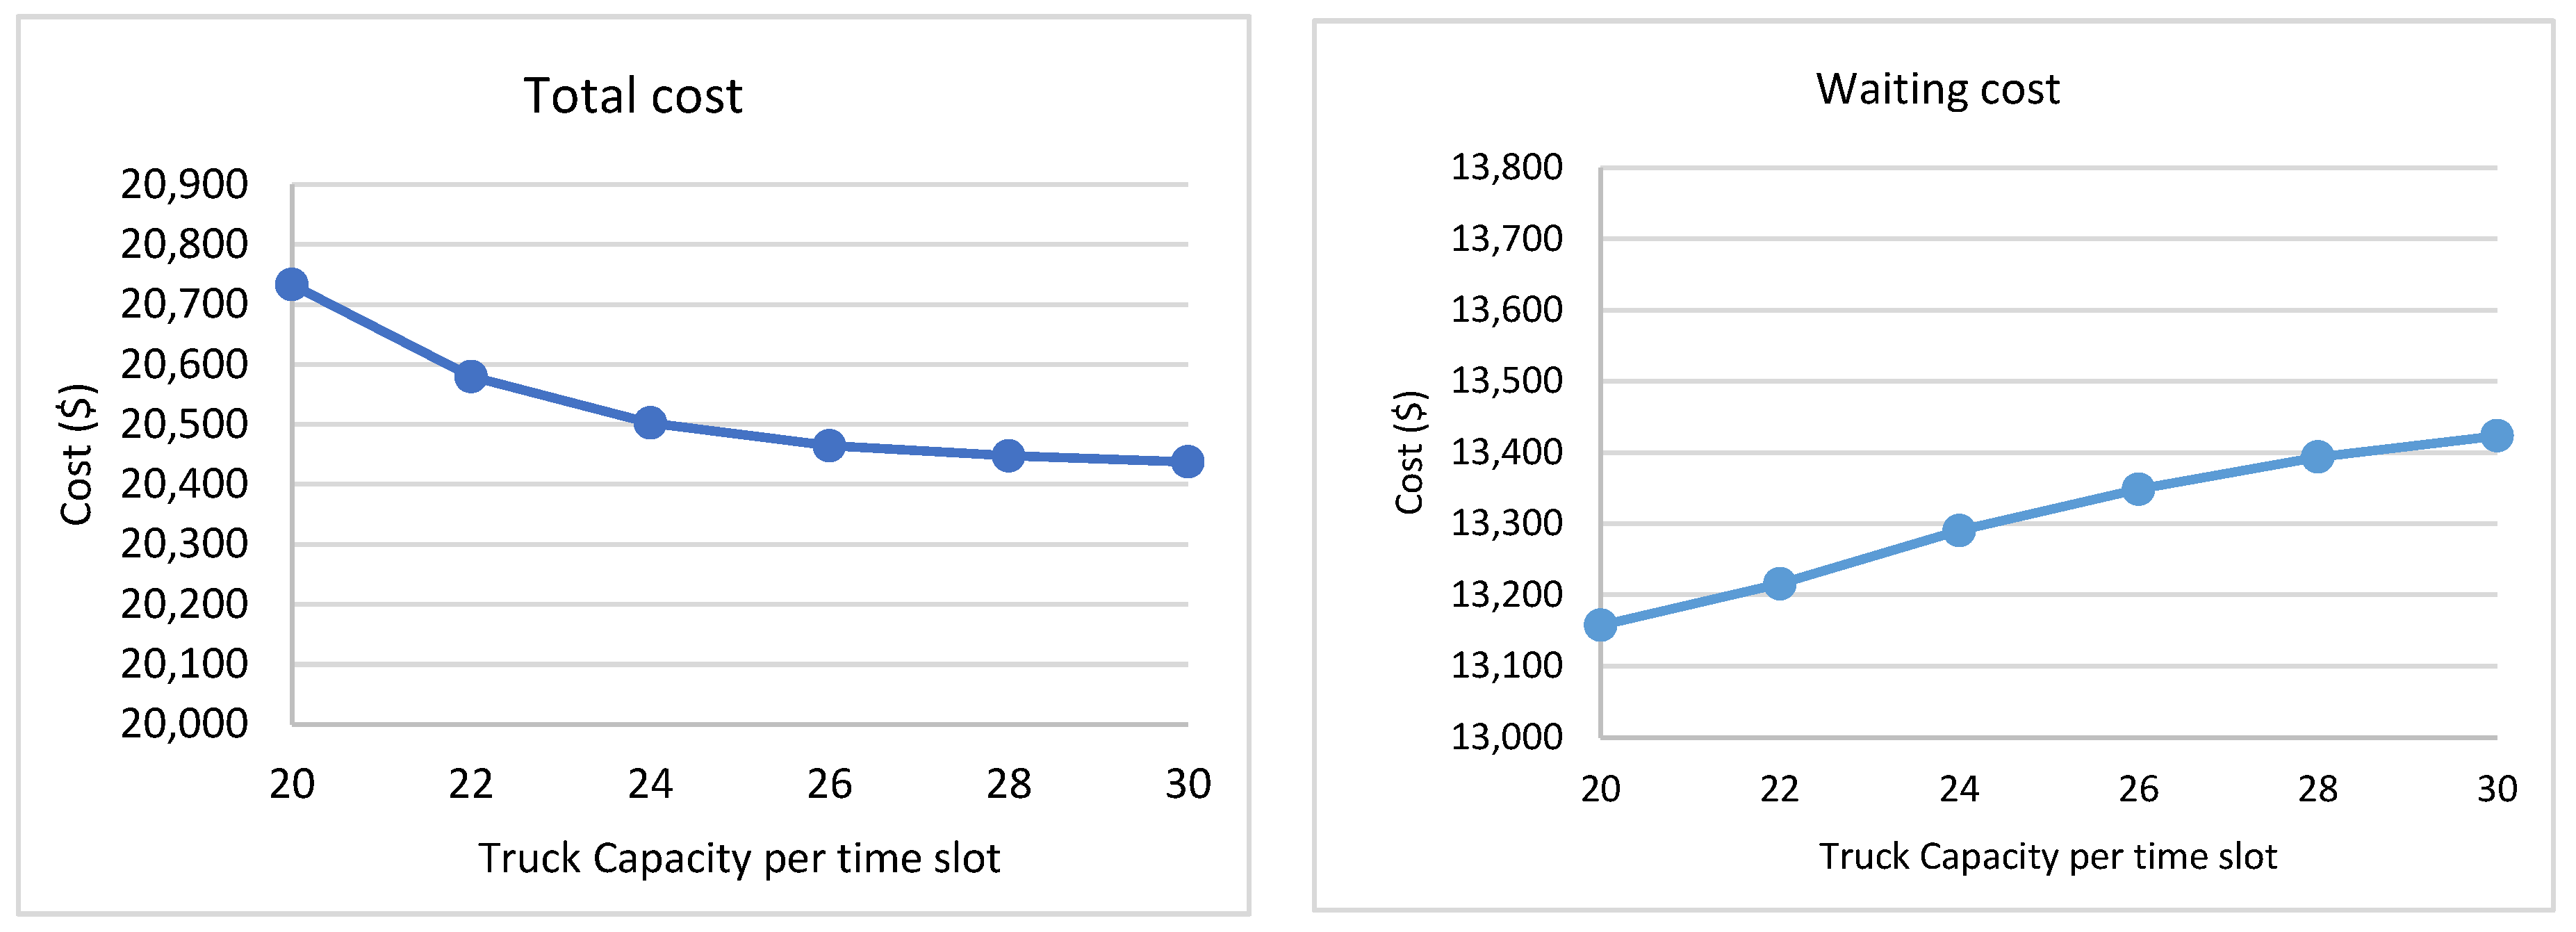
In this section, the investigation of the effect of changing the number of available trucks per time slot on the terminal workload is discussed. Also, a comparison between the original case and other generated scenarios was conducted to study the effect of varying the available number of trucks per time slot for the trucking company on the workload pattern and the total cost. A sensitivity experiment was applied to instance eight, since it has the largest workload of 475 tasks, to test the solution performance in the worst-case scenario. Table 11 summarizes the effect of changing the number of available trucks per time slot on each of the cost items as well as the total cost.
It can be concluded that increasing the available number of trucks made the total cost be decreased. As the number of available trucks increases, the delivery cost decreases while the waiting time cost increases. That is because restricting the number of available trucks results in more trips to the terminal to execute the required tasks. On the other hand, the waiting time cost decreases because of the low density of trucks. The demurrage cost remains stable at zero because all tasks are executed at the free of charge period (i.e., no demurrage fee).
Figure 6 shows the effect of the variation that occurred in the RHS of constraint (2) not only on the total cost but also on all cost parameters. By comparing scenario number 2 (as it has the minimum cost) with the original case (iteration 7), the percentage of increase in the total cost is 1.5%. In comparison, the rate of decrease in the waiting time cost is 2.4% by reducing the number of trucks. Also, the delivery cost increased by 9.2% after reducing the number of trucks.
From the above justifications, it could be deduced that the proposed model is responsive to the variation of the number of available trucks during each time slot. Therefore, both stakeholders try to balance the trade-off between the total costs and the number of trucks available. Also, the workload levels will be influenced if this parameter is changed.
From the CT perspective, it is vital to smoothen the workload to avoid congestion inside the terminal. Therefore, the effect of leveling the workload distribution along the planning horizon will be considered and presented in the next section.

5.2. Effect of Leveling the Workload on the Total Cost

From the previous discussion of the results, it could be concluded that there is a considerable variation in the number of trucks served along the planning horizon among most of the solved instances. This variation means that the terminal does not achieve high utilization of its resources. Bottlenecks are likely to occur because of the truck congestion in specific time slots, while other time slots are almost idle. Another adverse effect of uncontrolled workload during the working hours inside the terminal is the congestion either in the yard area or in the gate area.
Many traffic problems, especially in small cities and villages which suffer from poor quality of streets and rudimentary infrastructures, are resulting in tons of emissions that harm the environment. Furthermore, trucking companies are subjected to many penalties due to congestion. From the trucking companies’ point of view, the waiting times of trucks at the gate and yard and the fuel consumed due to this idle time costs a lot of money. Besides, the delay in vehicles may lead the trucking companies to reject a new dispatching order because of the shortage of trucks. That is why it is advantageous to balance the workload pattern to overcome all the previously mentioned issues. The leveling constraint is formulated as follows:
i U b B X i b s i U b B X i b s + 1   0                         s   ϵ   S ,   i f   s < S
Constraint (8) aims at reducing the variation of truck densities among all-time slots, smoothing the workload pattern inside the terminal.
Table 12 shows the results of leveling the terminal workload. It can be seen that the workload level of the terminal becomes more stable. Although the objective function value is slightly increased, the congestion inside the terminal is avoided. There are many positive sides to leveling the workload. Even though the costs are higher compared to the case before leveling, the Truck Turnaround Time (TTT) decreased, which enables trucking companies to compensate for the spent expenses by accepting more dispatching orders.
Based on the above facts, analyzing the results will generate a clear view of the impact of implementing the balancing constraint on the proposed model to enhance the utilization of the terminal. Therefore, a comprehensive comparison is conducted in the next section to investigate the terminal workload curve before and after applying the balancing constraint on the proposed model.

5.3. Effect of Applying the Leveling Constraint on the Lowest Workload Instance (Instance 13)

Some experiments were performed on selected instances to understand the impact of balancing the workload patterns inside the terminal. Choosing instance 13 goes for having the lowest workload among all instances.
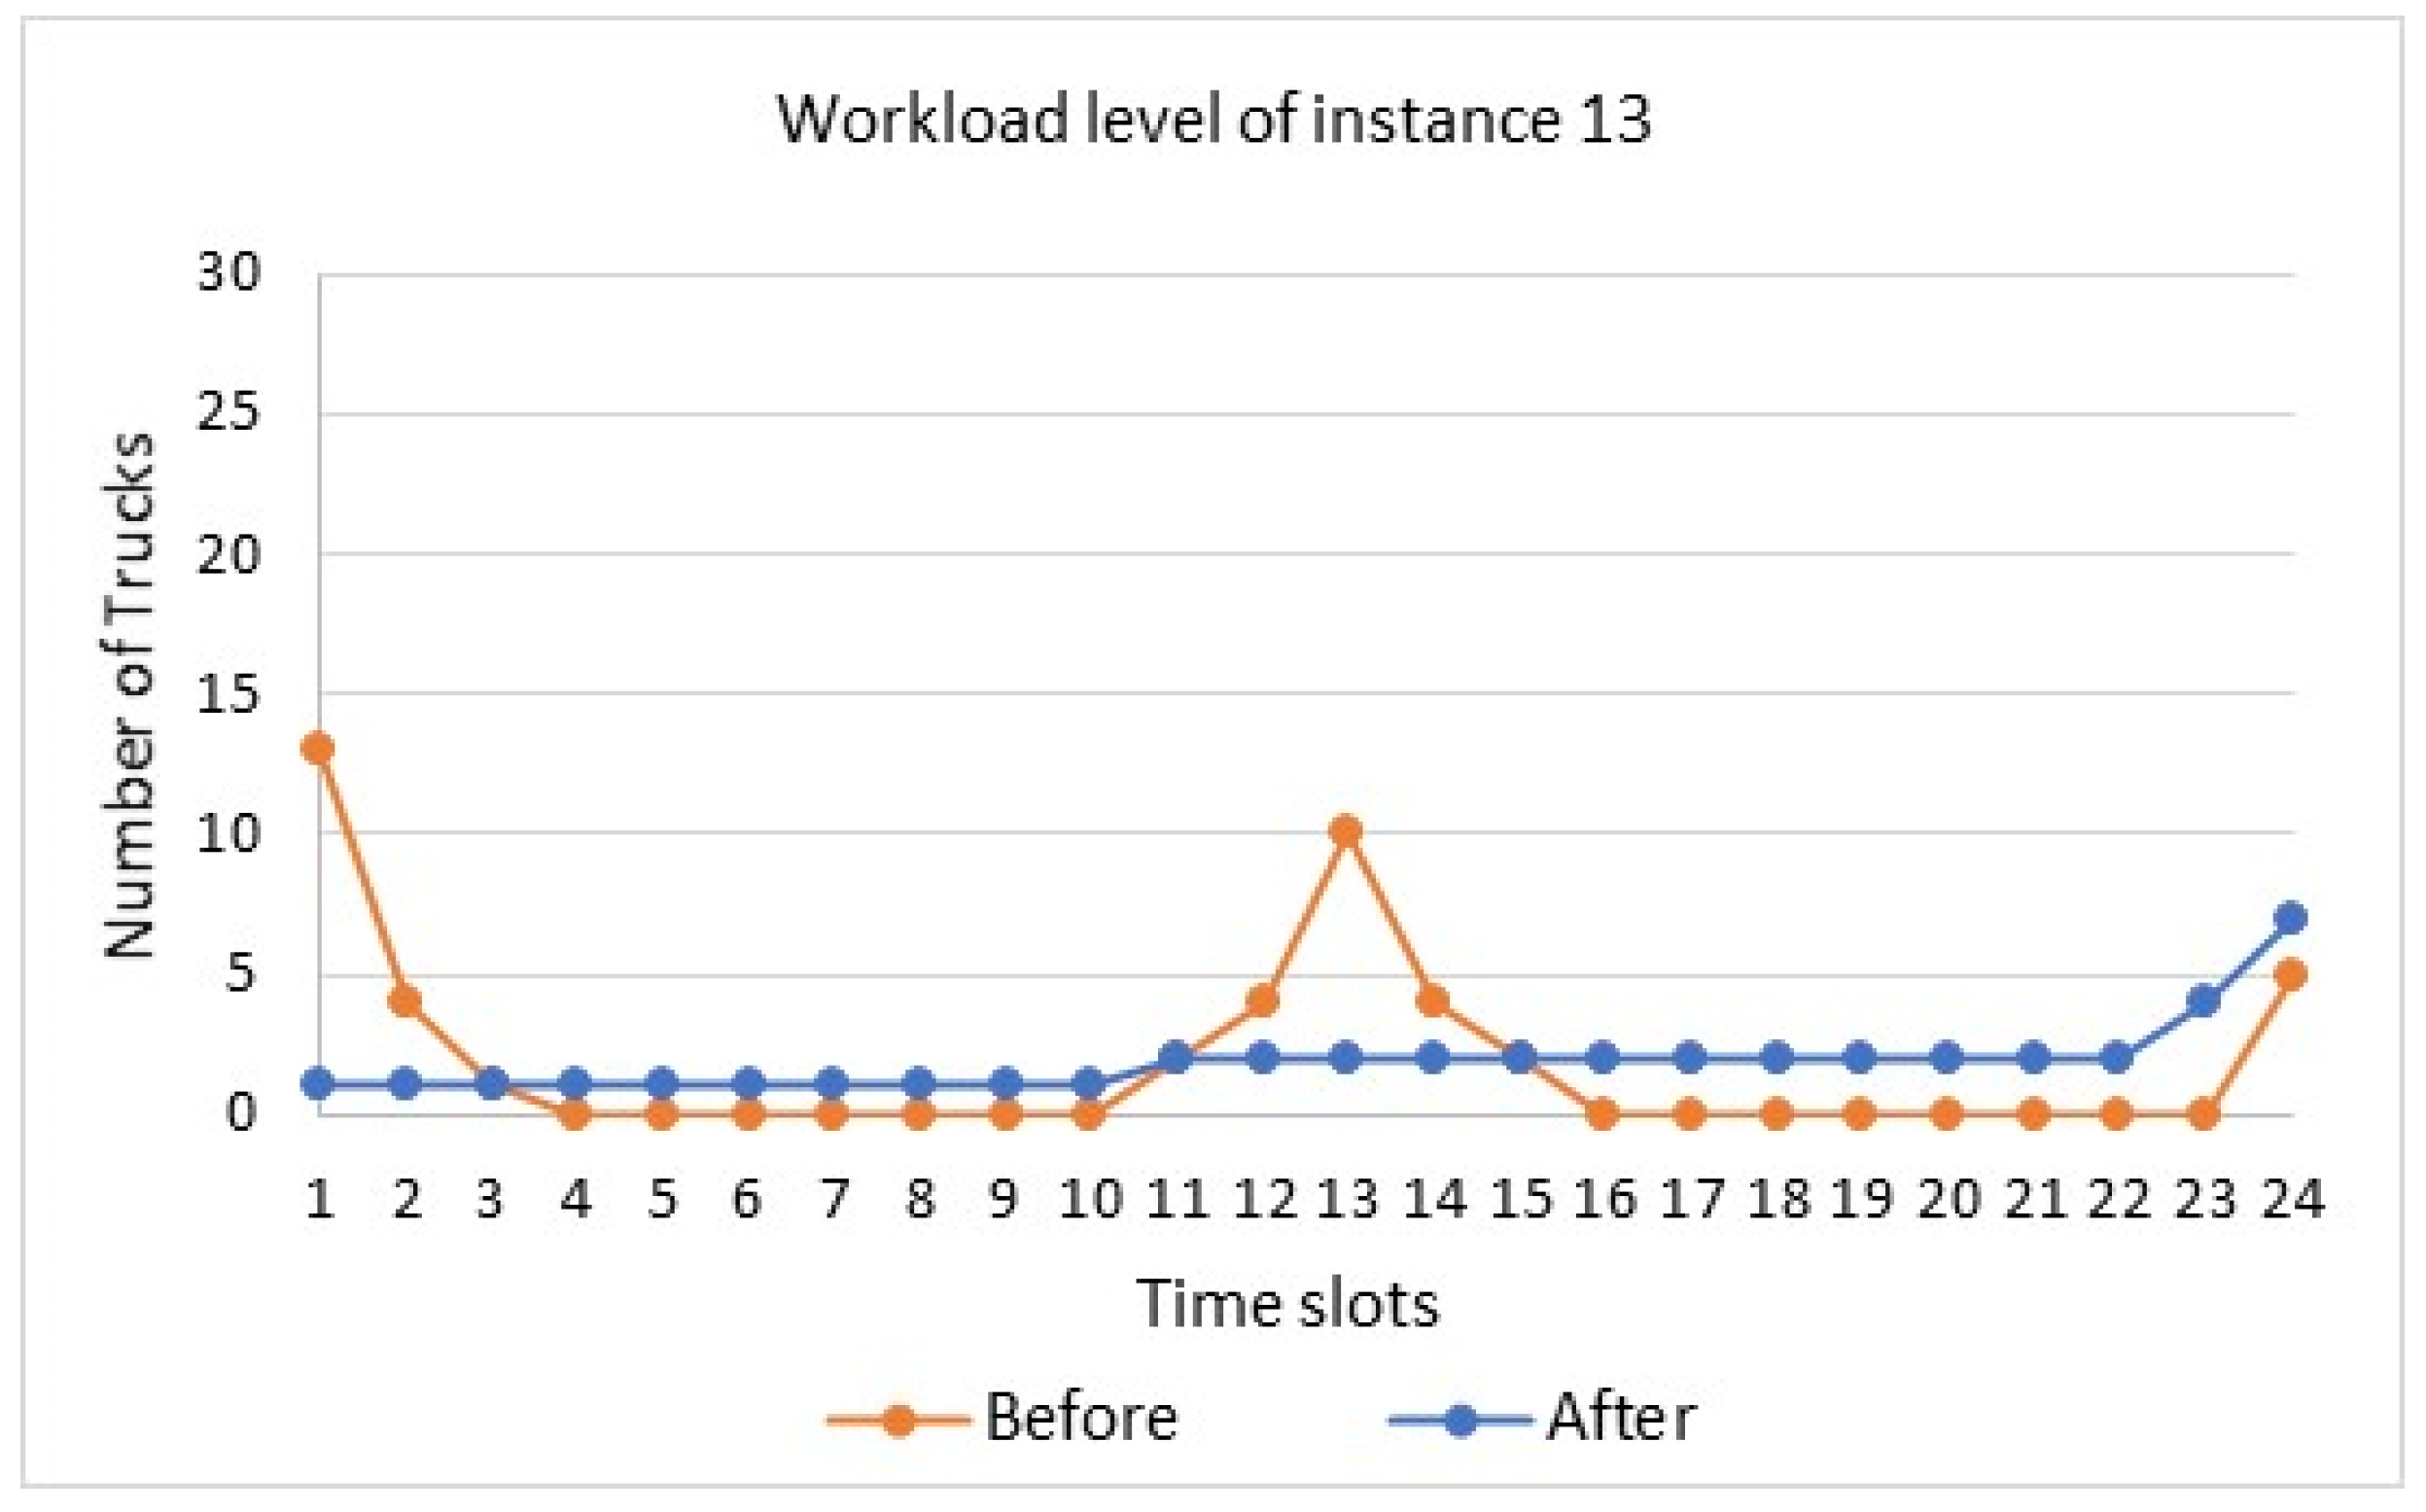
Figure 7 represents the variation that occurred in the terminal workload curve after redistributing the trucks upon the time slots. What is striking in this figure is the stability of the workload after applying the proposed constraint. The graph shows a significant difference between the two workload patterns. A considerable number of trucks are assigned to deliver containers to the terminal in time slots 1 and 13. In contrast, the terminal will not receive containers in other time slots (e.g., 4–9) causing a long idle time of terminal resources and, consequently, a low utilization level.
On the other hand, the workload pattern is leveled after implementing the suggested constraint. No peaks and valleys are observed in the workload pattern, which refers to the constant rate of truck arrivals to the terminal.

5.4. Impact of Using Leveling Constraint on the Highest Workload Instance (Instance 8)

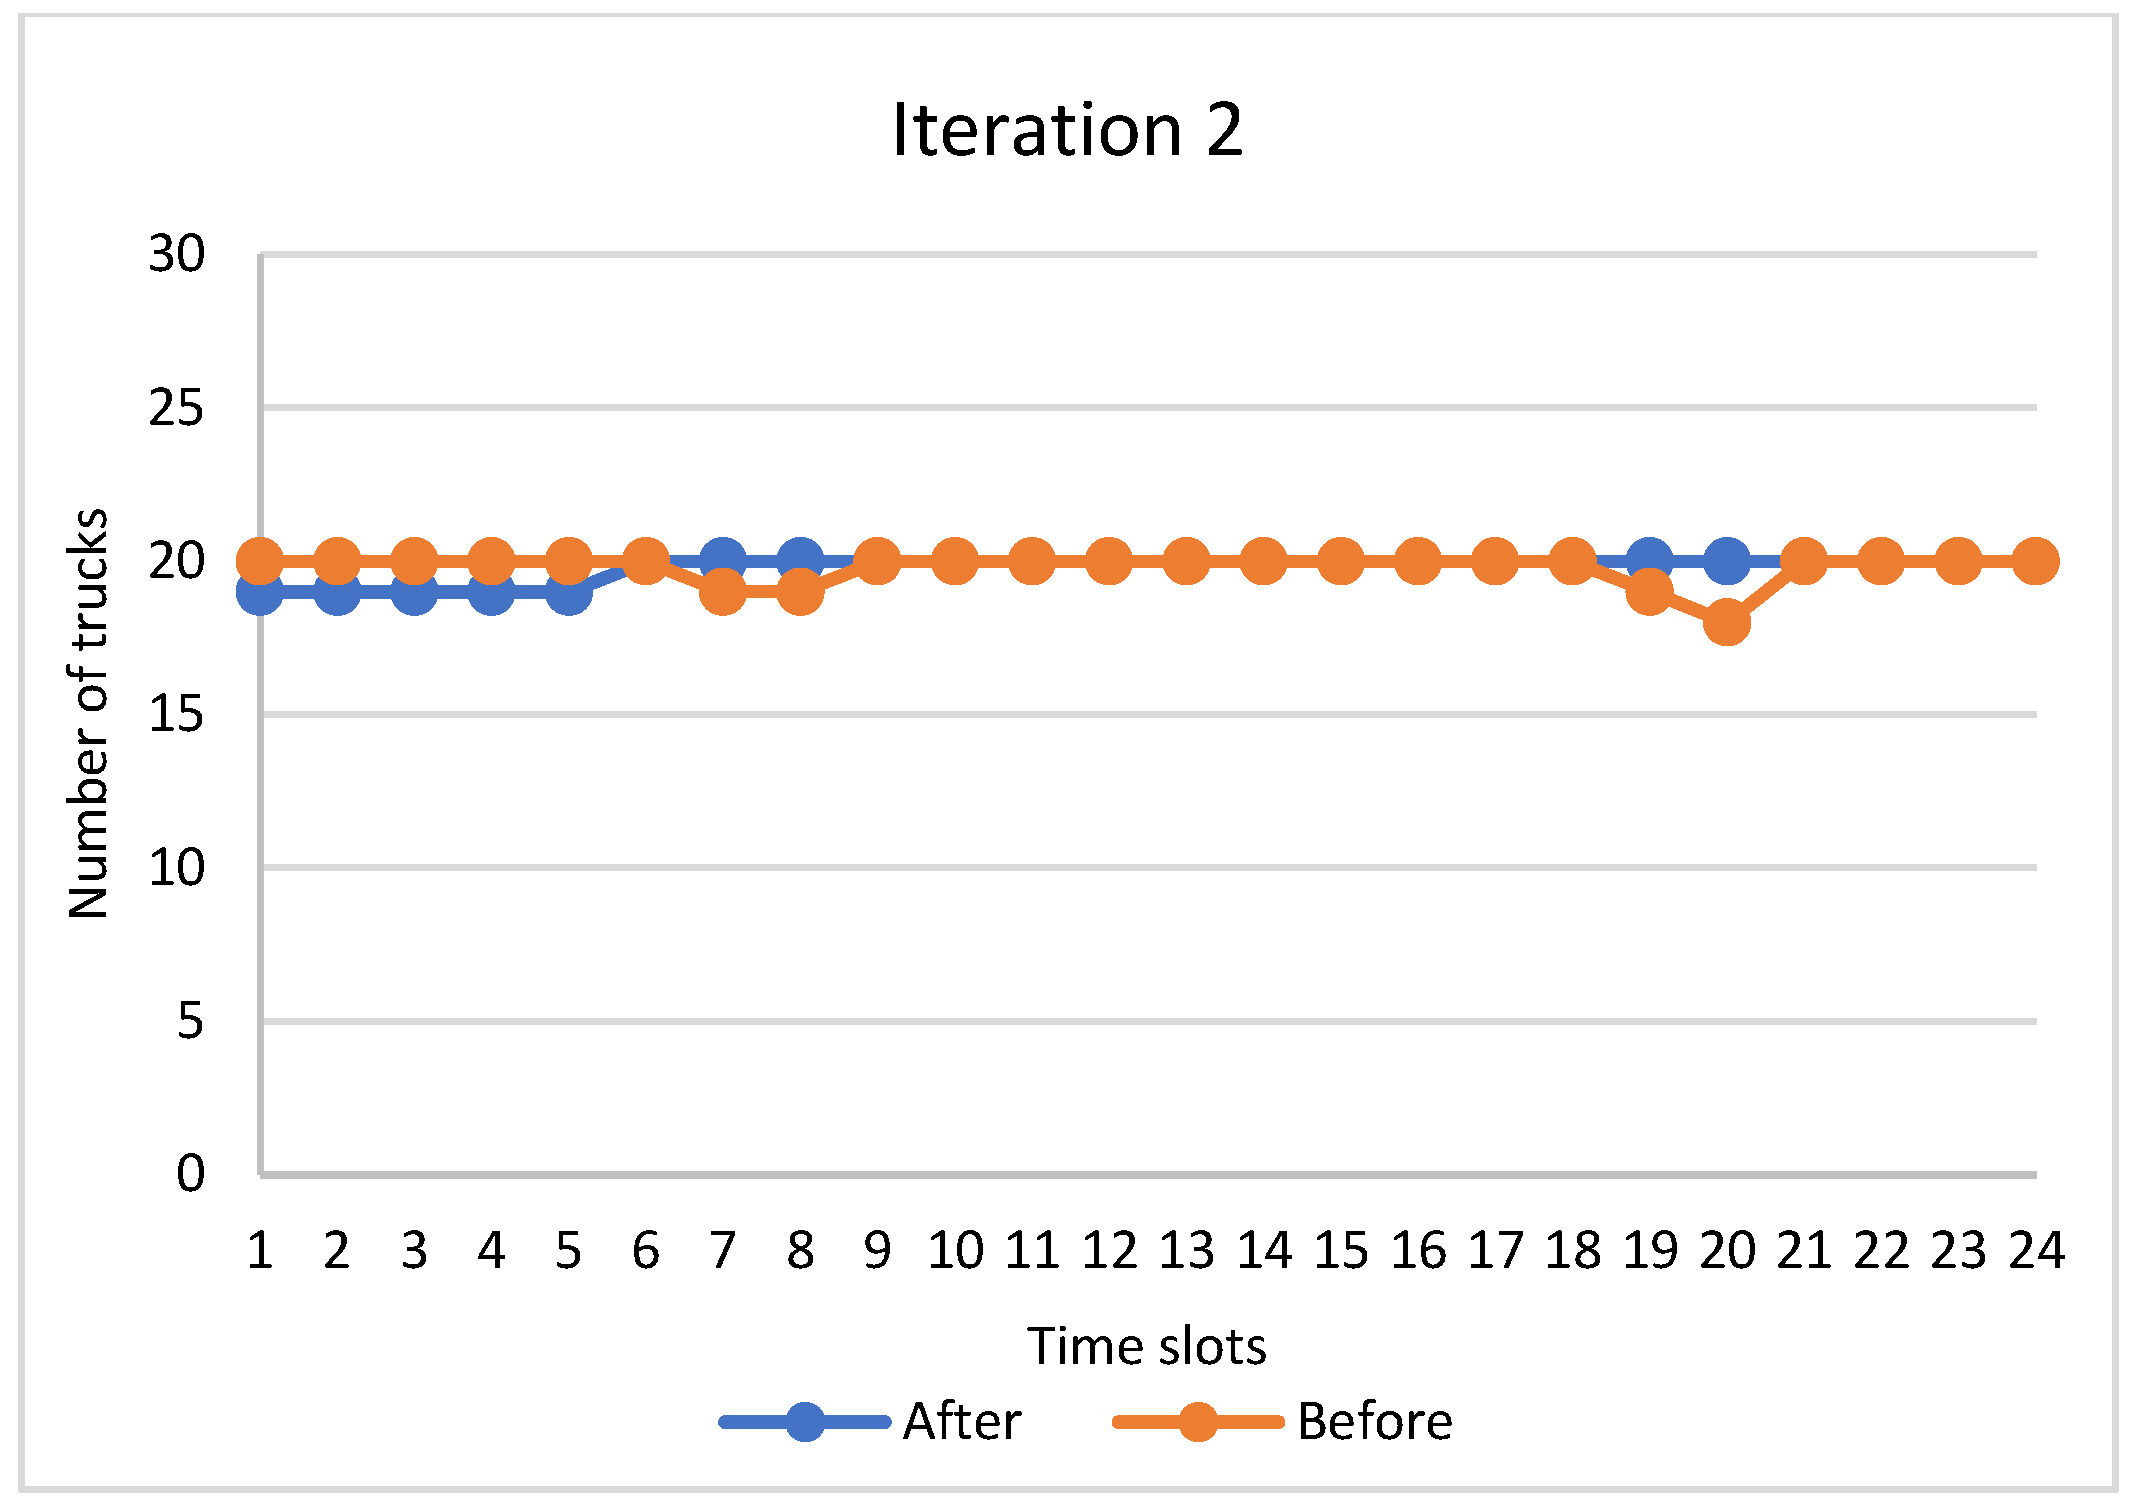
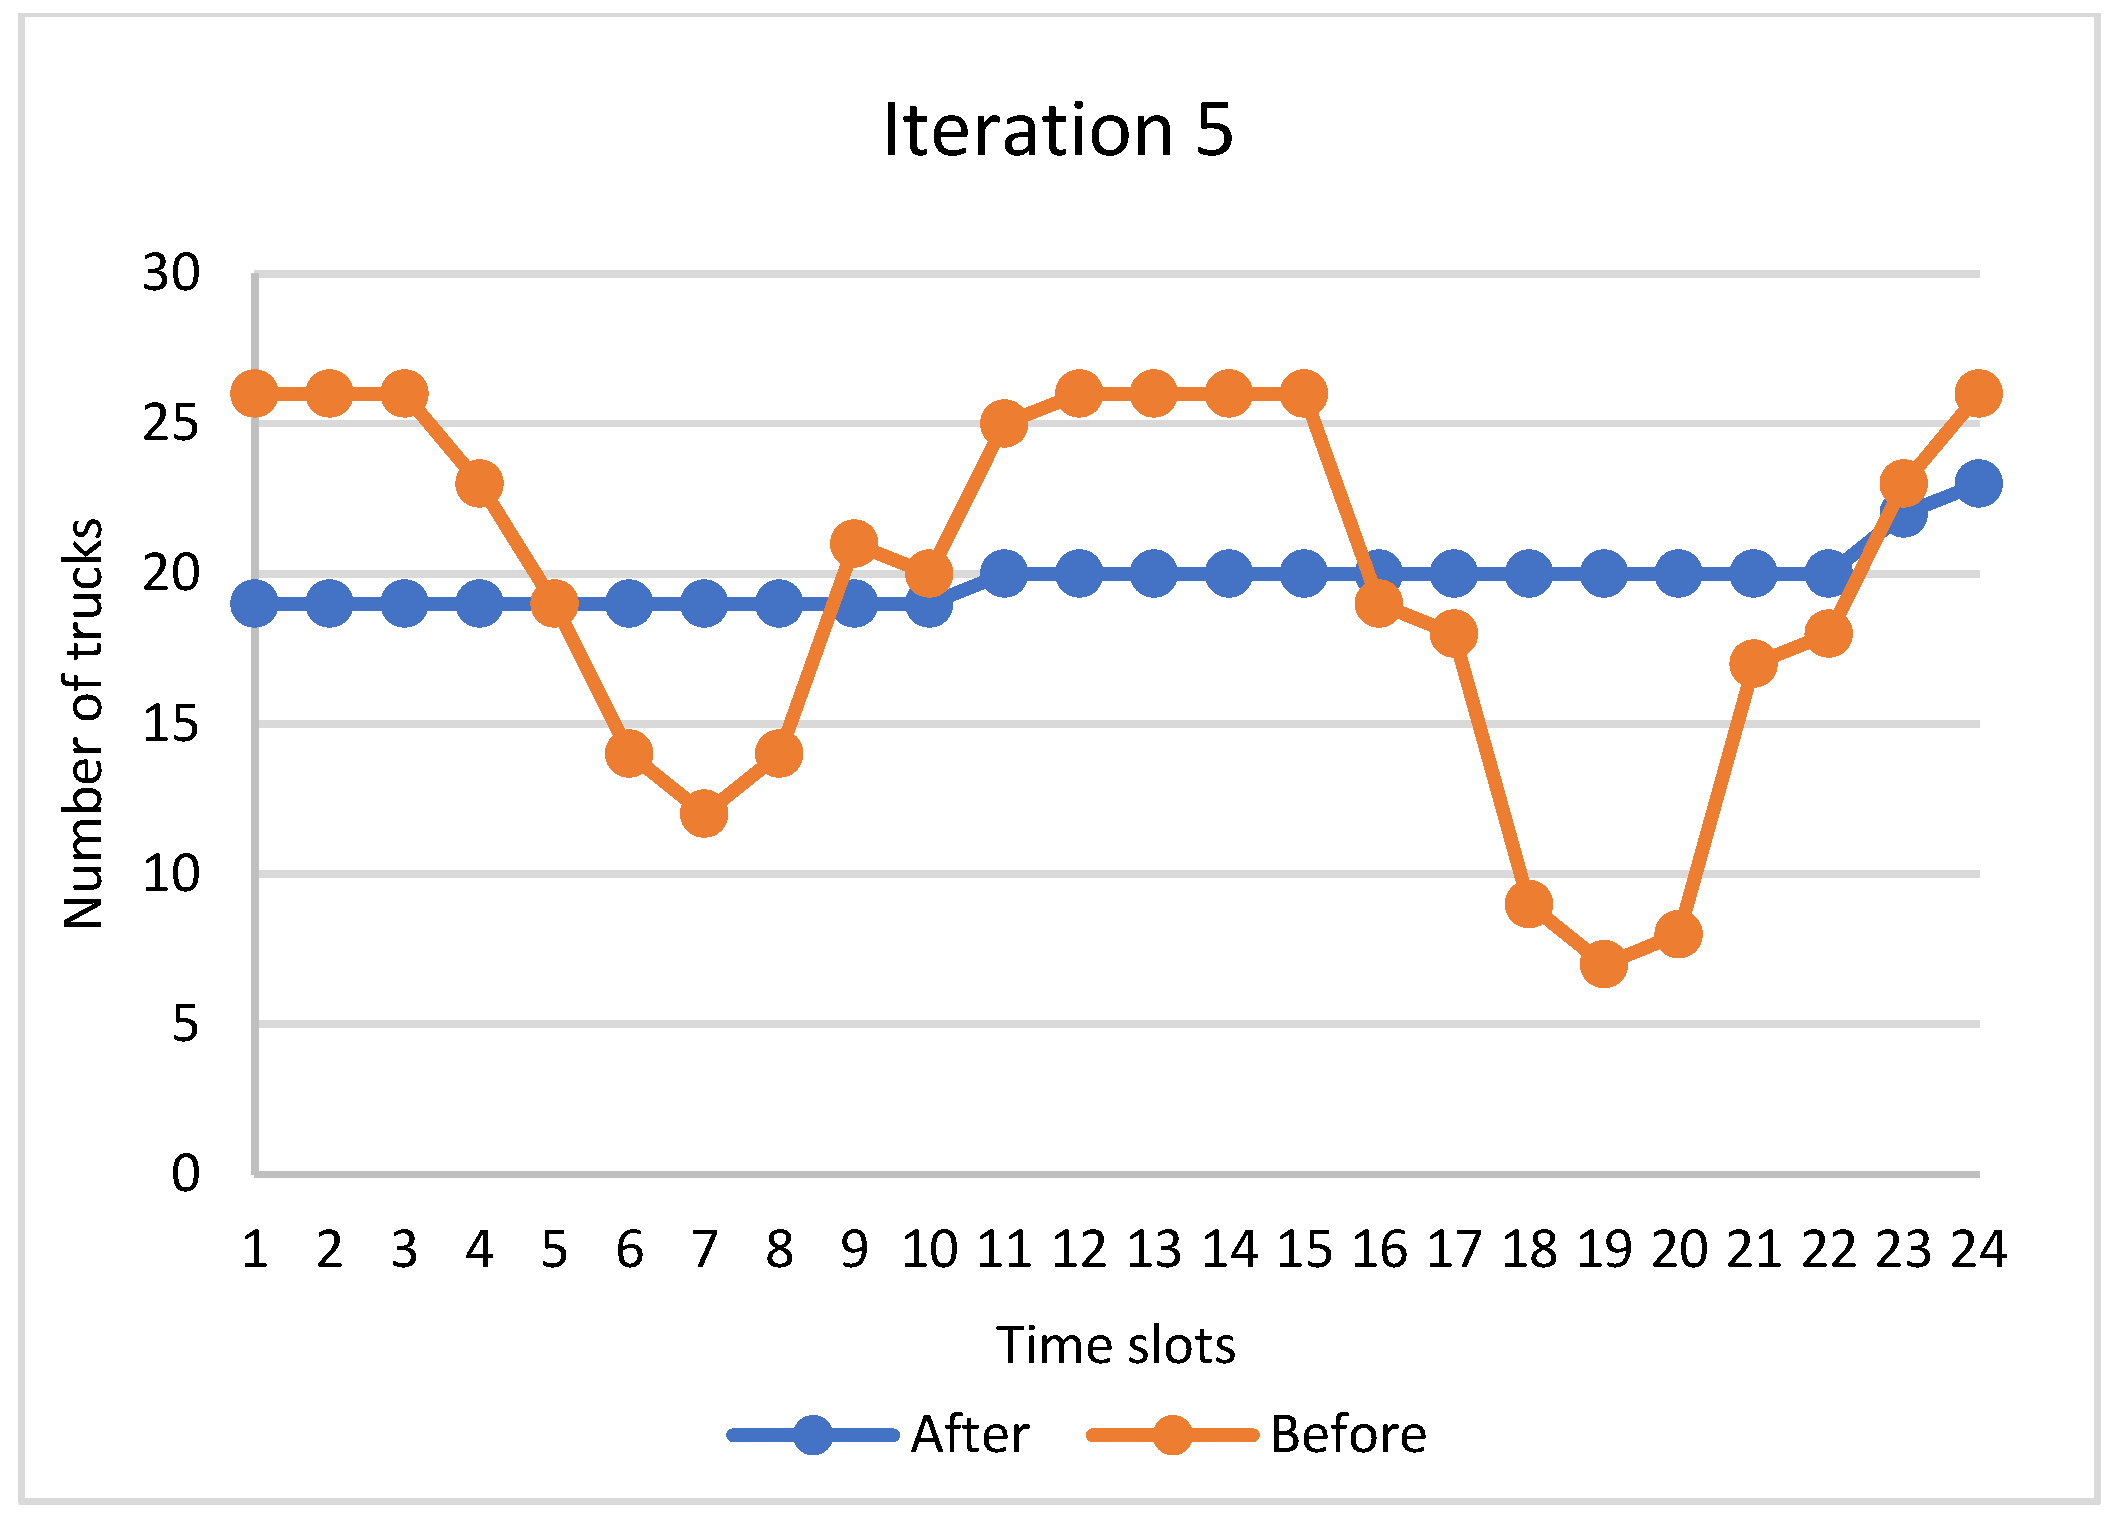
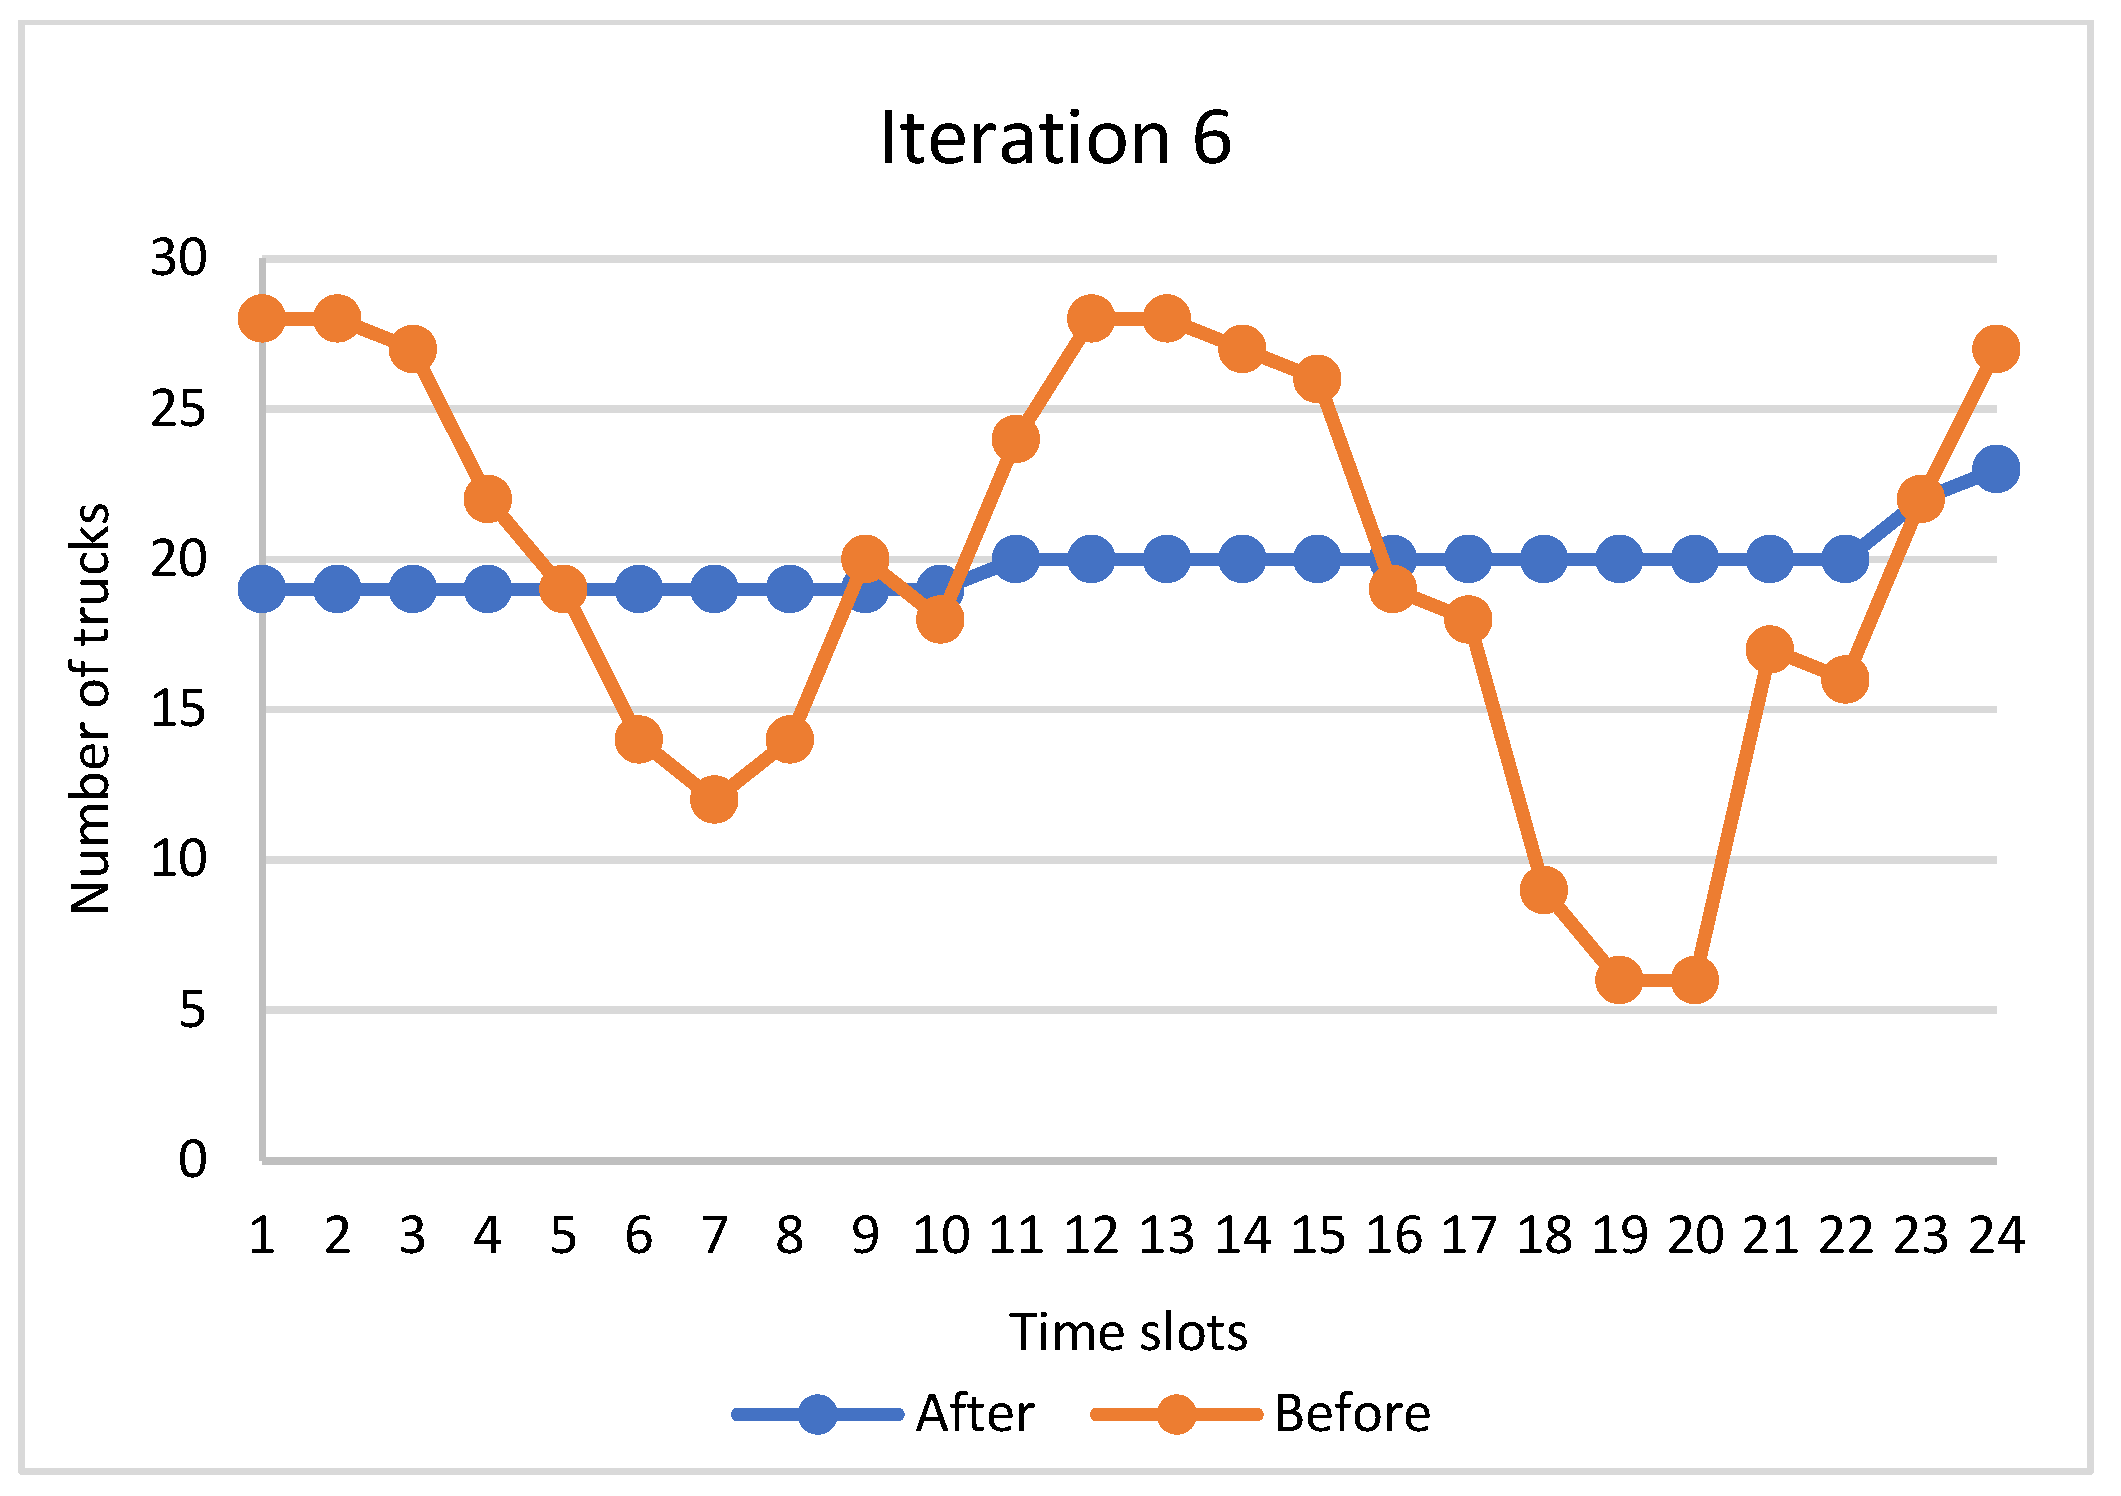
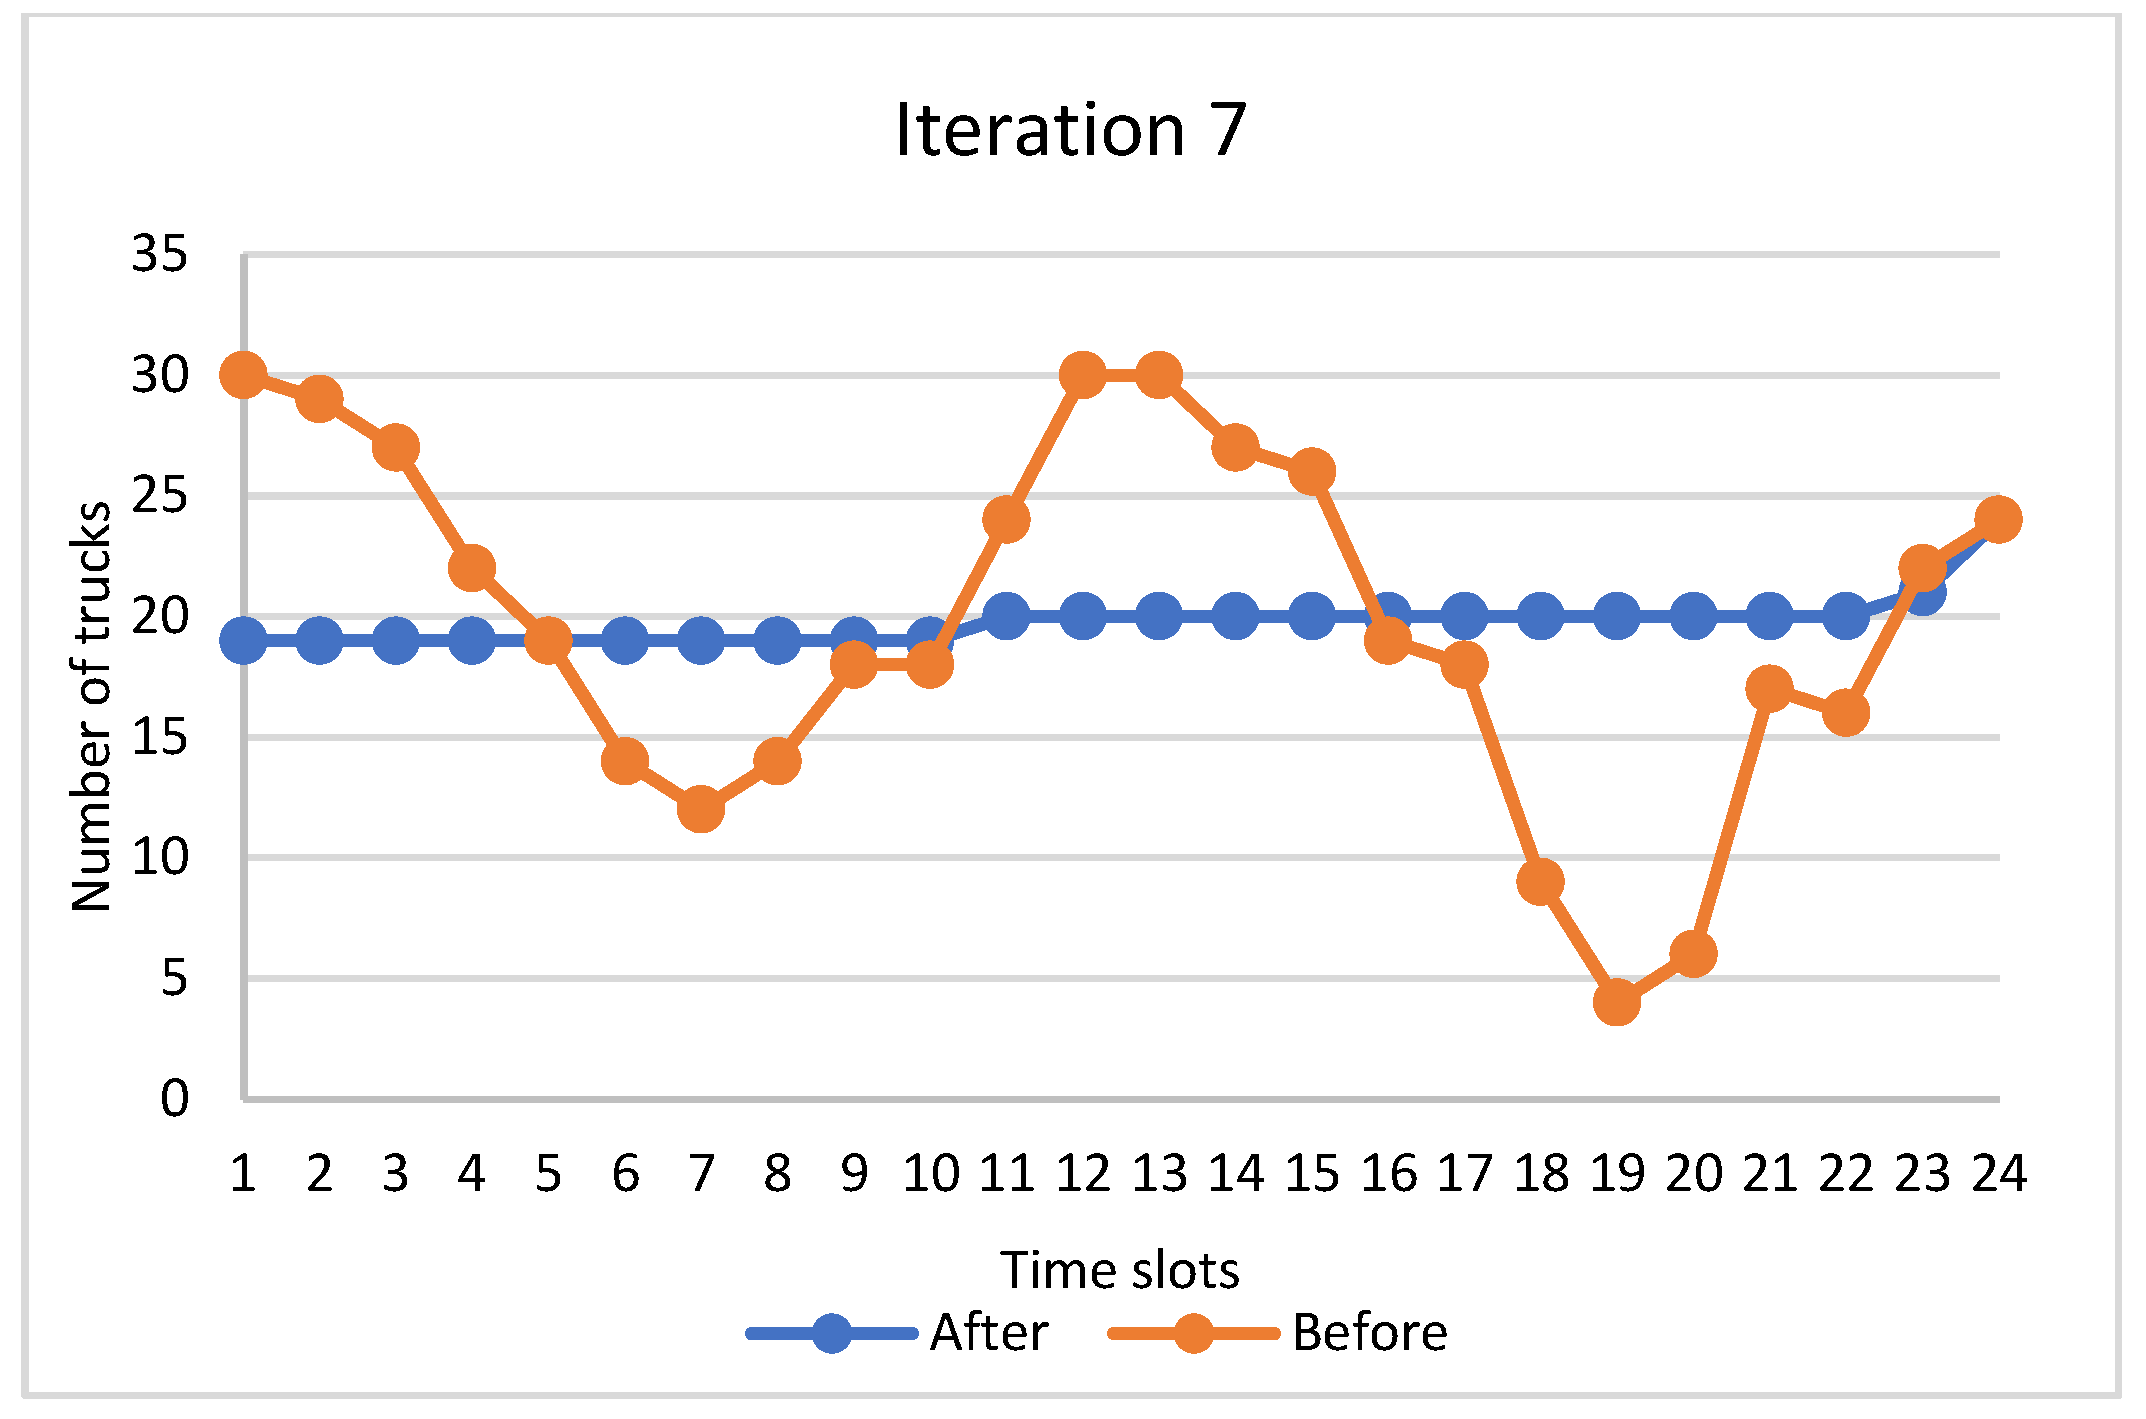
The same procedure was performed on instance 8, which incorporates the highest workload. The previously mentioned scenarios were tested with the leveling constraints (refer to Table 8). Figure 8, Figure 9, Figure 10, Figure 11, Figure 12 and Figure 13 show the workload of the container terminal before and after applying the leveling constraint. Before leveling, it is noticeable that in Figure 8, the workload curve almost has no peaks (constant workload level) in all-time slots, which confers higher utilization of all the terminal resources. However, this scenario results in the highest total cost among all other scenarios due to the limited number of trucks compared with the required tasks per each time slot. While in the case of iteration 7, the workload level is not stable because there are plenty of trucks that can execute the required tasks during each time slot.
On the other hand, Figure 9 shows a slight change in the workload pattern of iteration two after adding the new constraint. The rest of the iterations clarify the effect of the constraint on workload pattern inside the terminal in each scenario presented in Table 8. It could be noticed that the level of workload during the working hours for all iterations is almost steady. The minimum workload level is 19 trucks for each time slot. Although the workload level slightly increased in some time slots among all iterations, no peaks or valleys are observed in the workload patterns, which results in a stable workload, and high utilization of the resources.

5.5. Impact of the Leveling Constraint on the Total TTT for the Proposed Scenarios of Instance 8

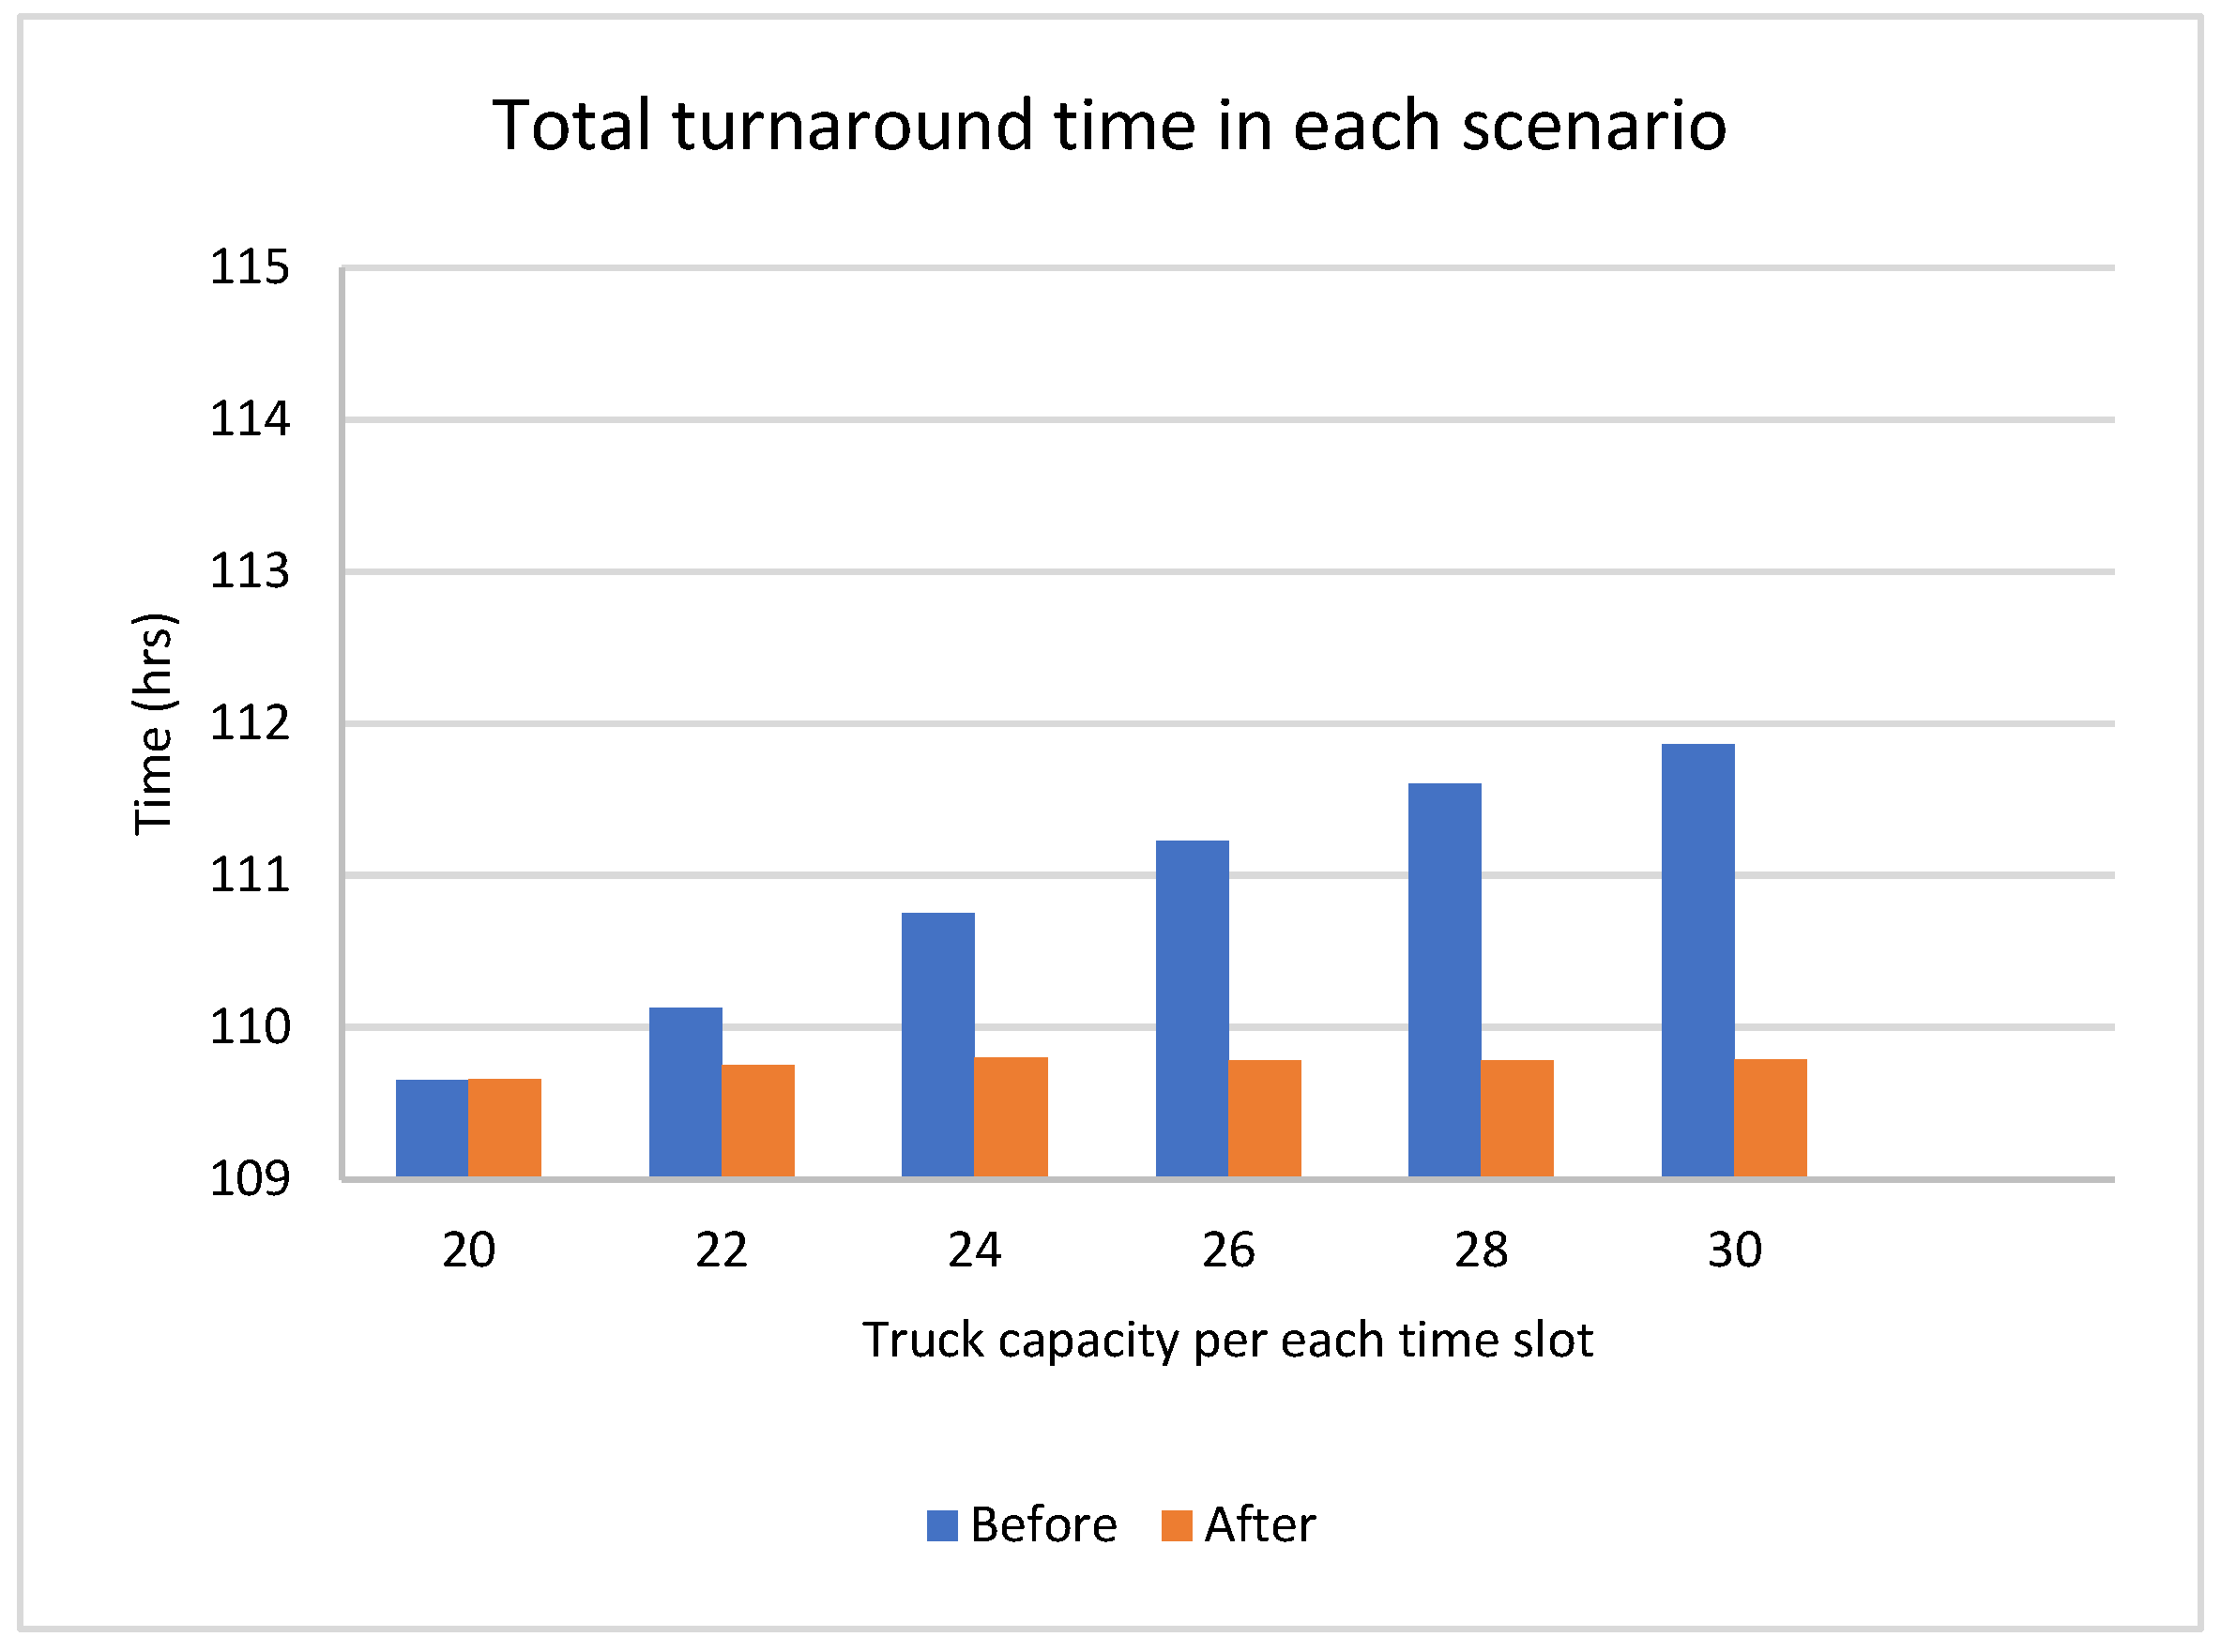
Leveling the workload pattern of the terminal has several effects on all stakeholders. From the terminal manager’s perspective, it guarantees that all resources are exploited optimally. Moreover, it preserves the truck densities inside the terminal to avoid congestion. Likewise, it is beneficial for trucking companies because it reduces the total TTT. Figure 14 shows the effect of the proposed constraint on the total TTT in each scenario. The higher the available trucks per time slot, the more the reduction percentage of total TTT, which is revealed in Figure 15. Hence, leveling the workload is very useful for decreasing the TTT, especially with a high number of available trucks.

5.6. Impact of the Leveling Constraint on the Cost for the Proposed Scenarios of Instance 8

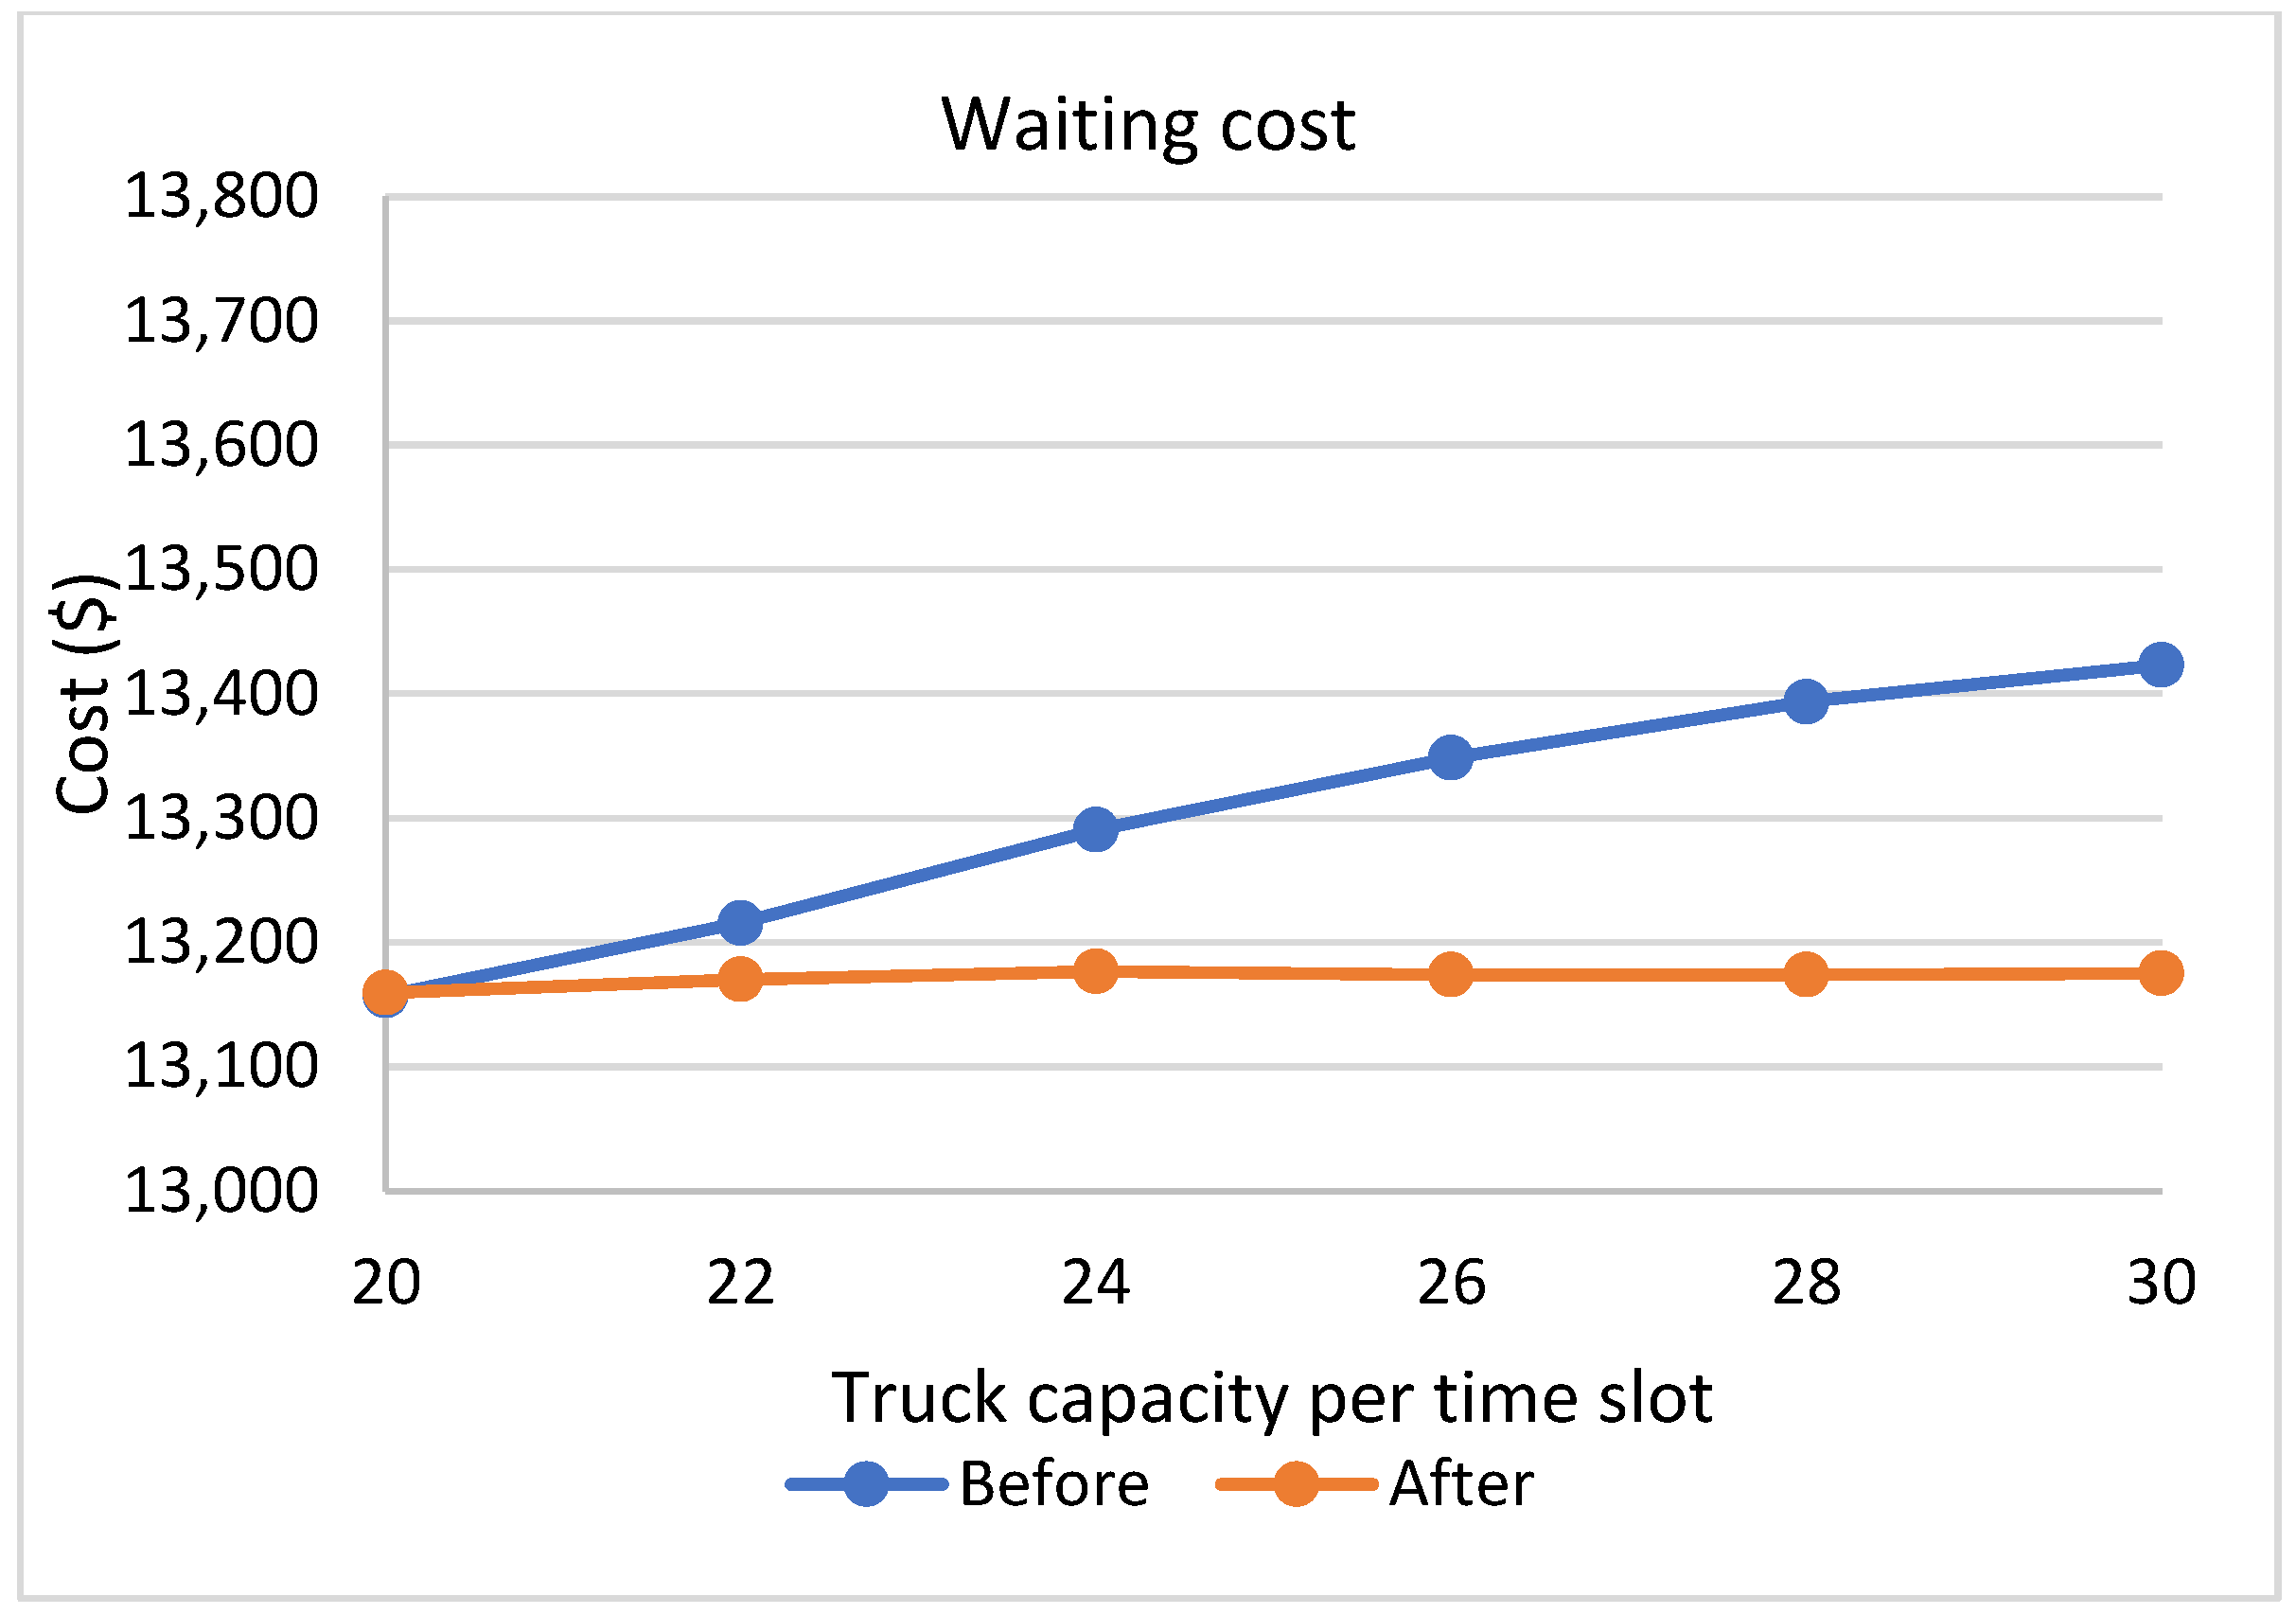
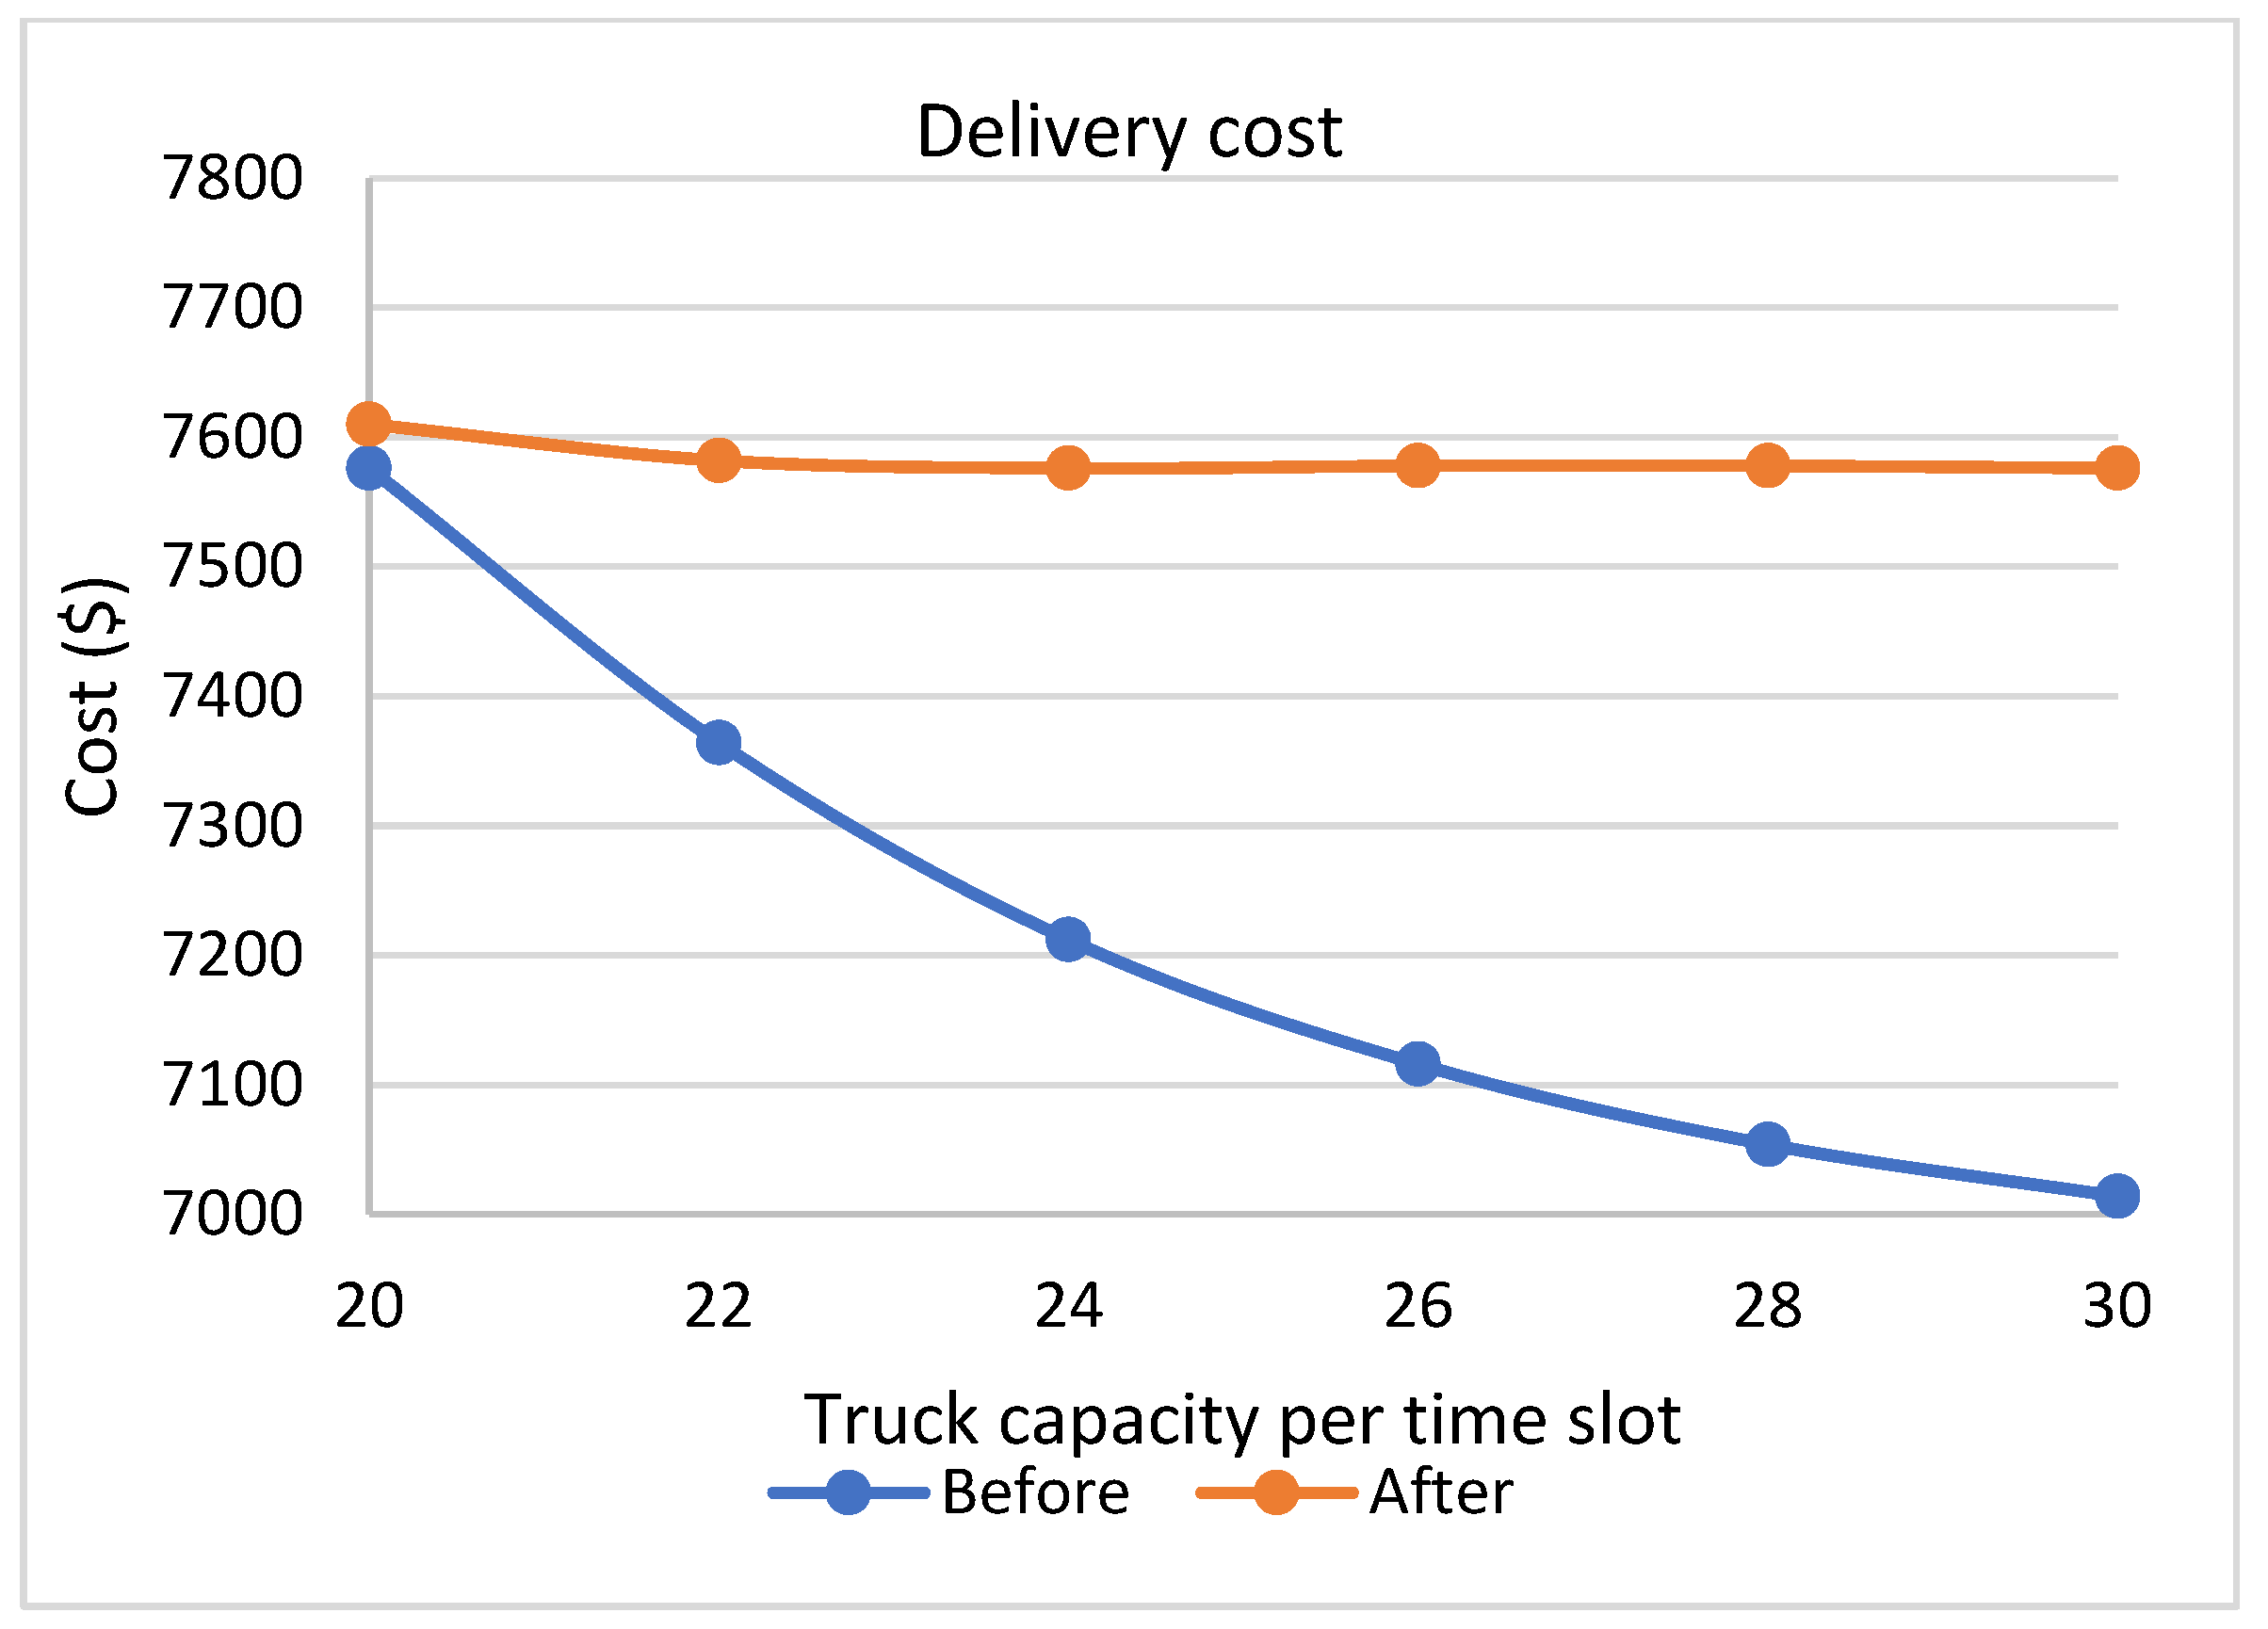
By investigating the effect of leveling the workload on the objective function value and its components in all the scenarios, it can be deduced that the total costs become higher after leveling. The objective function values after modifying the workload are close, owing to the leveled workload pattern (see Table 13). Figure 16 indicates the difference occurred in the value of the objective function for each scenario. As mentioned before, the change in the total cost is not significant by balancing the workload, especially in iterations 3, 4, 5, 6, and 7. Therefore, the change is not that much, so we can say that the effect of leveling on the cost is negligible. Figure 17 represents the reduction of waiting time costs before and after leveling the workload. Since the total TTT is decreased, the resulting waiting costs are consequently reduced in all scenarios as well. As shown in Figure 18, leveling the workload in the terminal may cause higher delivery costs due to the increasing consumption of the trucks, which leads to higher driving, maintenance, fuel, and overhauling costs.

5.7. Impact of Leveling the Workload on the Total TTT of All the Instances

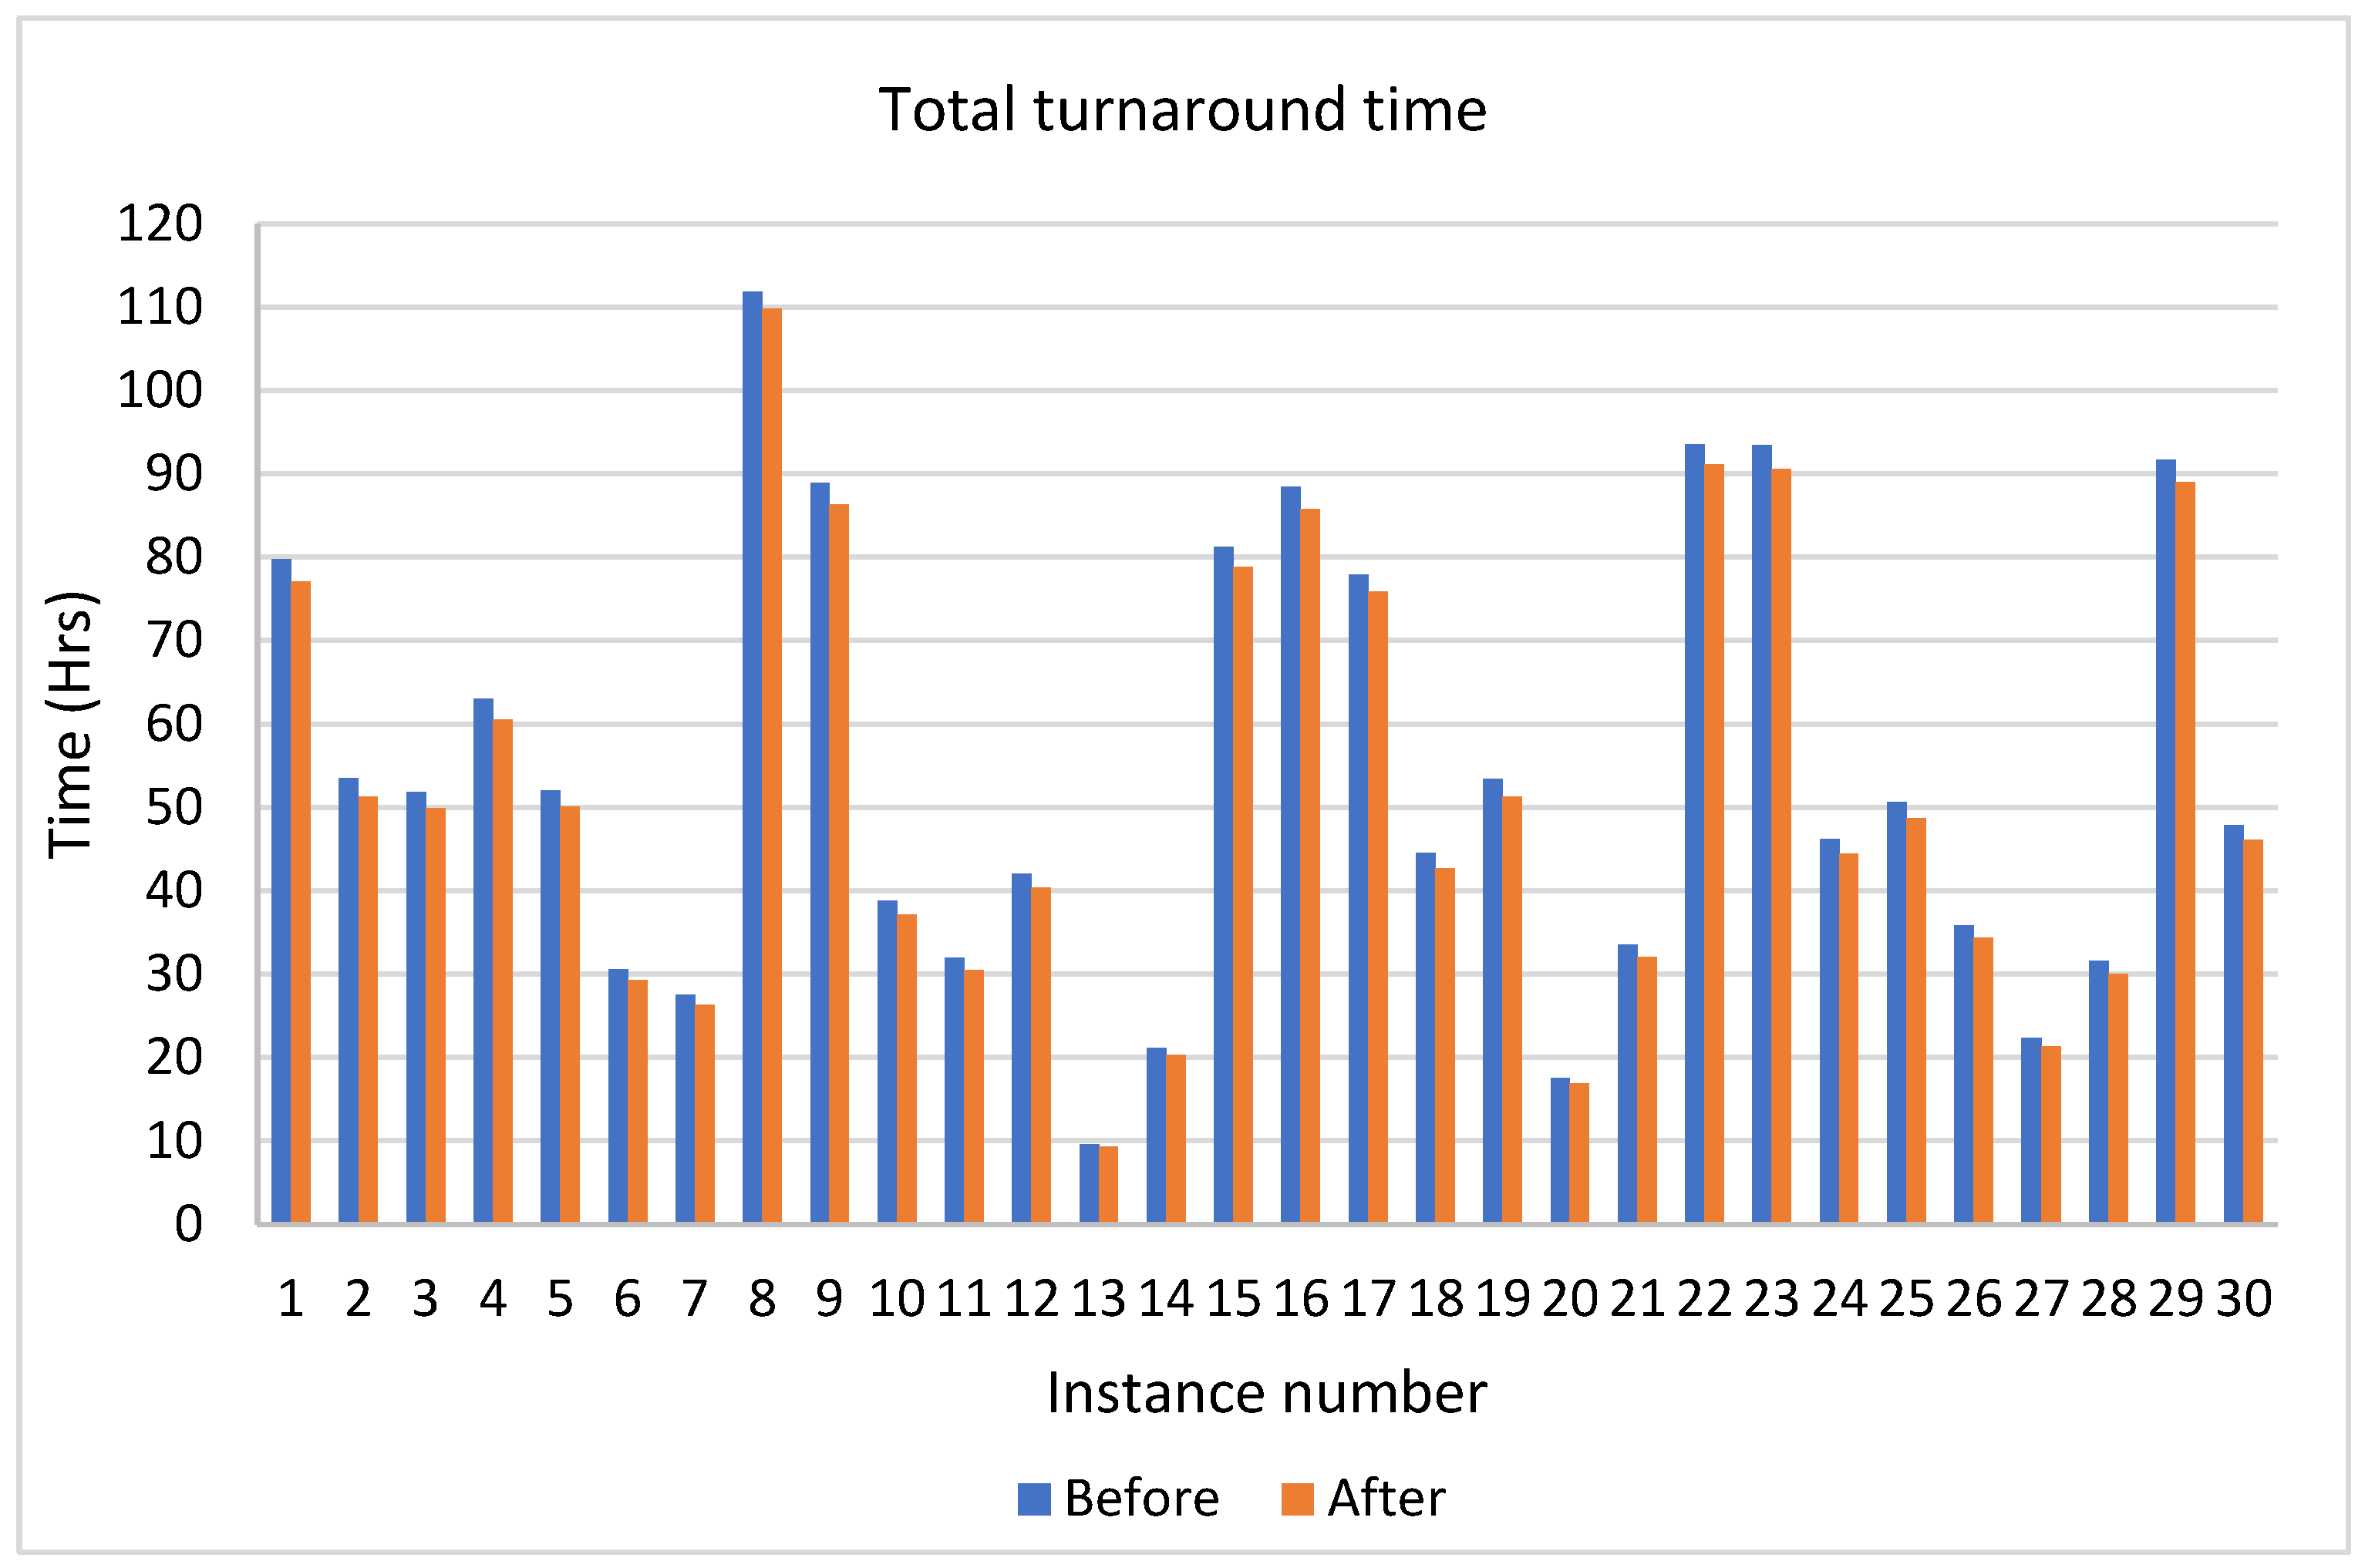
In this section, the total TTT is measured in all instances before and after balancing the workload to verify the performance of our model. From Figure 19, It can be seen that the total TTT decreased in all cases. Figure 20 is constructed to feel the significant effect of the proposed model. It is noticeable that the maximum reduction of the total TTT has resulted in instance 28, reaching 4.9% compared with before leveling. While the minimum percentage of reduction is 1.9%, which is recorded in instance 8.
Based on the above results, we can conclude that smoothing out the workload pattern is beneficial for both container terminals and trucking companies. Container terminals avoid bottlenecks and high truck densities in the terminal gate and yard. Also, it reduces the total TTT, and consequently, trucking companies will be able to achieve more dispatching tasks.

6. Conclusions and Discussion

Since the expansion of seaborne trade has led to the presence of large vessels at CTs, consequently, terminal managers relentlessly seek to alleviate the congestion to avoid bottlenecks, especially during peak periods. Truck Appointment Systems create a communication channel between the trucking companies and container terminals to fulfill the ultimate benefit for both parties. The collaboration between them results in better workload levels, fewer traffic problems inside and surrounding the terminal, high utilization of terminal resources, and more throughput.
Similarly, the trucking company could exploit all its resources efficiently without having high costs while performing the container transporting tasks. In this paper, a linear integer programming model was implemented and solved. The mathematical model investigated the truck appointment scheduling problem to minimize the total cost. Also, it was validated and tested using 30 instances from the literature. The obtained results showed a significant effect of applying the presented model on the workload distribution as well as reducing the total cost. An optimum scheduling of appointments leads to reduced TTT and maintaining the utilization of terminal resources. Besides, smoothing out the workload pattern results in low possibilities of congestion. A sensitivity analysis was performed to compare multiple scenarios and monitor the effect on both the total cost and the workload.
After testing the proposed mathematical model for reducing the total cost, a new constraint was formulated to control the truck densities inside the terminal. The leveling constraint aims at mitigating the congestion in the yard areas in addition to reducing the total TTT. In other words, the new constraint makes our model consider both stakeholders to achieve the ultimate benefit of their resources. When the total TTT decreases, the trucking companies could earn more money by exploiting the available trucks in new pickup/delivery tasks because the vehicles will achieve the assigned jobs with less time. Therefore, the presented model considers reducing the congestion inside the terminal in addition to reducing the total cost.
It can be deduced that for the terminal managers and the trucking companies, it is a trade-off between the total cost and controlling the workload level inside the terminal to achieve the best use of the resources and avoid bottlenecks. A comparison between the results before and after applying the new constraint stated that the total cost is slightly increased. However, still, in return, the TTT is decreased, and the resources’ utilization is increased significantly.
For future work, the model may be expanded to cover more cost terms related to trucking companies. For instance, this can be achieved by manipulating the objective function to consider the waiting time cost at the terminal gate. Moreover, measuring the system time, which combines the waiting time at the yard in addition to the service time, from a real terminal to make the model more realistic. Additionally, another future direction of research can be realized by considering the stochasticity of time parameters using Sample Average Approximation (SAA) methods to deal with stochastic optimization models.

Author Contributions

Conceptualization, A.M.A.; methodology, A.M.A.; software, A.M.A.; validation, A.M.A., M.G. and A.E.; formal analysis, A.M.A., M.G. and A.E; investigation, A.M.A., M.G. and A.E; resources, A.M.A., M.G. and A.E; data curation, A.M.A., M.G. and A.E; writing—original draft preparation, A.M.A.; writing—review and editing, A.M.A., M.G. and A.E; visualization, A.M.A., M.G. and A.E; supervision, M.G. and A.E; project administration, Not applicable; funding acquisition, Not applicable. All authors have read and agreed to the published version of the manuscript.

Funding

This research received no external funding.

Institutional Review Board Statement

Not applicable.

Informed Consent Statement

Not applicable.

Data Availability Statement

Not applicable.

Conflicts of Interest

The authors declare no conflict of interest.

References

  1. International Chamber of Shipping. Available online: https://www.ics-shipping.org/shipping-facts/shipping-and-world-trade (accessed on 20 March 2019).
  2. Steenken, D.; Voß, S.; Stahlbock, R. Container terminal operation and operations research-a classification and literature review. OR Spectr. 2004, 26, 3–49. [Google Scholar]
  3. Caballini, C.; Mar-Ortiz, J.; Gracia, M.; Sacone, S. Optimal truck scheduling in a container terminal by using a Truck Appointment System. In Proceedings of the 2018 21st International Conference on Intelligent Transportation Systems (ITSC), Maui, HI, USA, 4–7 November 2018; pp. 2525–2530. [Google Scholar]
  4. Taner, M.E.; Kulak, O.; Koyuncuoğlu, M.U. Layout analysis affecting strategic decisions in artificial container terminals. Comput. Ind. Eng. 2014, 75, 1–12. [Google Scholar] [CrossRef]
  5. Pierre, C.; Francesco, P.; Theo, N. Towards low carbon global supply chains: A multi-trade analysis of CO2 emission reductions in container shipping. Int. J. Prod. Econ. 2019, 208, 17–28. [Google Scholar]
  6. Azab, A.; Karam, A.; Eltawil, A. A simulation-based optimization approach for external trucks appointment scheduling in container terminals. Int. J. Model. Simul. 2020, 40, 321–338. [Google Scholar] [CrossRef]
  7. Giuliano, G.; O’Brien, T. Reducing port-related truck emissions: The terminal gate appointment system at the Ports of Los Angeles and Long Beach. Transp. Res. Part D Transp. Environ. 2007, 12, 460–473. [Google Scholar] [CrossRef]
  8. Abdelmagid, A.M.; Gheith, M.S.; Eltawil, A.B. A comprehensive review of the truck appointment scheduling models and directions for future research. Transp. Rev. 2022, 42, 102–126. [Google Scholar] [CrossRef]
  9. Eltawil, A.B. A systematic approach to container terminal planning and operational decision making. In Proceedings of the International Maritime Transport & Logistics Conference, Alexandria, Egypt, 17–19 March 2013. [Google Scholar]
  10. Morais, P.; Lord, E. Terminal Appointment System Study; Transport Canada: Vancouver, BC, USA, 2006. [Google Scholar]
  11. Schulte, F.; González, R.G.; Voß, S. Reducing port-related truck emissions: Coordinated truck appointments to reduce empty truck trips. In Proceedings of the International Conference on Computational Logistics, Delft, The Netherlands, 23–25 September 2015; pp. 495–509. [Google Scholar]
  12. Abdelmagid, A.M.; Gheith, M.S.; Eltawil, A.B. A Binary Integer Programming Formulation and Solution for Truck Appointment Scheduling and Reducing Truck Turnaround Time in Container Terminals. In Proceedings of the 2021 The 8th International Conference on Industrial Engineering and Applications (Europe), Barcelona, Spain, 8–11 January 2021; pp. 126–131. [Google Scholar]
  13. Murty, K.G.; Wan, Y.-w.; Liu, J.; Tseng, M.M.; Leung, E.; Lai, K.-K.; Chiu, H.W. Hongkong International Terminals gains elastic capacity using a data-intensive decision-support system. Interfaces 2005, 35, 61–75. [Google Scholar] [CrossRef] [Green Version]
  14. Huynh, N.; Walton, C.M. Robust scheduling of truck arrivals at marine container terminals. J. Transp. Eng. 2008, 134, 347–353. [Google Scholar] [CrossRef]
  15. Zhen, L.; Yu, S.; Wang, S.; Sun, Z. Scheduling quay cranes and yard trucks for unloading operations in container ports. Ann. Oper. Res. 2019, 273, 455–478. [Google Scholar] [CrossRef]
  16. Zehendner, E.; Feillet, D. Benefits of a truck appointment system on the service quality of inland transport modes at a multimodal container terminal. Eur. J. Oper. Res. 2014, 235, 461–469. [Google Scholar] [CrossRef]
  17. Azab, A.E.; Eltawil, A.B. A Simulation Based Study Of The Effect Of Truck Arrival Patterns On Truck Turn Time In Container Terminals. In Proceedings of the ECMS, Regensburg, Germany, 31 May–3 June 2016; pp. 80–86. [Google Scholar]
  18. Torkjazi, M.; Huynh, N.; Shiri, S. Truck appointment systems considering impact to drayage truck tours. Transp. Res. Part E Logist. Transp. Rev. 2018, 116, 208–228. [Google Scholar] [CrossRef]
  19. Azab, A.E.; Karam, A.; Eltawil, A.B. A Dynamic and Collaborative Truck Appointment Management System in Container Terminals. In Proceedings of the ICORES, Porto, Portugal, 23–25 February 2017; pp. 85–95. [Google Scholar]
  20. Phan, M.-H.; Kim, K.H. Collaborative truck scheduling and appointments for trucking companies and container terminals. Transp. Res. Part B Methodol. 2016, 86, 37–50. [Google Scholar] [CrossRef]
  21. Azab, A.; Karam, A.; Eltawil, A. Impact of Collaborative External Truck Scheduling on Yard Efficiency in Container Terminals. In Proceedings of the International Conference on Operations Research and Enterprise Systems, Porto, Portugal, 23–25 February 2017; pp. 105–128. [Google Scholar]
  22. Zhang, X.; Zeng, Q.; Yang, Z. Optimization of truck appointments in container terminals. Marit. Econ. Logist. 2019, 21, 125–145. [Google Scholar] [CrossRef]
  23. Yi, S.; Scholz-Reiter, B.; Kim, T.; Kim, K.H. Scheduling appointments for container truck arrivals considering their effects on congestion. Flex. Serv. Manuf. J. 2019, 31, 730–762. [Google Scholar] [CrossRef]
  24. Riaventin, V.N.; Kim, K.H. Scheduling appointments of truck arrivals at container terminals. Int. J. Ind. Eng. 2018, 25, 590–603. [Google Scholar]
Figure 1. Schematic diagram representing the typical layout of a container terminal. (XTs: refers to external trucks) [4].
Logistics 06 00045 g001
Figure 2. Typical external truck (a) departures and (b) arrivals patterns in Alexandria container terminal in November 2017 [6].
Logistics 06 00045 g002
Figure 3. The times spent by trucks to perform the different tasks of container handling.
Logistics 06 00045 g003
Figure 4. The workload distribution for instance 8.
Logistics 06 00045 g004
Figure 5. The workload distribution for instance 13.
Logistics 06 00045 g005
Figure 6. The variation of the objective function value and other cost terms through the sensitivity analysis experiment.
Logistics 06 00045 g006aLogistics 06 00045 g006b
Figure 7. The effect of applying leveling constraint on instance 13.
Logistics 06 00045 g007
Figure 8. The workload before and after applying balancing constraint on iteration 2.
Logistics 06 00045 g008
Figure 9. The workload before and after using balancing constraint on iteration 3.
Logistics 06 00045 g009
Figure 10. The workload before and after applying balancing constraint on iteration 4.
Logistics 06 00045 g010
Figure 11. The workload before and after applying balancing constraint on iteration 5.
Logistics 06 00045 g011
Figure 12. The workload before and after using balancing constraint on iteration 6.
Logistics 06 00045 g012
Figure 13. The workload before and after applying balancing constraint on iteration 7.
Logistics 06 00045 g013
Figure 14. The total TTT before and after levelling the workload.
Logistics 06 00045 g014
Figure 15. The percentage reduction of total TTT in each scenario after leveling the workload.
Logistics 06 00045 g015
Figure 16. The total cost before and after leveling the workload.
Logistics 06 00045 g016
Figure 17. The difference in the waiting time cost before and after leveling the workload.
Logistics 06 00045 g017
Figure 18. The change in the delivery cost before and after leveling the workload.
Logistics 06 00045 g018
Figure 19. The total TTT before and after leveling the workload for all instances.
Logistics 06 00045 g019
Figure 20. The percentage of reduction in total TTT.
Logistics 06 00045 g020
Table 3. The structure of problem instances.
Instance NumberNumber of Tasks Task Type
1346Inbound
2237Inbound
3230Inbound
4276Inbound
5231Inbound
6138Inbound
7125Inbound
8475Inbound
9383Inbound
10174Inbound
11144Inbound
12188Inbound
1345Inbound
1497Inbound
15352Inbound
16381Inbound
17341Inbound
18199Inbound
19237Inbound
2081Inbound
21151Inbound
22402Inbound
23400Inbound
24206Inbound
25225Inbound
26161Inbound
27102Inbound
28142Inbound
29394Inbound
30213Inbound
Table 4. Demurrage cost for each truck appointed at block b at time slot s.
d b s Time Slots
Block123456789101112131415161718192021222324
1~2--------15151515151515151515151515151515
3~7------------------------
Table 5. The number of available trucks during each time slot.
U s Time Slots
123456789101112131415161718192021222324
303030303030303030303030303030303030303030303030
Table 6. The appointment quota for each yard block during each time slot.
v b s Time Slots
Block 123456789101112131415161718192021222324
1~710 1010101010101010101010101010101010101010101010
Table 7. The number of containers to be picked up from each yard block in instance 8.
Block (b)1234567
Number of containers ( n b )63767680805347
Table 8. The number of containers to be picked up from each yard block in instance 13.
Block (b)1234567
Number of containers ( n b )44913852
Table 9. A summary of the input parameters values.
Parameter Name Related Area Source Unit Value
Waiting time cost (c) Yard [23]$/h 120
Demurrage cost (𝑑𝑏𝑠) Yard [23]$ 15
Delivery cost (g) Yard [23]$/h 20
Delivery time (𝑎𝑠) Hinterland [23]Hour Range [0.6–1.1]
Time needed to reach block Yard [3]Hour 0.05
Time needed to leave blockYard [3]Hour 0.05
Table 10. The obtained results for 30 instances.
Inst. No.Number of Tasks Objective Value ($)Total Turnaround Time (h)
134614,392.679.7
22379539.9453.5
3230923551.8
427611,244.163
5231928552
61385343.930.6
7125481427.5
847520,437.4111.86
938316,098.288.9
101746858.238.8
111445590.331.98
121887429.642
13451653.49.58
14973687.321.1
1535214,666.681.25
1638116,004.788.4
1734114,200.977.9
181997915.744.5
192379549.953.39
20813054.117.55
211515893.5733.49
2240216,978.793.52
2340016,881.693.38
242068217.546.16
252259017.850.59
261616293.435.84
271023887.222.3
281425508.131.55
2939416,611.991.65
302138495.347.82
Table 11. The sensitivity analysis results of instance 8.
Iteration NumberTruck Capacity per Time SlotObjective Value ($)Waiting Time Cost ($)Delivery Cost ($)Demurrage Cost ($)Total TTT (h)
115Infeasible solution
22020,733.413,157.475760109.65
32220,579.713,215.773640110.13
42420,502.513,290.572120110.75
52620,464.413,348.471160111.23
62820,447.713,393.770540111.6
730
(Original case)
20,437.413,423.470140111.86
Table 12. A comparison between results before and after applying the leveling constraint.
Instance NumberNumber of TasksBefore Applying Leveling ConstraintAfter Applying Leveling Constraint
Objective Value ($)Workload Level (Peak, Valley)Objective Value ($)Workload Level (Peak, Valley)
134614,392.6(30, 0)14766.1(18, 13)
22379539.94(25, 0)9957.5(11, 9)
32309235(25, 0)9644.8(15, 9)
427611,244.1(30, 0)11641.7(16, 10)
52319285(24, 0)9763.65(15, 9)
61385343.9(19, 0)5673(12, 4)
71254814(18, 0)5137.76(9, 5)
847520,437.4(30, 4)20751.2(24, 19)
938316,098.2(30, 0)16450.1(20, 14)
101746858.2(20, 0)7396.97(11, 7)
111445590.3(20, 0)5925.85(11, 4)
121887429.6(22, 0)7806.73(15, 6)
13451653.4(13, 0)1802.65(7, 1)
14973687.3(16, 0)3951.3(10, 3)
1535214,666.6(30, 0)15037.6(21, 13)
1638116,004.7(30, 0)16359.2(19, 14)
1734114,200.9(30, 0)14622.9(17, 14)
181997915.7(22, 0)8425(12, 8)
192379549.9(24, 0)10035.1(10, 9)
20813054.1(15, 0)3365.23(9, 3)
211515893.57(20, 0)6400.5(10, 6)
2240216,978.7(30, 1)17327.1(23, 15)
2340016,881.6(30, 1)17233.4(22, 15)
242068217.5(22, 0)8769.2(14, 8)
252259017.8(24, 0)9414.4(14, 9)
261616293.4(20, 0)6650.24(13, 5)
271023887.2(17, 0)4184.2(8, 4)
281425508.1(20, 0)5843(10, 4)
2939416,611.9(30, 0)16954.8(20, 15)
302138495.3(24, 0)8886(16, 7)
Table 13. The objective values and other cost terms after balancing the workload level.
After Levelling the Workload
Iteration No.Truck Capacity/Time SlotObjective Value ($)Waiting Time Cost ($)Delivery Cost ($)Demurrage Cost ($)
115Infeasible
22020,769.713,159.776100
32220,752.213,170.275820
42420,606.413,204.474020
52620,605.813,213.873920
62820,75213,17475780
73020,751.213,175.275760
Publisher’s Note: MDPI stays neutral with regard to jurisdictional claims in published maps and institutional affiliations.