Article

Design and Analysis of a Lightweight Composite Shipping Container Made of Carbon Fiber Laminates

Information Technology Department. (B.I.D.B.), Izmir Institute of Technology, 35430 İzmir, Turkey
Logistics 2019, 3(3), 18; https://doi.org/10.3390/logistics3030018
Submission received: 20 May 2019 / Revised: 12 July 2019 / Accepted: 15 July 2019 / Published: 16 July 2019
(This article belongs to the Section Maritime and Transport Logistics)

Abstract

:
The literature indicates that a 20% reduction in the weight of empty 40-foot shipping containers would result in $28 billion of fuel savings, along with a 3.6 exajoule reduction in the energy demand over containers’ 15-year lifetime. Decreasing the energy demand and thereby greenhouse gas emissions by utilizing lightweight shipping containers has been an unexplored strategy. In this regard, this study investigates the possibility of further reducing the weight of an empty container without compromising the structural integrity, strength, and function of a traditional steel container. This research finds that up to an 80% reduction in weight is possible by producing shipping containers with composite materials. This research presents the new design of a 40-foot container made of carbon fiber laminates. The tare weight of a traditional 40-foot shipping container is around 3750 kg. On the contrary, in this research, the weight of a composite design of the same container is calculated to be around 822 kg. Additional tests with various loads, such as lifting the container and stacking loads onto the composite container, are performed to explore the strength and buckling issues of the design presented in this study. The analyses reveal that the composite shipping container is a highly promising candidate for reducing greenhouse gas emissions, providing fuel savings and thus reducing the operational costs of transportation.

1. Introduction

Buchanan et al. [1] demonstrated that replacing the global fleet of roof panels and container walls with aluminum would save $28 billion in fuel and that a 20% reduction in the steel mass would result in a reduction of 17% in energy and lifecycle emissions, or 3.6 exajoule of the energy demand. Their results demonstrate the significant potential fuel savings and energy potential that could be achieved by lightening shipping containers. The strategies are based on reducing the weight of a vehicle and on the collection and development of a set of physics-based expressions to describe the effect of reducing vehicle mass on fuel consumption across transportation modes [2]. A 10% reduction in vehicle weight (assuming a constant payload) would result in a 2% improvement in fuel consumption for trains and light, medium, and heavy trucks; 4% improvement for buses; and 7% improvement for airplanes [2].
Obrecht and Knez [3] studied the carbon and resource savings of different container designs. They indicated that a possible solution for more sustainable freight transport is the use of environmentally friendly containers manufactured according to eco-design principles. They are lighter, made of fewer materials, and have less impact on the environment throughout their lifecycle [3]. Goh [4] studied the impact of foldable sea containers on freight forwarders and carbon emissions. Their study examined the sender’s foldable shipping containers and prospects for sustainability. The viability of foldable containers as a carbon offset tool for the shipping industry was also explored [4].
Sureeyatanapas et al. [5] studied green initiatives for logistics service providers in a survey of background factors and contributions to business objectives. This study aimed to provide information on the launch of green policies in logistics companies by examining the important factors influencing the adoption of green practices, as well as the extent to which several green activities contribute to cost reduction and environmental protection. The results indicate that “green driving” and “vehicle routing” activities are more recognized and generally conducted in the industry [5].
This research was undertaken to provide a global solution for reducing the energy demand of transportation, more specifically providing lightweight solutions for shipping containers. As the utilization of lightweight shipping containers has been an unexplored strategy, the reduction of both fuel consumption and the operational costs of transportation would become possible. This research presents the new design of a 40-foot container made of carbon fiber laminates. The curb weight of a 40-foot traditional shipping container is approximately 80% lower. Tests are also performed to explore the resistance and buckling problems of the new model. The analyses reveal that the composite shipping container is a highly promising candidate for reducing greenhouse gas (GHG) emissions, saving fuel, and thus reducing the operating costs of transportation.
The remainder of this paper is organized as follows. Section 2 reviews the literature on light composite applications and vehicle mass concerns, as well as the eco-design of containers and need to develop better fuel efficiency in logistics. Section 3 presents the materials and methods used to perform the complex design and analyses of the composite container design. Section 4 describes the analyses and results. Section 5 concludes the paper.

2. Literature Review

The prevailing research reflects the increasing amount of international literature on this area based on different viewpoints. For example, lightweight composite air cargo containers were studied by William et al. [6]. They indicated that innovative concepts for the design and assembly of lightweight air cargo container construction configurations have been developed through light composite applications. The prototype of a typical airfreight container was constructed to assess the technical feasibility and economic viability of creating such a container from fiber-reinforced polymer composite materials [6]. Ranta et al. [7] studied the radio frequency identification and demonstration of composite container technology for the transportation of wood biomass logistics, finding a higher readability of Radio-frequency identification (RFID) tags with composite containers than with metal ones.
Lee and Song [8] reviewed shipping container transport in global supply chains. They emphasized that the dynamic operations and uncertain activities of long-distance container shipping pose challenges to the quality of shipping services, as well as that shipping operations and performance are affected by increasing concerns about the social and environmental impacts. All these issues bring challenges to the container shipping industry [8]. Rødseth et al. [9] studied the impact of density savings in container handling operations on the time spent and ship emissions in ports using data provided by Norwegian container terminals. They indicated that Norwegian and European decision-makers are committed to improving the economic and environmental performance of the transport system.
Wu and Huang [10] modeled the profitability of container transport lines. Their research contributes to the maritime literature by constructing a theoretical model to empirically examine the determinants of the profitability of container ships. Mantovani et al. [11] researched the load planning problem for two-train intermodal trains and presented a methodology for solving this problem. Intermodal transport is an important component of a profitable freight transportation system, which is an essential part of a competitive economy, in which different modes of transport are linked to moving goods from a point of origin to a point of destination.
Notteboom and Vernimmen [12] examined the effect of high fuel costs on the liner service configuration in container shipping. They indicated that for shipping activities, not least container shipping, bunker fuel is a considerable expense. Denac et al. [13] studied the current and potential integration of eco-design in small- and medium-sized enterprises in the construction and related industries. The study found that the most frequently applied criteria were to maximize product life and ease of reuse, disassembly, and recycling. The highest level of eco-design implementation was observed in the “design for use” phase. Andriankaja et al. [14] proposed a method for the eco-design of structural parts in the transport sector based on the management of the product lifecycle.
Acanfora et al. [15] estimated design loads on container stacks due to excessive acceleration under adverse weather conditions. Majidian and Azarsina [16] evaluated the cargo configuration effect on frontal wind loads by addressing the fuel consumed during ships’ propulsion. They found that the optimal stacking of containers reduces wind drag by 25%, which has a positive impact on fuel consumption. Khor et al. [17] analyzed the optimal speed for large container ships and stated that innovations in design and a slowing speed are becoming more important. Their article also described in detail new software designed to facilitate the speed optimization process of large container ships.
Podeur et al. [18] assessed fuel economy using the kite propulsion of a merchant ship. Malchow [19] investigated the growth of ship sizes and found that transport costs would not significantly reduce by increasing them further. Their research demonstrated that increasing the size of container ships does not bring about any further benefits for the ports and their terminals, for the lines themselves, or for shippers.
Martin et al. [20] studied international regulations for container construction and ISO standards and their suitability for its purpose. The growing adoption of terminal automation also calls for the greater standardization of container coding and marking. Their study demonstrated that the roles of the International Maritime Organization (IMO) and ISO in regulating and promoting standards for container design, dimensions, size, coding, marking, and strength are largely unknown. Abrasheva et al. [21] researched shipping containers from a sustainable city perspective and found that the challenges of sustainable urban development are enormous. Abrasheva et al. [22] explored shipping containers in a sustainable habitat, showing that the container construction industry has significant potential for sustainability.
Goulielmos [23] studied the structural changes in the containership market after 2008 and their impact on industry policy. As large vessels are more competitive, smaller vessels are being abandoned and eventually scrapped. Their model showed that the containership market is oligopolistic or purely competitive, confirming the double-edged sword of containership markets that has long been debated by maritime economists. Kana and Harrison [24] adopted a Monte Carlo approach to the vessel-centric Markov decision process to analyze the conversion of a containership to an Liquefied Natural Gas (LNG) carrier. A case study was used to show how uncertain parameter variations can significantly affect the optimal decision strategies.
Cariou et al. [25] studied low carbon global supply chains and performed a multi-trade analysis to reduce emissions in container shipping. They also indicated that the IMO has agreed to reduce GHG emissions from international shipping, which should lower annual CO2 emissions by at least 50% by 2050 compared with 2008. Patricksson and Erikstad [26] assessed sulfur emissions to minimize total costs, with aggregated power requirements and emission regulations serving as constraints to the problem.
Priftis et al. [27] performed a parametric design and multi-objective optimization of container ships. Fluctuations in fuel prices along with the shipping industry’s constant striving for economic growth have led the shipbuilding industry to explore new designs for various types of ships. Guven and Eliiyi [28] modeled and optimized online container stacking under operational constraints. The objective of the container stacking problem is to minimize the number of reworkings, thereby increasing the efficiency of terminal operations. They also indicated that additional weight-related operational constraints increase the complexity of online stacking decisions.
Ding and Chou [29] examined container docking planning by developing a heuristic algorithm to reduce the number of shifts. Their heuristic algorithm is capable of generating docking plans with a reasonable number of shifts. Parreño et al. [30] proposed a Greedy Randomized Adaptive Search Procedure (GRASP) algorithm for the storage location planning problem. This work presented a generalization of the slot planning problem that arises when the liner shipping industry needs to plan the placement of containers within a vessel (stowage planning). Christensen and Pacino [31] proposed a solution to the problem of cargo bulk blocking. They found that the demand for efficient and cheap transportation and fierce competition have resulted in lower transport rates, forcing carriers to use their vessels in the most efficient way [31].
Lee et al. [32] used archival data to research a decision support system for understanding vessel speed in marine logistics, which provides more than 70% of global transport. Optimizing the speed of liner ships has a significant economic and environmental impact in terms of reducing fuel costs and GHG emissions. In the same vein, Bal and Vleugel [33] investigated container port calls with emissions at sea. They indicated that these emissions are a serious threat to the planet and the health of its species [33]. Ammar [34] provided an environmental and economic analysis of the use of methanol for a cellular containership, which can reduce NOx, SOx, CO, CO2, and PM emissions by 76.8%, 89%, 55%, 18.1%, and 82.6%, respectively [34].
Based on the foregoing, the present study contributes to the existing literature by using composite materials to design a shipping container. In particular, it provides a better theoretical understanding of a composite container made of carbon fiber laminates. Specifically, it differs from previous works in that it investigates the possibility of significantly reducing the weight of a marine container without compromising the functionality of a traditional steel-made shipping container.

3. Materials and Methods

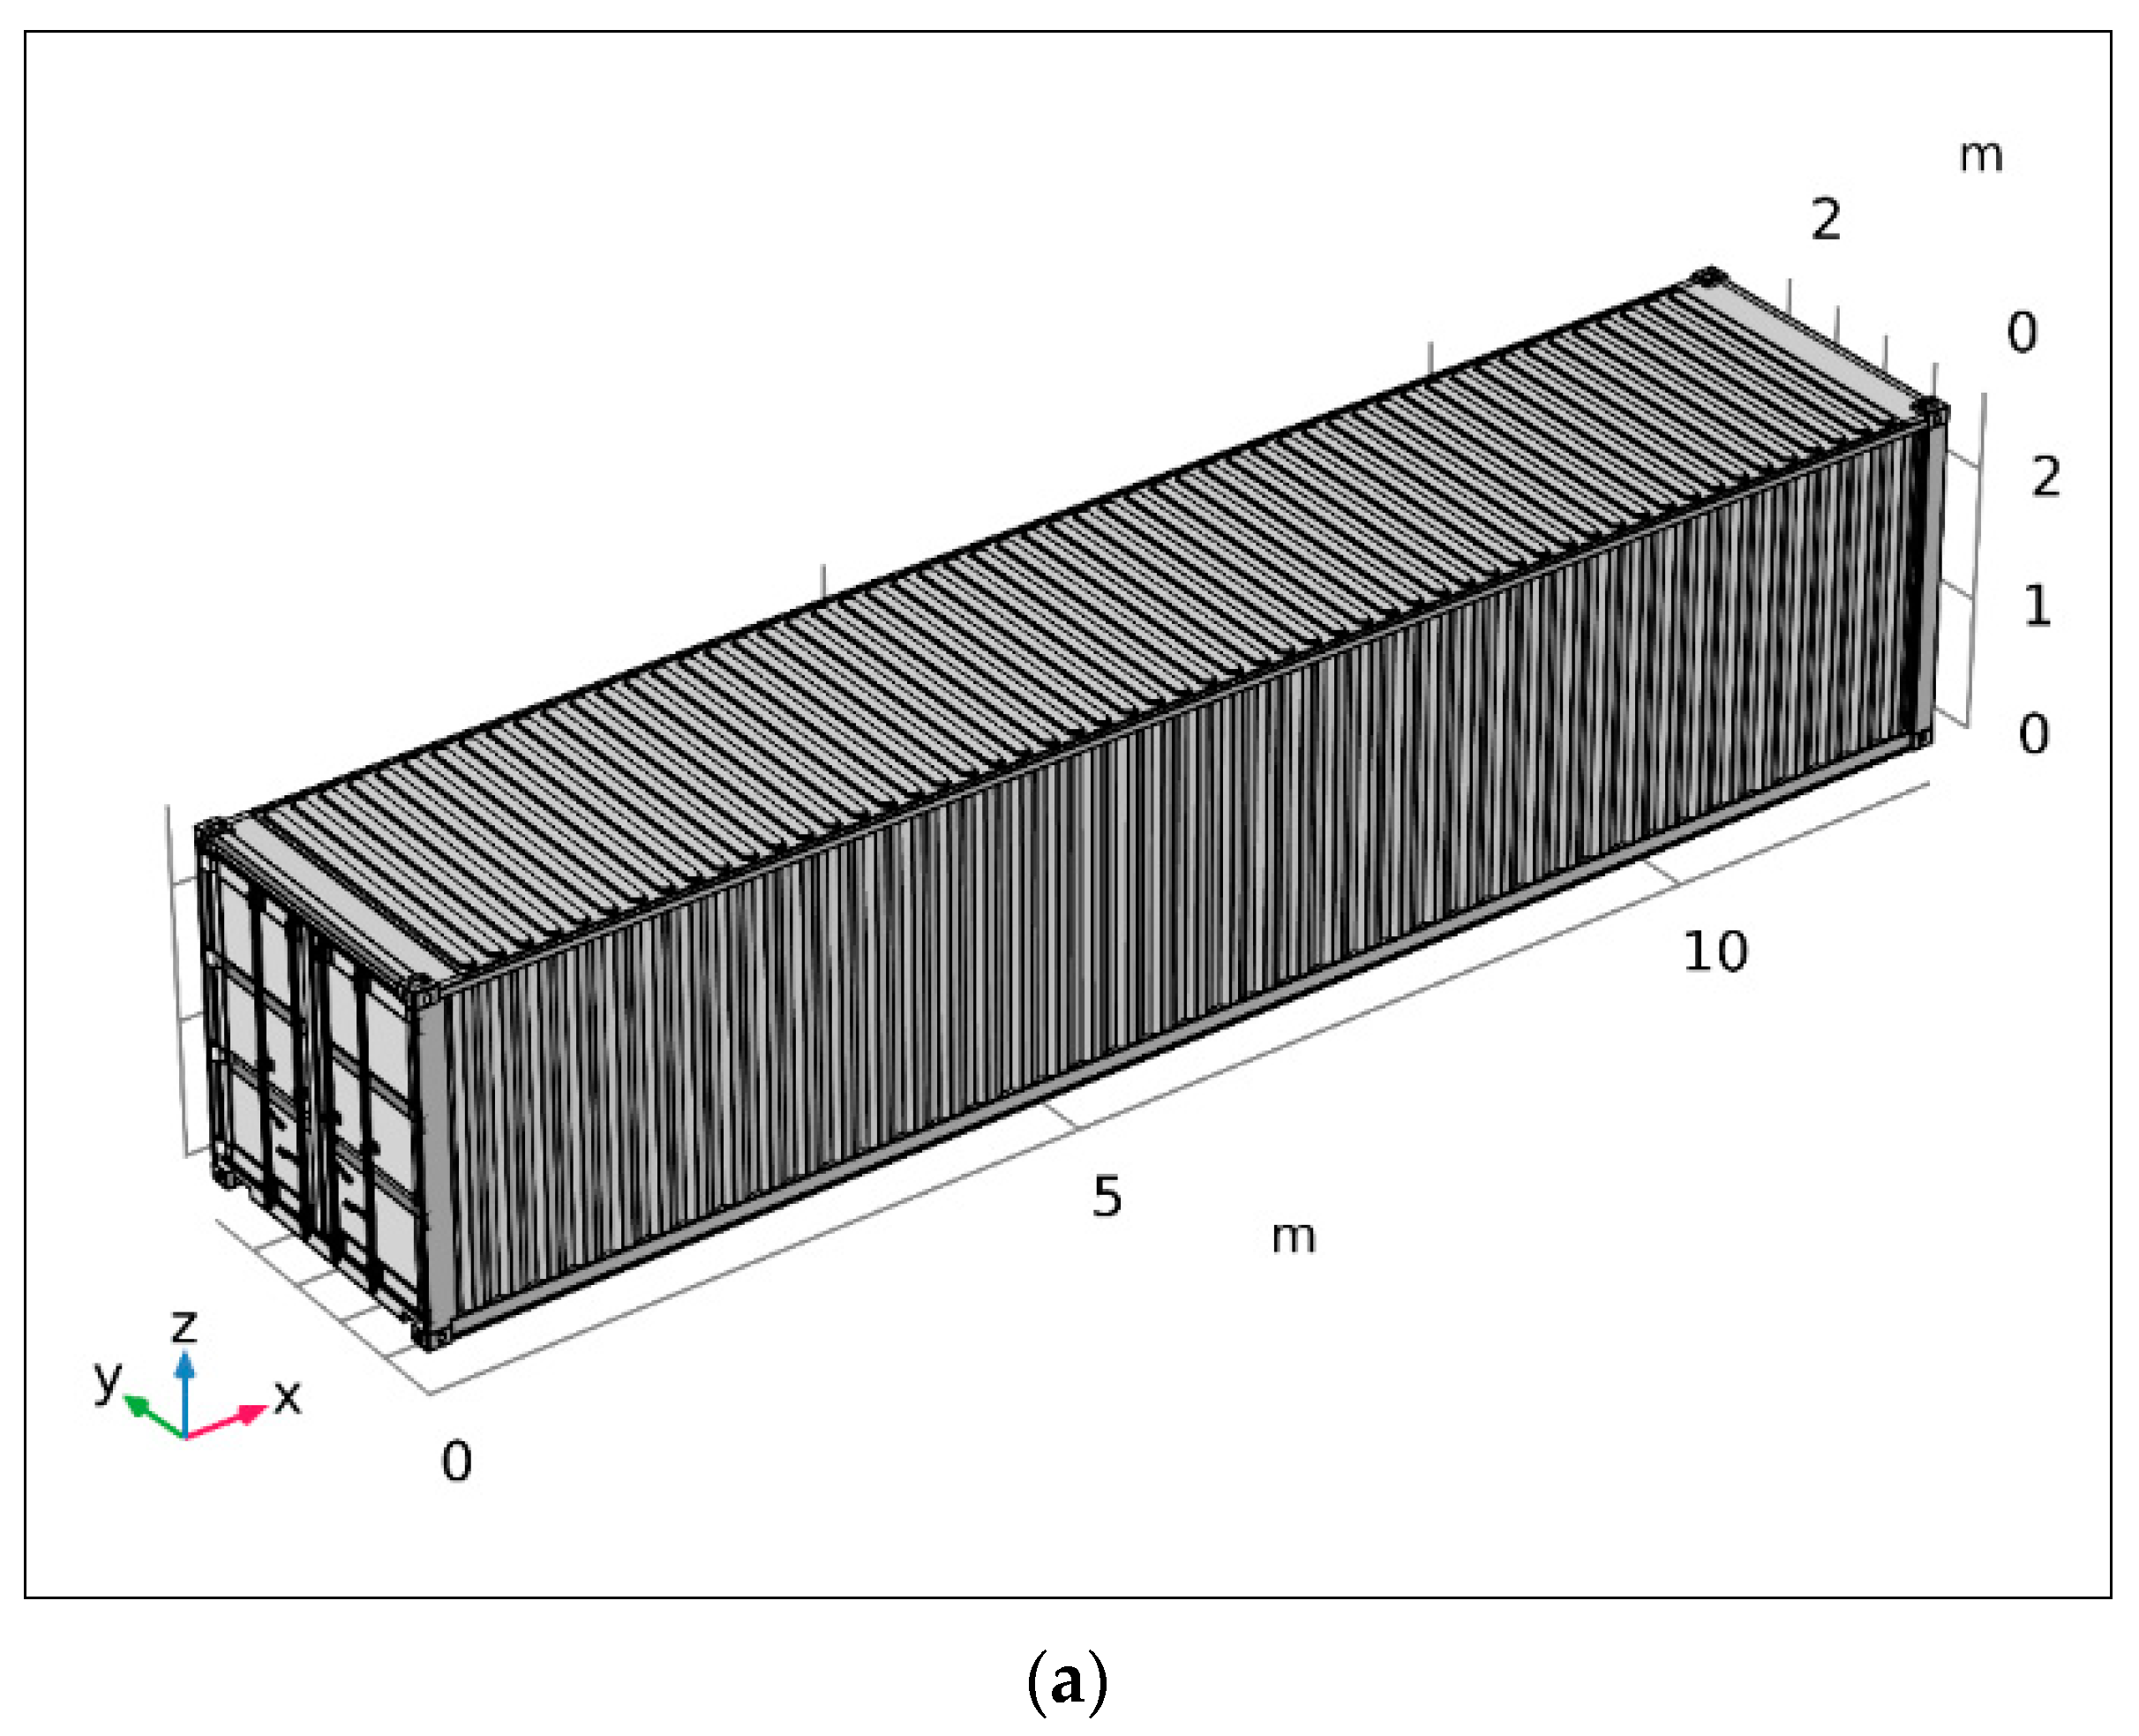
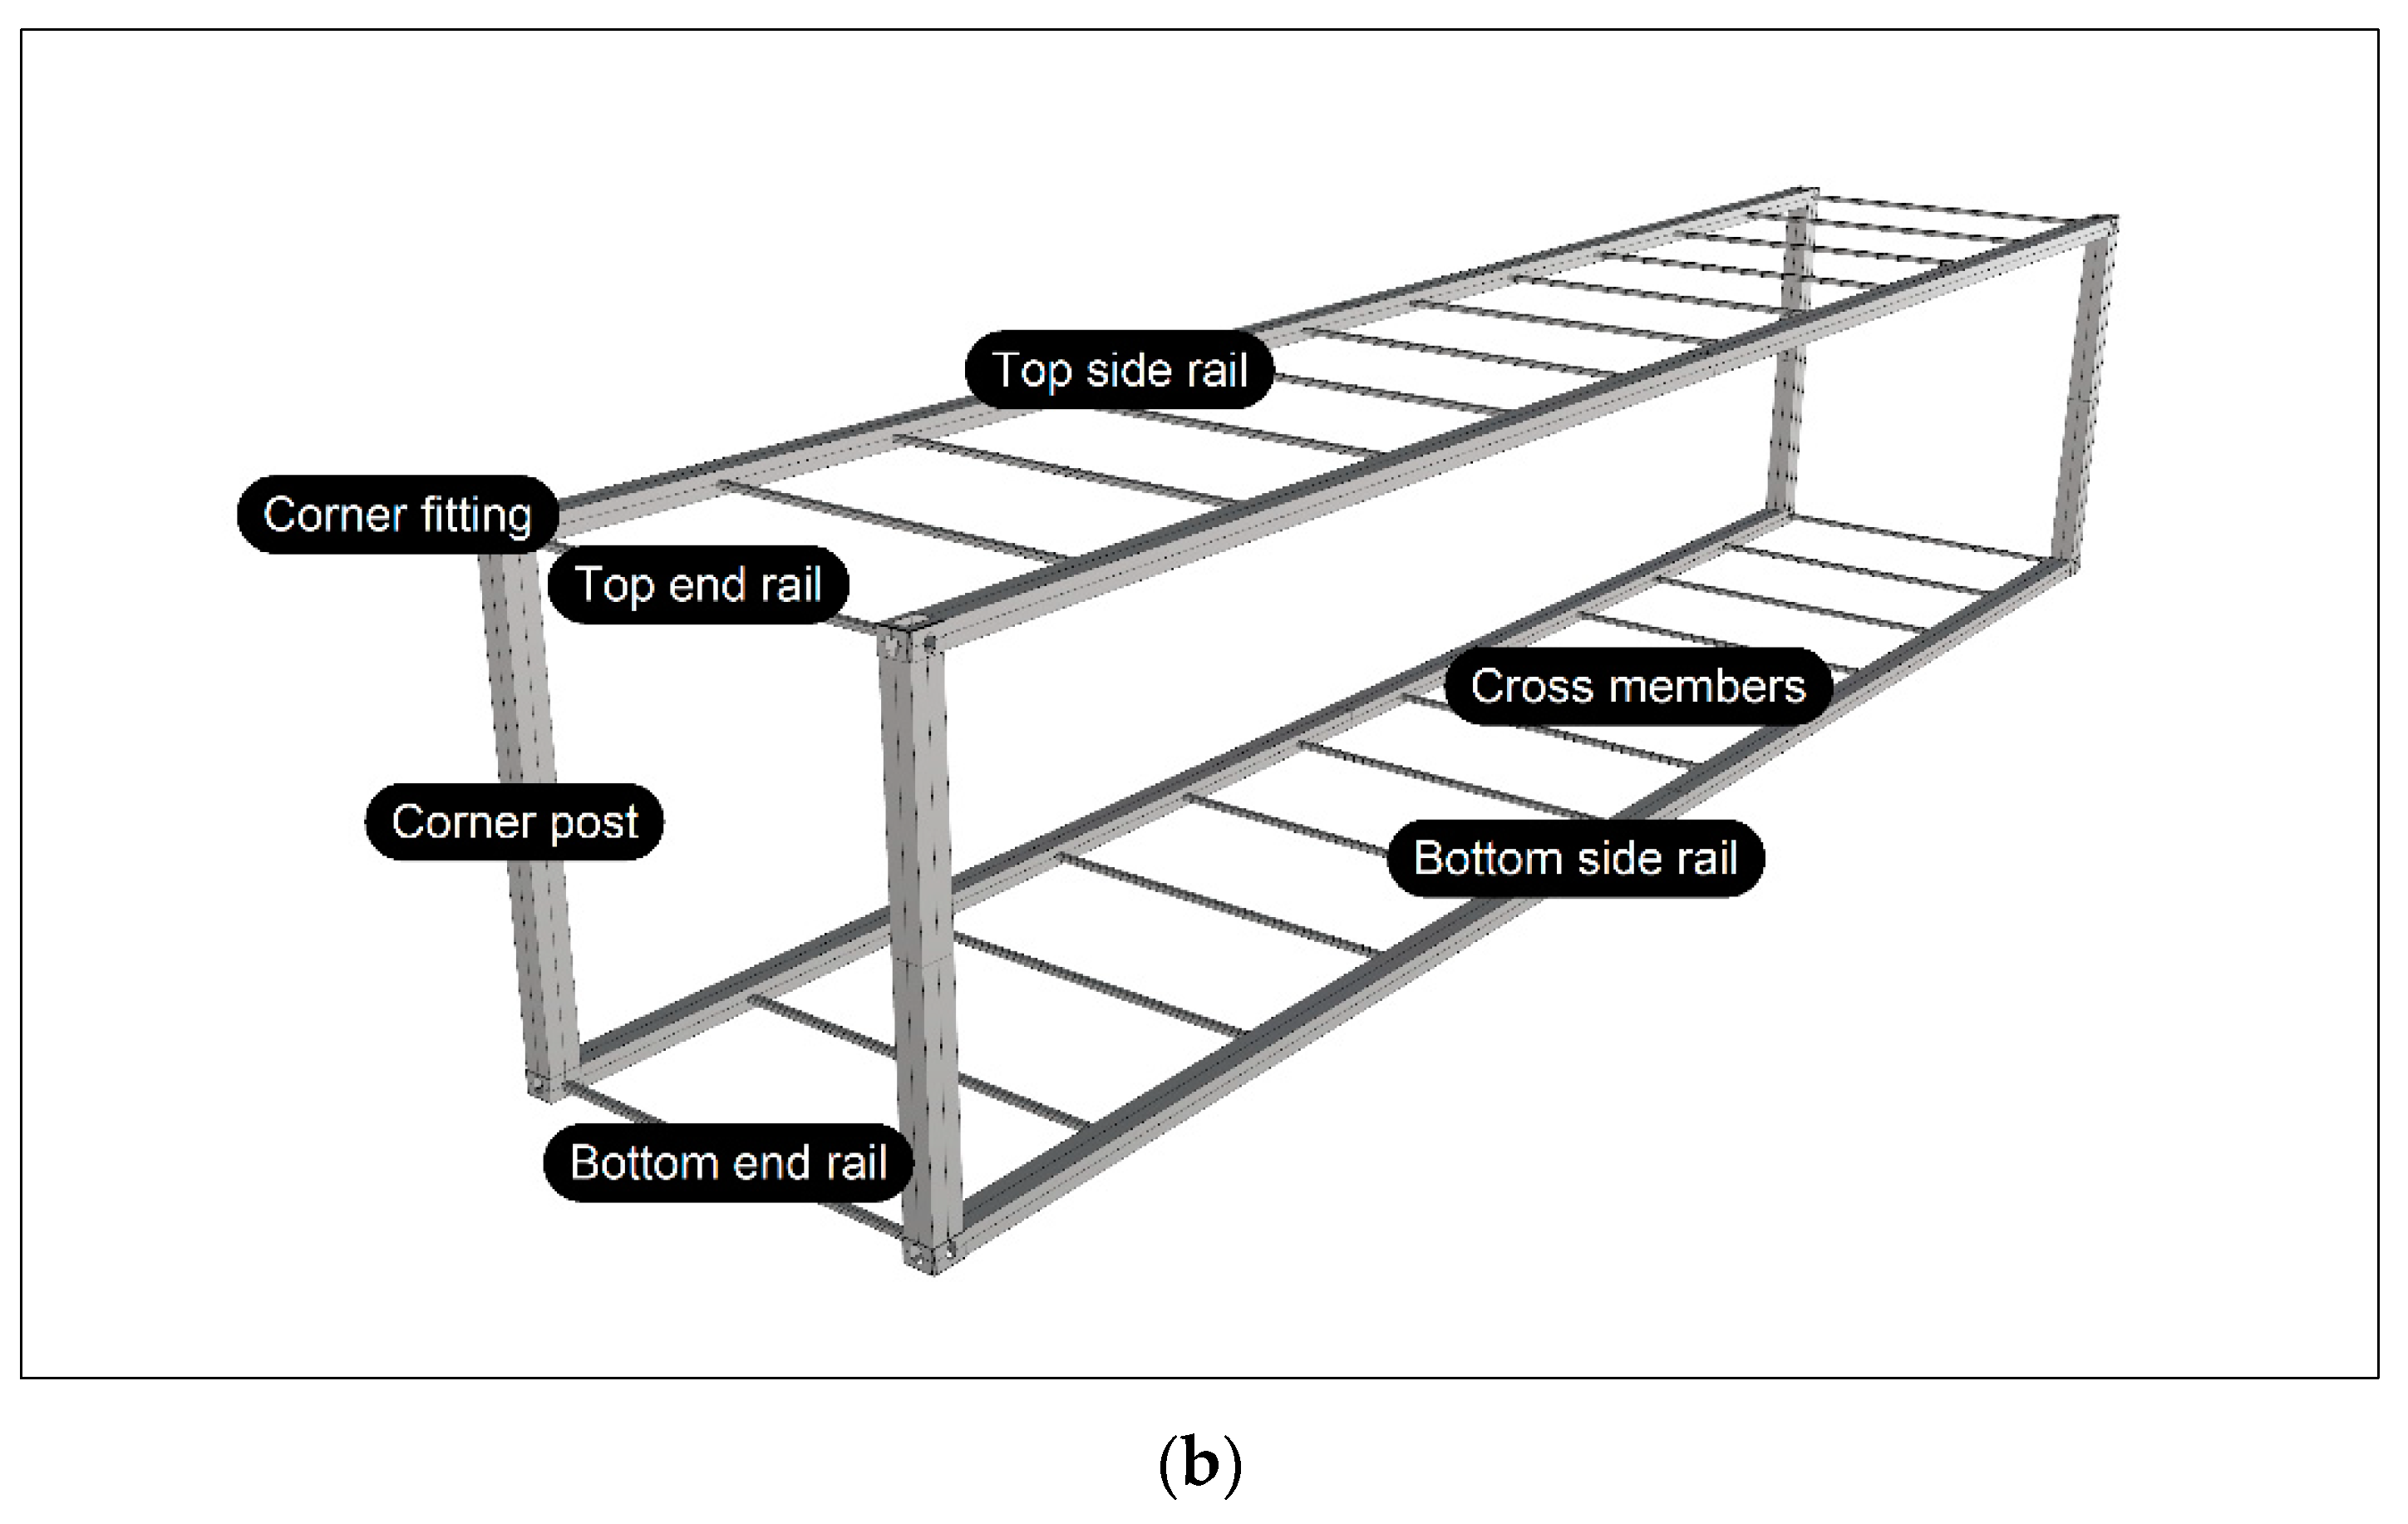
A standard ISO container is designed to support a weight of 192 tons stacked on its four corner posts. Since a container has four corner posts, each should be able to support at least 192 / 4 = 48 tons of weight. There is a total stack of 192,000 kg (192 t) on the bottom container, which is equivalent to eight containers of 24,000 kg (24 t). This means that a bottom container must support a stack of six fully-loaded 40-foot containers or eight fully-loaded 20-foot containers. Table 1 provides more properties of standard shipping containers (see also Table A1 and Table A2 in the Appendix A). Additionally, the standard ISO container is subjected to a dynamic G force of 1.8. Therefore, a composite container design must consider these basic values to be a viable replacement for a standard ISO container without compromising the current functionality; otherwise, it would collapse due to the stack weight (see Figure 1a,b).
Composite materials are used to build the new generation of containers. The advantages and disadvantages of composites are explained by Campbell [35]. The advantages of composites are numerous. They have a lighter weight; can adapt the installation to ensure an optimum strength and rigidity; show better fatigue resistance and corrosion resistance; and, with good design practices, can reduce the costs of assembly by lowering the number of parts and fasteners. The disadvantages of composites are their high raw material costs and generally high manufacturing and assembly costs; the adverse effects of temperature and humidity on them; their low resistance in the out-of-plane direction where the die supports the main load; their susceptibility to impact damage and the delamination or separation of layers; and the greater difficulty in repairing them compared with metal structures.
On the contrary, the corrosion resistance of composites can lead to significant savings in support costs [35]. Carbon fiber composites cause the galvanic corrosion of aluminum if the fibers come into direct contact with the metal surface; however, the bonding of a layer of glass fabric electrical insulation to all interfaces in contact with the surface aluminum eliminates this problem.
This study first presents the composite materials and layers used in the design of the composite container. Then, a static structural analysis is performed to test if the composite design of the container can handle extreme conditions. Thereafter, a buckling analysis is performed to investigate the critical loads of the composite container. Finally, a statistical analysis is presented to explore the data generated by the composite container model.
The initial container model is drawn using Rhinoceros 5, which is computer-aided design software. The curves and surface objects drawn by the software are mathematically precise. It is a free-form surface modeler and utilizes non-uniform rational B-spline (NURBS) mathematical models. Then, the shell geometry of the container design model is loaded, developed, and analyzed using ANSYS ACP 2019. For the 3D static structural and buckling analyses of the composite container model, ANSYS Mechanical APDL 2019 is used as the simulation platform. Except in simple cases, the equations governing static structural and buckling analyses are generally not suitable for analytical solutions. Therefore, to perform the analyses of the composite container, the domains are divided into smaller subdomains (consisting of geometric primitives, such as hexahedra/tetrahedra in 3D and quadrilaterals/triangles in 2D). The governing equations are then discretized and resolved in each of these subdomains. The design and simulations are performed on an Intel i7-6700 with 8 cores, 3.4 GHz CPU, and 24 GB of RAM.
The analysis presented hereafter follows these main steps. Firstly, the composite materials and layers used in this study are presented. Then, the methods and static structural and buckling analyses of the composite container are described. Finally, the statistical analyses are performed and statistical significances are reported.

3.1. Composite Materials and Layers

Two main types of composite laminates are used. These are the epoxy carbon unidirectional (UD) prepreg and honeycomb layer. A composite offers higher strength to weight and stiffness ratios than conventional materials [36] (see Figure 2). The sandwich construction, in particular the honeycomb construction, is extremely structurally effective, particularly in rigidity critical applications [35]. Doubling the core thickness increases the rigidity by more than seven times with a weight gain of only 3%, while a quadruple core thickness increases the stiffness by more than 37 times with a weight gain of only 6% [35].
Fiber composites can be viewed from two perspectives, namely micromechanics and macromechanics. Micromechanical analyses aim to explain the behavior of composites, typically those with UD fiber reinforcement, in terms of the fiber and matrix properties [37]. Macro-mechanics is used to predict the strength and stiffness of composite structures, as well as other properties, such as distortion, based on the “average” properties of the UD material, namely the longitudinal modulus E 1 , the transverse modulus E 2 , the major Poisson’s ratio ν 21 , and the shear modulus in the G 12 plane, as well as the appropriate resistance values [37] (see Figure 2).
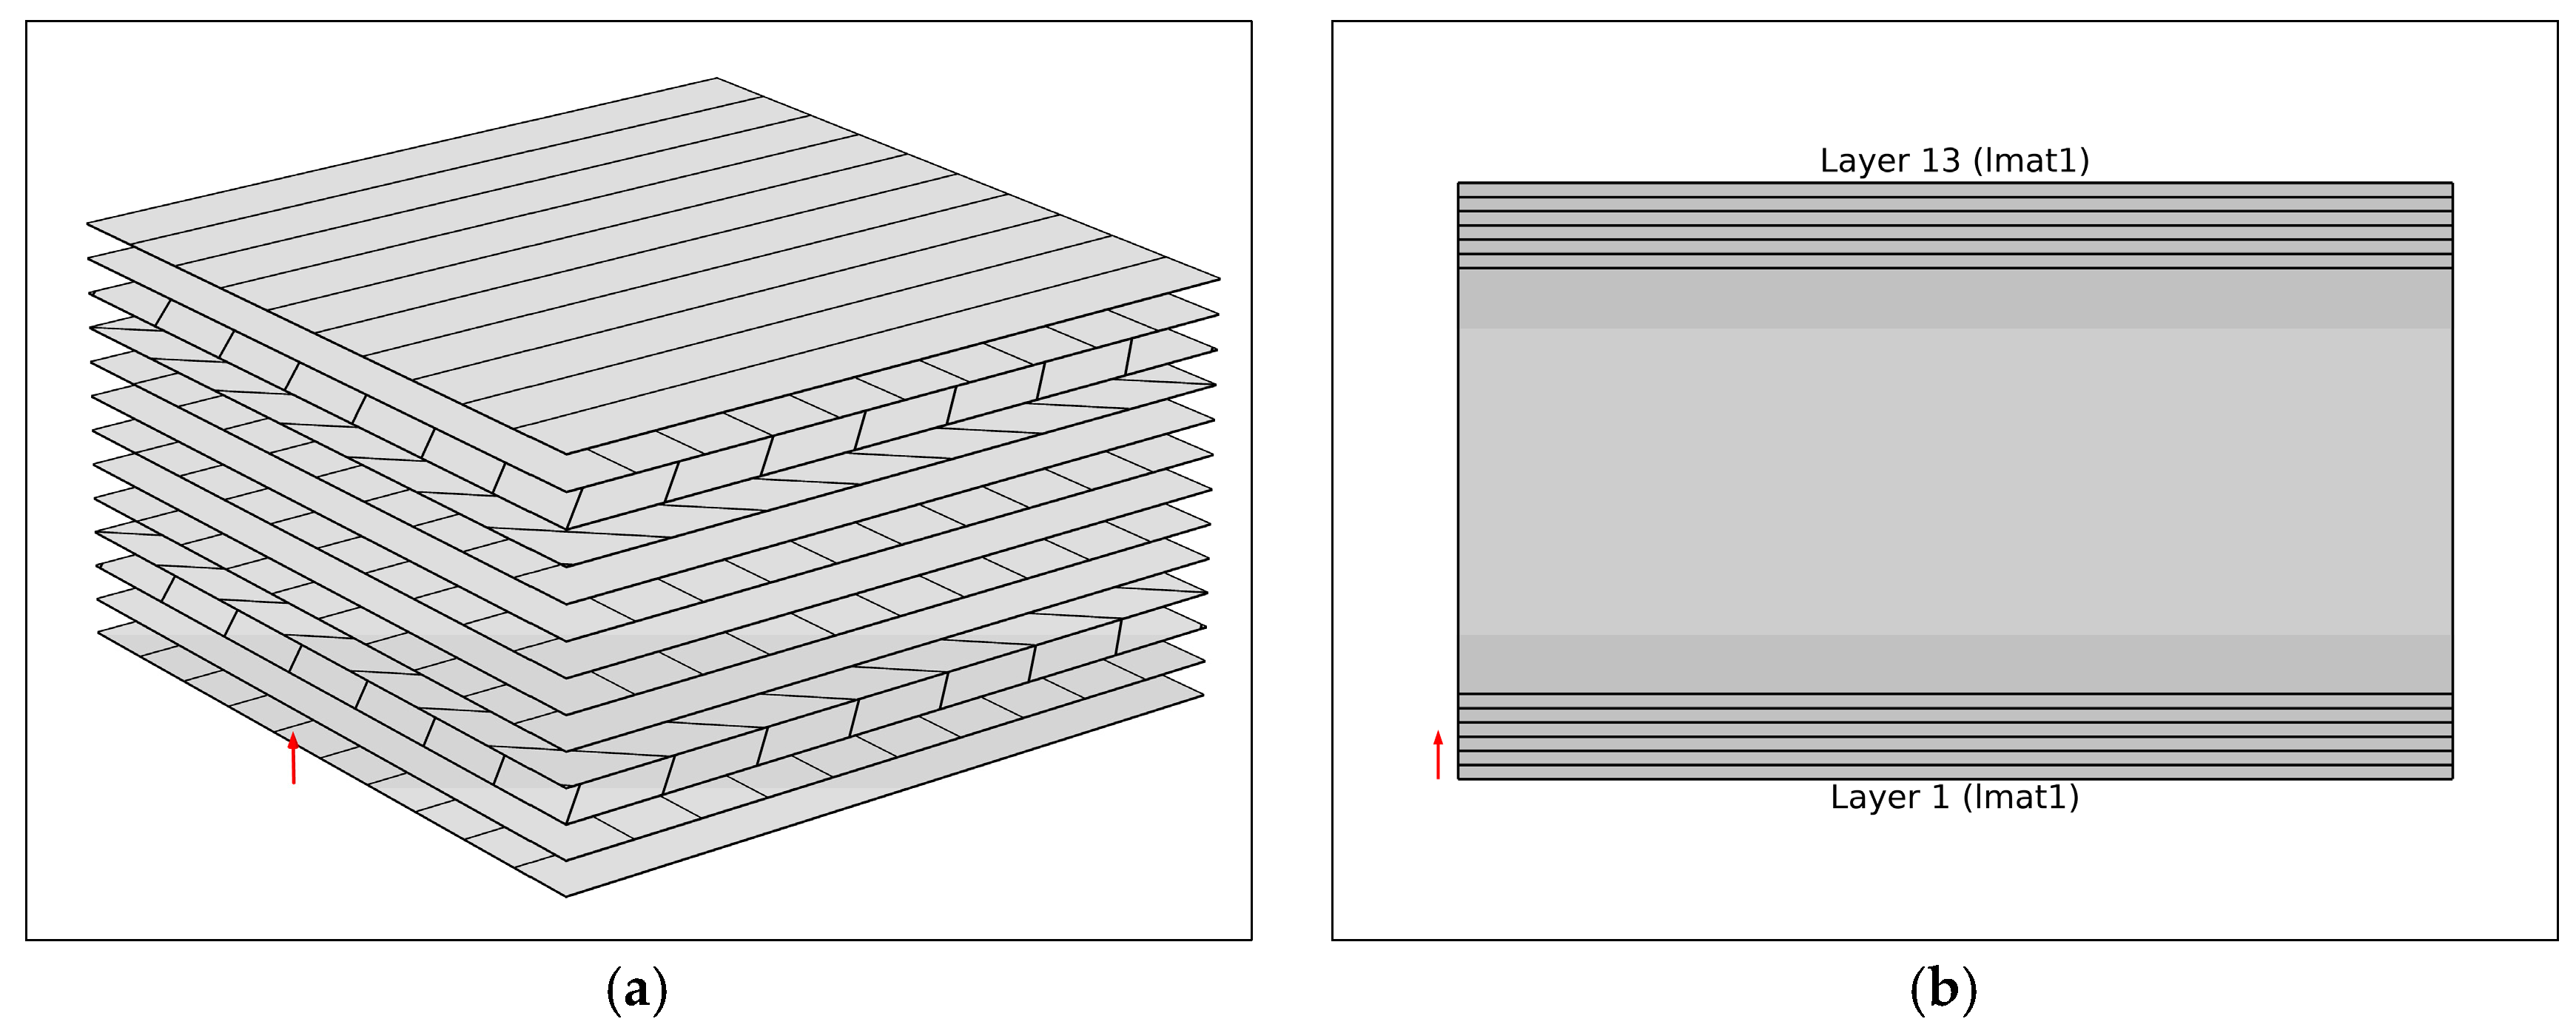
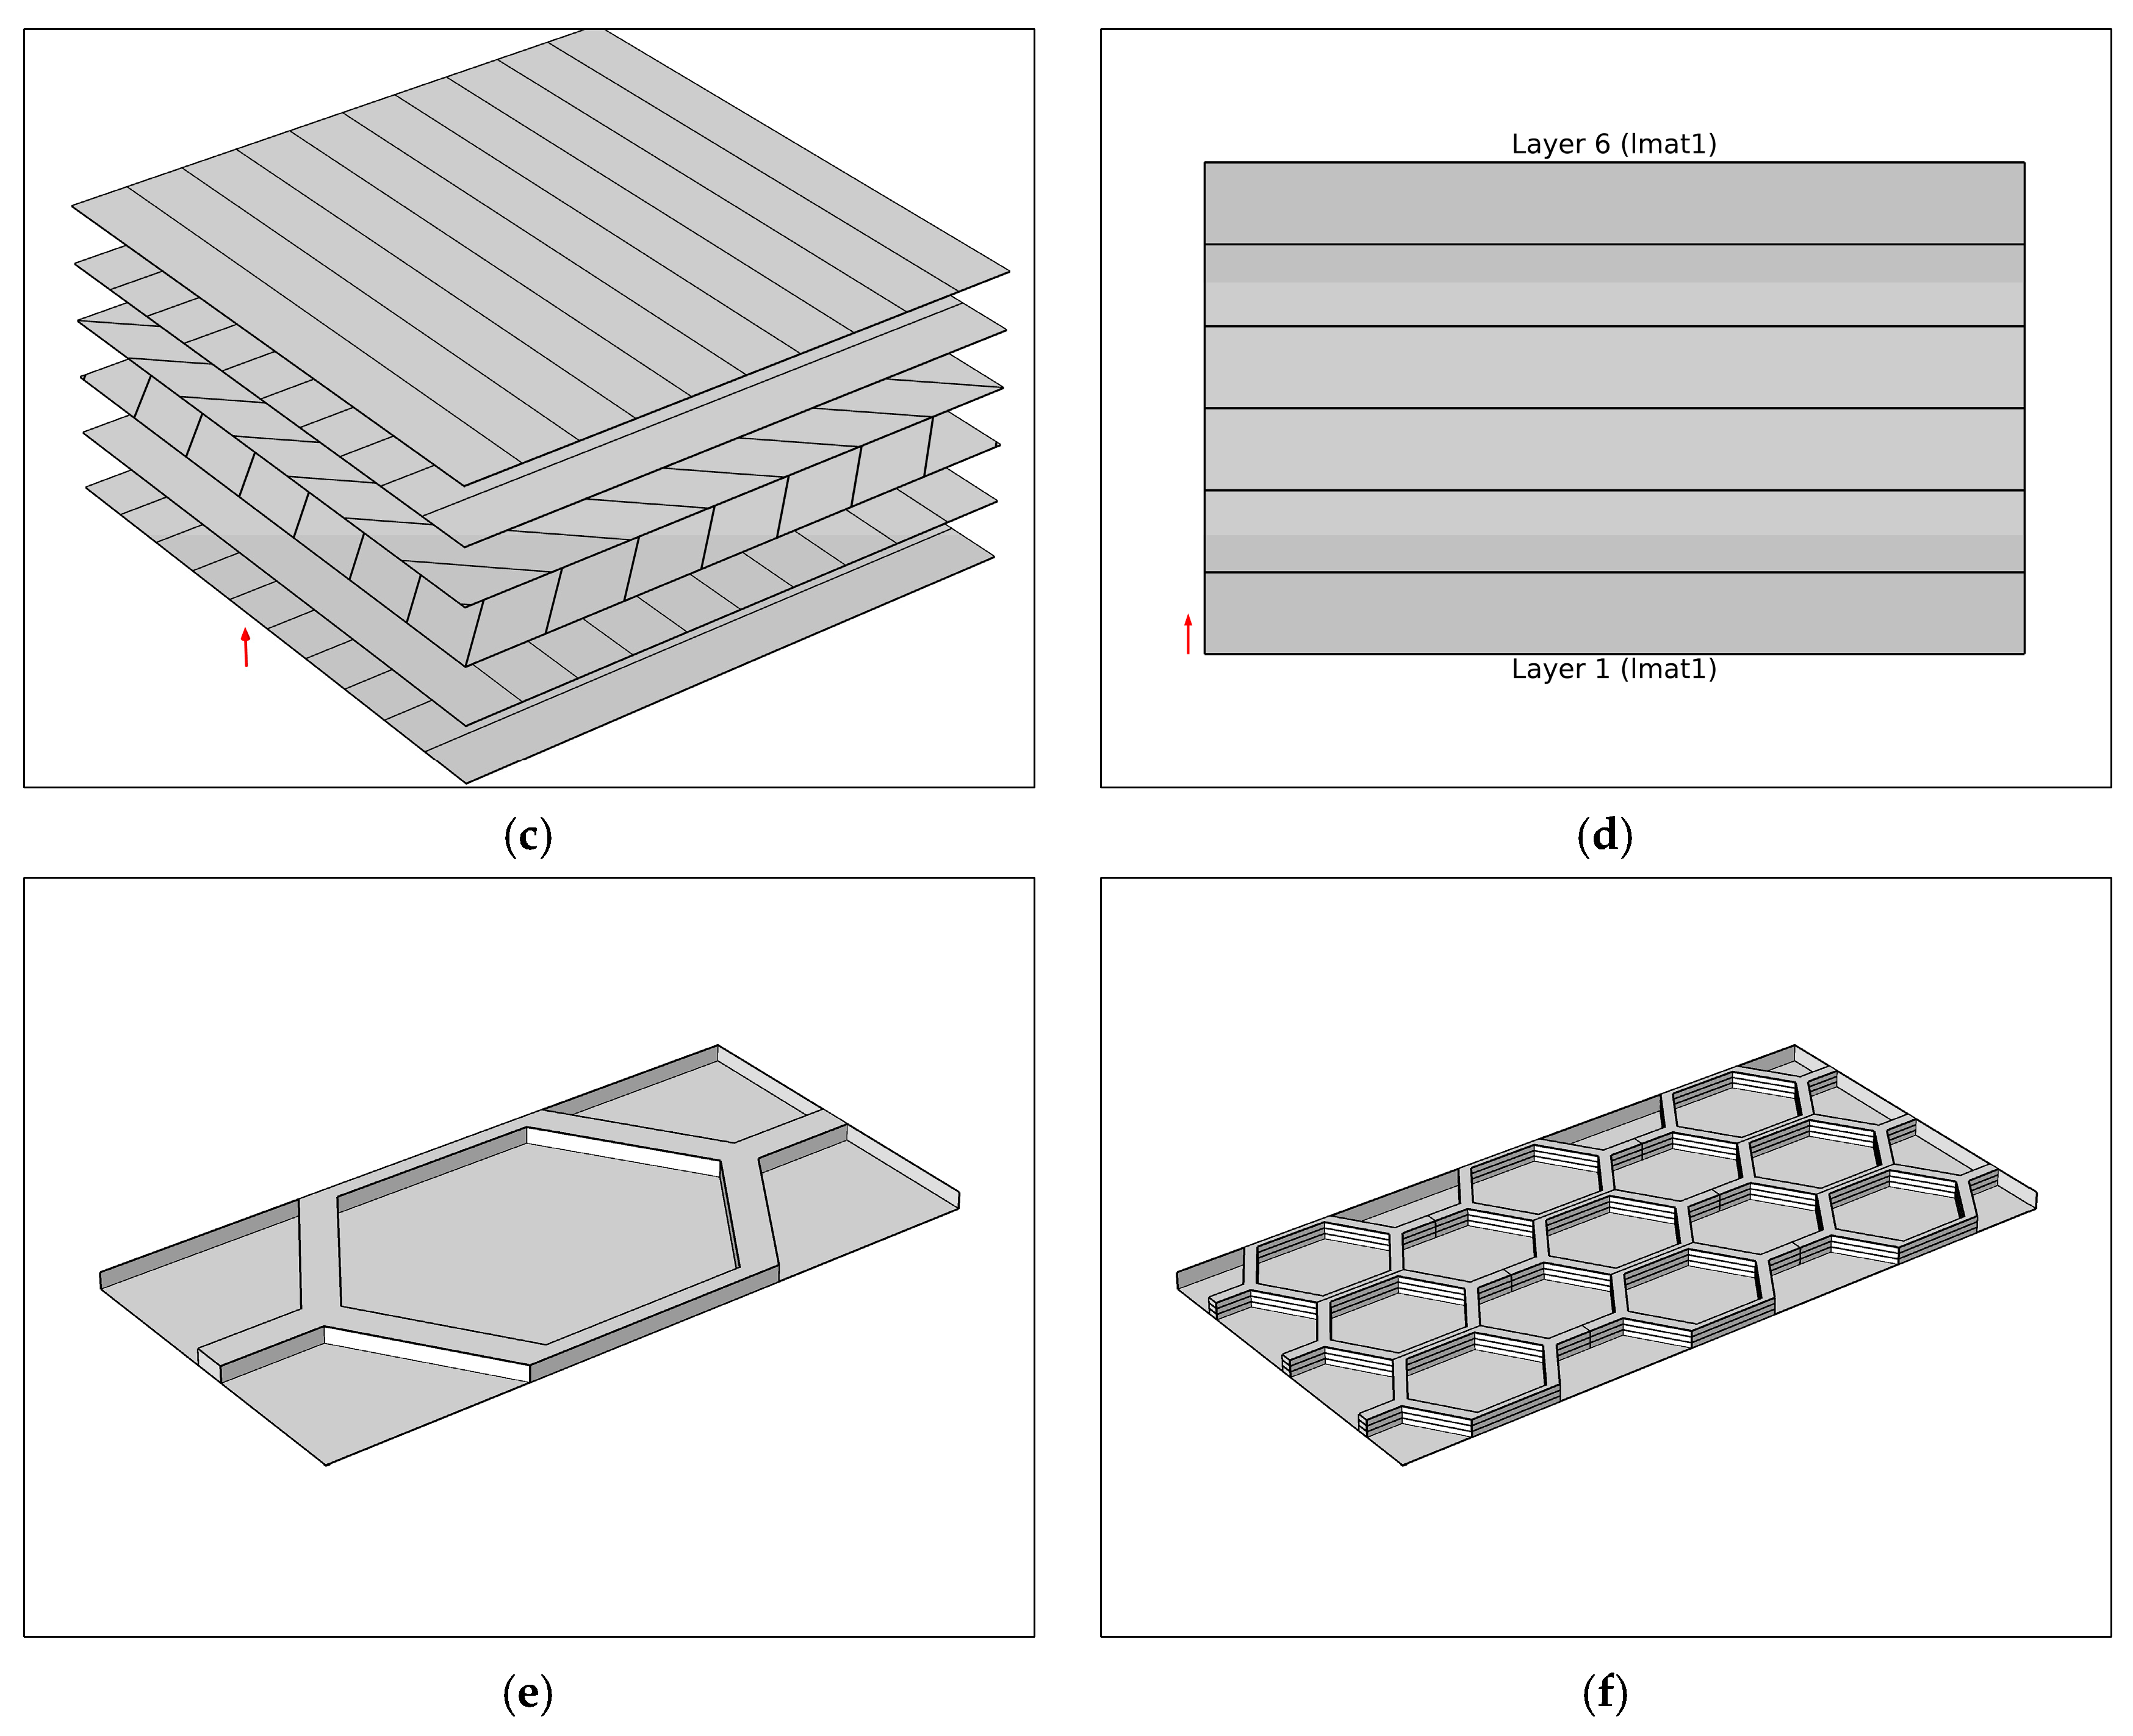
In materials science, composite laminates are assemblies of layers of fibrous composite materials that can be joined to provide the required technical properties, particularly with respect to plane stiffness, flexural stiffness, strength, and expansion [38]. A laminate is a stack of blades, as illustrated in Figure 3, specifically oriented to achieve the desired result [36]. The response of the laminate depends on the properties of each laminate, as well as the order in which the layers are stacked [36].
In this research, quasi-isotropic and balanced laminates are used (see Figure 3). The quasi-isotropic laminate is made up of six plies of identical materials. Quasi-isotropic laminates usually exhibit isotropic elastic behavior in the xy plane [35]. In this research, a balanced and symmetric quasi-isotropic laminate is used (0°, 90°, 45°, –45°, –45°, 45°, 90°, 0°). When the ply configuration is made of equal numbers of plies at 0°, +45°, and 90°, the in-plane mechanical properties do not vary with loading direction and the composite is then said to be quasi-isotropic [37]. A balanced laminate having equal numbers of plies in the 0°, +45°, –45°, and 90° directions is called a quasi-isotropic laminate because it carries equal loads in all four directions [35]. For the additional properties of the epoxy carbon UD material, see Table A3 in Appendix A.

3.2. Static Structural Analysis

The static structural analysis is performed to observe the total deformation of the composite container. Structural analysis deals with stresses, strains, and deformations in engineering structures subjected to mechanical and thermal loads [35]. In this analysis, only mechanical loads are tested. The analysis of composite structures is more complicated. Stress is associated with the strength of the material from which the body is made, while strain is a measure of the deformation of the body [39]. Whenever a force is applied to a body, it will tend to change the body’s shape and size. These changes are referred to as deformation, and they may be either highly visible or practically unnoticeable [39]. An increase in stress causes a proportionate increase in strain. This is known as Hooke’s law [39], which may be expressed mathematically as σ = E ε . Here, E represents the constant of proportionality, which is called the modulus of elasticity or Young’s modulus, while ε is the strain [39].
As the governing equations for a linear static analysis, the displacement vector { x } is solved in the matrix equation as [ K ] { x } = { F } . Here, [ K ] is a constant and [ K ] is the stiffness matrix. In addition, small deflection theory is used and linear elastic material behavior is assumed. The { F } vector represents the external forces statically applied when time-varying forces and inertial effects do not exist.

3.3. Buckling Analysis

The buckling analysis is performed to investigate the critical loads of the composite container. Long slender members subjected to an axial compressive force are called columns (here, the corner posts of the container) and the lateral deflection that occurs is called buckling. Because the buckling of a corner post can often lead to a sudden and dramatic failure of the composite structure, special attention must be paid to the design of corner posts so that they can safely support their intended loadings without buckling [39].
As the governing equations are used to obtain the buckling load multiplier λ i , the eigenvalue problem for a linear buckling analysis is solved. The buckling mode ψ i is defined as ( [ K ] + λ i [ S ] ) { ψ i } = 0 . Here, the [ K ] and [ S ] matrices are constants. The assumption is that linear elastic material behavior exists, and nonlinearities are not included, as small deflection theory is used. Finally, the response based on the loading vector of { F } is a linear function of the buckling load multiplier λ i . The maximum axial load that a column can support when it is on the verge of buckling is called the critical load [39]. The load multiplier is interpreted as B u c k l i n g _ L o a d =   λ × U n i t _ L o a d or B u c k l i n g _ L o a d = A c t u a l _ L o a d / λ .

4. Numerical Analyses and Results

4.1. Composite Layers

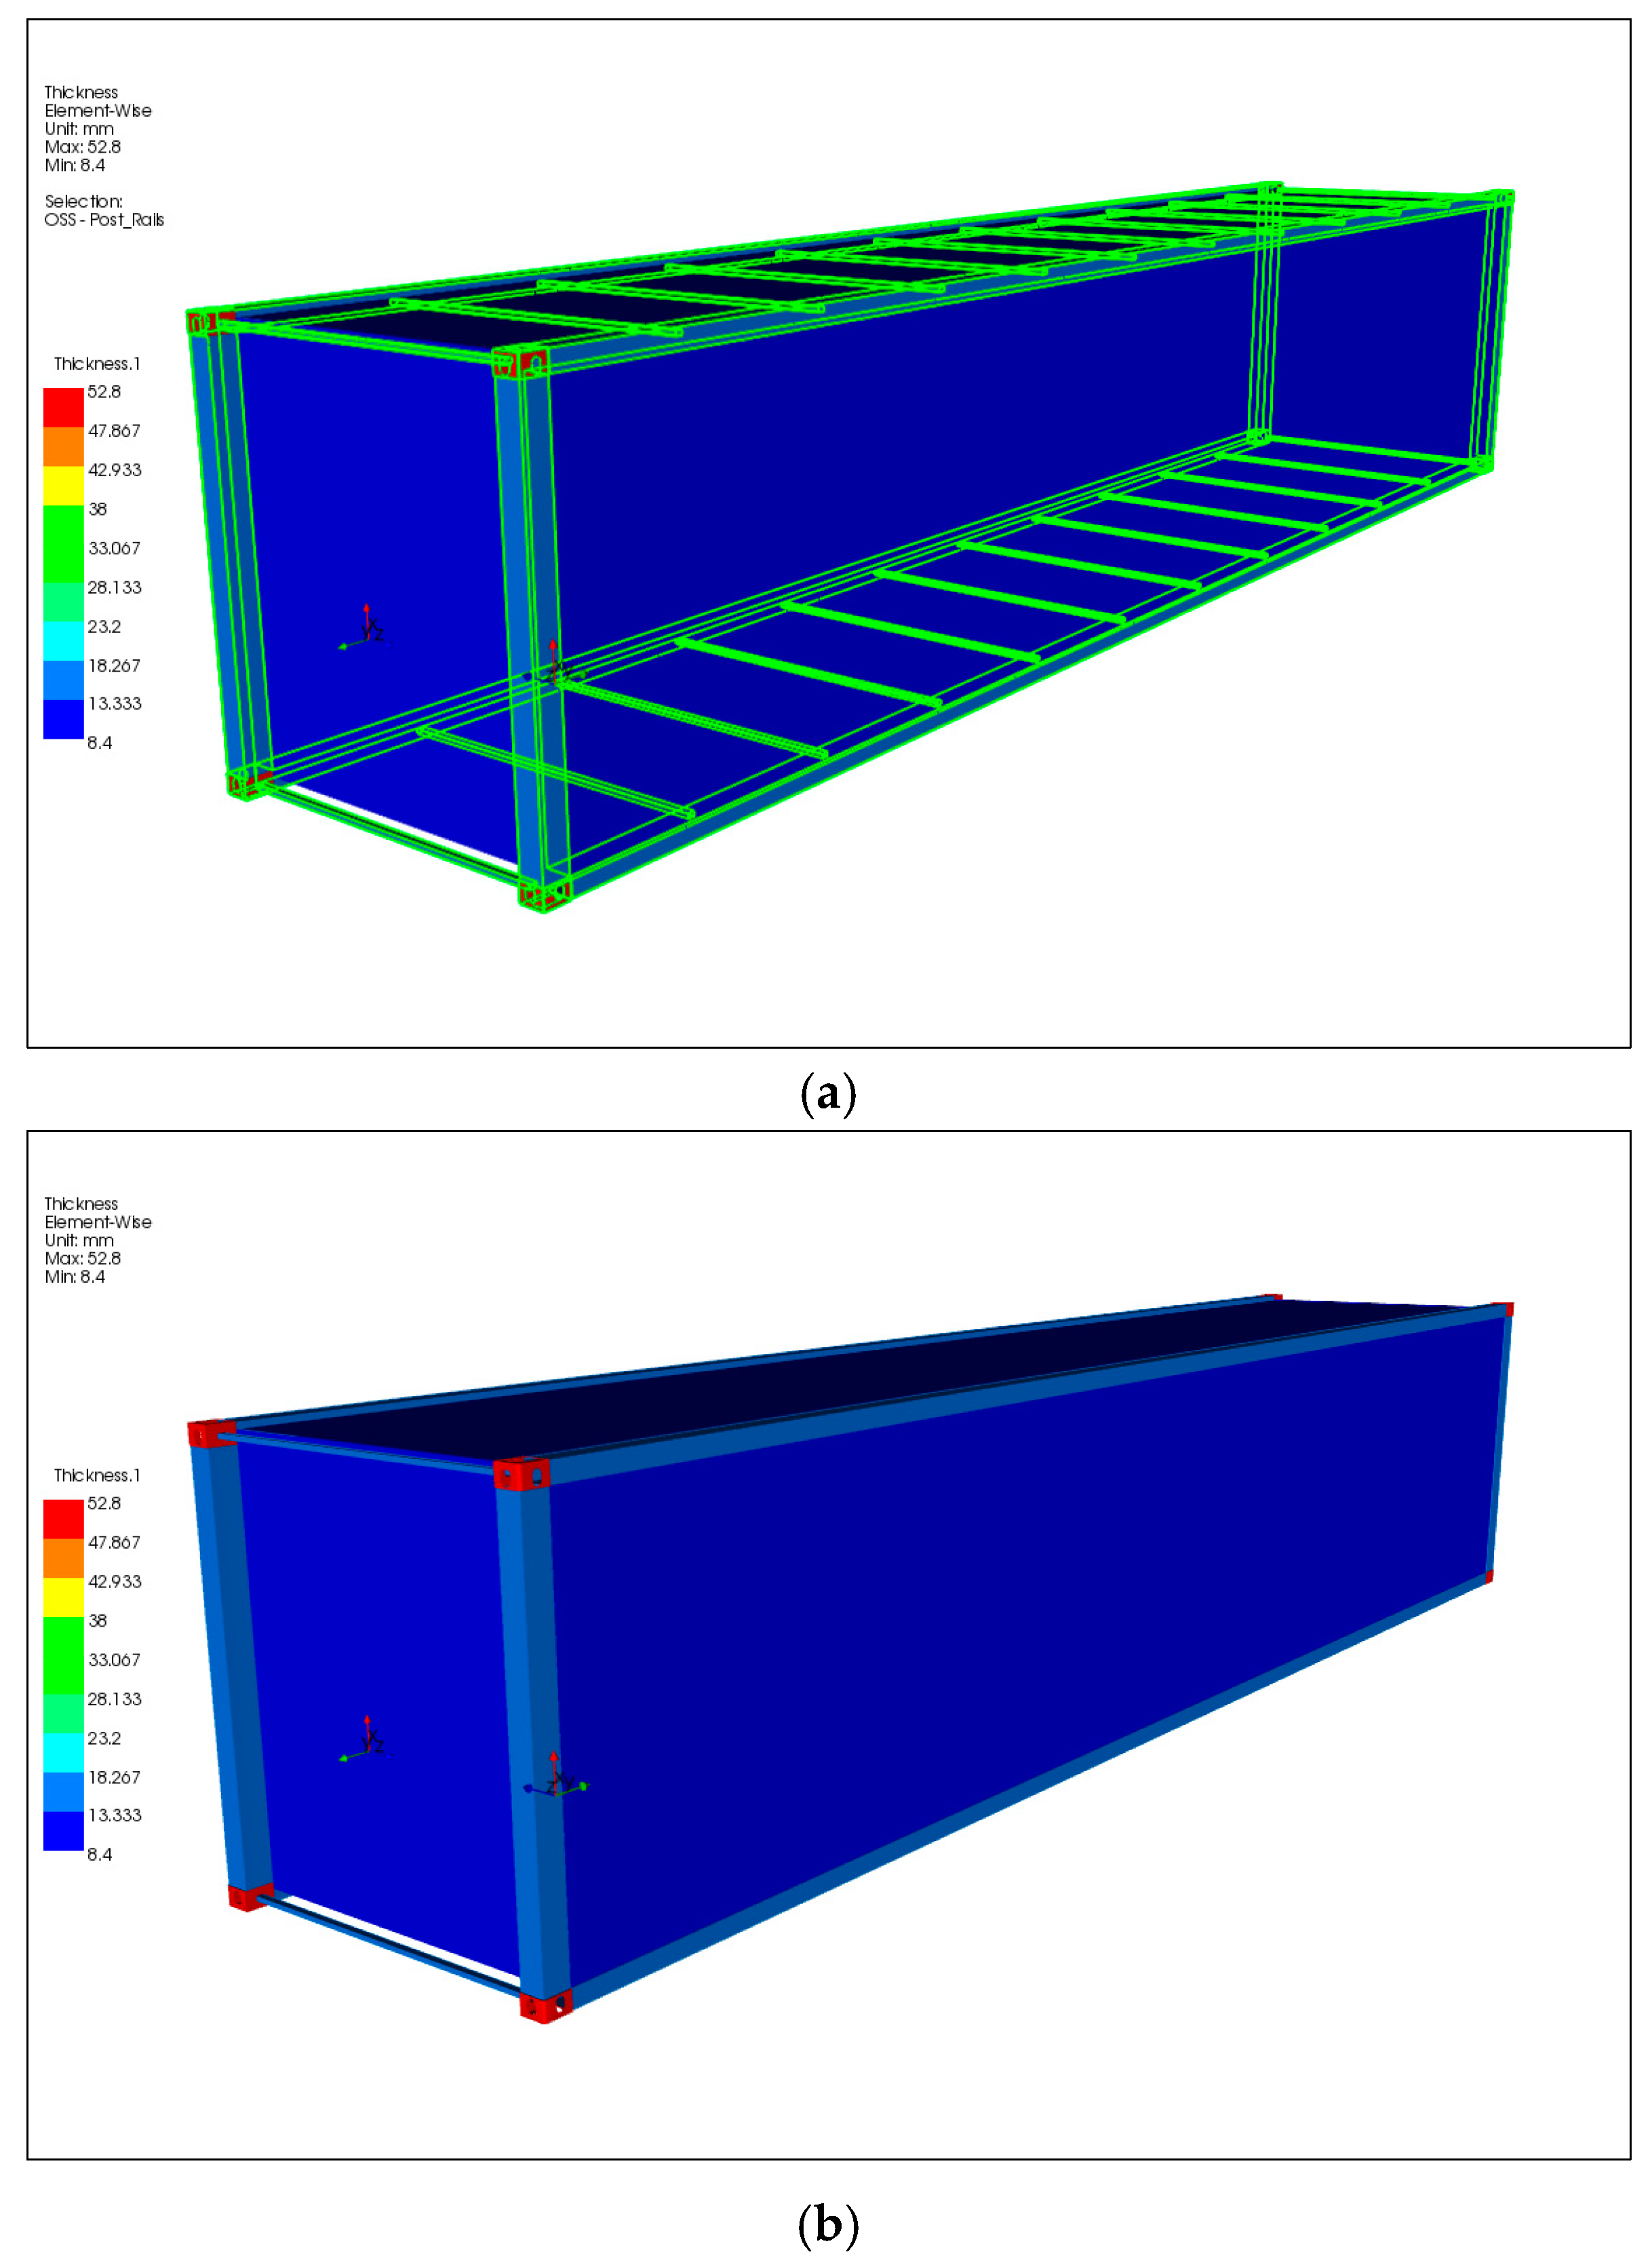
Some structural components such as all the corner posts, all the rails, and all the cross members of the container are made of two main quasi-isotropic laminates. Each of these laminates is composed of six layers of carbon fibers, a honeycomb layer, and six layers of carbon fibers. Each carbon fiber laminate has a 0.2 mm thickness. The honeycomb layer has a 6 mm thickness. The panels of the container are made of only one quasi-isotropic laminate. The corner fittings of the composite container are made of two main quasi-isotropic laminates and an additional 30 layers of quasi-isotropic laminates are added. Table 2 presents the number of composite layers used in the composite container. Figure 4 depicts the final composite container with its thicknesses.
Based on the quantities of composite layers used, Table 3 shows the final production values obtained. The final composite container weight is 822.87 kg. If the panels are excluded, the weight of the composite container is 351.25 kg.

4.2. Static Structural Analysis

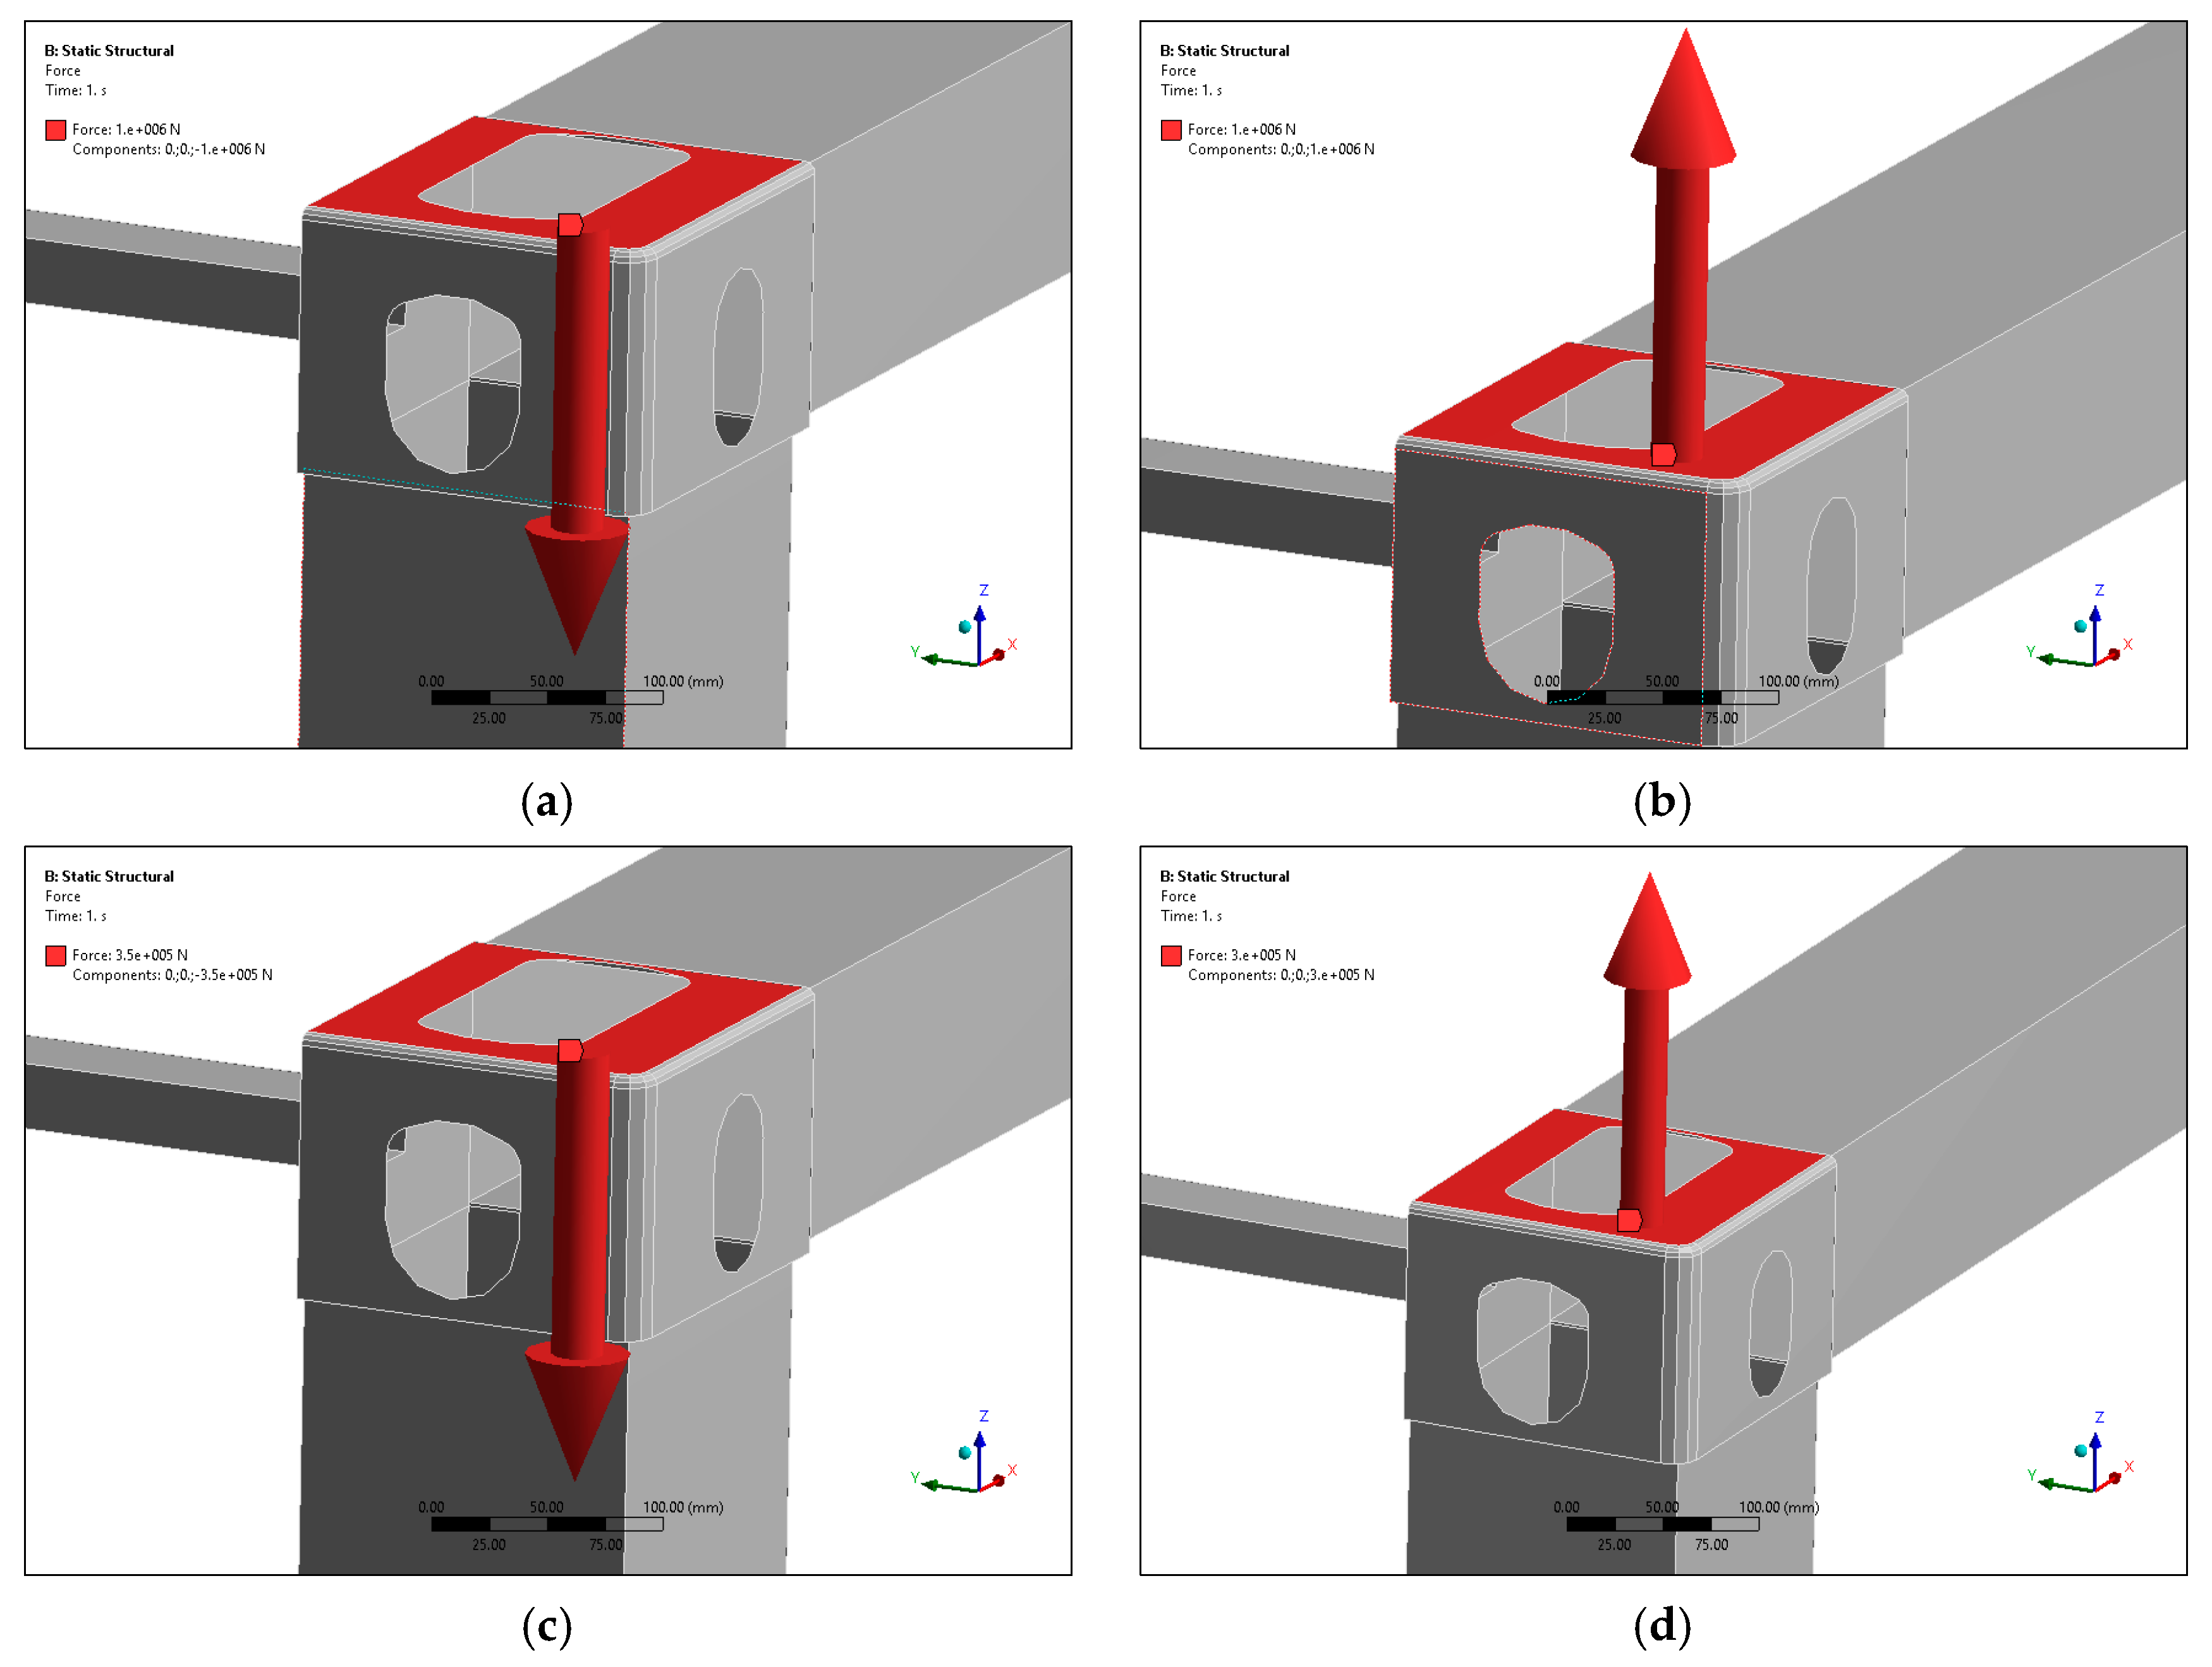
In a real-world scenario, one of the corner posts should be able to handle at least 48 tons of load. In addition, the lifting by a crane load of one of the corner fittings is the maximum gross weight of the 40-foot container (~30 tons) divided by 4, which is at least 7.5 tons. In this subsection, four main forces, some of which are extreme, are applied at one of the corner posts for the static structural analysis. Firstly, a 1000 kN force, which is equivalent to 100 tons of stacking load, is applied. Secondly, the composite container is assumed to be 100 tons. Therefore, a 1000 kN force, which is equivalent to 100 tons of lifting load, is applied at one of the corner posts. Thirdly, a 350 kN force, which is equivalent to 35 tons of stacking load, is applied. Finally, a 300 kN force, which is equivalent to 35 tons of lifting load, is applied (see Figure 5).
The deformations, stresses, and Von Mises criterion are observed (see Figure 6). The amount of deformation that a material undergoes is described by the strain [40]. The forces acting on a body are described by the stress. Stress, σ, is defined as the intensity of a force at a point. The Von Mises criterion, which is the effect of the intermediate principal stress, can be included by assuming that yielding depends on the root-mean-square diameter of the three Mohr’s circles, which is the Von Mises criterion [40].

4.3. Composite Layers Analysis: Inverse Reserve Factor (IRF)

Failure modes in composites are generally non-catastrophic and may involve localized damage via mechanisms such as fiber breakage, matrix cracking, debonding, and fiber pull-out. Failures might progress simultaneously and interactively, which complicates predicting the failure of composites [35]. Fiber buckling might also cause fiber-reinforced composites to fail. For instance, fiber breakage, matrix cracking, delamination, or a combination of these factors can arise [41]. The prediction of failure in composites is thus a difficult problem. The materials consist of both fibers and a matrix—both of which exhibit distinct failure modes. In addition, the interface between the fibers and resin, ply stacking sequence, and environmental conditions all contribute to failure [37].
In this subsection, the Tsai–Wu failure criterion [42] is used to observe the failures of carbon fiber composite parts. According to Campbell [35], the Tsai–Wu criterion provides the best fit to experimental test data. In the Tsai–Wu criterion, a composite ply subject to plane stress conditions will fail when some conditions are satisfied [42].
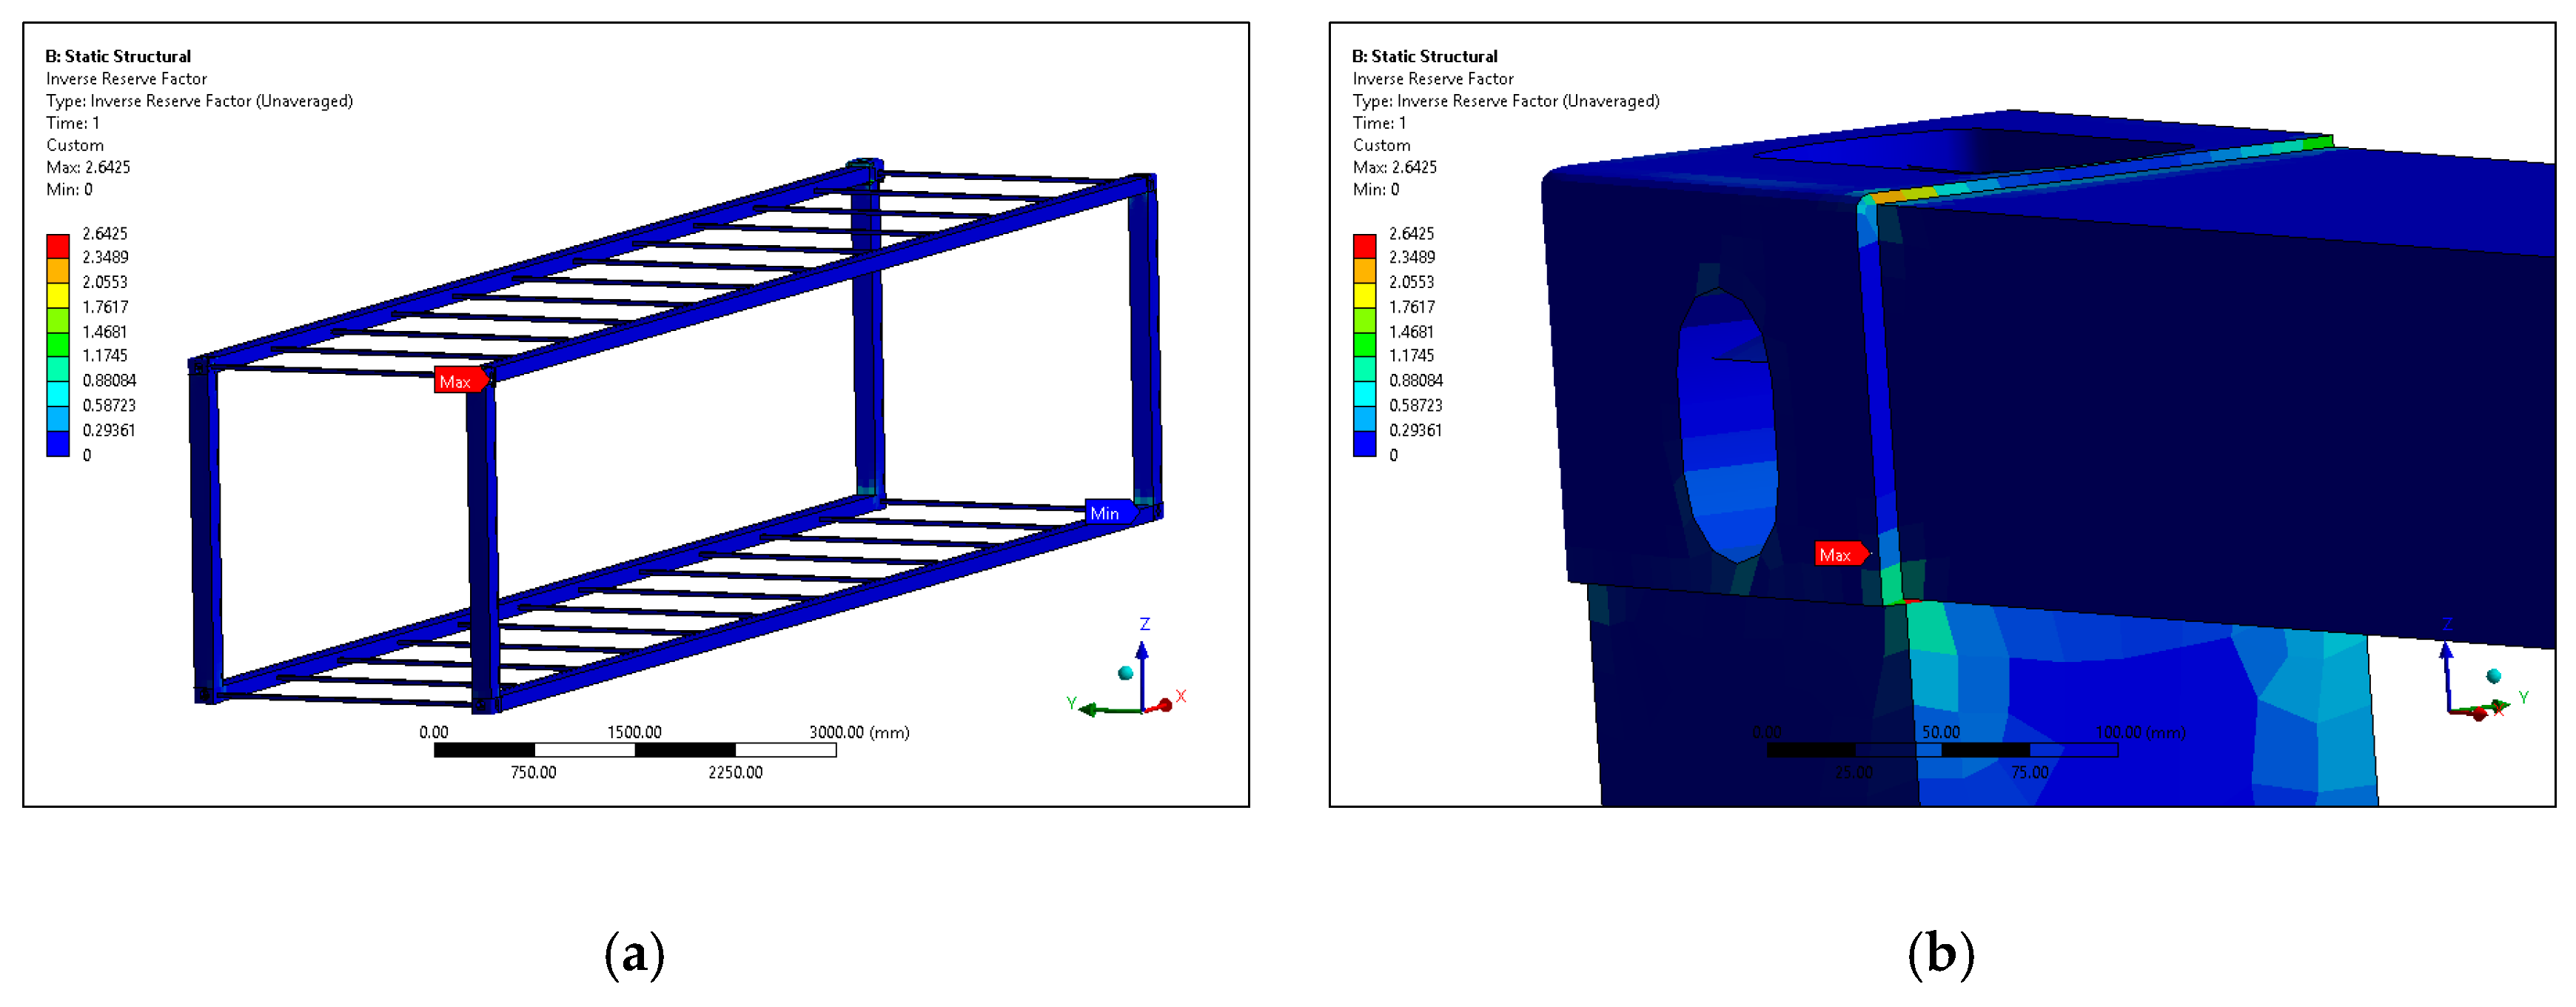
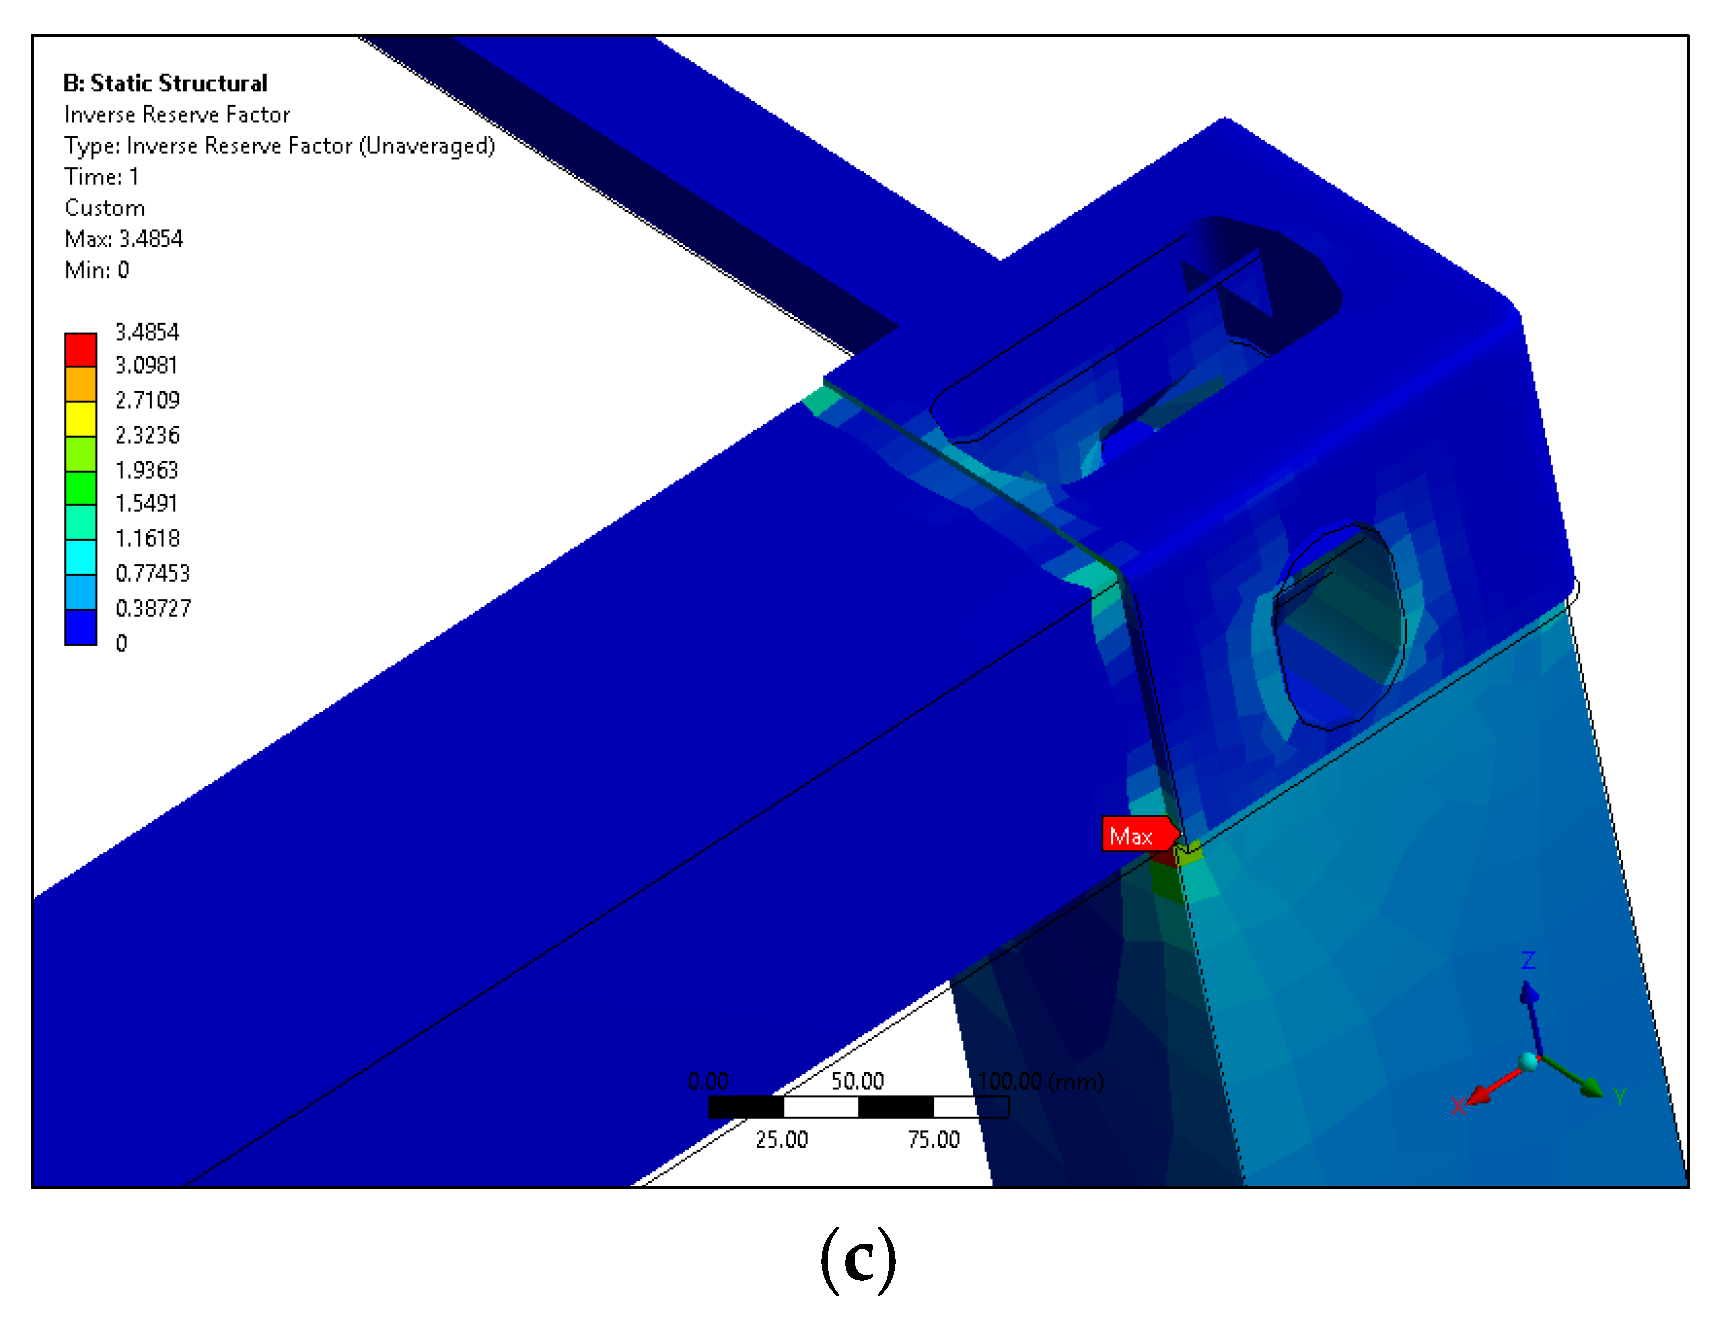
In this part, the inverse reserve factor (IRF) values are observed. This result type is an inverse margin to the safety factor. The failure load can be defined as the load value divided by the IRF. Failure is experienced when the IRF is greater than 1 (see Figure 7).

4.4. Buckling Analysis

Composite plates under compression and/or shear loading are sensitive to buckling failures [43]. When the load reaches a certain critical value, the member no longer remains straight, but deflects sideways at a more or less constant value of that load. Analysis of this idealized behavior sheds light on the real structural problem of buckling columns [44]. Buckling describes the process of switching from the straight, stiff configuration to the bent one that has a very small stiffness. The load at which this switch takes place is the critical buckling load [45].
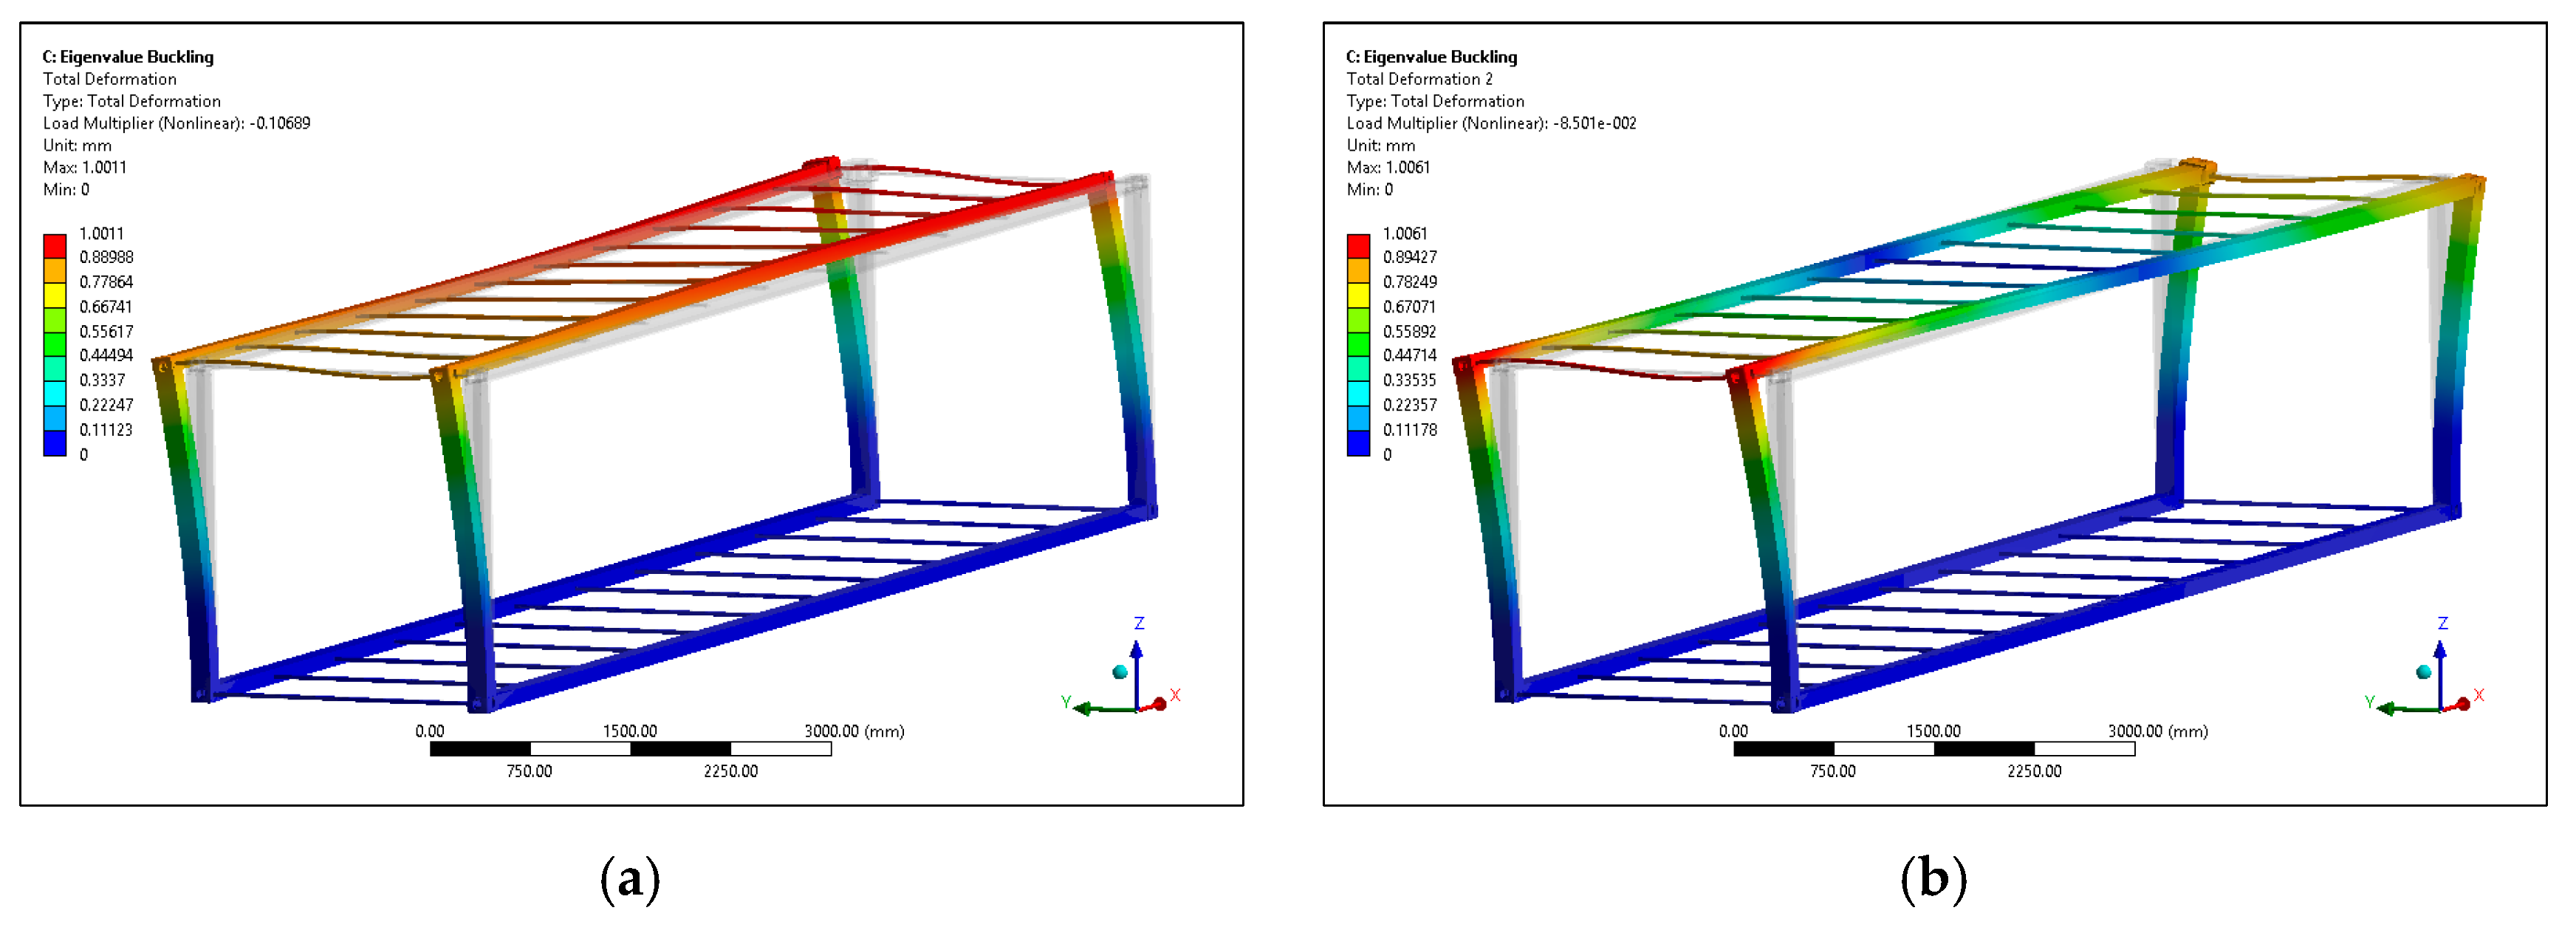
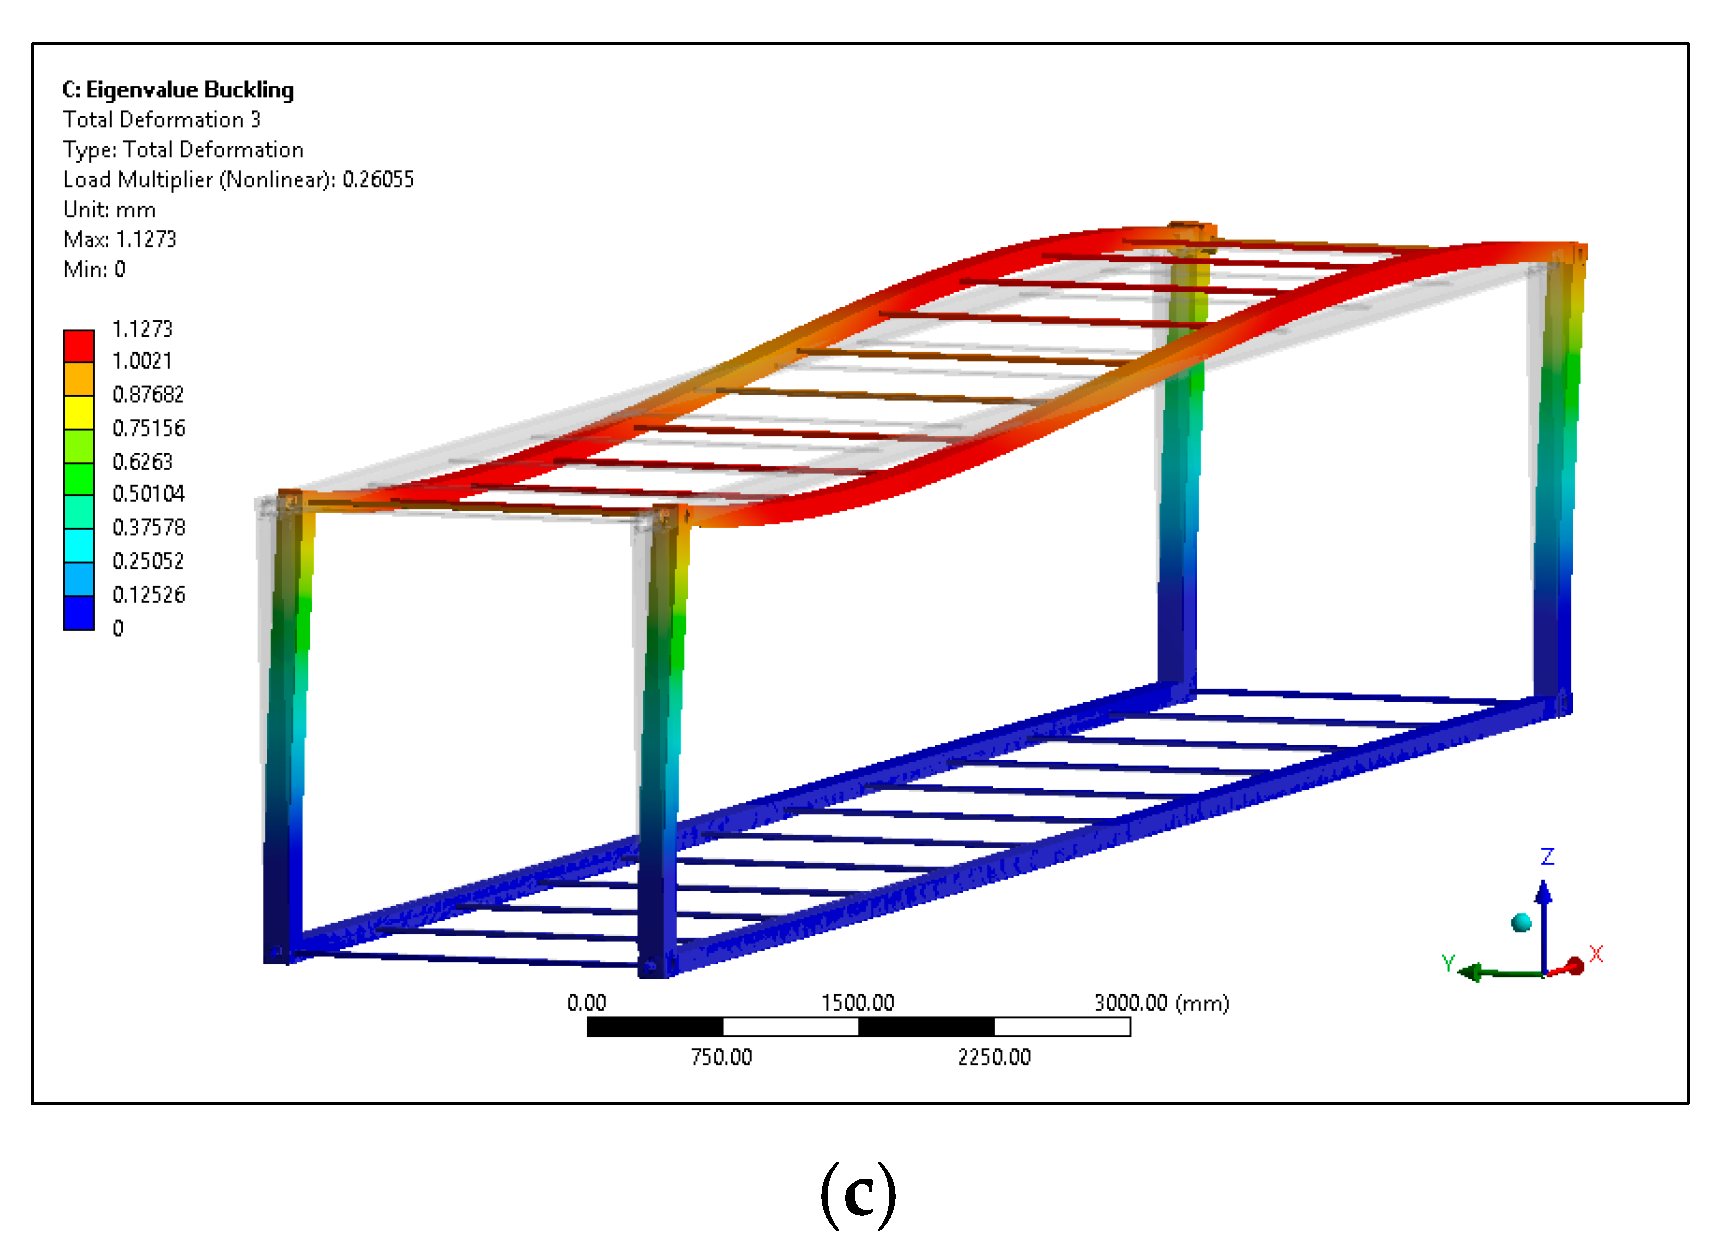
For the first mode, which is the starting-to-lean mode, ( 100 × 0.11 ) = 99.89 tons is the critical buckling load. For the second mode, the starting-to-twist mode, ( 100 × 0.09 ) = 99.91 tons is the critical buckling load. Finally, for the starting-to-wave-on-top-side mode, 100 + ( 100 × 0.26 ) = 126 tons is the critical buckling load for mode 3 (see Table 4). Based on the extracted modes, the composite container will start to buckle as soon as the loads reach the indicated critical values (see Figure 8).
Figure 8 depicts the buckling modes. The buckling modes are exaggerated ( × 320 ) to better visualize the phenomena.

4.5. Statistical Analysis

In this subsection, various statistical methods are used to visualize the data retrieved from the analyses of the composite container.
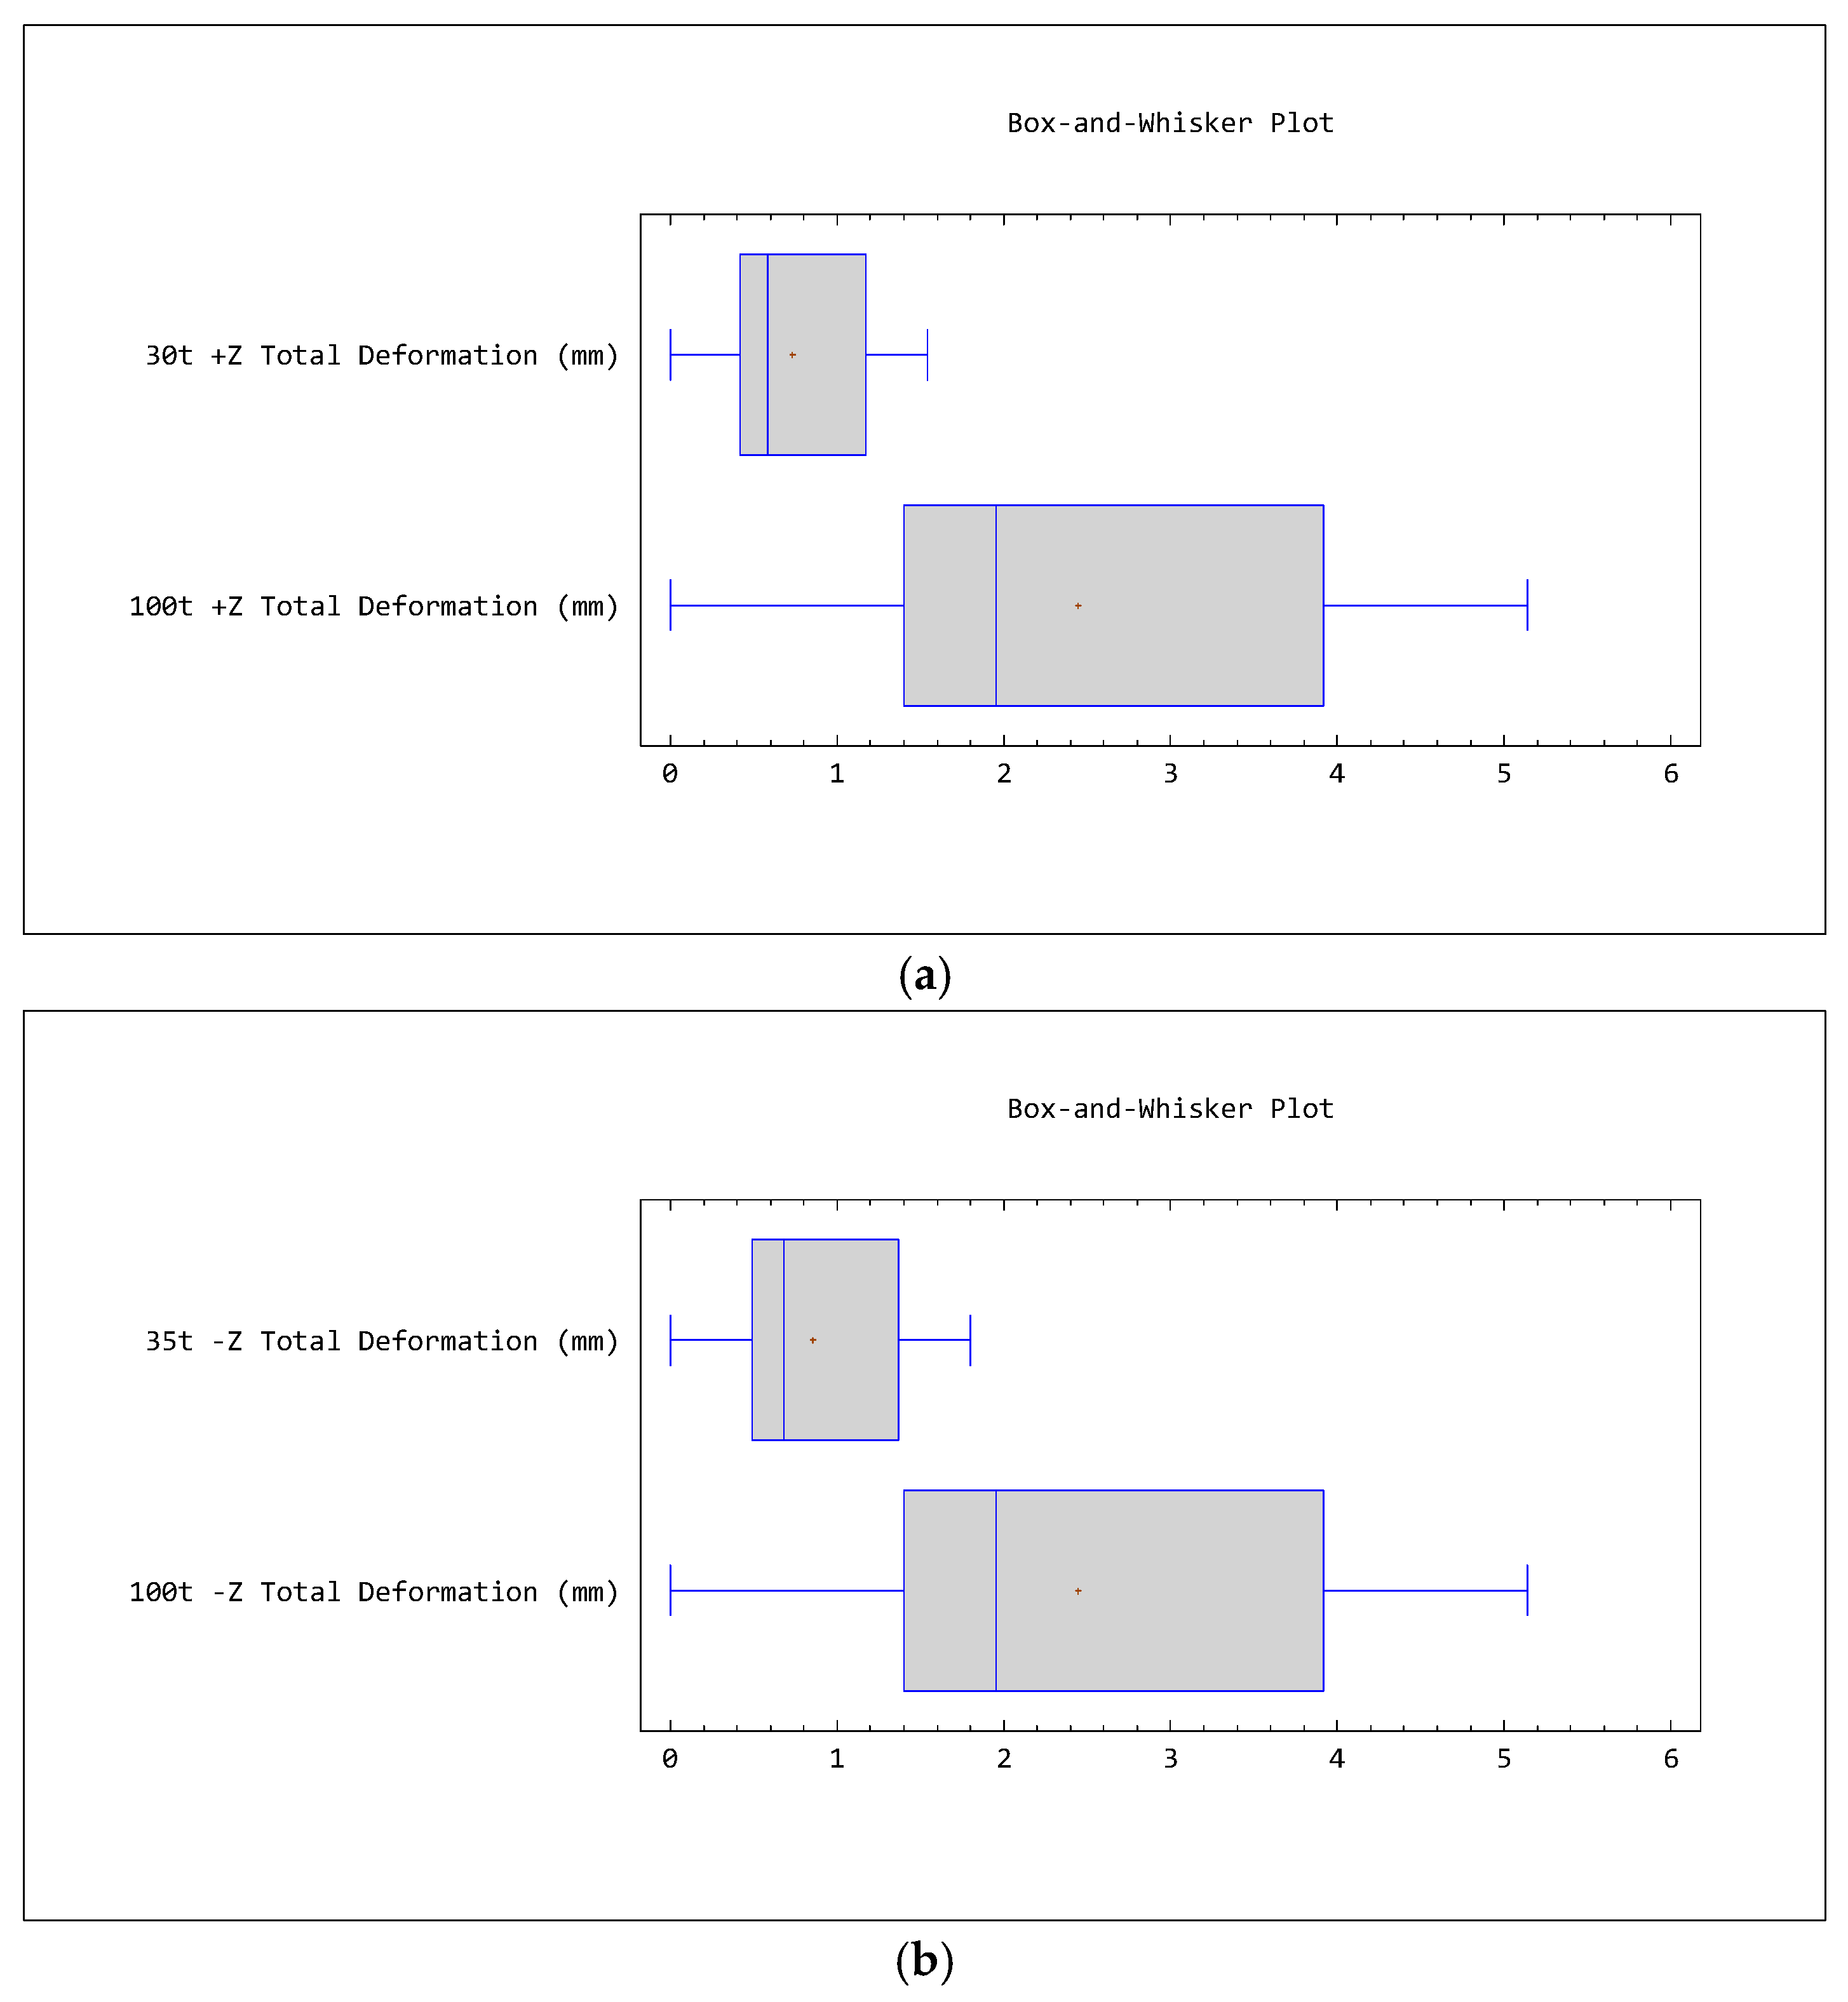
Table 5 shows the descriptive statistics of total deformations under various loads in the +Z or −Z direction. The maximum deformations (5.14 mm) occur at the corner fittings under 100 tons of load. Under 30 t and 35 t, these values are 1.5 mm and 1.79 mm, respectively. Table 6 shows the summary statistics for the two samples of data. Of particular interest here are the standardized skewness and standardized kurtosis, which can be used to determine whether the samples come from normal distributions.
In Table 6, the values of these statistics outside the range of −2 to +2 indicate significant departures from normality, which would tend to invalidate the tests (which compare standard deviations). In this case, all samples have standardized skewness values outside the normal range.
Two separate Kolmogorov–Smirnov (K-S) tests are performed to compare the distributions of the two sample pairs by computing the maximum distances between their cumulative distributions. As shown in Table 7, the maximum distances are 0.76 for the first pair and 0.64 for the last pair. Of particular interest is the approximate p-values for the tests. Since the p-values are less than 0.05, there are statistically significant differences in the distributions of the pairs at the 95% confidence level.
The Mann–Whitney W-test is used to compare the medians of the two samples (see Table 8). This test is constructed by combining the two samples, sorting the data from the smallest to largest values, and comparing the average ranks of the two samples in the combined data. Since the p-value is less than 0.05, there is a statistically significant difference between the medians at the 95% confidence level. Figure 9 compares the median values with the total deformations (mm) visually. If the load increases, the value of the deformation will increase.
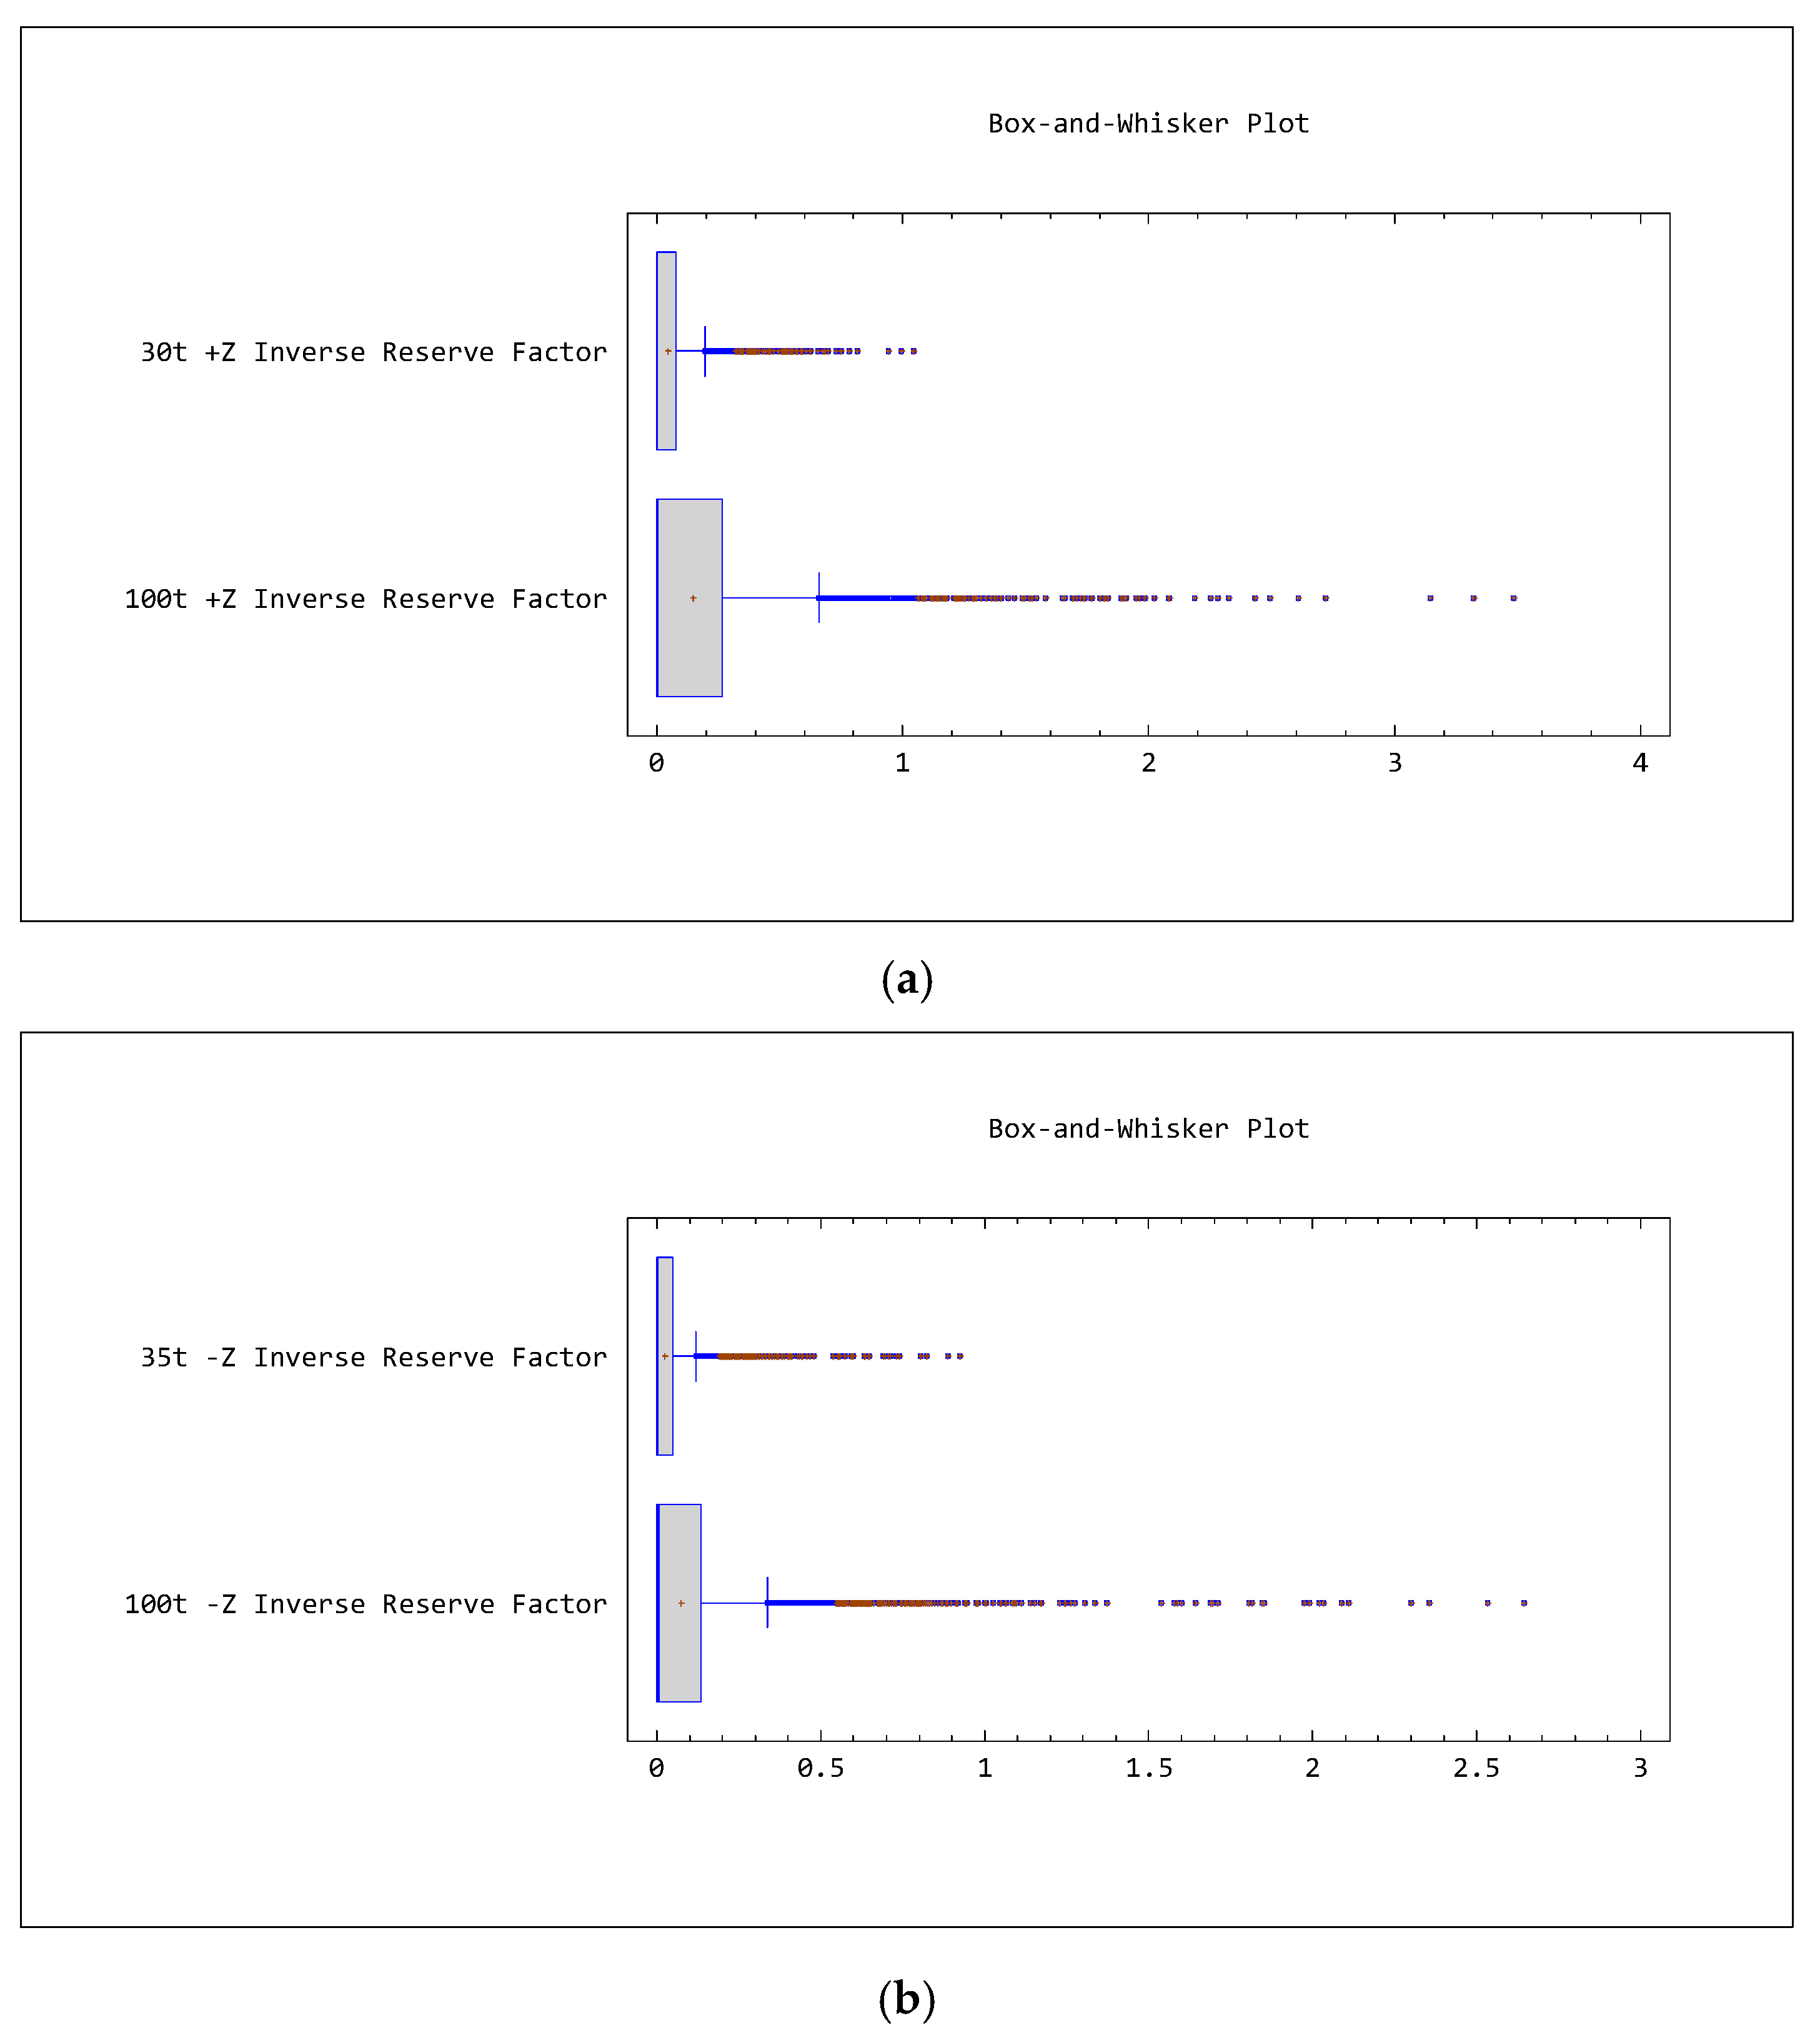
Table 9 provides the descriptive statistics of the IRF. Maximum values above 1 indicate fiber failure. The mean values and standard deviations are far below the critical value of 1, indicating that few of the nodes of the fibers fail. Figure 10 visualizes the IRF.
The composite fiber failure at a single node starts under a lifting load of 30 tons (see Table 10).
Figure 10 illustrates the fiber failures. The values greater than 1 indicate fiber failures. As the box-and-whisker plots depict, fiber failures occur at only a few nodes. Moreover, these fiber failures are only accumulated at the four corner fittings of the composite container. With the further reinforcement of the corner fittings, all the IRF values would be below 1.

5. Conclusions

The presented modeling and simulations effectively demonstrated a promising new future for container transportation in the shipping and logistics industry. In this study, static structural and buckling analyses were used to test and verify the presented design, providing insight and inspiration for the replacement of traditional steel containers with composites. However, the analyses indicated that corner fittings should be further reinforced to handle the extreme conditions that occur when containers are lifted and stacked on top of each other.
The current research has limitations, as it only theoretically developed a composite container made of carbon fibers. In this research, optimization techniques are not utilized to significantly reduce the carbon fiber materials. However, a realistic composite container model is presented. On the contrary, the corner fittings of the composite container have emerged as an issue that must be addressed with a different approach. At corner fittings, numerous plies are needed to achieve the strength necessary not to compromise the strength of the traditional corner fittings of a steel container. The plies of the corner fittings should not be any thicker, which might prevent the fitting of twist locks. To overcome this issue, special carbon fiber layers with a significantly higher elastic modulus could be used to make fittings thinner.
Further research should be performed on the topologically optimized container to further reduce the composite materials used and thus the weight of the container. In addition, the panels of the composite shipping container could be replaced by cost-efficient glass fiber composite solutions such as E-Glass/S-Glass to reduce the unit cost. With aggressive optimization strategies for the container frame, weight reductions exceeding 80% over traditional steel containers might become possible. However, the optimized design must not compromise the strength, functionality, and structural integrity. Topology optimization might further complicate the composite container manufacturing process, which already involves complex challenges. Furthermore, composite material solutions in the manufacturing industry are highly labor intensive, which necessitates a qualified workforce along with the resulting high labor costs.
Funding

This research received no external funding.

Conflicts of Interest

The author declares no conflicts of interest.

Appendix A

Table A1. Some standard shipping container dimensions.
Shipping Container TypeExternal LengthInternal LengthExternal HeightInternal HeightExternal WidthInternal Width
20-foot20-foot19 ft 9 inches8 ft 6 inches7 ft 10 inches8 ft7 ft 10 inches
6.09 m6.01 m2.59 m2.39 m2.44 m2.34 m
40-foot40-foot39 ft 9 inches8 ft 6 inches7 ft 10 inches8 ft7 ft 10 inches
12.18 m12.11 m2.59 m2.39 m2.44 m2.34 m
20-foot high cube20-foot19 ft 9 inches9 ft 6 inches8 ft 10 inches8 ft7 ft 10 inches
6.09 m6.01 m2.90 m2.69 m2.44 m2.3 m
40-foot high cube40-foot39 ft 9 inches9 ft 6 inches8 ft 10 inches8 ft7 ft 10 inches
12.18 m12.11 m2.90 m2.69 m2.44 m2.34 m
Table A2. Typical cubic capacities of standard shipping containers.
Length:10-Foot20-Foot40-Foot
Cubic capacity15.95 cubic meters33.2 cubic meters67.59 cubic meters
563.3 cubic feet1173 cubic feet2387 cubic feet
Table A3. Epoxy carbon unidirectional (230 GPa) prepreg orthotropic elasticity.
PropertyValue
Density ρ   0.00149 g mm 3  
Elastic modulus of longitudinal direction E 1 (Young’s Modulus X direction)1,121,000 MPa
Elastic modulus in transverse direction E 2 (Young’s Modulus Y direction)8600 MPa
Young’s Modulus Z direction8600 MPa
Poisson’s ratio υ 12 (Poisson’s Ratio XY)0.27
Poisson’s Ratio YZ0.4
Poisson’s Ratio XZ0.27
Shear modulus G 12 (Shear Modulus XY)4700 MPa
Shear Modulus YZ3100 MPa
Shear Modulus XZ4700 MPa
Longitudinal tensile strength X t   2231 MPa
Longitudinal compressive strength X c   1082 MPa
Transverse tensile strength Y t   29 MPa
Transverse compressive strength Y c   100 MPa
Shear strength S   60 MPa

References

  1. Buchanan, C.A.; Charara, M.; Sullivan, J.L.; Lewis, G.M.; Keoleian, G.A. Lightweighting shipping containers: Life cycle impacts on multimodal freight transportation. Transp. Res. Part D-Transp. Environ. 2018, 62, 418–432. [Google Scholar] [CrossRef] [Green Version]
  2. Sullivan, J.L.; Lewis, G.M.; Keoleian, G.A. Effect of mass on multimodal fuel consumption in moving people and freight in the US. Transp. Res. Part D-Transp. Environ. 2018, 63, 786–808. [Google Scholar] [CrossRef]
  3. Obrecht, M.; Knez, M. Carbon and resource savings of different cargo container designs. J. Clean. Prod. 2017, 155, 151–156. [Google Scholar] [CrossRef]
  4. Goh, S.H. The impact of foldable ocean containers on back haul shippers and carbon emissions. Transp. Res. Part D-Transp. Environ. 2019, 67, 514–527. [Google Scholar] [CrossRef]
  5. Sureeyatanapas, P.; Poophiukhok, P.; Pathumnakul, S. Green initiatives for logistics service providers: An investigation of antecedent factors and the contributions to corporate goals. J. Clean. Prod. 2018, 191, 1–14. [Google Scholar] [CrossRef]
  6. William, G.W.; Shoukry, S.N.; Prucz, J.C.; William, M.M. Lightweight Composite Air Cargo Containers. SAE Int. J. Aerosp. 2016, 9, 185–189. [Google Scholar] [CrossRef]
  7. Ranta, T.; Fohr, J.; Karttunen, K.; Knutas, A. Radio frequency identification and composite container technology demonstration for transporting logistics of wood biomass. J. Renew. Sustain. Energy 2014, 6. [Google Scholar] [CrossRef]
  8. Lee, C.Y.; Song, D.P. Ocean container transport in global supply chains: Overview and research opportunities. Transp. Res. Part B-Methodol. 2017, 95, 442–474. [Google Scholar] [CrossRef]
  9. Rødseth, K.L.; Wangsness, P.B.; Schøyen, H. How do economies of density in container handling operations affect ships’ time and emissions in port? Evidence from Norwegian container terminals. Transp. Res. Part D Transp. Environ. 2018, 59, 385–399. [Google Scholar] [CrossRef]
  10. Wu, W.M.; Huang, D.S. Modelling the profitability of container shipping lines: Theory and empirical evidence. Transp. Policy 2018, 72, 159–170. [Google Scholar] [CrossRef]
  11. Mantovani, S.; Morganti, G.; Umang, N.; Crainic, T.G.; Frejinger, E.; Larsen, E. The load planning problem for double-stack intermodal trains. Eur. J. Oper. Res. 2018, 267, 107–119. [Google Scholar] [CrossRef]
  12. Notteboom, T.E.; Vernimmen, B. The effect of high fuel costs on liner service configuration in container shipping. J. Transp. Geogr. 2009, 17, 325–337. [Google Scholar] [CrossRef]
  13. Denac, M.; Obrecht, M.; Radonjic, G. Current and potential ecodesign integration in small and medium enterprises: Construction and related industries. Bus. Strategy Environ. 2018, 27, 825–837. [Google Scholar] [CrossRef]
  14. Andriankaja, H.; Vallet, F.; Le Duigou, J.; Eynard, B. A method to ecodesign structural parts in the transport sector based on product life cycle management. J. Clean. Prod. 2015, 94, 165–176. [Google Scholar] [CrossRef]
  15. Acanfora, M.; Montewka, J.; Hinz, T.; Matusiak, J. On the estimation of the design loads on container stacks due to excessive acceleration in adverse weather conditions. Mar. Struct. 2017, 53, 105–123. [Google Scholar] [CrossRef]
  16. Majidian, H.; Azarsina, F. Aerodynamic Simulation of A Containership to Evaluate Cargo Configuration Effect on Frontal Wind Loads. China Ocean Eng. 2018, 32, 196–205. [Google Scholar] [CrossRef]
  17. Khor, Y.S.; Dohlie, K.A.; Konovessis, D.; Xiao, Q. Optimum Speed Analysis for Large Containerships. J. Ship Prod. Des. 2013, 29, 93–104. [Google Scholar] [CrossRef]
  18. Podeur, V.; Merdrignac, D.; Behrel, M.; Roncin, K.; Fonti, C.; Jochum, C.; Parlier, Y.; Renaud, P. Fuel economy assessment tool for auxiliary kite propulsion of merchant ship. Houille Blanche-Rev. Int. 2018, 5–7. [Google Scholar] [CrossRef]
  19. Malchow, U. Growth in containership sizes to be stopped? Marit. Bus. Rev. 2017, 2, 199–210. [Google Scholar] [CrossRef] [Green Version]
  20. Martin, S.; Martin, J.; Lai, P. International container design regulations and ISO standards: Are they fit for purpose? Marit. Policy Manag. 2018, 46, 217–236. [Google Scholar] [CrossRef]
  21. Abrasheva, G.; Haussling, R.; Senk, D. Shipping containers in a sustainable city. Rev. Metall.-Cah. D Inf. Tech. 2013, 110, 55–63. [Google Scholar] [CrossRef]
  22. Abrasheva, G.; Senk, D.; Haussling, R. Shipping containers for a sustainable habitat perspective. Rev. Metall.-Cah. D Inf. Tech. 2012, 109, 381–389. [Google Scholar] [CrossRef]
  23. Goulielmos, A.M. After End-2008 Structural Changes in Containership Market and Their Impact on Industry’s Policy. Int. J. Financ. Stud. 2018, 6, 90. [Google Scholar] [CrossRef]
  24. Kana, A.A.; Harrison, B.M. A Monte Carlo approach to the ship-centric Markov decision process for analyzing decisions over converting a containership to LNG power. Ocean Eng. 2017, 130, 40–48. [Google Scholar] [CrossRef] [Green Version]
  25. Cariou, P.; Parola, F.; Notteboom, T. Towards low carbon global supply chains: A multi-trade analysis of CO2 emission reductions in container shipping. Int. J. Prod. Econ. 2019, 208, 17–28. [Google Scholar] [CrossRef]
  26. Patricksson, O.; Erikstad, S.O. A two-stage optimization approach for sulphur emission regulation compliance. Marit. Policy Manag. 2017, 44, 94–111. [Google Scholar] [CrossRef]
  27. Priftis, A.; Boulougouris, E.; Turan, O.; Papanikolaou, A. Parametric design and multi-objective optimisation of containerships. Ocean Eng. 2018, 156, 347–357. [Google Scholar] [CrossRef] [Green Version]
  28. Guven, C.; Eliiyi, D.T. Modelling and optimisation of online container stacking with operational constraints. Marit. Policy Manag. 2019, 46, 201–216. [Google Scholar] [CrossRef]
  29. Ding, D.; Chou, M.C. Stowage planning for container ships: A heuristic algorithm to reduce the number of shifts. Eur. J. Oper. Res. 2015, 246, 242–249. [Google Scholar] [CrossRef]
  30. Parreno, F.; Pacino, D.; Alvarez-Valdes, R. A GRASP algorithm for the container stowage slot planning problem. Transp. Res. Part E-Logist. Transp. Rev. 2016, 94, 141–157. [Google Scholar] [CrossRef] [Green Version]
  31. Christensen, J.; Pacino, D. A matheuristic for the Cargo Mix Problem with Block Stowage. Transp. Res. Part E-Logist. Transp. Rev. 2017, 97, 151–171. [Google Scholar] [CrossRef] [Green Version]
  32. Lee, H.B.; Aydin, N.; Choi, Y.; Lekhavat, S.; Irani, Z. A decision support system for vessel speed decision in maritime logistics using weather archive big data. Comput. Oper. Res. 2018, 98, 330–342. [Google Scholar] [CrossRef]
  33. Bal, F.; Vleugel, J. Container ship calls: Triple throughput without an increase in marine CO2, NOx and PM10 emissions? Eur. Transp.-Trasp. Eur. 2015, 5, 58. [Google Scholar]
  34. Ammar, N.R. An environmental and economic analysis of methanol fuel for a cellular container ship. Transp. Res. Part D Transp. Environ. 2019, 69, 66–76. [Google Scholar] [CrossRef]
  35. Campbell, F.C. Structural Composite Materials; ASM International: Materials Park, OH, USA, 2010; p. xiii. [Google Scholar]
  36. Staab, G. Laminar Composites; Elsevier Science & Technology: Amsterdam, The Netherlands, 2015. [Google Scholar]
  37. Baker, A.A.; Dutton, S.; Kelly, D. Composite Materials for Aircraft Structures; American Institute of Aeronautics and Astronautics: Reston, VA, USA, 2000. [Google Scholar]
  38. Doughett, A.; Asnarez, P. Composite Laminates: Properties, Performance and Applications; Nova Science Publishers, Incorporated: Hauppauge, NY, USA, 2009. [Google Scholar]
  39. Hibbeler, R.C. Mechanics of Materials, 9th ed.; Prentice Hall: Boston, MA, USA, 2014; p. xvii. [Google Scholar]
  40. Hosford, W.F. Mechanical Behavior of Materials; Cambridge University Press: New York, NY, USA, 2009. [Google Scholar]
  41. Kollár, L.P.; Springer, G.S. Mechanics of Composite Structures; Cambridge University Press: New York, NY, USA, 2003. [Google Scholar]
  42. Tsai, S.W.; Wu, E.M. A General Theory of Strength for Anisotropic Materials. J. Compos. Mater. 2016, 5, 58–80. [Google Scholar] [CrossRef]
  43. Kassapoglou, C.; Kassapoglou, C. Design and Analysis of Composite Structures: With Applications to Aerospace Structures; John Wiley & Sons, Incorporated: New York City, NY, USA, 2010. [Google Scholar]
  44. Heyman, J. Basic Structural Theory; Cambridge University Press: New York, NY, USA, 2008. [Google Scholar]
  45. Kyriakides, S.; Corona, E. Mechanics of Offshore Pipelines: Volume 1 Buckling and Collapse; Elsevier Science & Technology: Oxford, UK, 2007. [Google Scholar]
Figure 1. (a) The exterior view of a standard 40-foot ISO container made of steel, and (b) the interior view of the structural components of a container.
Logistics 03 00018 g001aLogistics 03 00018 g001b
Figure 2. Properties of carbon fibers. (a) Epoxy carbon unidirectional (UD) (230 GPa ), (b) quasi-isotropic laminates without honeycomb (230 GPa ), and (c) quasi-isotropic laminates with honeycomb (230 GPa ).
Logistics 03 00018 g002
Figure 3. (a) The quasi-isotropic laminates with a honeycomb layer (plies with 0°, 90°, +45°, −45°, 0°, 90°; one layer of honeycomb; and plies with 90°, 0°, −45, +45, 90°, 0°), (b) quasi-isotropic laminates with honeycomb in the middle, (c) quasi-isotropic laminates without honeycomb (0°, 90°, +45°, −45°, 0°, 90°), (d) quasi-isotropic laminates without honeycomb, (e) a sample honeycomb unit cell, and (f) a sample honeycomb layer.
Logistics 03 00018 g003aLogistics 03 00018 g003b
Figure 4. (a) Corner posts, corner fittings, bars, and rails are highlighted. (b) 40-foot composite container. Thicknesses of composite layers are displayed.
Logistics 03 00018 g004
Figure 5. Force directions. (a) Stacking: ~100 tons (1000 kN) negative Z direction, (b) lifting: ~100 tons (1000 kN) plus Z direction, (c) stacking: ~35 tons (350 kN) negative Z direction, and (d) lifting: ~30 tons (300 kN) plus Z direction.
Logistics 03 00018 g005
Figure 6. (a) Stacking: Total deformation (1000 kN negative z direction), (b) stacking: Von Mises stress distribution (1000 kN negative z direction), and (c) lifting: Total deformation (1000 kN positive z direction).
Logistics 03 00018 g006aLogistics 03 00018 g006b
Figure 7. Inverse reserve factor (IRF) analysis results. (a) The corners are under ~100 tons of load (1000 kN negative z direction), (b) IRF of the corner fitting: the corner is under ~100 tons of load (1000 kN negative z direction), and (c) IRF of the corner fitting: under ~100 tons pulling load (1000 kN positive z direction).
Logistics 03 00018 g007aLogistics 03 00018 g007b
Figure 8. Each corner is under ~100 tons of load and the phenomena is exaggerated 320 times. (a) Buckling mode 1, (b) buckling mode 2, and (c) buckling mode 3.
Logistics 03 00018 g008aLogistics 03 00018 g008b
Figure 9. (a) Lifting: +Z total deformation and (b) stacking: −Z total deformation.
Logistics 03 00018 g009
Figure 10. (a) Lifting: Positive Z direction inverse reserve factor (IRF) and (b) stacking: Negative Z direction IRF.
Logistics 03 00018 g010
Table 1. Typical weights of some standard shipping containers.
Length10-Foot20-Foot40-Foot
Maximum gross weight11,300 kg30,480 kg30,400 kg
24,910 lbs67,200 lbs67,200 lbs
Tare weight1300 kg2160 kg3750 kg
2870 lbs4760 lbs8270 lbs
Payload (net weight)10,000 kg28,320 kg26,730 kg
22,040 lbs62,440 lbs58,930 lbs
Table 2. Quantities of composite layers used.
Components of the Composite ContainerQuantity of Composite Layers
All corner posts, all rails, and all cross members2 × [quasi-isotropic laminates (6 layers + one honeycomb + 6 layers)]
Panels1 × [quasi-isotropic laminates (6 layers + one honeycomb + 6 layers)]
Corner fittings2 × [quasi-isotropic laminates (6 layers + one honeycomb + 6 layers)] and 30 × [quasi-isotropic laminates (6 layers without honeycomb)]
Table 3. Production values.
SectionArea and WeightValue
All elements (including panels)Covered area155.72 m 2
Modeling ply area195.74 m 2
Production ply area212.67 m 2
Weight822.87 kg
All corner posts, all rails, all cross members, and all corner fittings (excluding panels)Covered area39.44 m 2  
Modeling ply area79.46 m 2  
Production ply area96.40 m 2  
Weight351.25 kg  
Table 4. Buckling modes ( ψ i ) and buckling load multipliers ( λ i ) .
ψ i λ i
Mode 1 0.11
Mode 2 0.09
Mode 3 + 0.26
Table 5. Descriptive statistics of total deformations under various loads in the +Z or −Z direction.
Load TypeLoad and DirectionValid N
(Nodes)
Mean
(mm)
Minimum
(mm)
Maximum
(mm)
Std. dev.
Lifting30 t, positive Z195960.7320.0001.5420.415
100 t, positive Z195962.4410.0005.1401.382
Stacking35 t, negative Z195960.8540.0001.7990.484
100 t, negative Z195962.4410.0005.1401.382
Table 6. Summary statistics of total deformations under various loads in the +Z or −Z direction.
DirectionPositive Z
(Lifting Load)
Negative Z
(Stacking Load)
Load30 t100 t35 t100 t
Count19,59619,59619,59619,596
Average0.732.440.852.44
Standard deviation0.411.380.481.38
Coefficient of variation56.61%56.61%56.61%56.61%
Minimum0.000.000.000.00
Maximum1.545.141.805.14
Range1.545.141.805.14
Std. skewness4.624.624.624.62
Std. kurtosis−38.05−38.05−38.05−38.05
Table 7. Kolmogorov–Smirnov (K-S) test.
Test num.Load DirectionStatisticValue
1Distributions of 30 t and 100 t loads in the positive Z direction (lifting)Estimated overall statistic DN0.76
Two-sided large sample K-S statistic75.49
Approximate p-value0.00
2Distributions of 35 t and 100 t loads in the negative Z direction (stacking)Estimated overall statistic DN0.64
Two-sided large sample K-S statistic62.99
Approximate p-value0.00
Table 8. Mann–Whitney (Wilcoxon) W-test to compare medians.
Test num.Comparison of MediansTestValue
130 t and 100 t lifting loads in the positive Z directionMedian of sample 10.58531
Median of sample 21.951
Average rank of sample 112,004.3
Average rank of sample 227,188.7
W340778000
p-value0.00
235 t and 100 t stacking loads in the negative Z directionMedian of sample 10.68287
Median of sample 21.951
Average rank of sample 112,702.5
Average rank of sample 226,490.5
W327096000
p-value0.00
Tests 1 and 2: Null hypothesis: median1 = median2, alt. hypothesis: median1 median2, reject the null hypothesis for alpha = 0.05.
Table 9. Descriptive statistics of the inverse reserve factor (IRF).
Load TypeLoad and DirectionValid NMeanMinimumMaximumStd. Dev.
Lifting30 t, positive Z19,7210.0450.0001.0460.070
100 t, positive Z19,7210.1490.0003.4850.234
Stacking35 t, negative Z19,7210.0260.0000.9250.046
100 t, negative Z19,7210.0740.0002.6430.131
Table 10. Frequency table: 30 t +Z inverse reserve factor (IRF), Kolmogorov–Smirnov (K-S) d = 0.28266, p < 0.01.
Node CountCumulative Count of Nodes% of ValidCumulative % of Valid% of All CasesCumulative % of All Cases
0 < x 0.722 × 10 15 1491490.7560.7560.7560.756
0.722 × 10 15   < x     0.2 19,12119,27096.95897.71396.95897.713
0.2 < x 0.4 39419,6641.99899.7111.99899.711
0.4 < x 0.6 4119,7050.20899.9190.20899.919
0.6 < x 0.8 1119,7160.05699.9750.05699.975
0.8 < x 1 419,7200.02099.9950.02099.995
1 < x 1.2 119,7210.0051000.005100
Missing019,7210 0100