Impacts of Additive Manufacturing on Supply Chain Flow: A Simulation Approach in Healthcare Industry

Abstract
:1. Introduction
- No need for tooling
- Feasibility of producing small production batches economically
- Possibility for quickly change design
- Product optimization for function
- More economical custom product manufacturing plus the capability to produce complex geometries
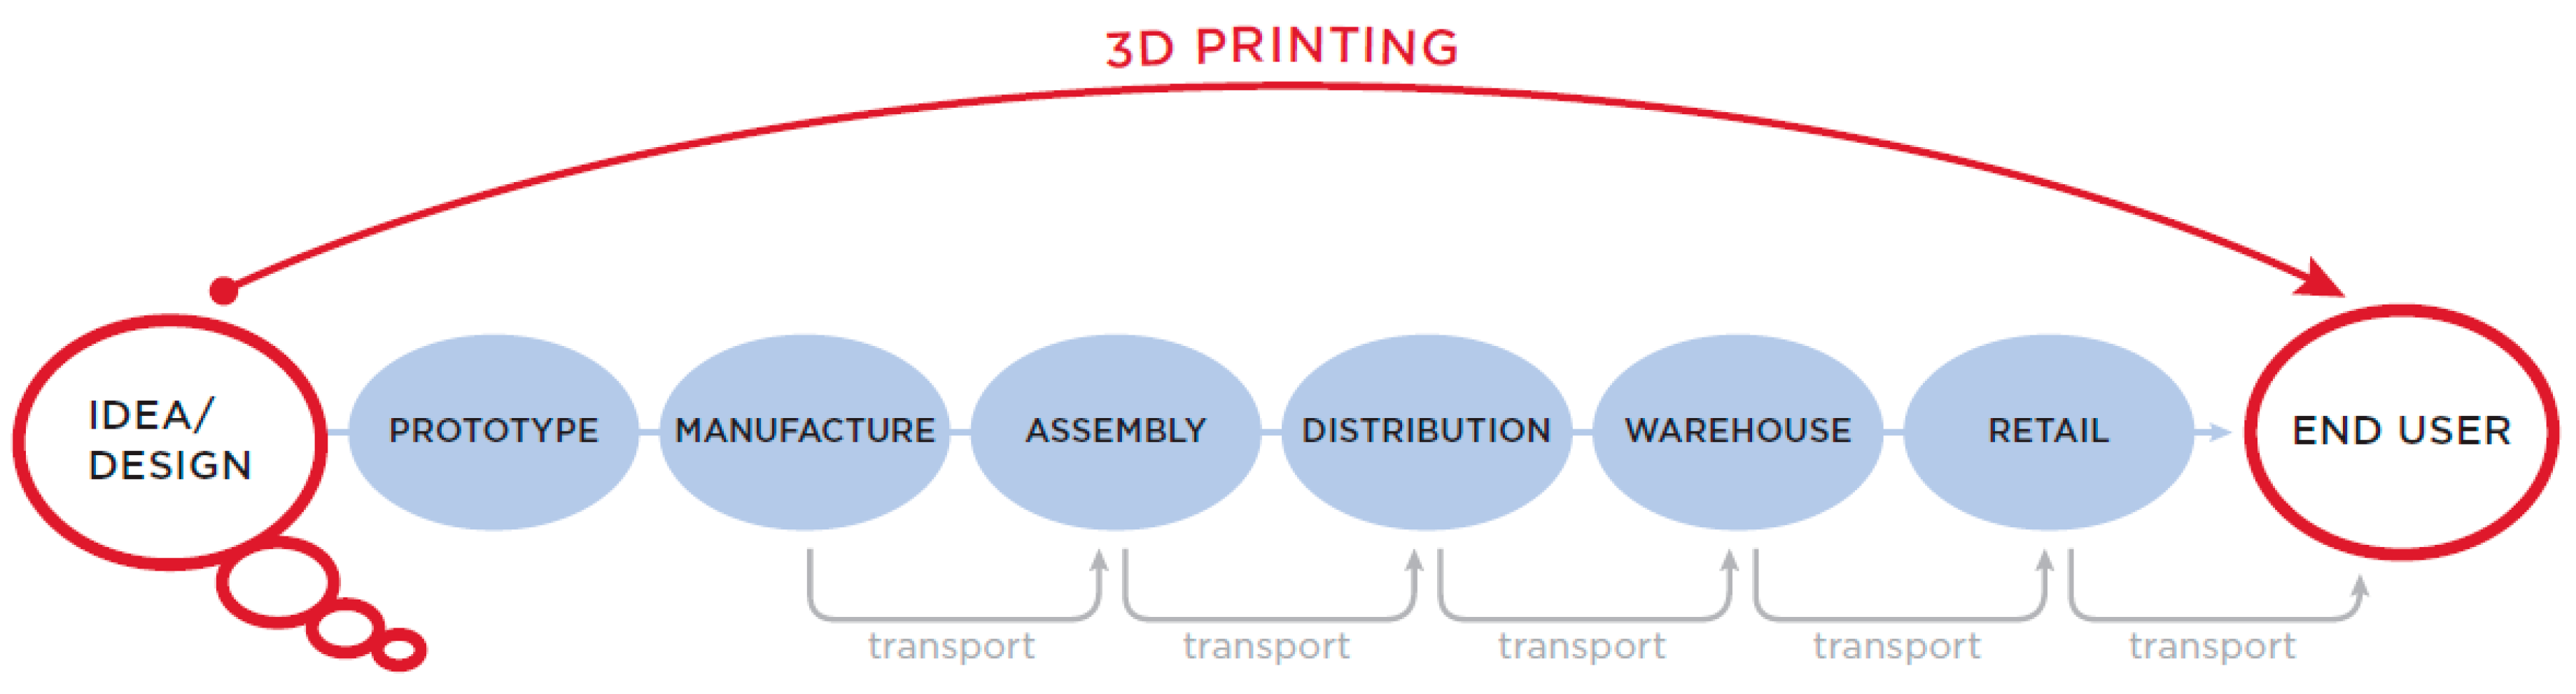
- Potential for simpler supply chains with shorter lead times and lower inventories
2. Literature Review
2.1. Review on Supply Chain Studies with Additive Manufacturing
2.2. Review on Supply Chain Studies with Simulation Approach
2.3. Contributions of the Study
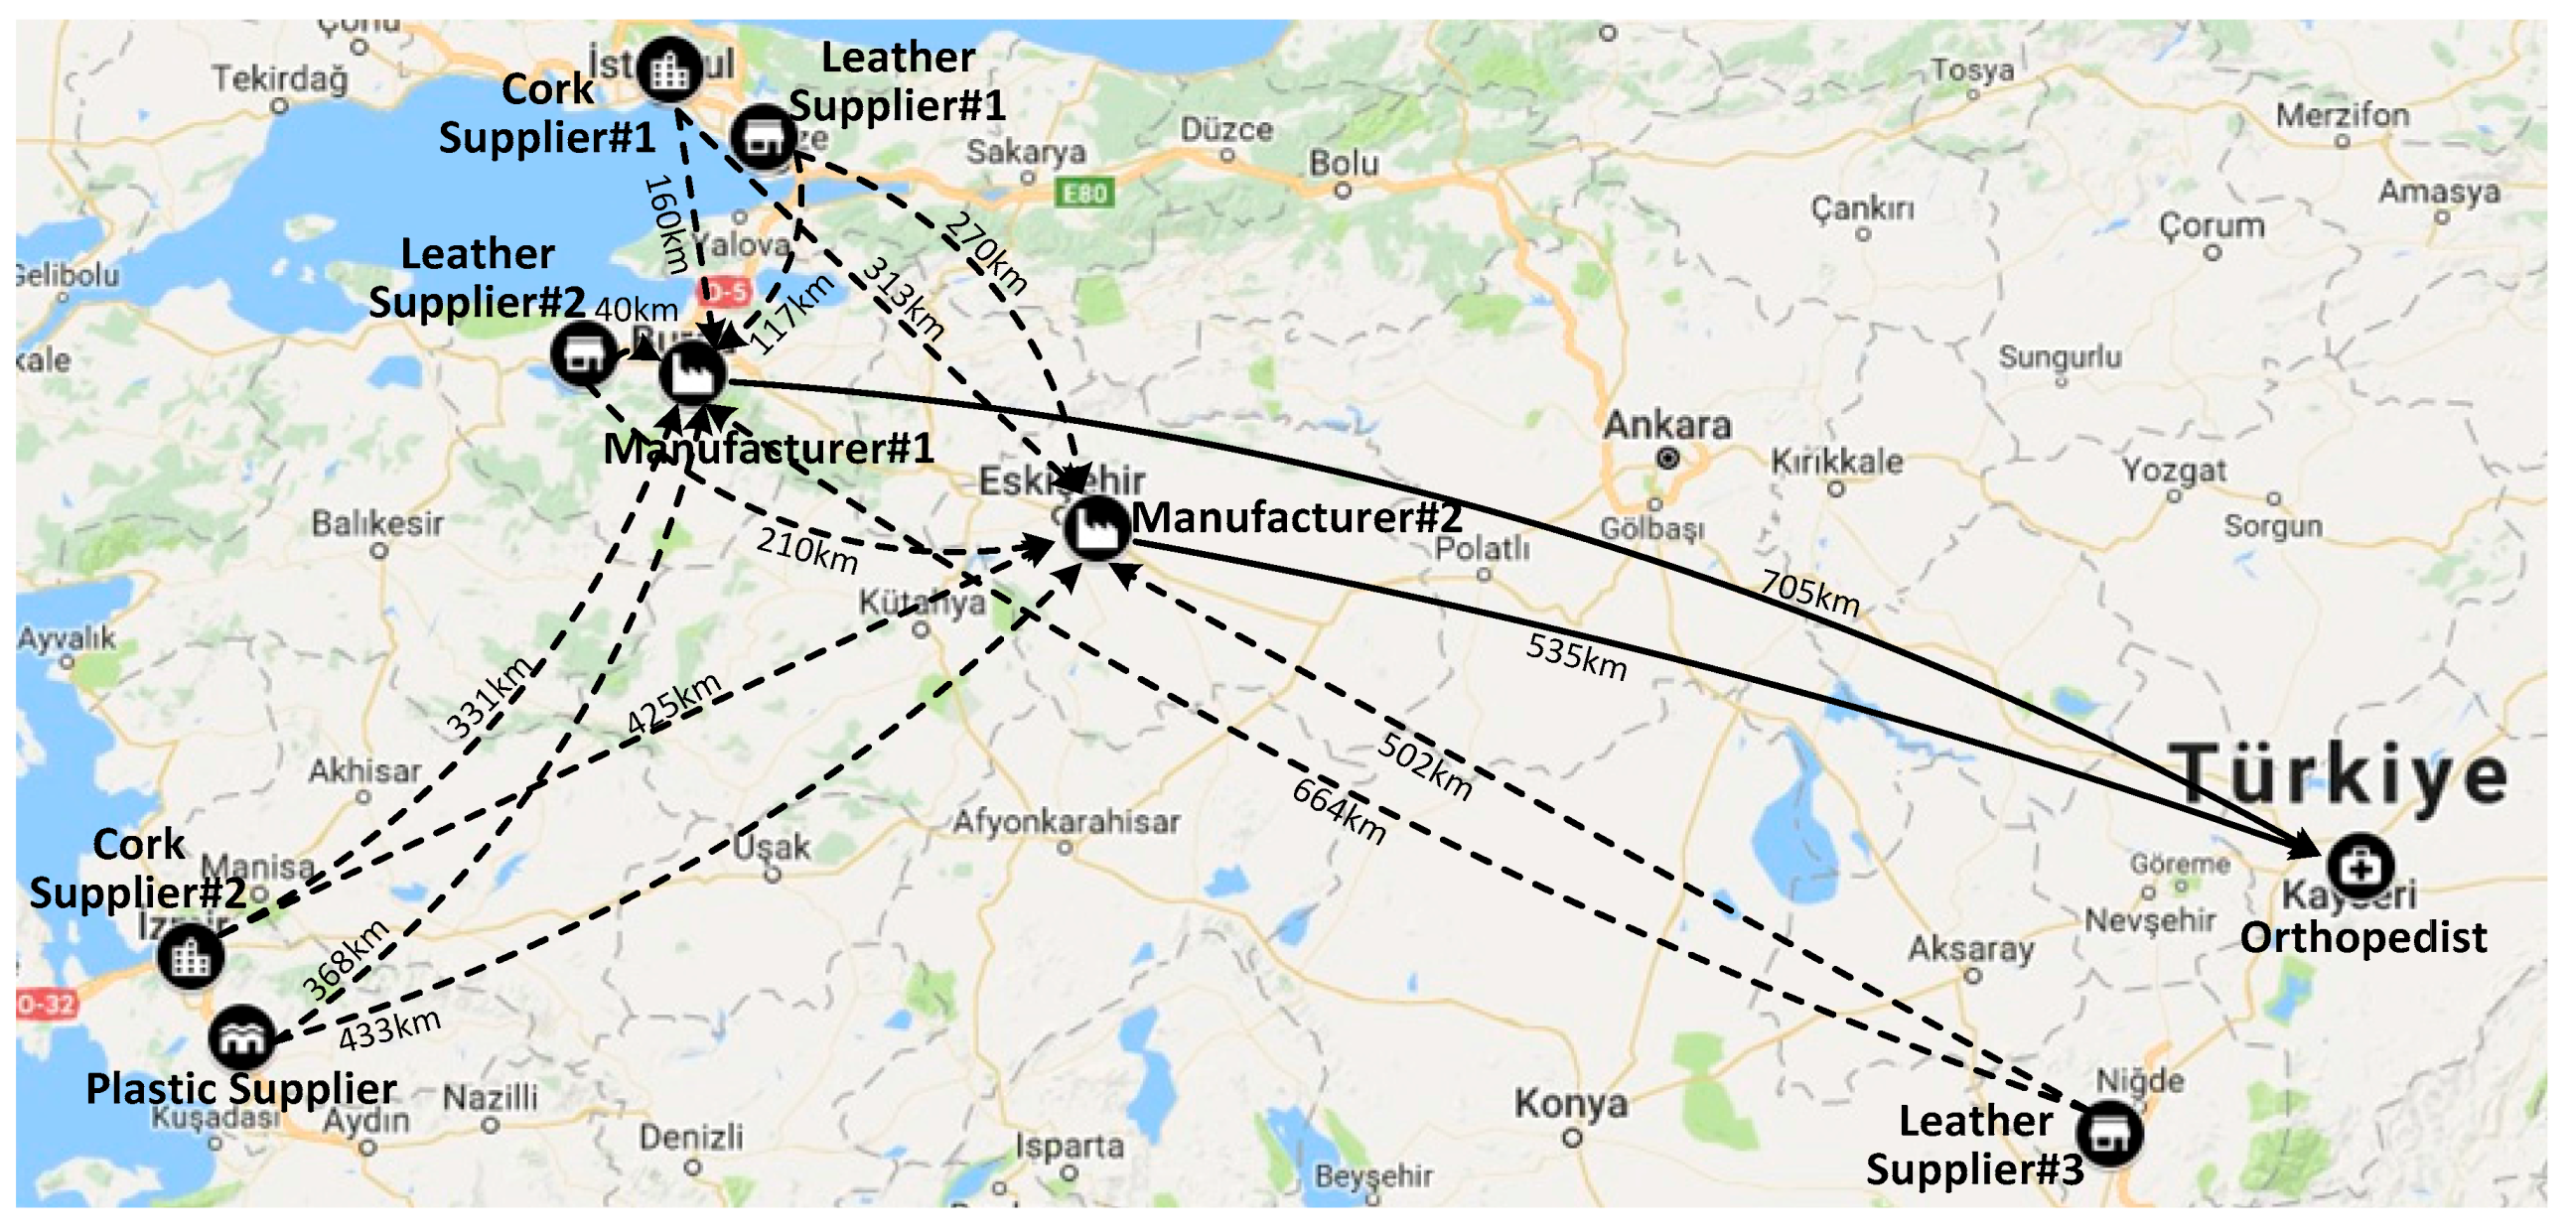
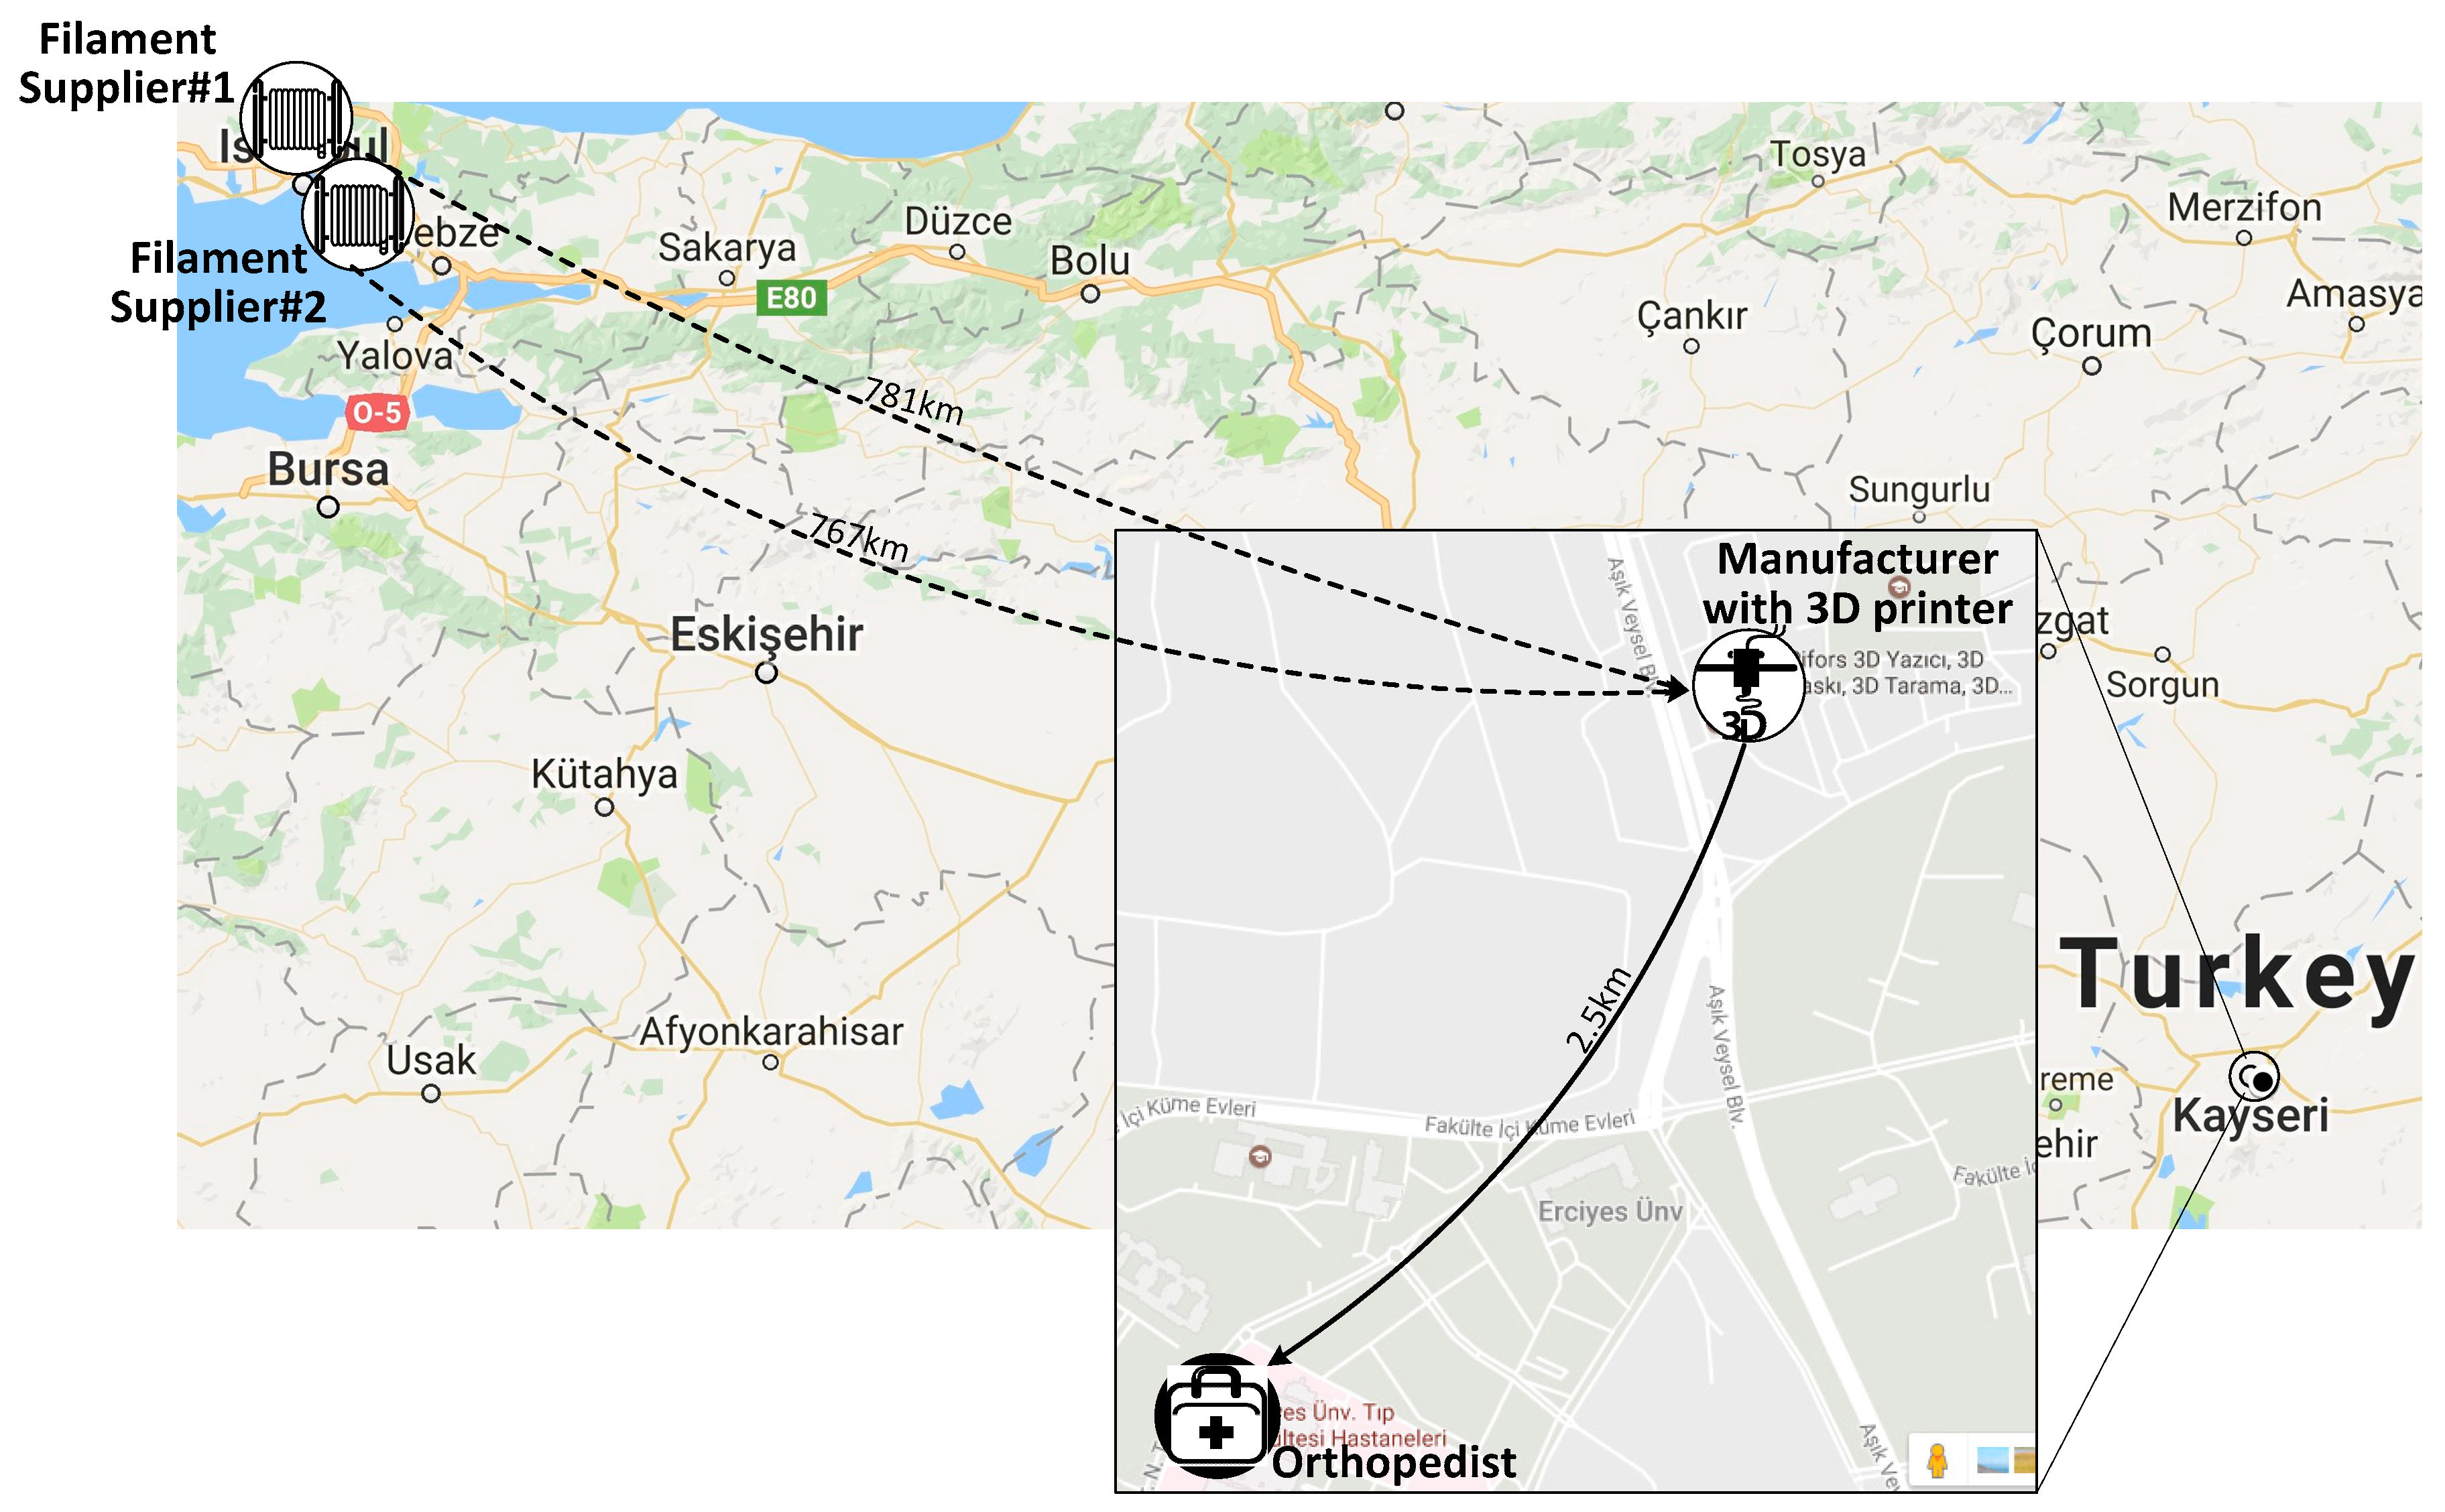
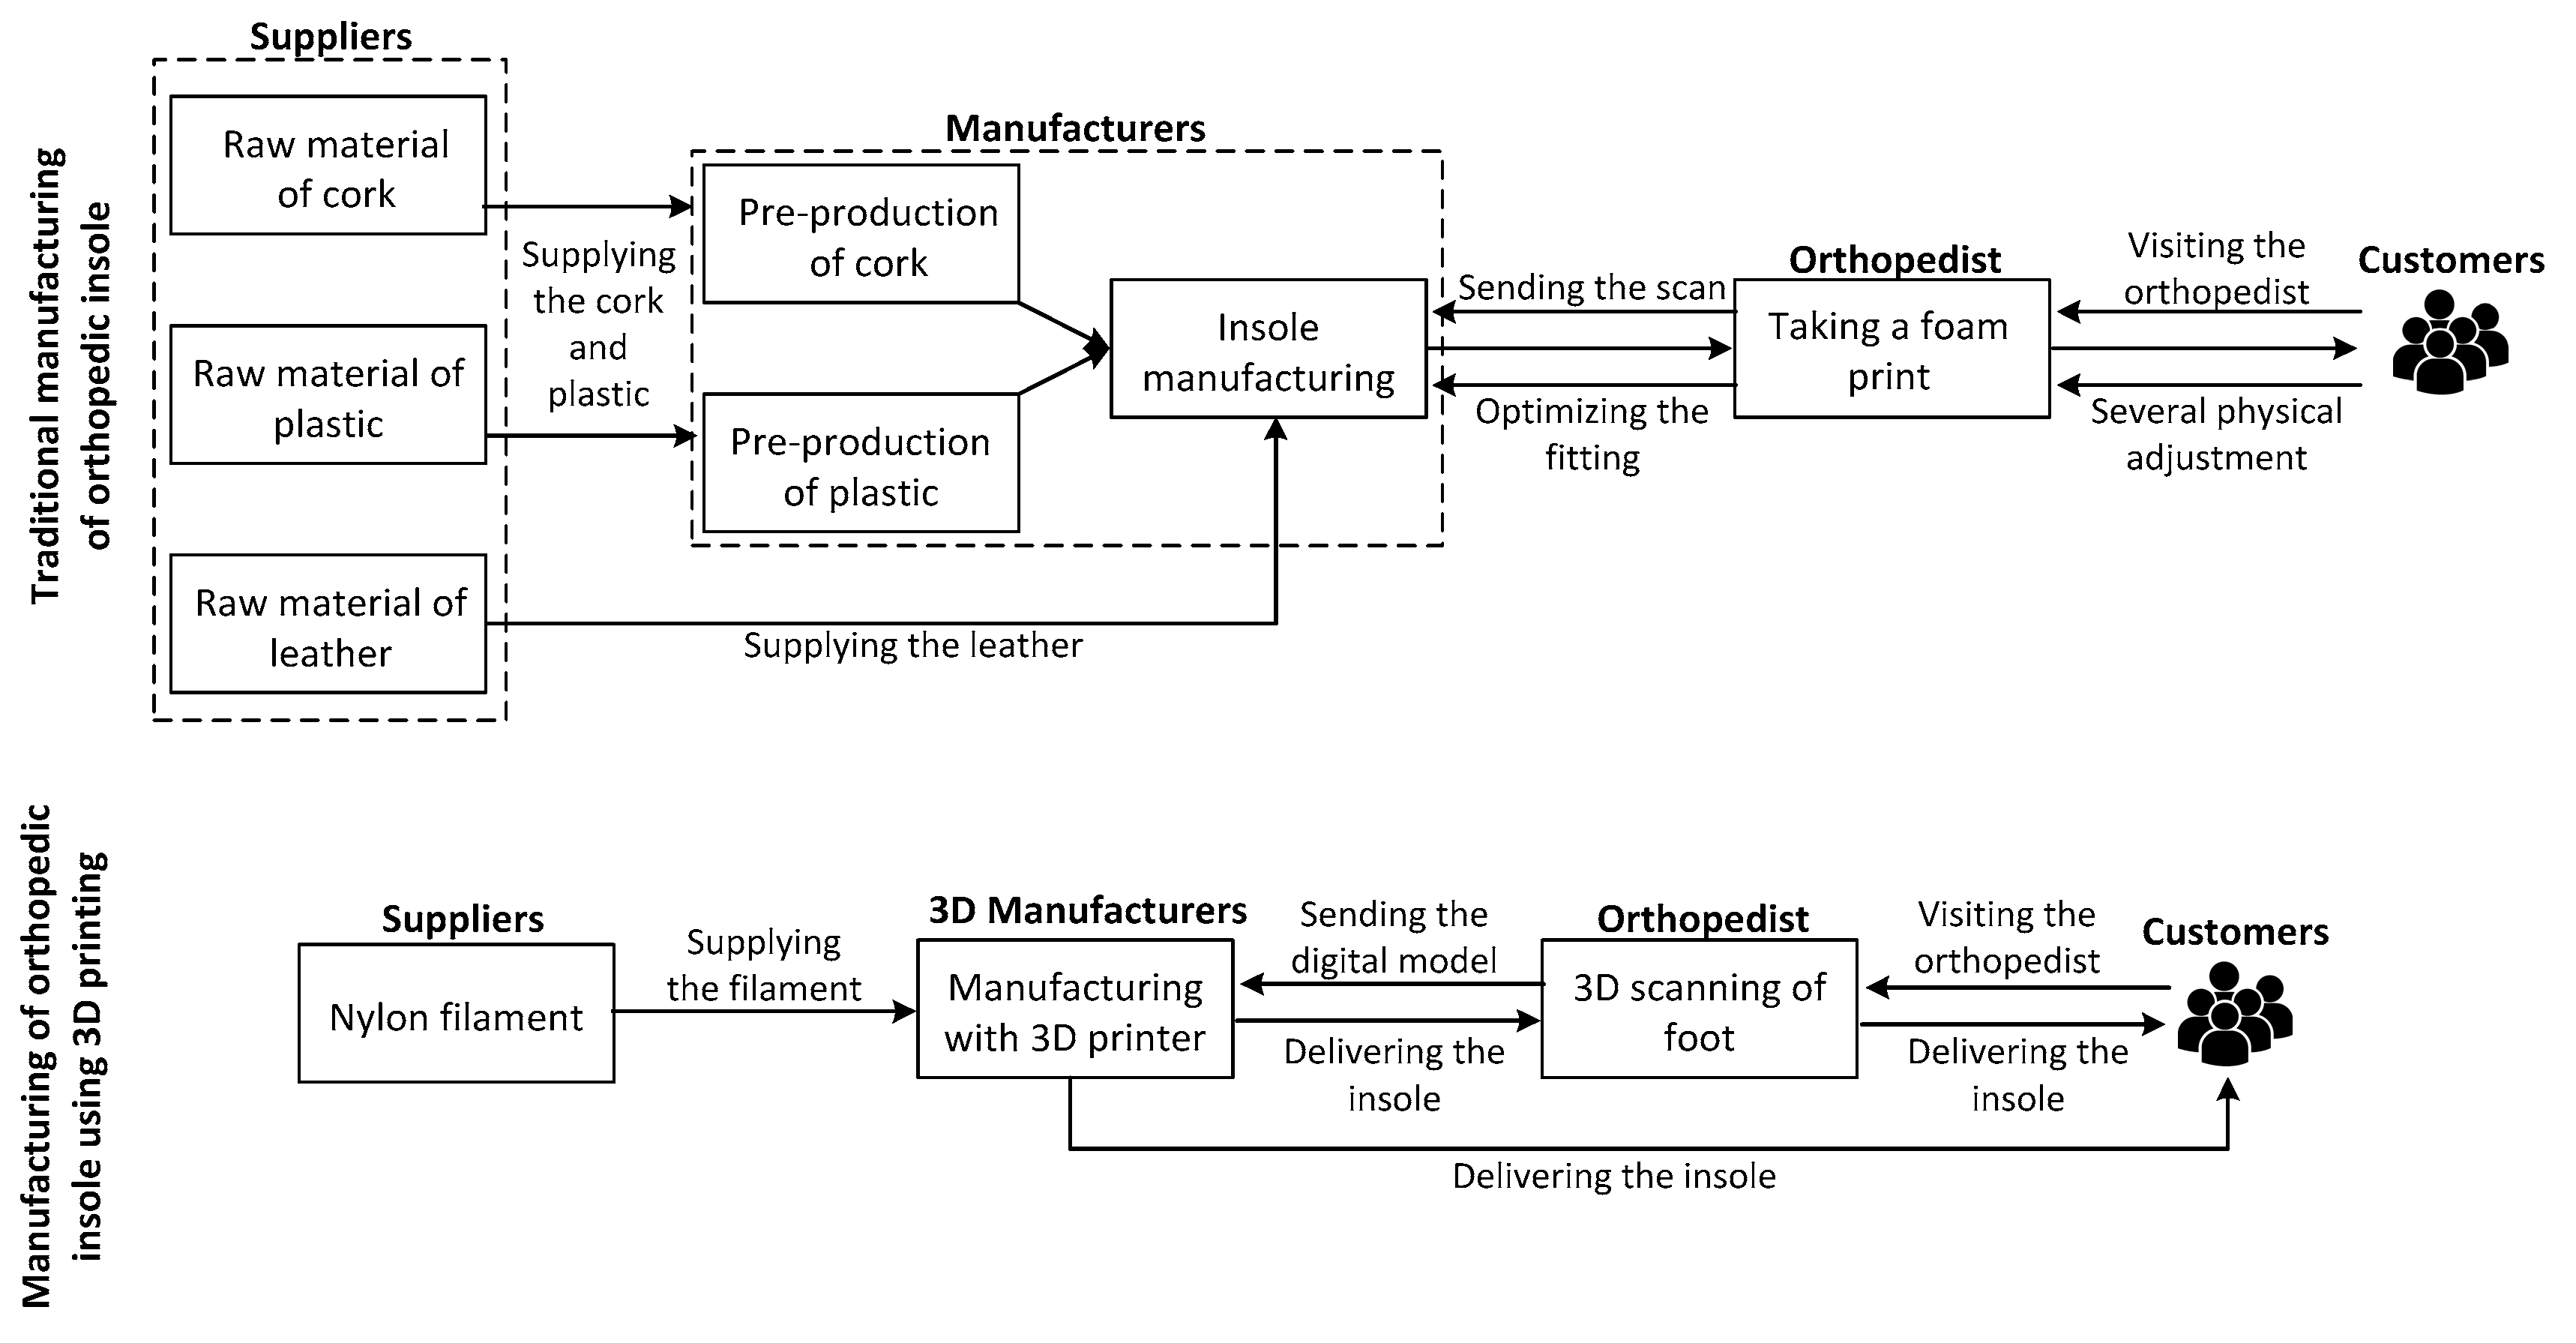
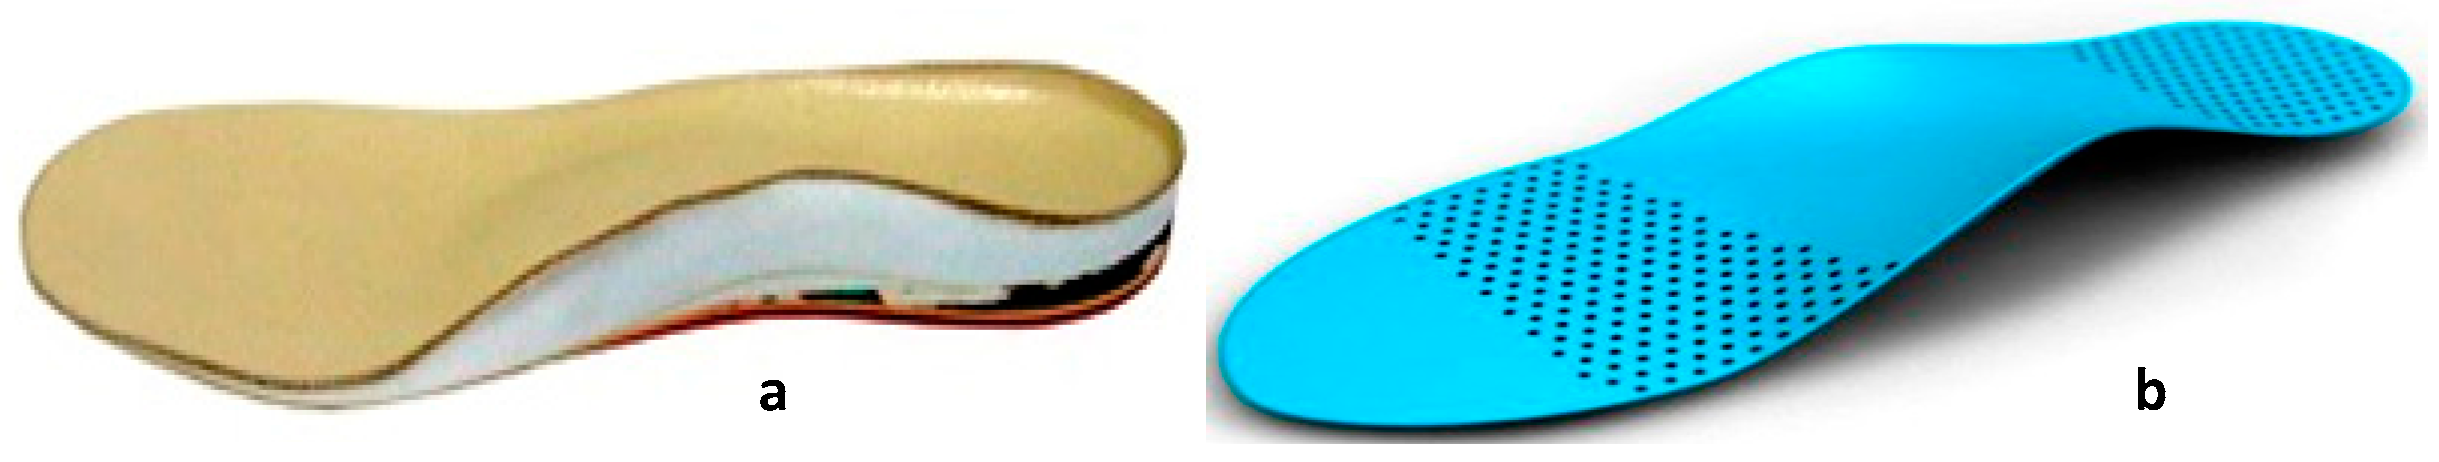
3. Supply Chain Networks of Orthopedic Insoles
- Due to higher ‘first time right’ production with 3D printing, total lead-time decreases.
- There is less room for human induced error in the supply chain with 3D printing.
- Supply chain with 3D printing ensures that a single moment of contact between customer and orthopedist should be enough for a correct fitting.
- Lower skilled employees can operate 3D printers rather than traditional machines.
- If orthopedists have a standard 3D scan of the client’s foot, they can outsource the production anywhere they want.
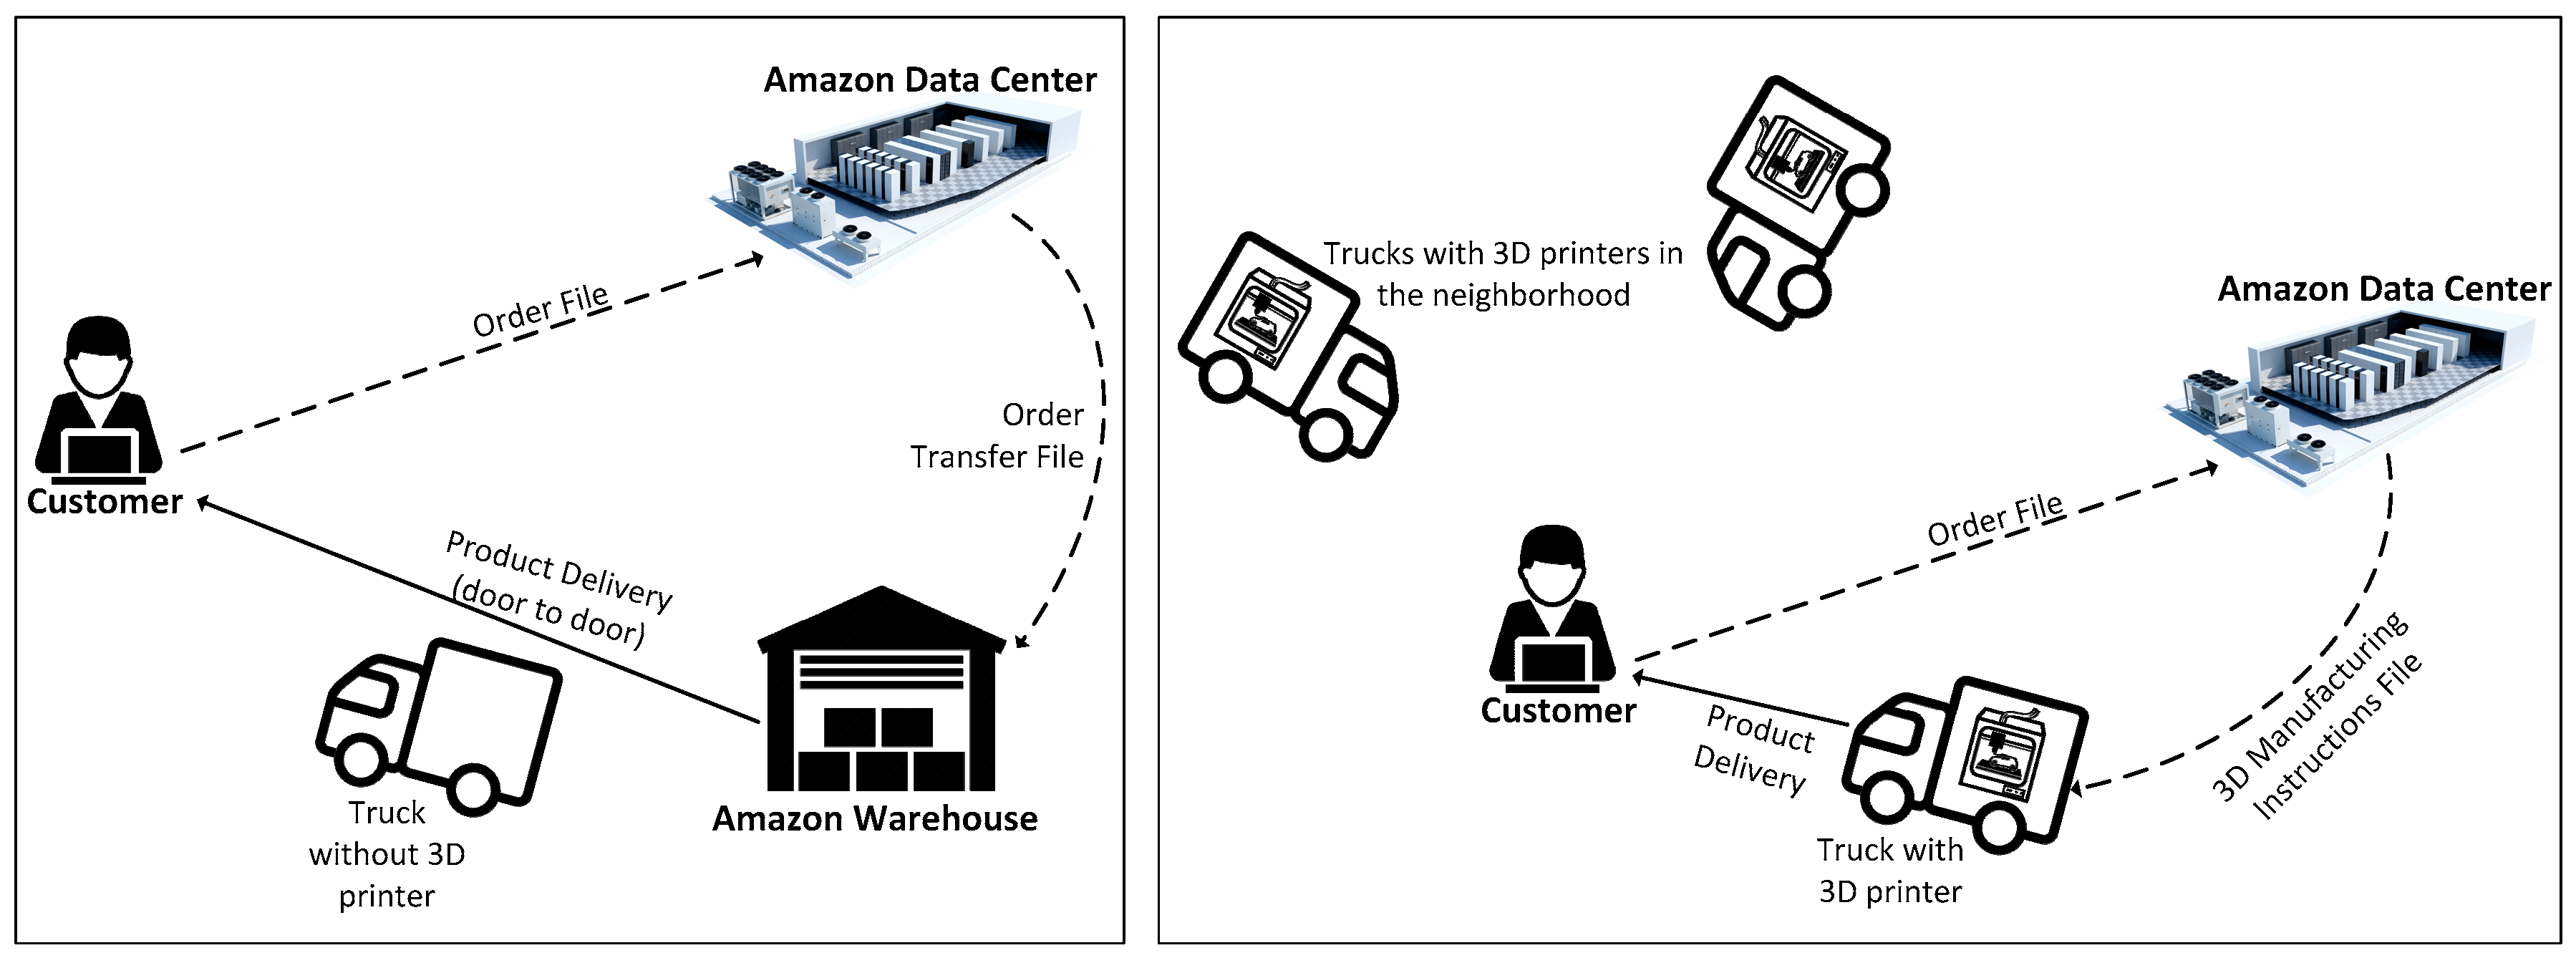
- Direct shipping becomes an option in the supply chain with 3D printing.
- With 3D printing, manufacturers can reduce their dependency on different suppliers.
- Due to producing a unibody insole with 3D printing, they can become thinner but stronger.
- Customization (e.g., color, carved) can move beyond the level of customization offered by traditional methods.
4. Simulation Models for the Case Study
- The yield rate is different for the CNC machine and the 3D printer.
- The quality of finished parts from the CNC machine and the 3D printer are the same.
- The time consumption of a 3D printer made product is determined by the volume of the product.
- Raw materials are infinite.
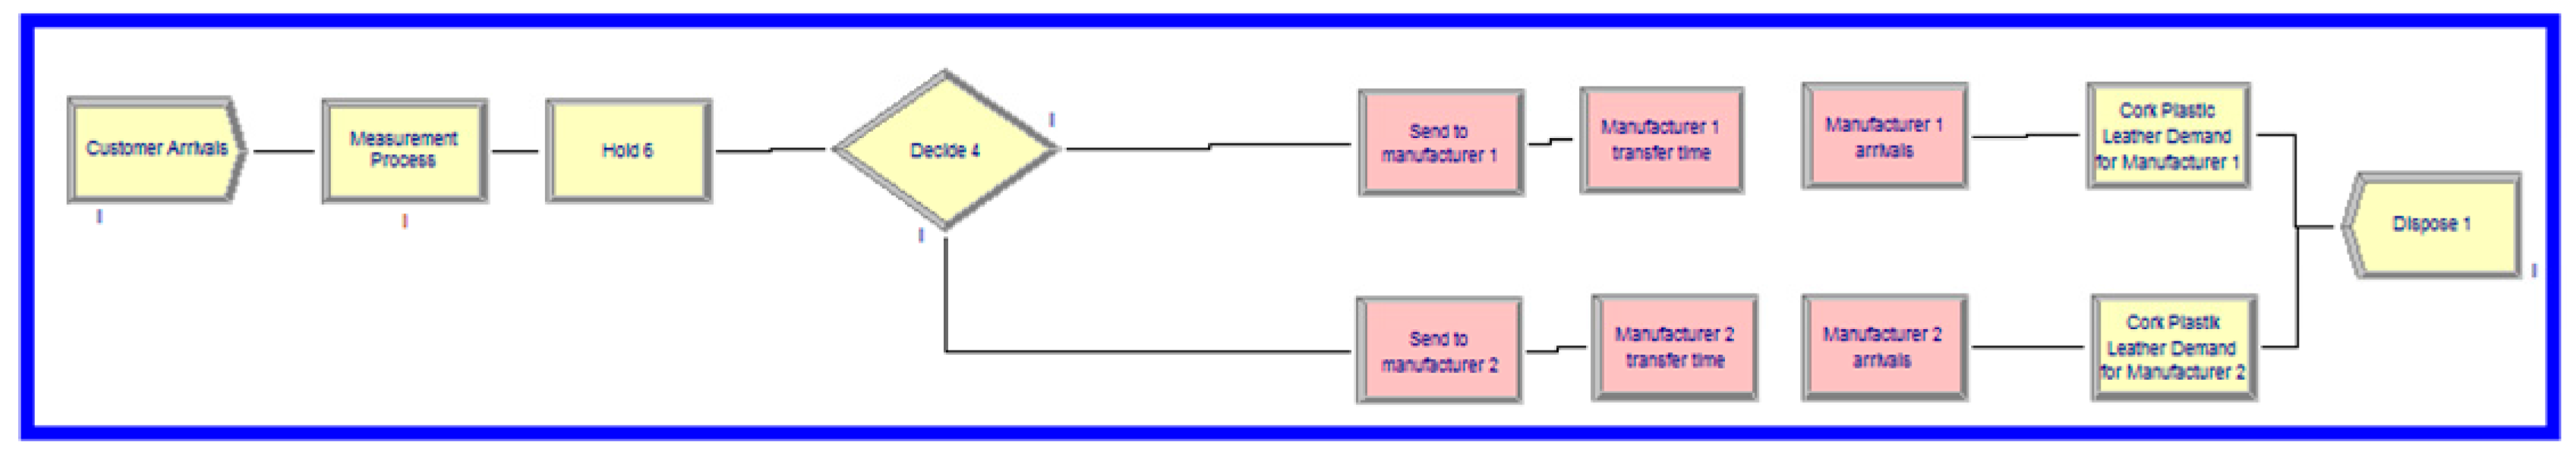
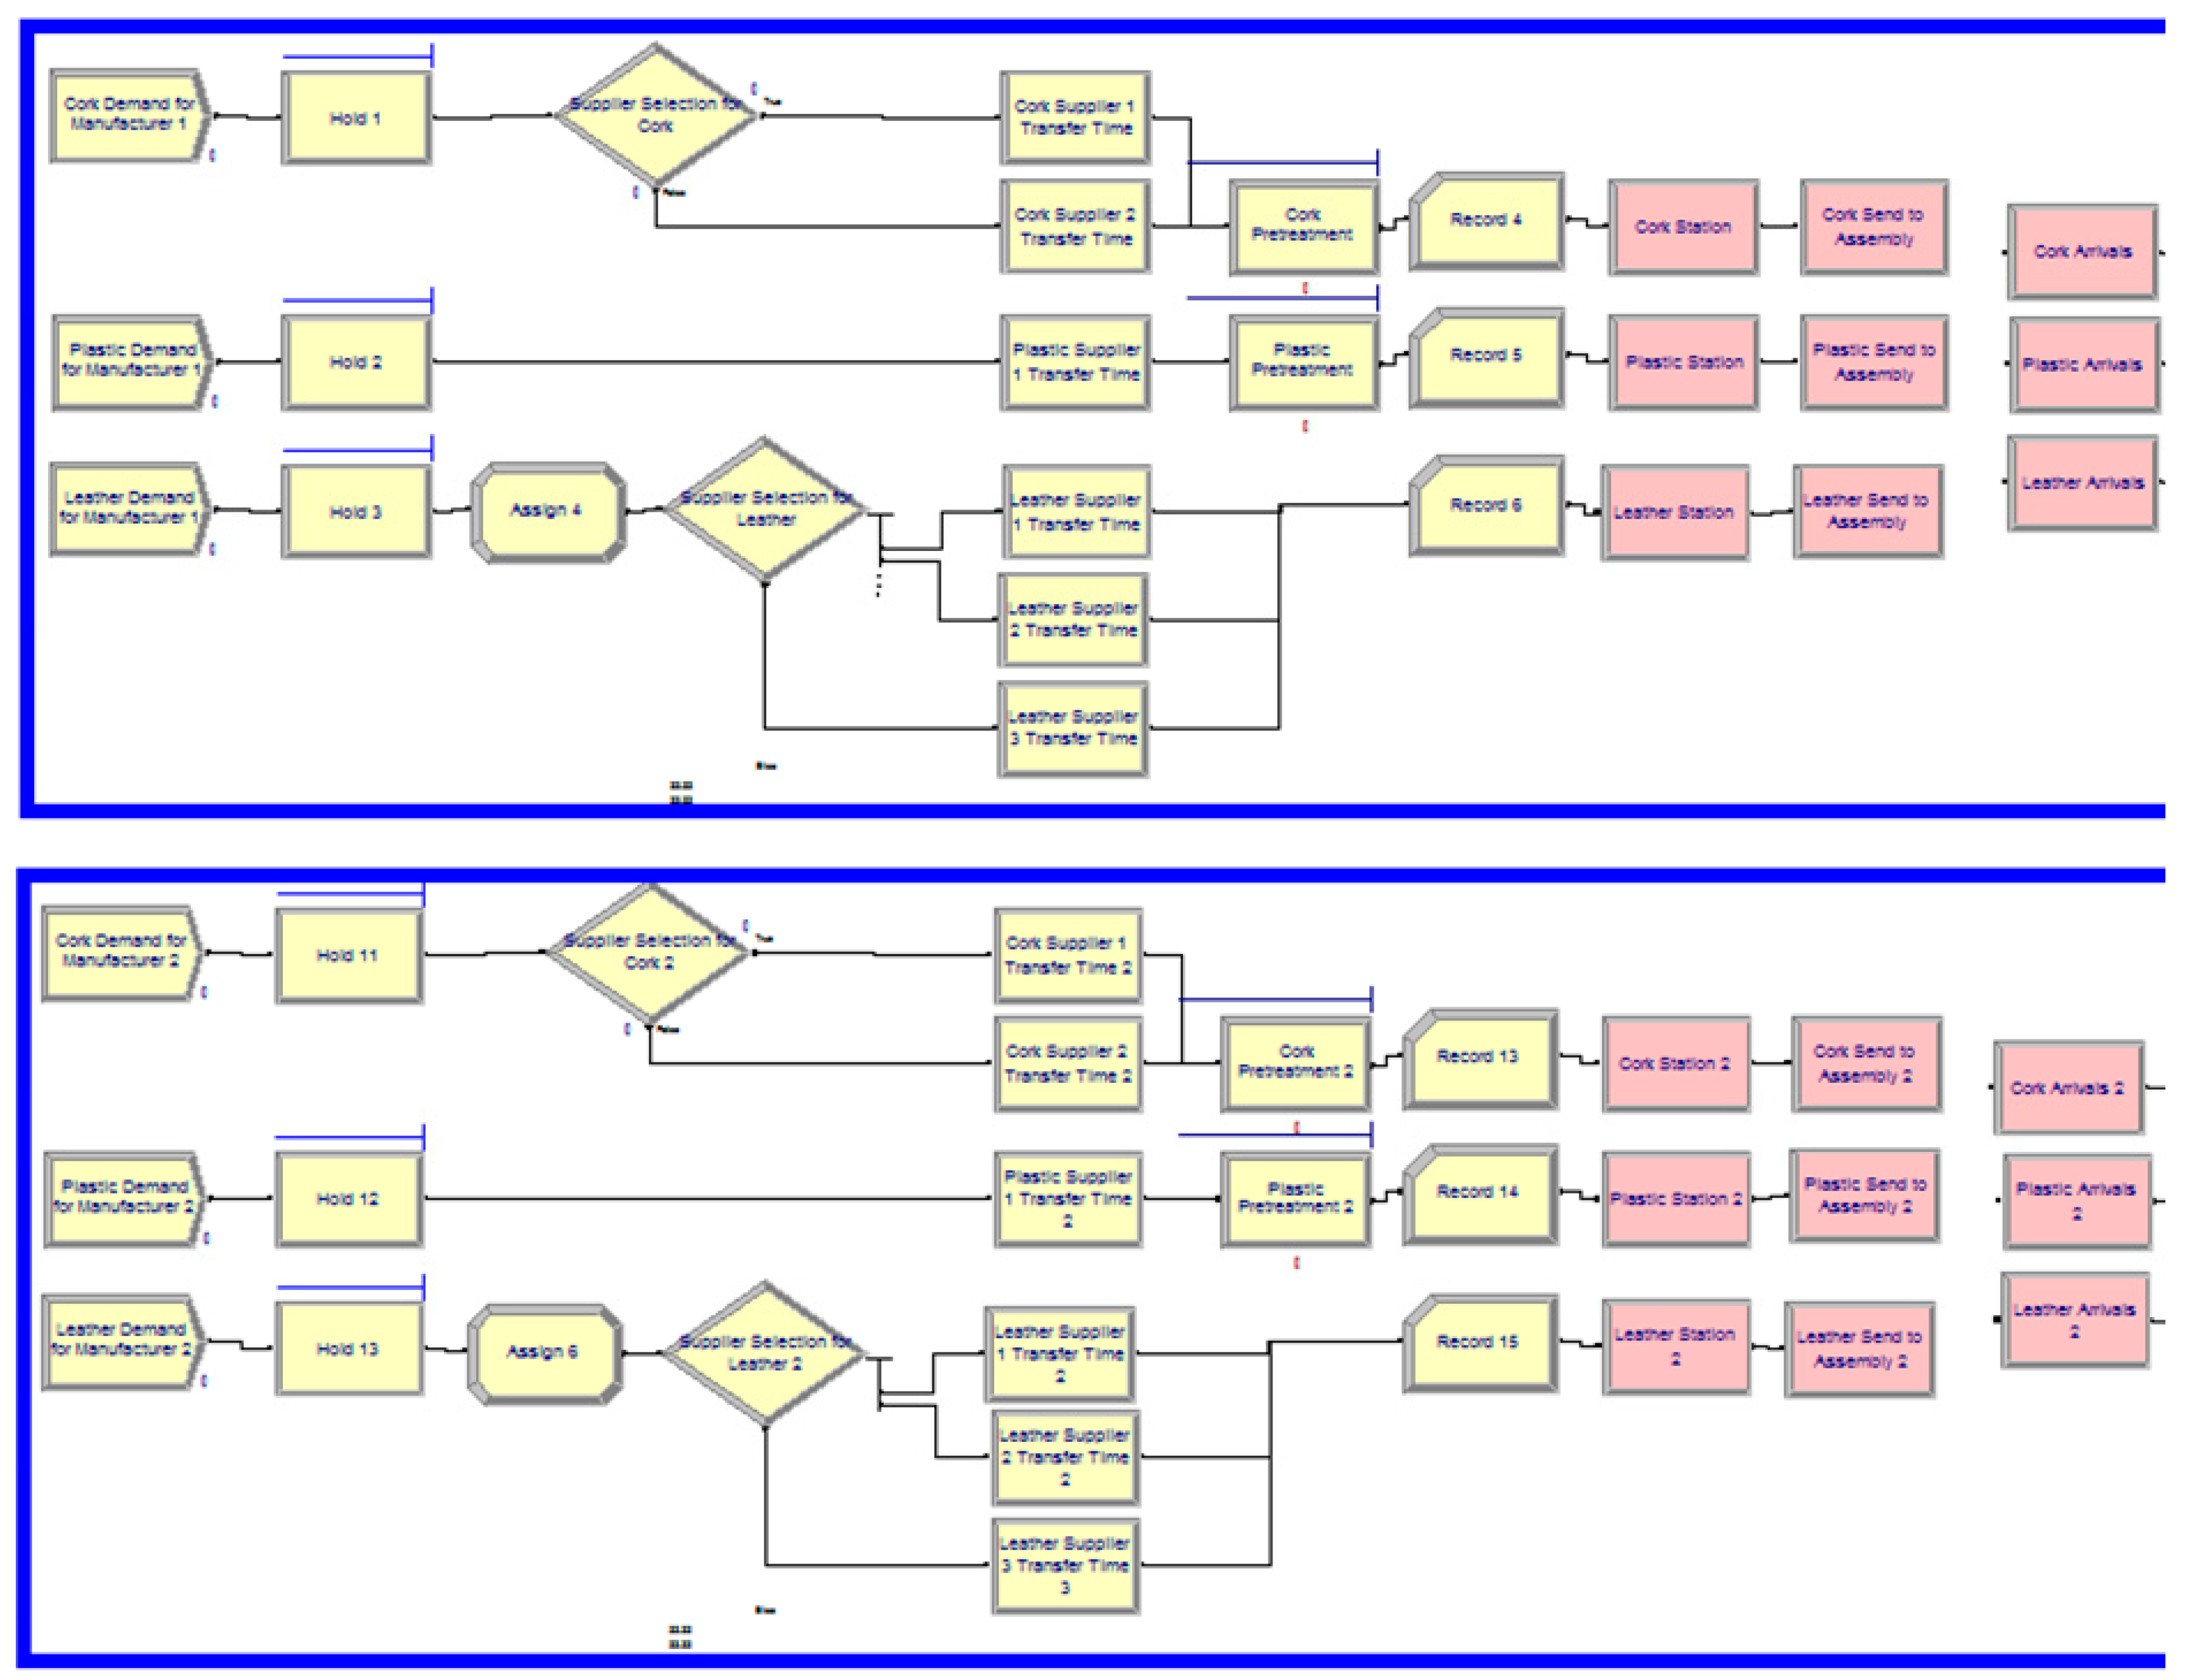
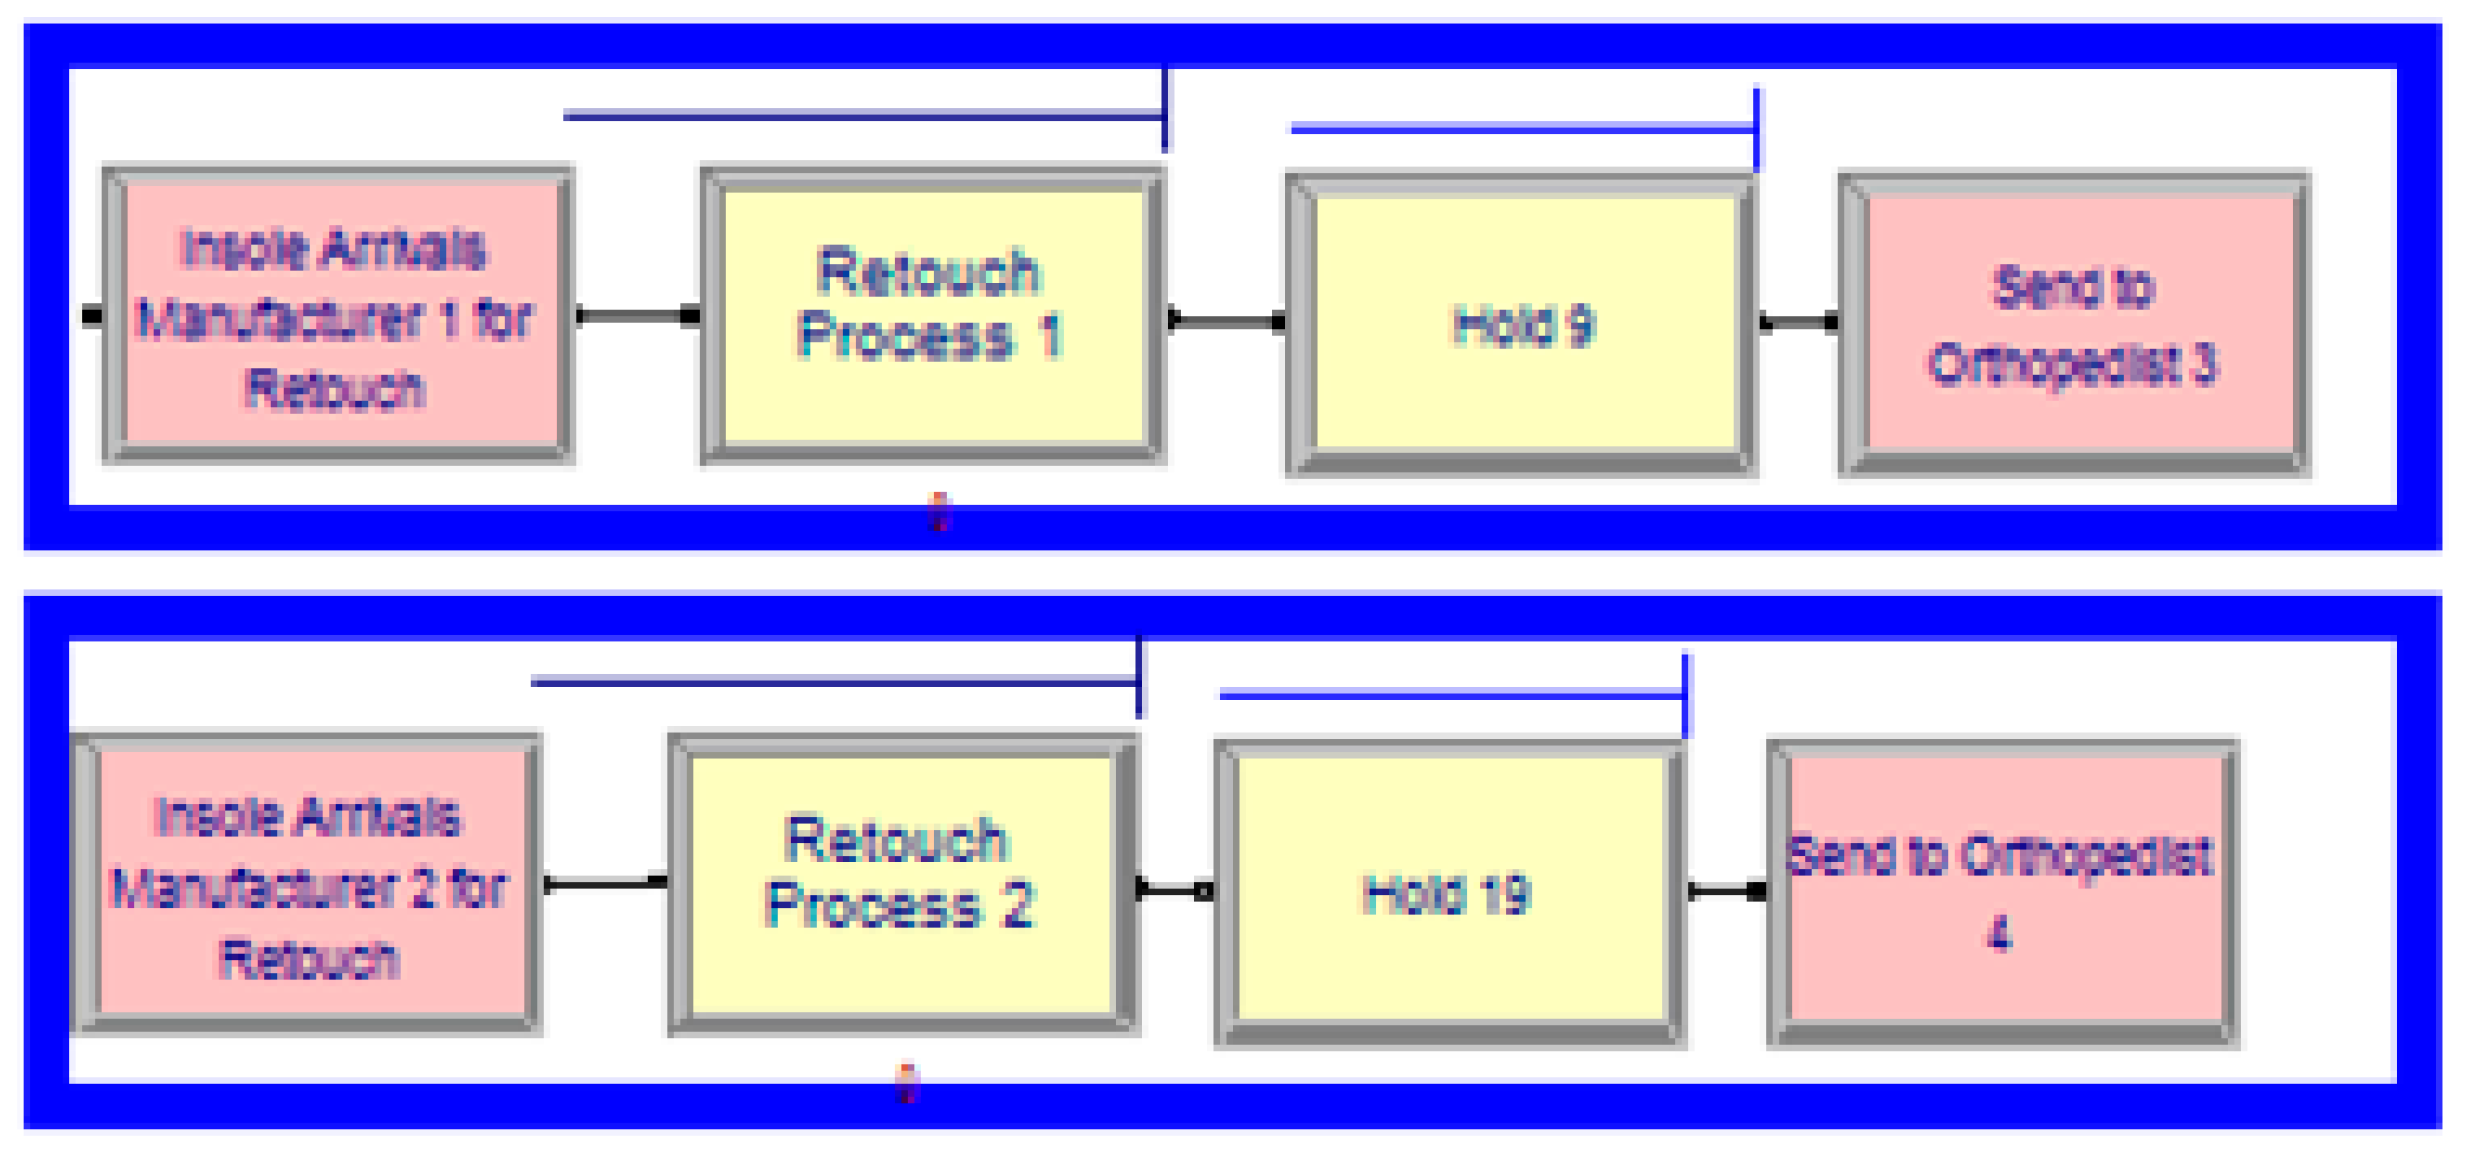
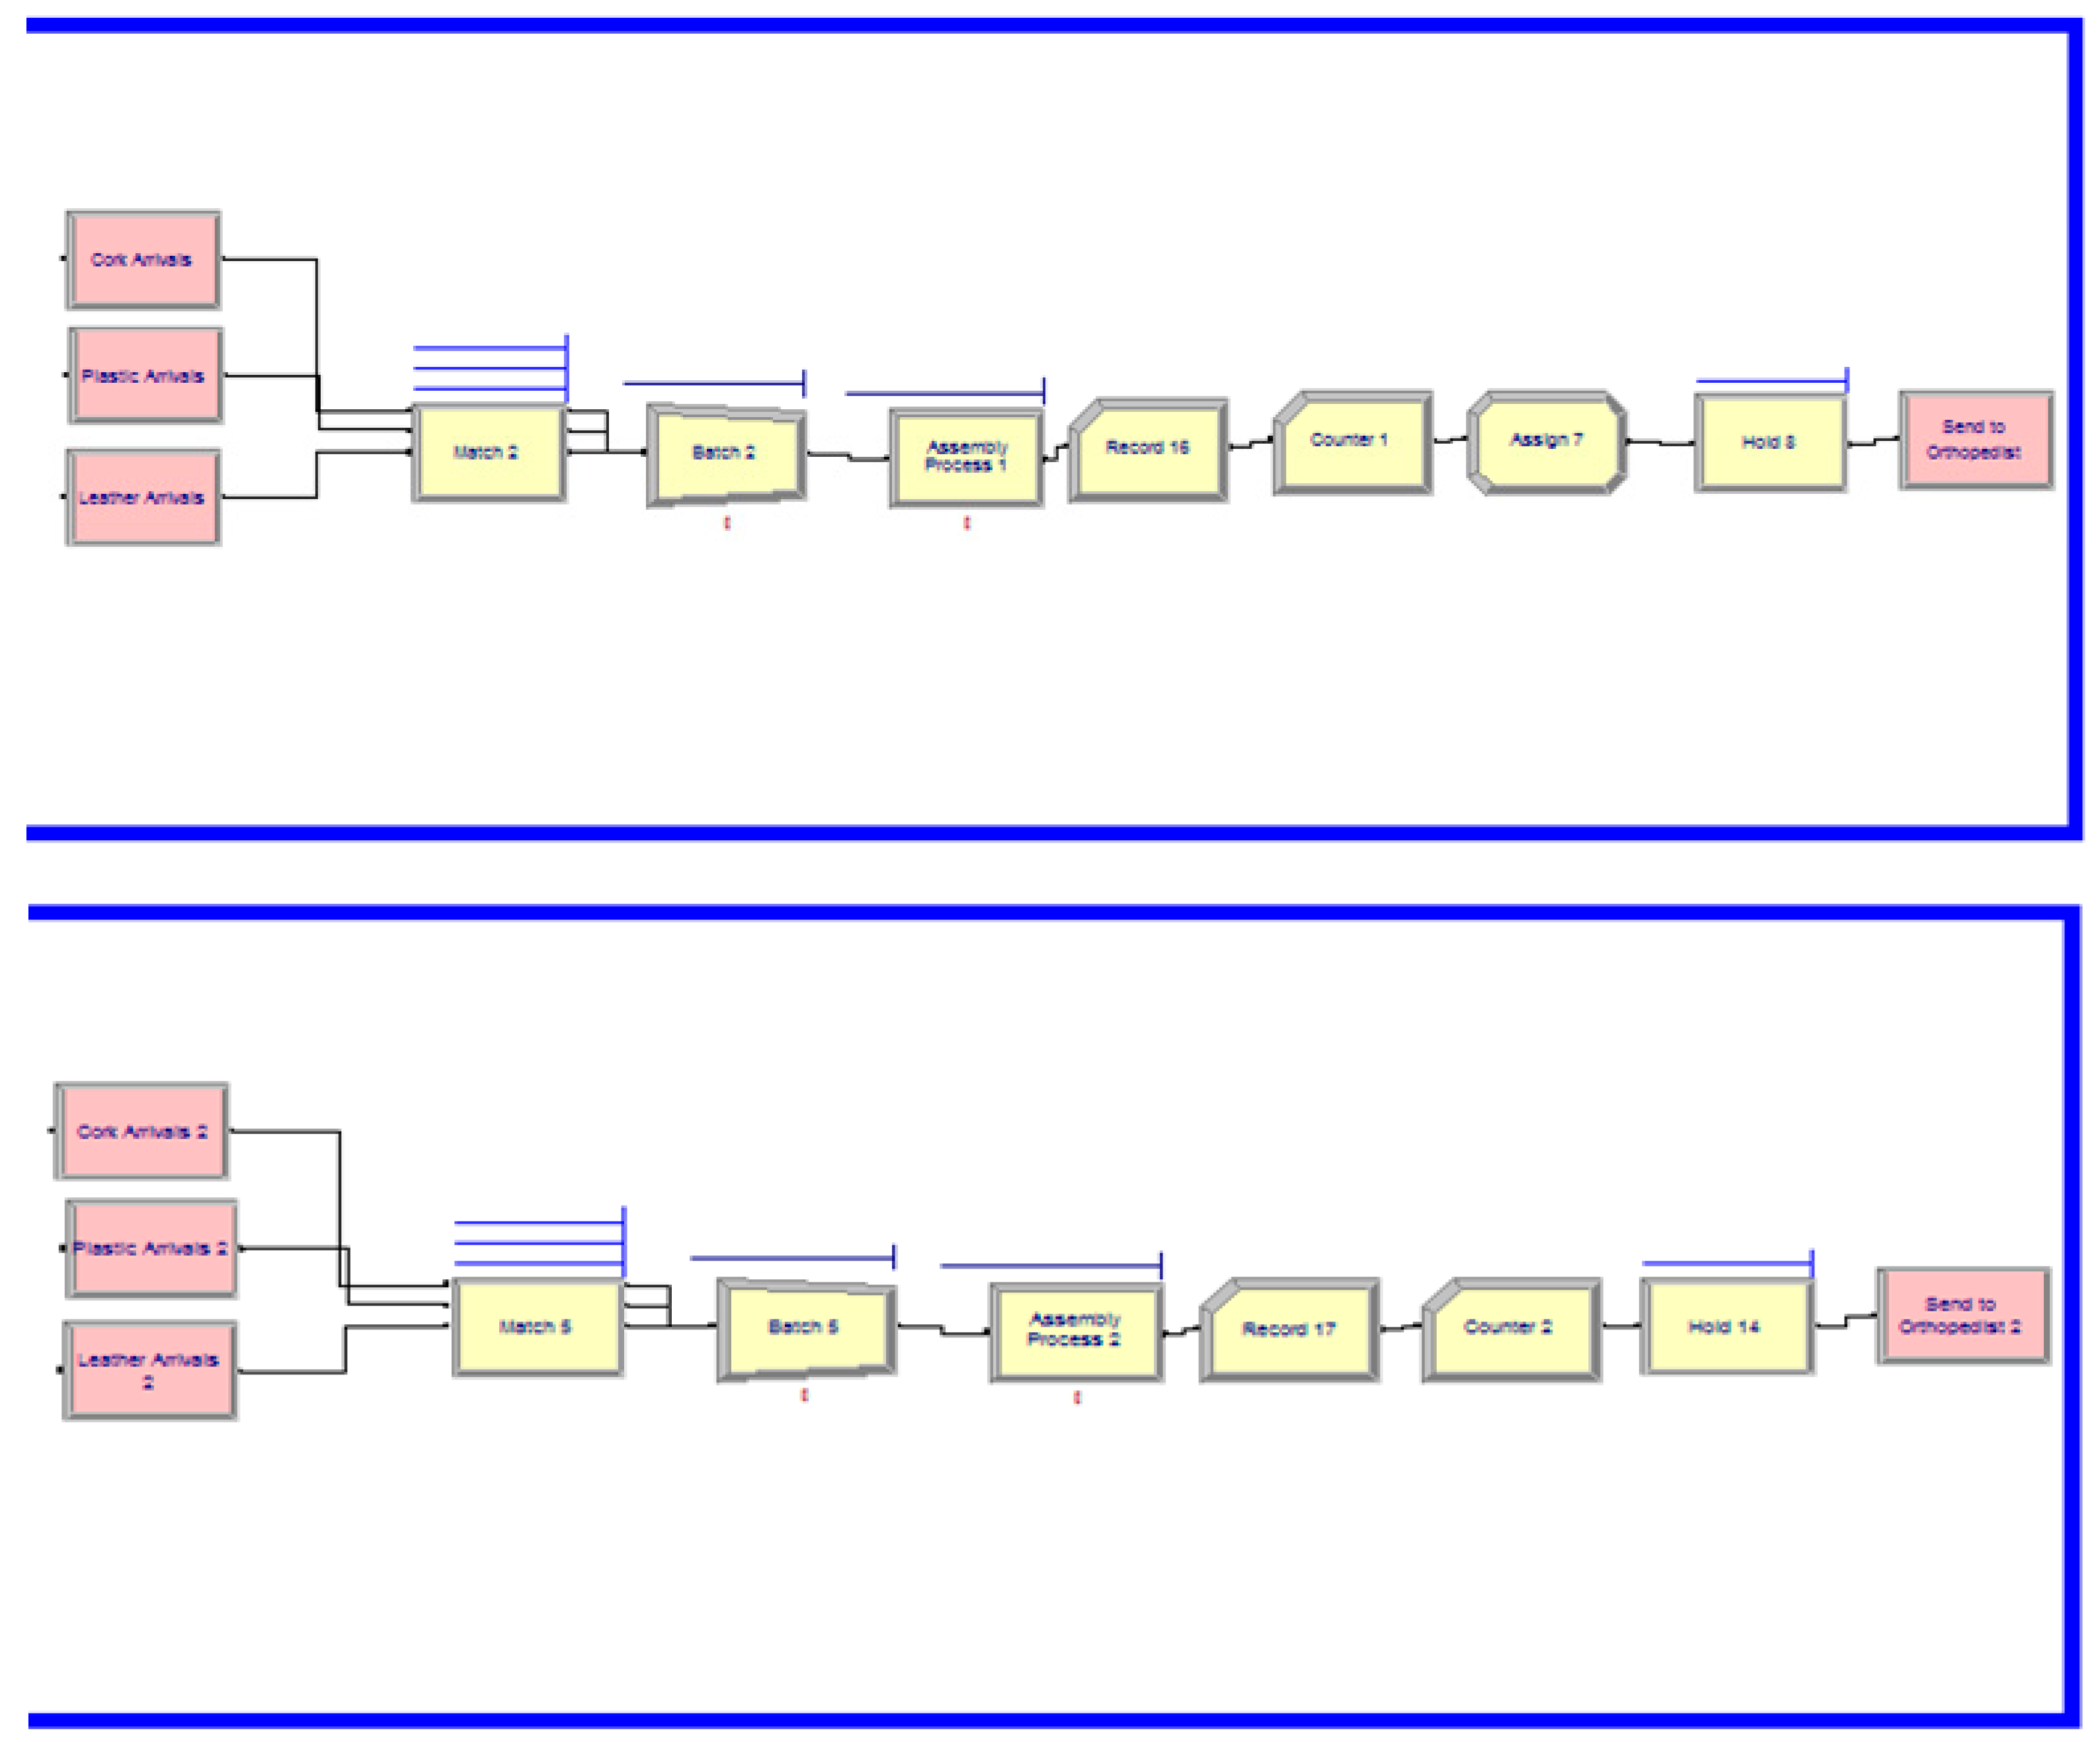
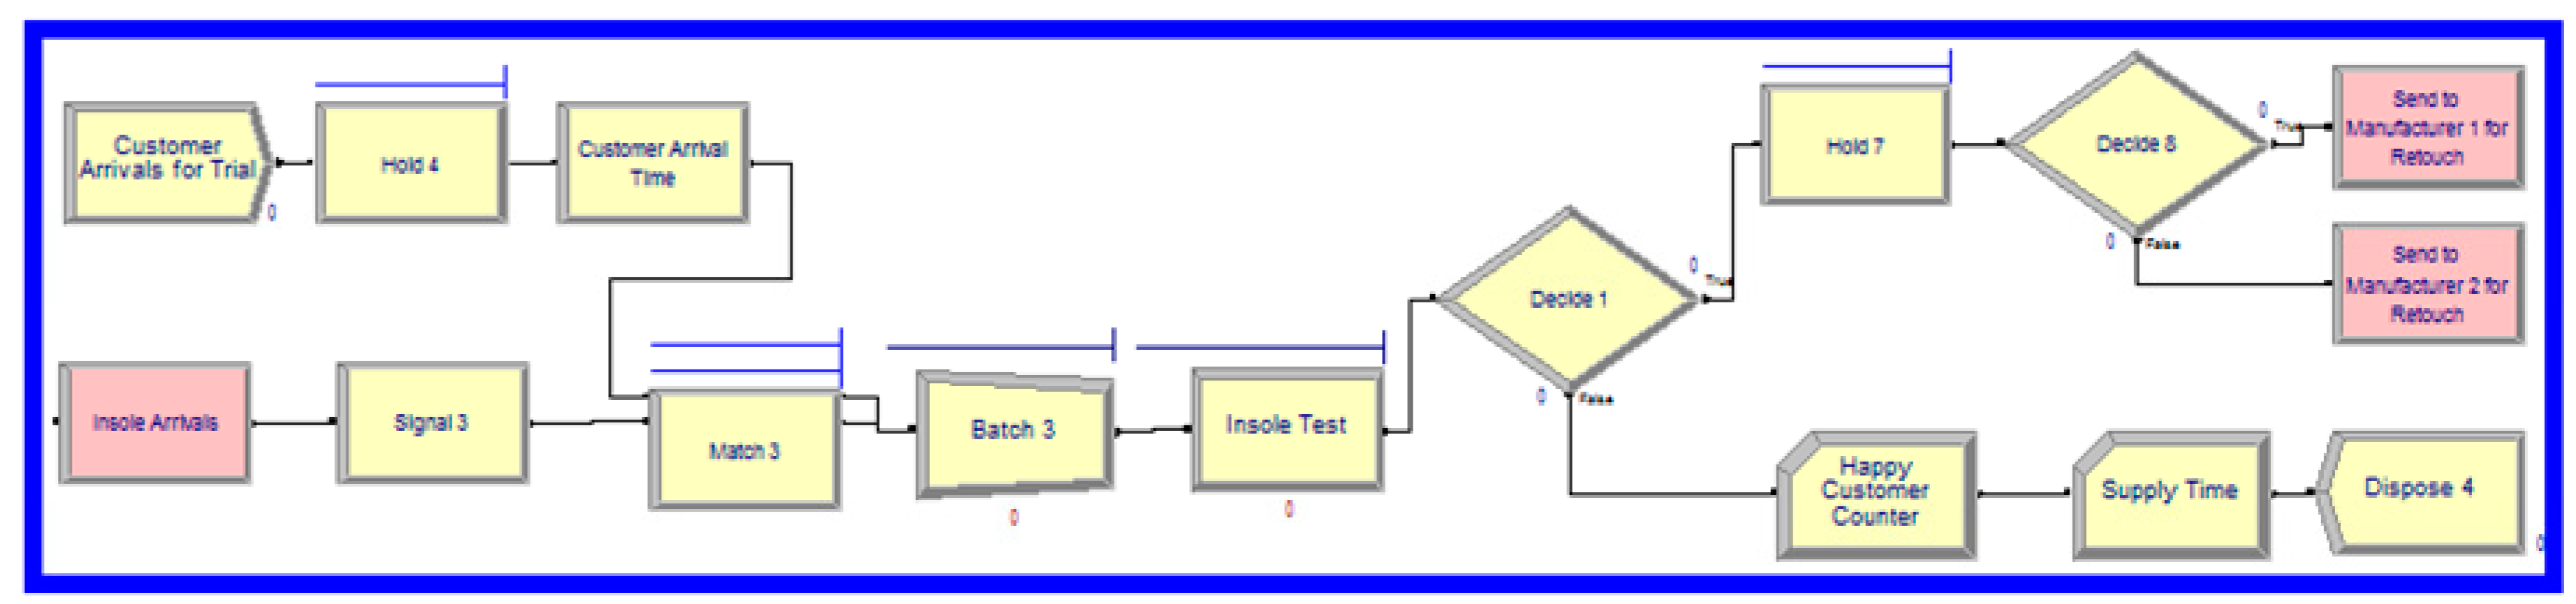
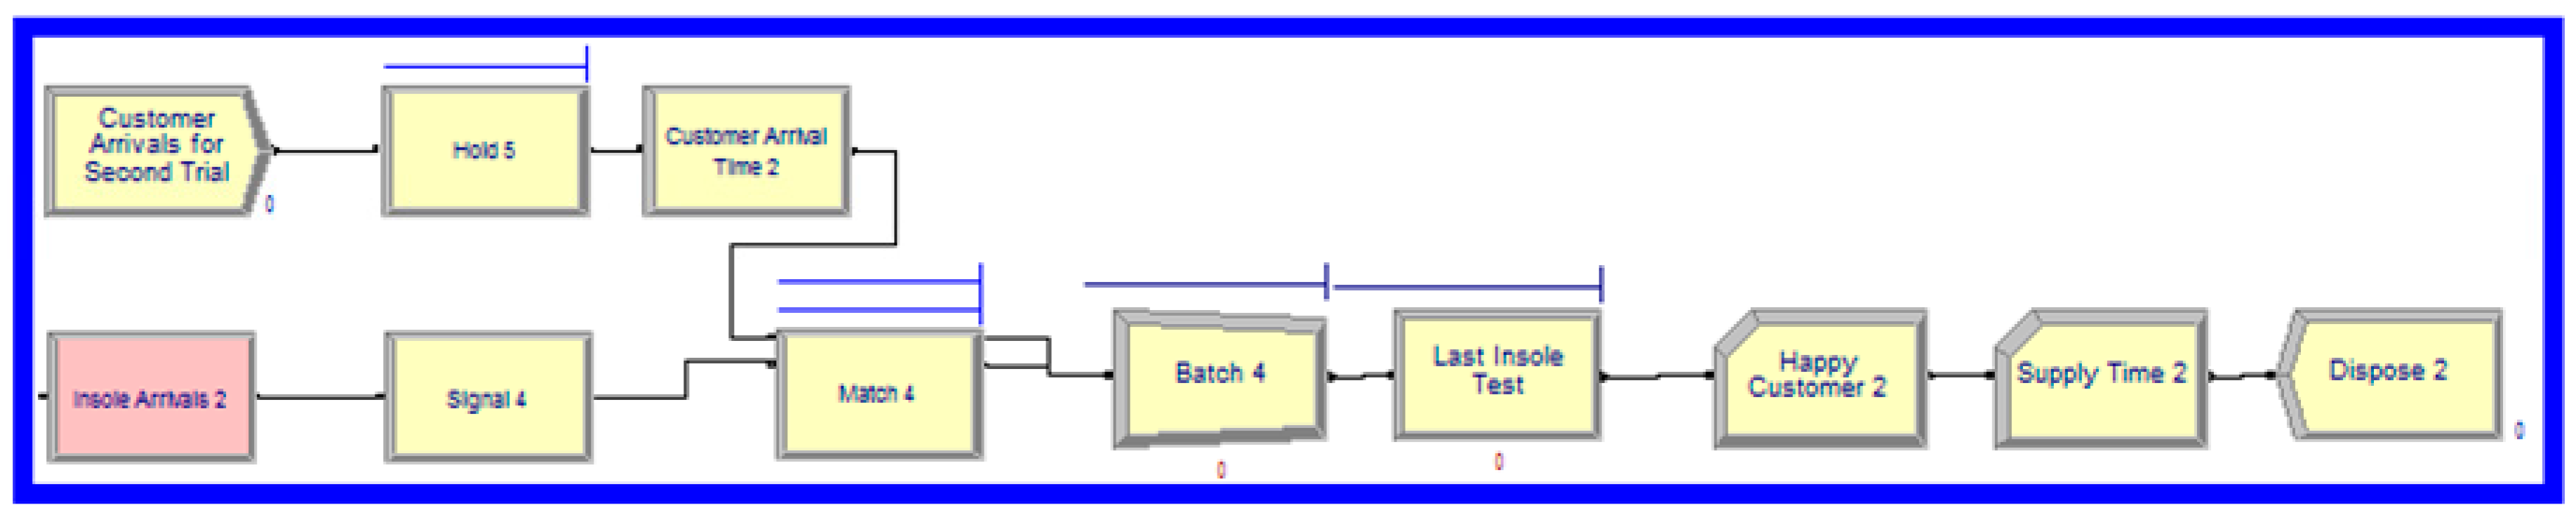
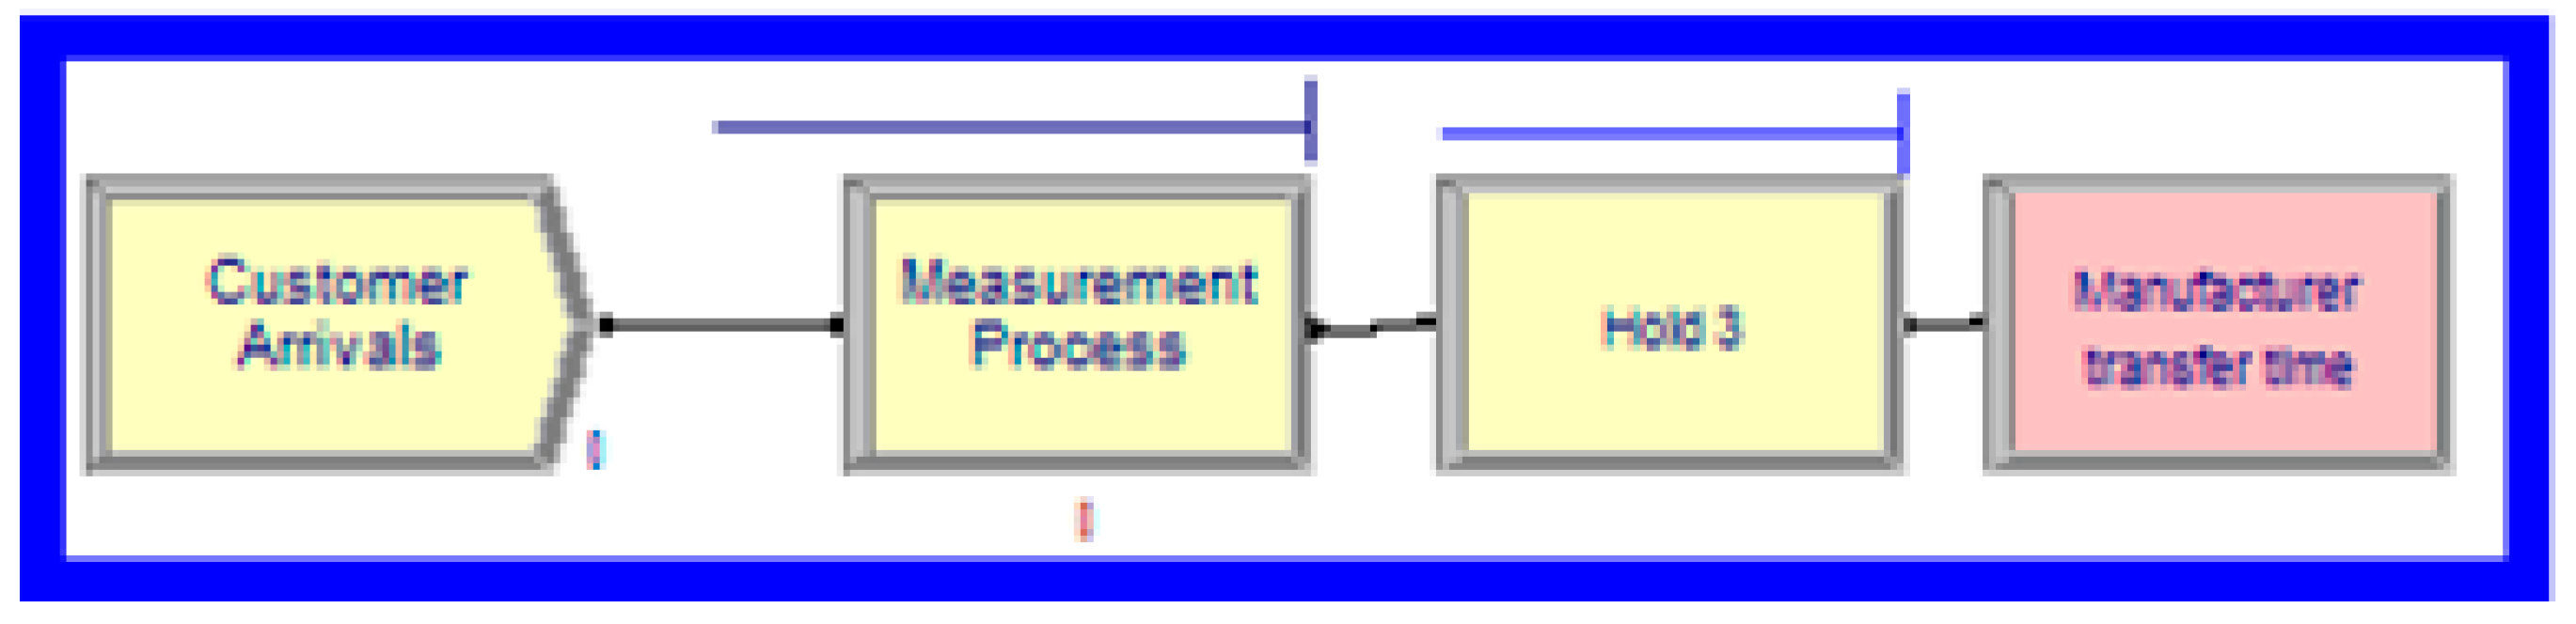
4.1. Simulation Model of TSCN
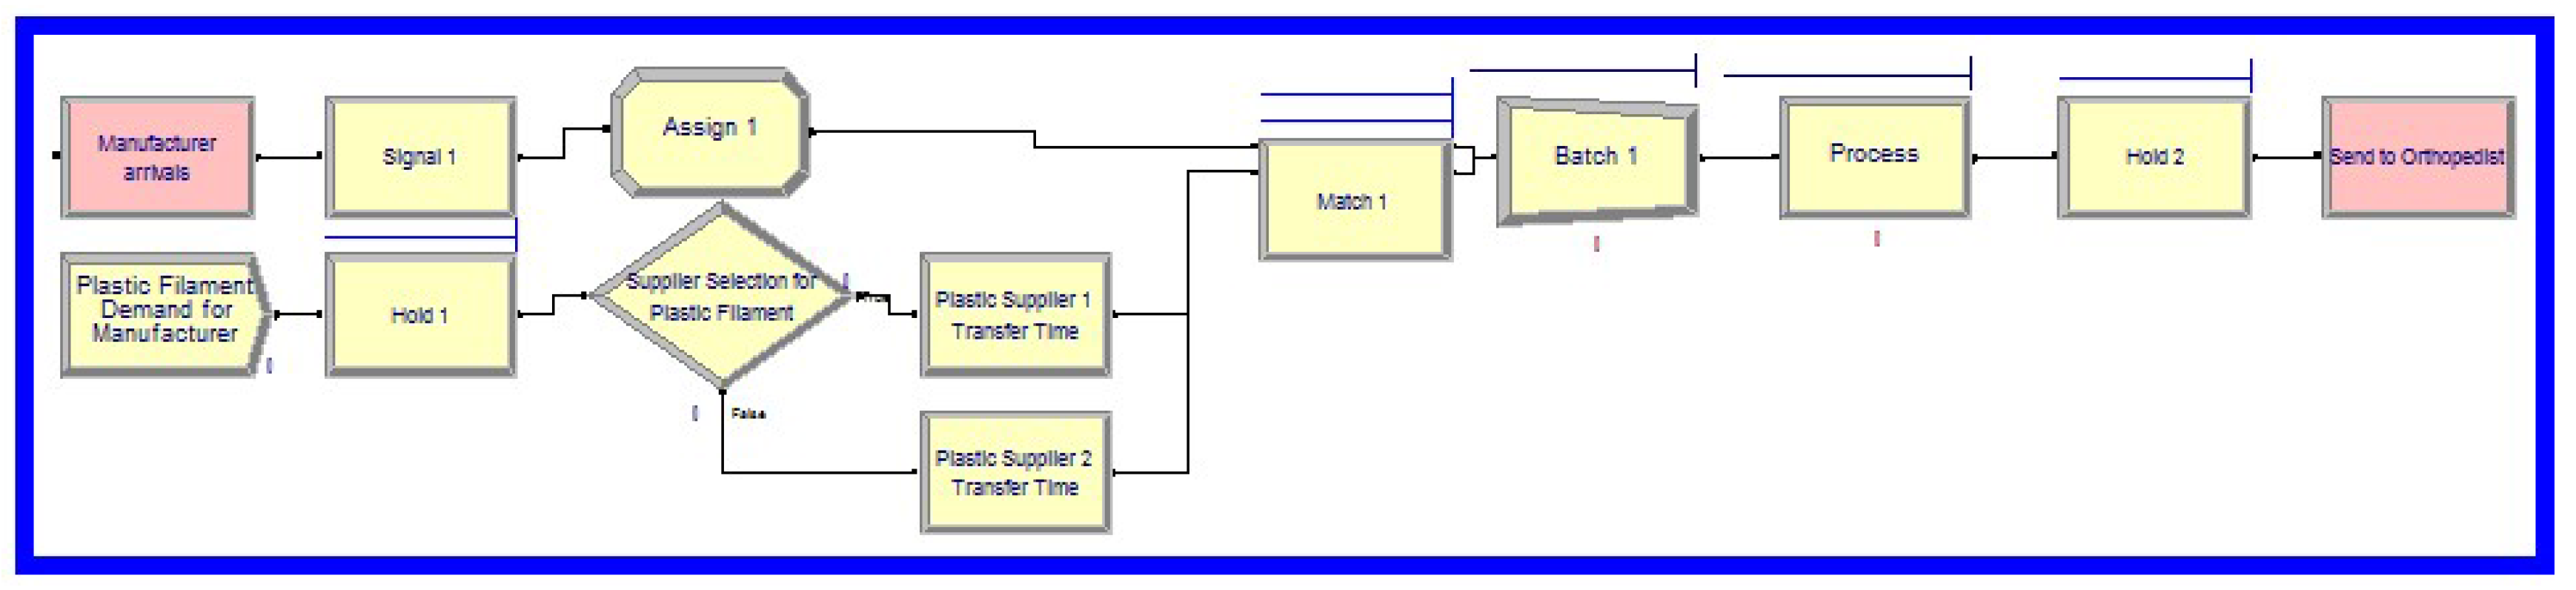
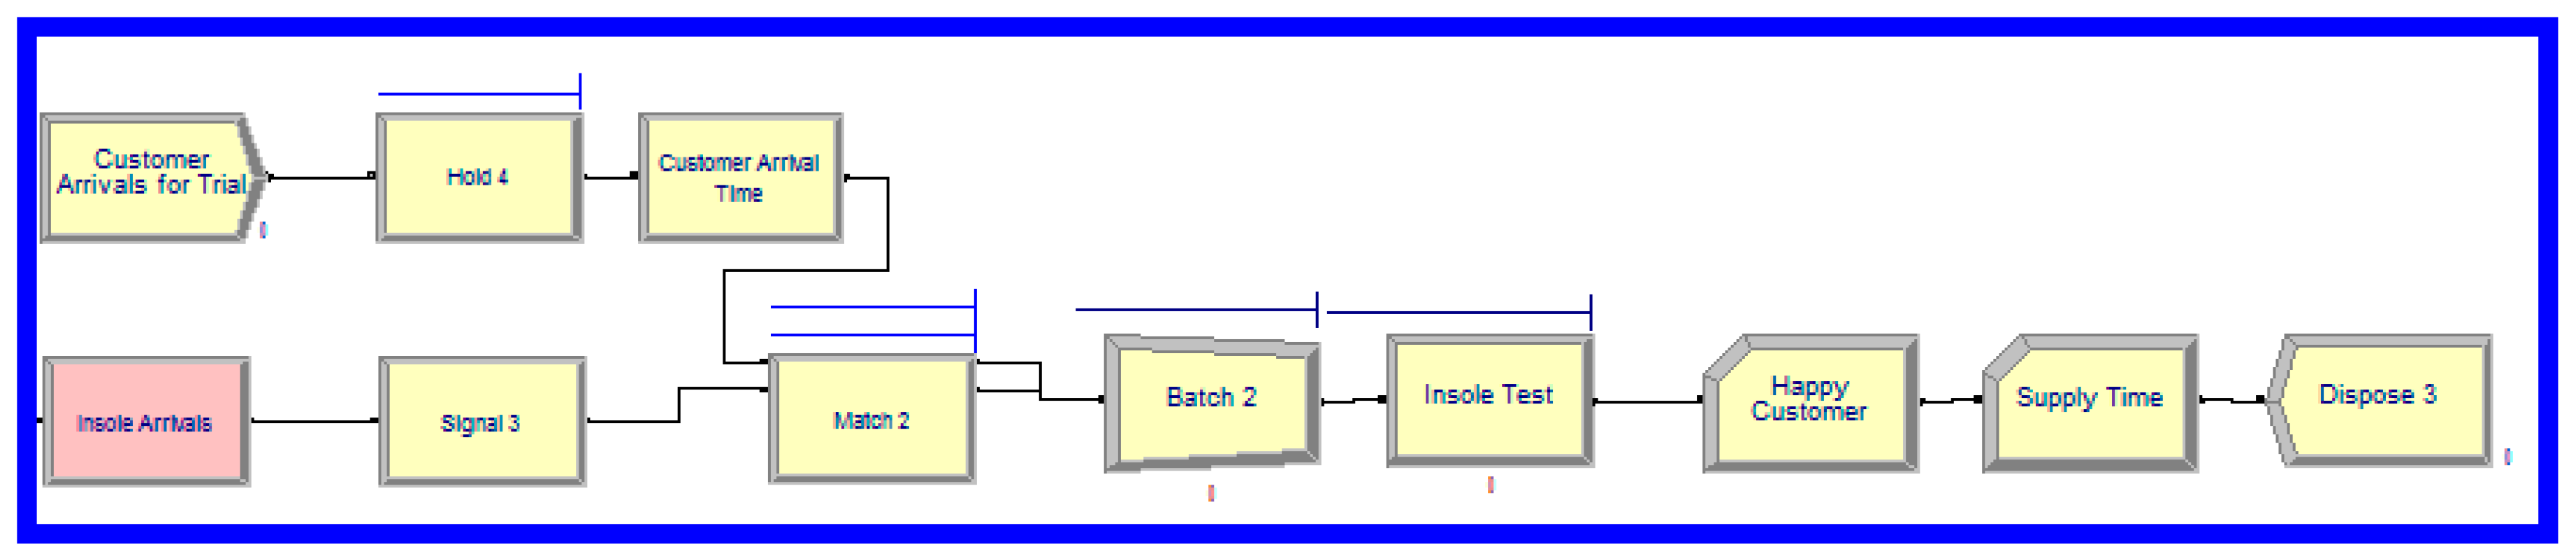
4.2. Simulation Model of 3DPSCN
5. Comparative Results
5.1. Scenario Analyses
5.1.1. Sensitivity to Changes in the Number of Machines (Scenario A)
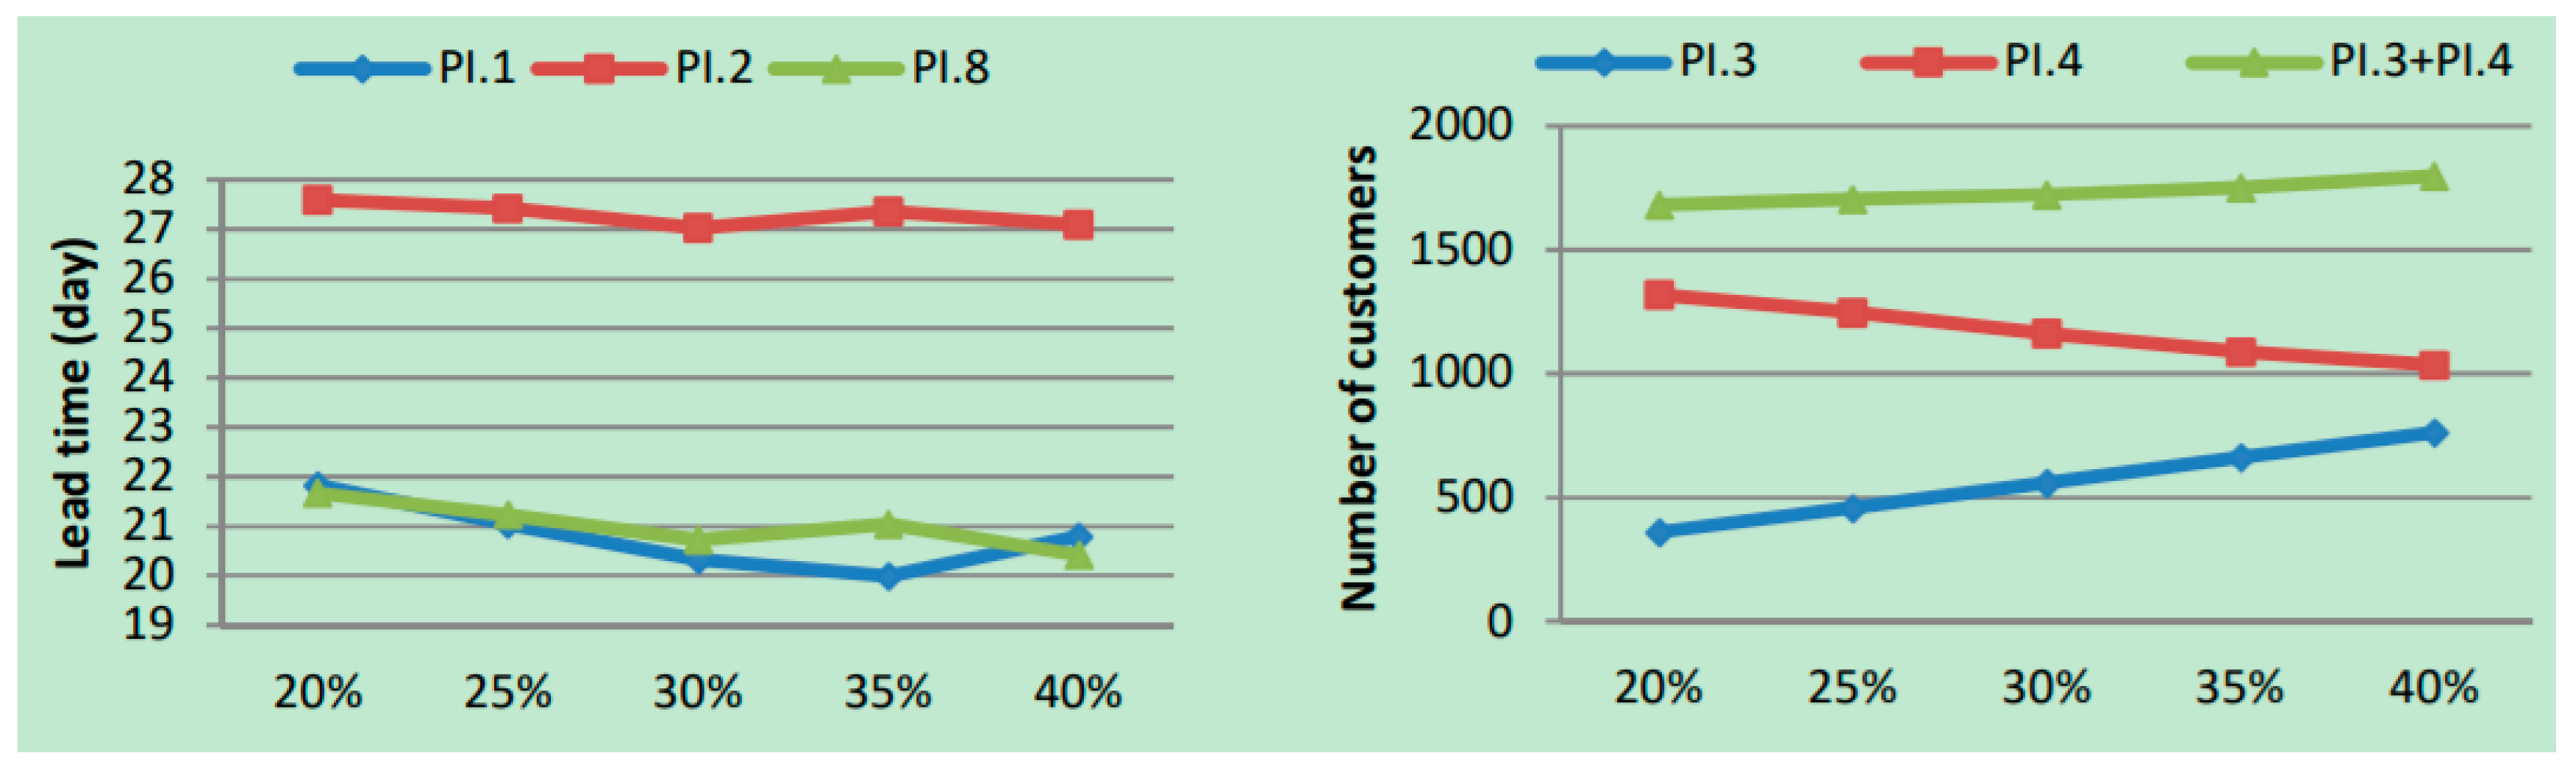
5.1.2. Sensitivity to Changes in the Acceptance Rate of First Testing (Scenario B)
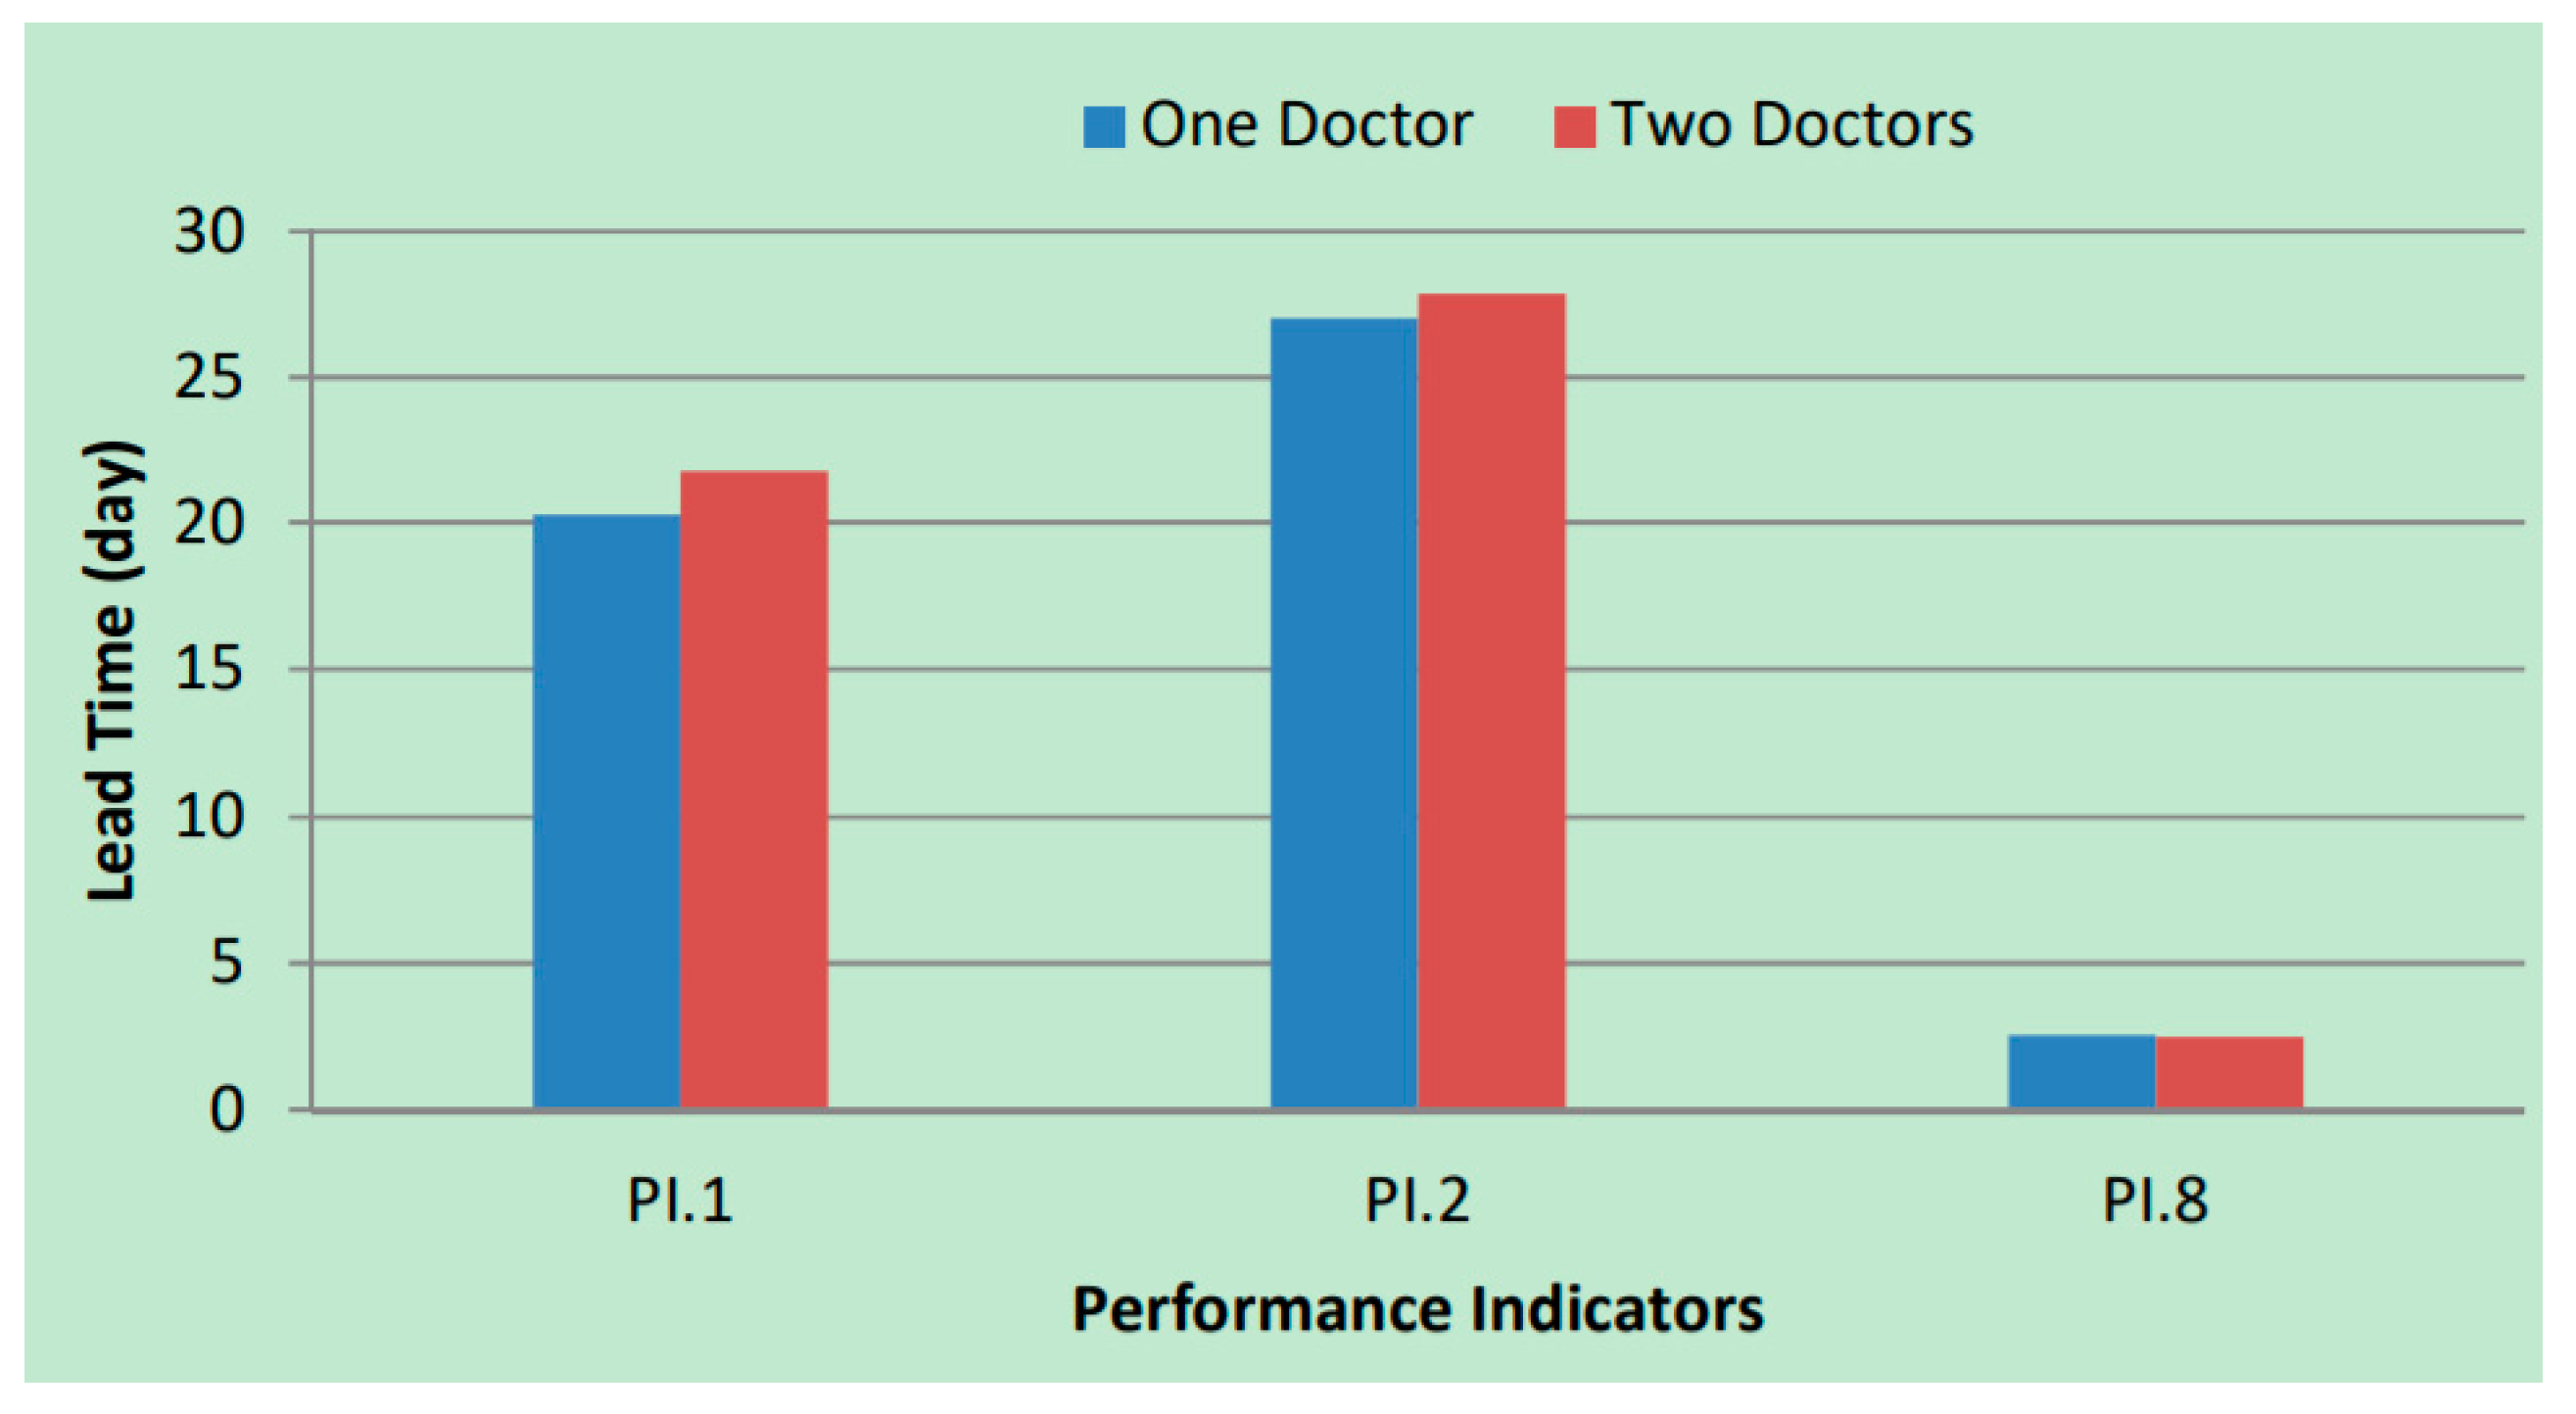
5.1.3. Sensitivity to Changes in the Number of Doctors (Scenario C)
5.1.4. Sensitivity to Changes in the Distribution of Customer Arrivals (Scenario D)
5.1.5. Sensitivity to Changes in the Breakdown Situations (Scenario E)
6. Conclusions
- To avoid carrying out further simulation experiments, simulation optimization techniques such as meta-models or variance analysis techniques can be applied.
- To reflect larger networks in real life, the number of facilities can be increased horizontally and vertically.
- To see the environmental effects, more performance indicators which represent assessment values concerning polluting factors, water or electricity uses related with production and transportation can be added.
- To see the economic effects, cost information of shipping, manufacturing and other activities can be added.
Acknowledgments
Author Contributions
Conflicts of Interest
References
- The Limits of 3D Printing. Available online: https://hbr.org/2015/06/the-limits-of-3d-printing (accessed on 26 June 2017).
- Çetinkaya, C.; Özceylan, E. Impacts of 3D printing on supply chain management. In Proceedings of the 13th International Logistics and Supply Chain Conference, İzmir, Turkey, 22–23 October 2015; pp. 649–657. [Google Scholar]
- Holmström, J.; Partanen, J.; Tuomi, J.; Walter, M. Rapid manufacturing in the spare parts supply chain: Alternative approaches to capacity deployment. J. Manuf. Technol. Manag. 2010, 21, 687–697. [Google Scholar] [CrossRef]
- A Third Industrial Revolution. Available online: http://www.economist.com/node/21552901 (accessed on 26 June 2017).
- Campbell, T.A.; Ivanova, O.S. Additive manufacturing as a disruptive technology: Implications of three-dimensional printing. Technol. Innov. 2013, 15, 67–79. [Google Scholar] [CrossRef]
- Liu, P.; Huang, S.H.; Mokasdar, A.; Zhou, H.; Hou, L. The impact of additive manufacturing in the aircraft spare parts supply chain: Supply chain operation reference model based analysis. Prod. Plan. Control 2014, 25, 1169–1181. [Google Scholar] [CrossRef]
- Khajavi, S.H.; Partanen, J.; Holmström, J. Additive manufacturing in the spare parts supply chain. Comput. Ind. 2014, 65, 50–63. [Google Scholar] [CrossRef]
- Janssen, G.R.; Blankers, I.J.; Moolenburgh, E.A.; Posthumus, A.L. The impact of 3D printing on supply chain management. In TNO White Papers; TNO: The Hague, The Netherlands, 2014; pp. 1–24. [Google Scholar]
- Vinodh, S.; Sundararaj, G.; Devadasan, S.R.; Kuttalingam, D.; Rajanayagam, D. Agility through rapid prototyping technology in a manufacturing environment using a 3D printer. J. Manuf. Technol. Manag. 2009, 20, 1023–1041. [Google Scholar] [CrossRef]
- Chiu, M.C.; Lin, Y.H. Simulation based method considering design for additive manufacturing and supply chain an empirical study of lamp industry. Ind. Manag. Data Syst. 2016, 116, 322–348. [Google Scholar] [CrossRef]
- Petrick, I.J.; Simpson, T.W. 3D printing disrupts manufacturing: How economies of one create new rules of competition. Res. Technol. Manag. 2013, 56, 12–16. [Google Scholar] [CrossRef]
- Walter, M.; Holmström, J.; Yrjöla, H. Rapid manufacturing and its impact on supply chain management. In Proceedings of the Logistics Research Network Annual Conference, Dublin, Ireland, 9–10 September 2004; pp. 1–12. [Google Scholar]
- Gunasekaran, A. Agile manufacturing: Enablers and an implementation framework. Int. J. Prod. Res. 1998, 36, 1223–1247. [Google Scholar] [CrossRef]
- Meredith, S.; Francis, D. Journey towards agility: The agile wheel explored. TQM Mag. 2000, 12, 137–143. [Google Scholar] [CrossRef]
- Yusuf, Y.Y.; Sarhadi, M.; Gunasekaran, A. Agile manufacturing: The drivers, concepts and attributes. Int. J. Prod. Econ. 1999, 62, 33–43. [Google Scholar] [CrossRef]
- Gardan, J. Additive manufacturing technologies: State of the art and trends. Int. J. Prod. Res. 2016, 54, 3118–3132. [Google Scholar] [CrossRef]
- Wu, P.; Wang, J.; Wang, X. A critical review of the use of 3D printing in the construction industry. Autom. Constr. 2016, 68, 21–31. [Google Scholar] [CrossRef]
- Perkins, I.; Skitmore, M. Three-dimensional printing in the construction industry: A review. Int. J. Constr. Manag. 2015, 15, 1–9. [Google Scholar] [CrossRef]
- Oettmeier, K.; Hofmann, E. Impact of additive manufacturing technology adoption on supply chain management processes and components. J. Manuf. Technol. Manag. 2016, 27, 944–968. [Google Scholar] [CrossRef]
- Wagner, S.M.; Walton, R.O. Additive manufacturing’s impact and future in the aviation industry. Prod. Plan. Control 2016, 27, 1124–1130. [Google Scholar] [CrossRef]
- Niaki, M.K.; Nonino, F. Additive manufacturing management: A review and future research agenda. Int. J. Prod. Res. 2017, 55, 1419–1439. [Google Scholar] [CrossRef]
- Niaki, M.K.; Nonino, F. Impact of additive manufacturing on business competitiveness: A multiple case study. J. Manuf. Technol. Manag. 2017, 28, 56–74. [Google Scholar] [CrossRef]
- Hasan, S.; Rennie, A.E.W. The application of rapid manufacturing technologies in the spare parts industry. In Proceedings of the 19th Annual International Solid Freeform Fabrication Symposium, Austin, TX, USA, 4–8 August 2008; pp. 584–590. [Google Scholar]
- Tuck, C.; Hague, R. The pivotal role of rapid manufacturing in the production of cost-effective customized products. Int. J. Mass Cust. 2006, 1, 360–373. [Google Scholar] [CrossRef]
- Tuck, C.; Hague, R.; Ruffo, M.; Ransley, M.; Adams, P. Rapid manufacturing facilitated customization. Int. J. Comput. Integr. Manuf. 2008, 21, 245–258. [Google Scholar] [CrossRef] [Green Version]
- Tuck, C.; Hague, R.; Burns, N. Rapid manufacturing: Impact on supply chain methodologies and practice. Int. J. Serv. Oper. Manag. 2007, 3, 1–22. [Google Scholar] [CrossRef]
- Huang, S.H.; Liu, P.; Mokasdar, A.; Hou, L. Additive manufacturing and its societal impact: A literature review. Int. J. Adv. Manuf. Technol. 2013, 67, 1191–1203. [Google Scholar] [CrossRef]
- Oettmeier, K.; Hofmann, E. Additive manufacturing technology adoption: An empirical analysis of general and supply chain-related determinants. J. Bus. Econ. 2016, 87, 97–124. [Google Scholar] [CrossRef]
- Terzi, S.; Cavalieri, S. Simulation in the supply chain context: A survey. Comput. Ind. 2004, 53, 3–16. [Google Scholar] [CrossRef]
- Persson, F.; Olhager, J. Performance simulation of supply chain designs. Int. J. Prod. Econ. 2002, 77, 231–245. [Google Scholar] [CrossRef]
- Truong, T.H.; Azadivar, F. Simulation based optimization for supply chain configuration design. In Proceedings of the Winter Simulation Conference, New Orleans, LA, USA, 7–10 December 2003; pp. 1268–1275. [Google Scholar]
- Reiner, G.; Trcka, M. Customized supply chain design: Problems and alternatives for a production company in the food industry: A simulation based analysis. Int. J. Prod. Econ. 2004, 89, 217–229. [Google Scholar] [CrossRef]
- Van der Vorst, J.G.; Beulens, A.J.; van Beek, P. Modelling and simulating multi-echelon food systems. Eur. J. Oper. Res. 2000, 122, 354–366. [Google Scholar] [CrossRef]
- Ding, H.; Benyoucef, L.; Xie, X. A simulation-based multi-objective genetic algorithm approach for networked enterprises optimization. Eng. Appl. Artif. Intell. 2006, 19, 609–623. [Google Scholar] [CrossRef]
- Kleijnen, J.P.C. Supply chain simulation tools and techniques: A survey. Int. J. Simul. Process Model. 2005, 1, 82–89. [Google Scholar] [CrossRef]
- Almeder, C.; Preusser, M.; Hartl, R.F. Simulation and optimization of supply chains: Alternative or complementary approaches? OR Spectr. 2009, 31, 95–119. [Google Scholar] [CrossRef]
- Kawa, A. Simulation of dynamic supply chain configuration based on software agents and graph theory. In Proceedings of the International Work-Conference on Artificial Neural Networks, Salamanca, Spain, 10–12 June 2009; Springer: Berlin/Heidelberg, Germany; pp. 346–349. [Google Scholar]
- Kawa, A.; Golinska, P. Supply chain arrangements in recovery network. In Agent and Multi-Agent Systems: Technologies and Applications. Lecture Notes in Computer Science; Jędrzejowicz, P., Nguyen, N.T., Howlet, R.J., Jain, L.C., Eds.; Springer: Berlin/Heidelberg, Germany, 2010; pp. 292–301. [Google Scholar]
- Jayant, A.; Gupta, P.; Garg, S.K. Simulation modelling and analysis of network design for closed-loop supply chain: A case study of battery industry. Procedia Eng. 2015, 97, 2213–2221. [Google Scholar] [CrossRef]
- Salem, R.W.; Haouari, M. A simulation-optimization approach for supply chain network design under supply and demand uncertainties. Int. J. Prod. Res. 2017, 55, 1845–1861. [Google Scholar] [CrossRef]
- Kelton, W.D.; Sadowski, R.; Zupick, N. Simulation with Arena, 5th ed.; McGraw-Hill Education: New York, NY, USA, 2009. [Google Scholar]
- Abd El-Aal, M.A.M.; El-Sharief, M.A.; El-Deen, A.E.; Nassr, A.B. Supply chain performance evaluation: A comprehensive evaluation system. Int. J. Bus. Perform. Supply Chain Model. 2011, 3, 141–166. [Google Scholar] [CrossRef]
- Holweg, M.; Hoberg, K.; Pil, F.K.; Heinen, J. Making 3D printing work for you: Defining business models for additive manufacturing. Eur. Bus. Rev. 2016, 4, 71–76. [Google Scholar]


| Definition | Parameter Value |
|---|---|
| Arrivals of customers to the orthopedist to give an order and also receive the insole | TRIA (50, 60, 70) min |
| Taking a plaster cast from the customer’s foot (per foot) | TRIA (5, 6, 7) min |
| Transportation time from orthopedist to manufacturer#1 (vice versa) | UNIF (7.5, 8.5) h |
| Transportation time from orthopedist to manufacturer#2 (vice versa) | UNIF (5.5, 6.5) h |
| Transportation time from cork supplier#1 to manufacturer#1 | UNIF (1.5, 2.0) h |
| Transportation time from cork supplier#2 to manufacturer#1 | UNIF (3.5, 3.9) h |
| Transportation time from cork supplier#1 to manufacturer#2 | UNIF (3.2, 3.8) h |
| Transportation time from cork supplier#2 to manufacturer#2 | UNIF (4.5, 4.9) h |
| Pre-processing operation time of cork | TRIA (45, 50, 55) min |
| Rate of waste in pre-processing of cork | UNIF (0.025, 0.030) |
| Waiting time of cork, plastic and leather for assembly operation | UNIF (10, 15) min |
| Transportation time from plastic supplier to manufacturer#1 | UNIF (3.9, 4.1) h |
| Transportation time from plastic supplier to manufacturer#2 | UNIF (4.6, 5.0) h |
| Pre-processing operation time of plastic | TRIA (25, 30, 35) min |
| Rate of waste in pre-processing of plastic | UNIF (0.025, 0.030) |
| Transportation time from leather supplier#1 to manufacturer#1 | UNIF (1.1, 1.5) h |
| Transportation time from leather supplier#2 to manufacturer#1 | UNIF (0.35, 0.55) h |
| Transportation time from leather supplier#3 to manufacturer#1 | UNIF (7.0, 7.8) h |
| Transportation time from leather supplier#1 to manufacturer#2 | UNIF (2.8, 3.2) h |
| Transportation time from leather supplier#2 to manufacturer#2 | UNIF (2.1, 2.5) h |
| Transportation time from leather supplier#3 to manufacturer#2 | UNIF (5.4, 5.8) h |
| Required time to assemble of plastic, cork and leather (per foot) | TRIA (20, 30, 40) min |
| Rate of waste in assembling of plastic, cork and leather | UNIF (0.03, 0.04) |
| Required time to test the insole (for a pair) | TRIA (7, 8, 9) min |
| Required time to adjust the tested insole (per foot) | TRIA (20, 30, 40) min |
| Definition | Parameter Value |
|---|---|
| Arrivals of customers to the orthopedist to give an order and also receive the insole | TRIA (50, 60, 70) min |
| Scanning of customer’s foot in orthopedist (per foot) | UNIF (3, 4) min |
| Required time to send the scanning files from orthopedist to manufacturer | UNIF (1, 2) min |
| Transportation time from filament supplier#1 to manufacturer | UNIF (8.5, 8.9) h |
| Transportation time from filament supplier#2 to manufacturer | UNIF (8.3, 8.7) h |
| Printing the insole in 3D printer (per foot) | TRIA (55, 60, 65) min |
| Transportation time from manufacturer to orthopedist | UNIF (10, 12) min |
| Required time to test the insole (for a pair) | TRIA (7, 8, 9) min |
| Performance Indicator (PI) | Entity | Explanation |
|---|---|---|
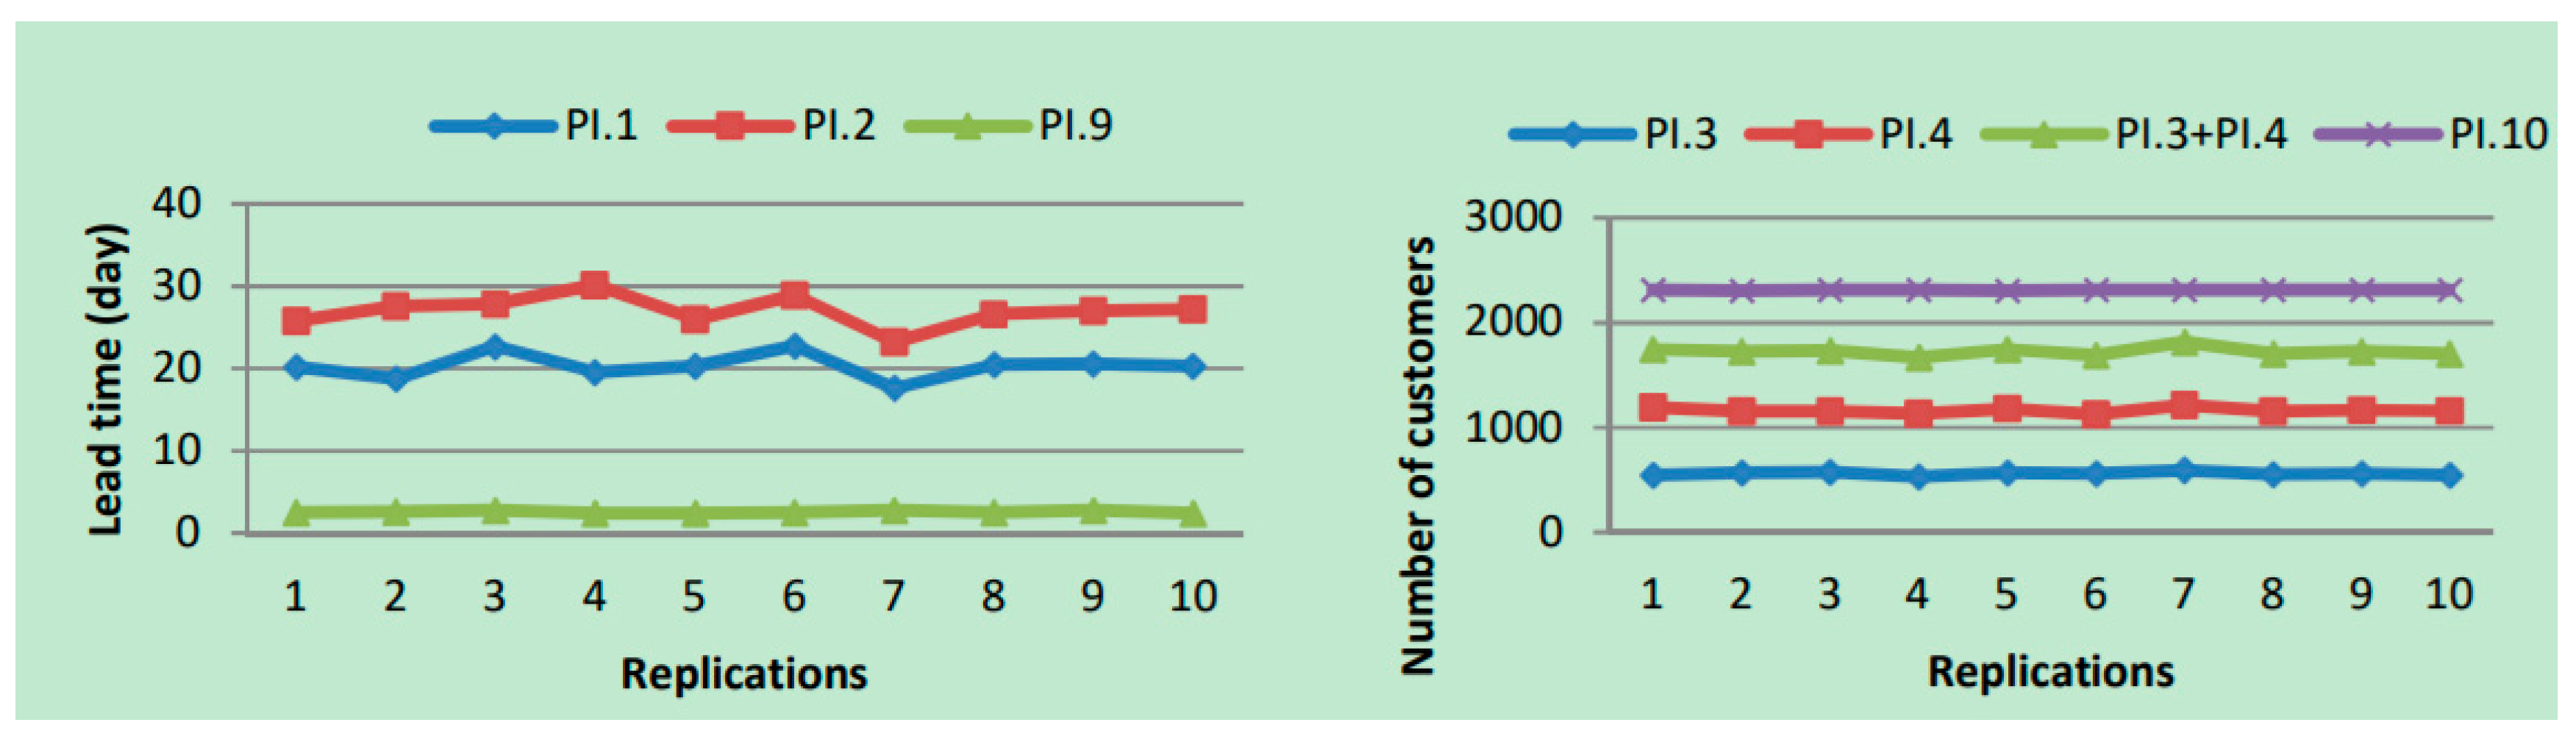
| PI.1 | Day | Lead time of customers who get insole on the first try in TSCN |
| PI.2 | Day | Lead time of customers who get insole on the second try in TSCN |
| PI.3 | People | Number of customers who get insole on the first try in TSCN |
| PI.4 | People | Number of customers who get insole on the second try in TSCN |
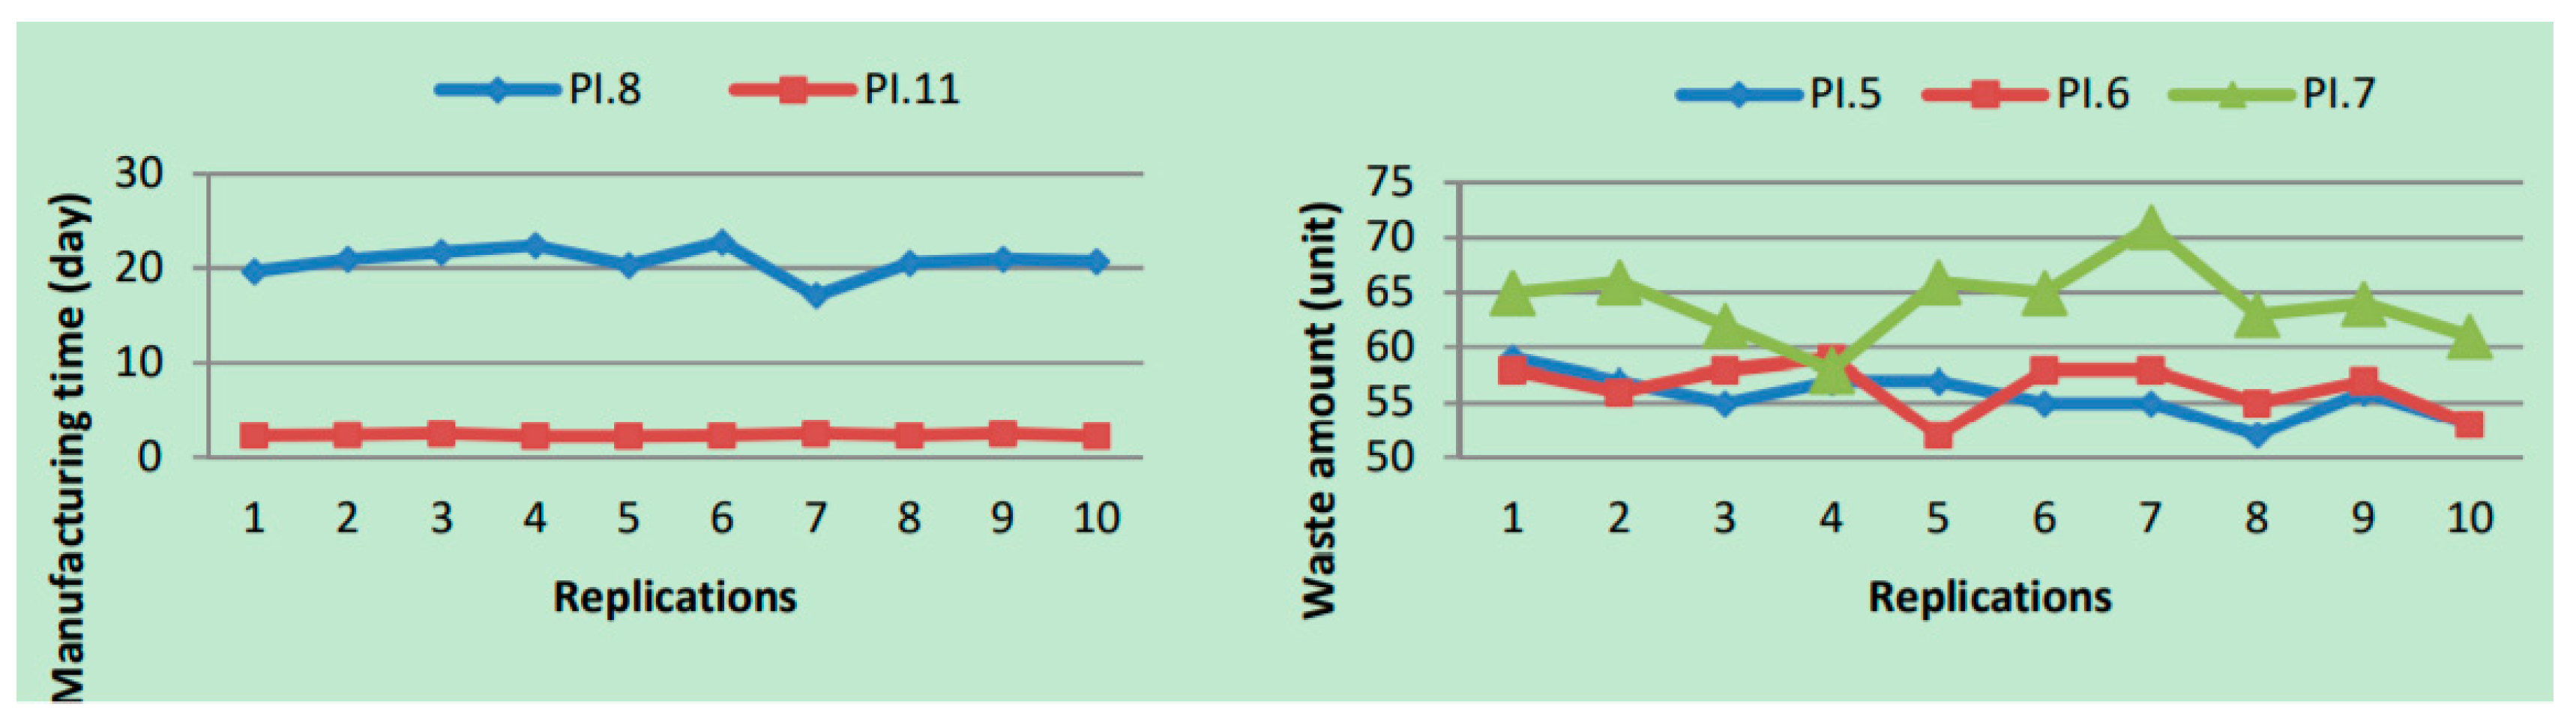
| PI.5 | Unit | Amount of cork waste in TSCN |
| PI.6 | Unit | Amount of plastic waste in TSCN |
| PI.7 | Unit | Amount of waste occurred in manufacturing in TSCN |
| PI.8 | Day | Total manufacturing and pre-processing time in TSCN |
| PI.9 | Day | Lead time of customers who get insole in 3DPSCN |
| PI.10 | People | Number of customers who get insole in 3DPSCN |
| PI.11 | Day | Total manufacturing time in 3DPSCN |
| PI | Average | Standard Deviation | Half-Width | Minimum | Maximum |
|---|---|---|---|---|---|
| PI.1 | 20.32 | 1.56 | 1.17 | 17.63 | 22.81 |
| PI.2 | 27.03 | 1.88 | 1.12 | 23.18 | 30.14 |
| PI.3 | 560 | 17.18 | 12.29 | 533 | 596 |
| PI.4 | 1164 | 28.02 | 20.04 | 1128 | 1219 |
| PI.5 | 57.00 | 3.12 | 2.24 | 51.61 | 61.08 |
| PI.6 | 56.00 | 3.10 | 2.23 | 51.97 | 60.61 |
| PI.7 | 65.00 | 5.59 | 4.22 | 55.53 | 75.56 |
| PI.8 | 20.72 | 1.59 | 1.14 | 17.10 | 22.77 |
| PI.9 | 2.55 | 0.14 | 0.10 | 2.39 | 2.76 |
| PI.10 | 2308 | 1.68 | 1.21 | 2306 | 2311 |
| PI.11 | 2.36 | 0.14 | 0.10 | 2.19 | 2.56 |
| PI | Average | Minimum | Maximum |
|---|---|---|---|
| PI.1 | 2.44 | 2.02 | 5.34 |
| PI.2 | 5.32 | 4.01 | 9.26 |
| PI.3 | 692 | 675 | 719 |
| PI.4 | 1595 | 1566 | 1620 |
| PI.5 | 62.00 | 59.00 | 67.00 |
| PI.6 | 64.00 | 58.00 | 70.00 |
| PI.7 | 81.00 | 72.00 | 90.00 |
| PI.8 | 2.01 | 1.89 | 3.10 |
| PI.9 | 2.19 | 2.12 | 2.29 |
| PI.10 | 2315 | 2310 | 2322 |
| PI.11 | 2.00 | 1.99 | 2.01 |
| PI | Average | Standard Deviation | Half-Width | Minimum | Maximum |
|---|---|---|---|---|---|
| PI.1 | 11.66 | 0.87 | 0.91 | 1.11 | 59.57 |
| PI.2 | 14.53 | 1.05 | 0.58 | 2.19 | 80.56 |
| PI.3 | 565 | 17.23 | 18 | 540 | 611 |
| PI.4 | 1186 | 28.09 | 19 | 1157 | 1205 |
| PI.5 | 57.40 | 3.15 | 2.17 | 52.38 | 61.35 |
| PI.6 | 56.71 | 3.08 | 2.19 | 52.75 | 61.41 |
| PI.7 | 66.00 | 5.65 | 4.29 | 59.28 | 74.97 |
| PI.8 | 11.25 | 0.68 | 0.58 | 1.04 | 59.93 |
| PI.9 | 1.49 | 0.08 | 0.09 | 1.15 | 2.31 |
| PI.10 | 2307 | 1.64 | 2 | 2303 | 2311 |
| PI.11 | 1.39 | 0.06 | 0.09 | 1.08 | 2.16 |
| PI | Average | Standard Deviation | Half-Width | Minimum | Maximum |
|---|---|---|---|---|---|
| PI.1 | 12.19 | 0.95 | 0.55 | 1.11 | 61.66 |
| PI.2 | 15.10 | 1.12 | 0.46 | 2.18 | 82.72 |
| PI.3 | 550 | 16.21 | 15.72 | 523 | 588 |
| PI.4 | 1153 | 27.16 | 15 | 1125 | 1187 |
| PI.5 | 57.10 | 3.11 | 2.62 | 51.03 | 62.46 |
| PI.6 | 57.25 | 3.44 | 1.69 | 53.57 | 60.46 |
| PI.7 | 63.42 | 4.95 | 4.15 | 56.05 | 71.35 |
| PI.8 | 11.94 | 0.83 | 0.42 | 1.04 | 61.58 |
| PI.9 | 1.44 | 0.07 | 0.11 | 1.15 | 2.85 |
| PI.10 | 2300 | 1.63 | 2.43 | 2295 | 2306 |
| PI.11 | 1.34 | 0.06 | 0.11 | 1.08 | 2.70 |
© 2017 by the authors. Licensee MDPI, Basel, Switzerland. This article is an open access article distributed under the terms and conditions of the Creative Commons Attribution (CC BY) license (http://creativecommons.org/licenses/by/4.0/).
Share and Cite
Özceylan, E.; Çetinkaya, C.; Demirel, N.; Sabırlıoğlu, O. Impacts of Additive Manufacturing on Supply Chain Flow: A Simulation Approach in Healthcare Industry. Logistics 2018, 2, 1. https://doi.org/10.3390/logistics2010001
Özceylan E, Çetinkaya C, Demirel N, Sabırlıoğlu O. Impacts of Additive Manufacturing on Supply Chain Flow: A Simulation Approach in Healthcare Industry. Logistics. 2018; 2(1):1. https://doi.org/10.3390/logistics2010001
Chicago/Turabian StyleÖzceylan, Eren, Cihan Çetinkaya, Neslihan Demirel, and Ozan Sabırlıoğlu. 2018. "Impacts of Additive Manufacturing on Supply Chain Flow: A Simulation Approach in Healthcare Industry" Logistics 2, no. 1: 1. https://doi.org/10.3390/logistics2010001
APA StyleÖzceylan, E., Çetinkaya, C., Demirel, N., & Sabırlıoğlu, O. (2018). Impacts of Additive Manufacturing on Supply Chain Flow: A Simulation Approach in Healthcare Industry. Logistics, 2(1), 1. https://doi.org/10.3390/logistics2010001