
Fusion vs. Isolation: Evaluating the Performance of Multi-Sensor Integration for Meat Spoilage Prediction


Abstract
1. Introduction
2. Materials and Methods
2.1. Experimental Design, Sample Preparation, and Microbiological Analysis
2.1.1. Chicken Thigh Samples
2.1.2. Beef Mince Samples
2.2. Microbiological Analysis
2.2.1. Spectral Acquisition—Multispectral Imaging
2.2.2. Spectral Acquisition—Fourier Transform Infrared Spectroscopy
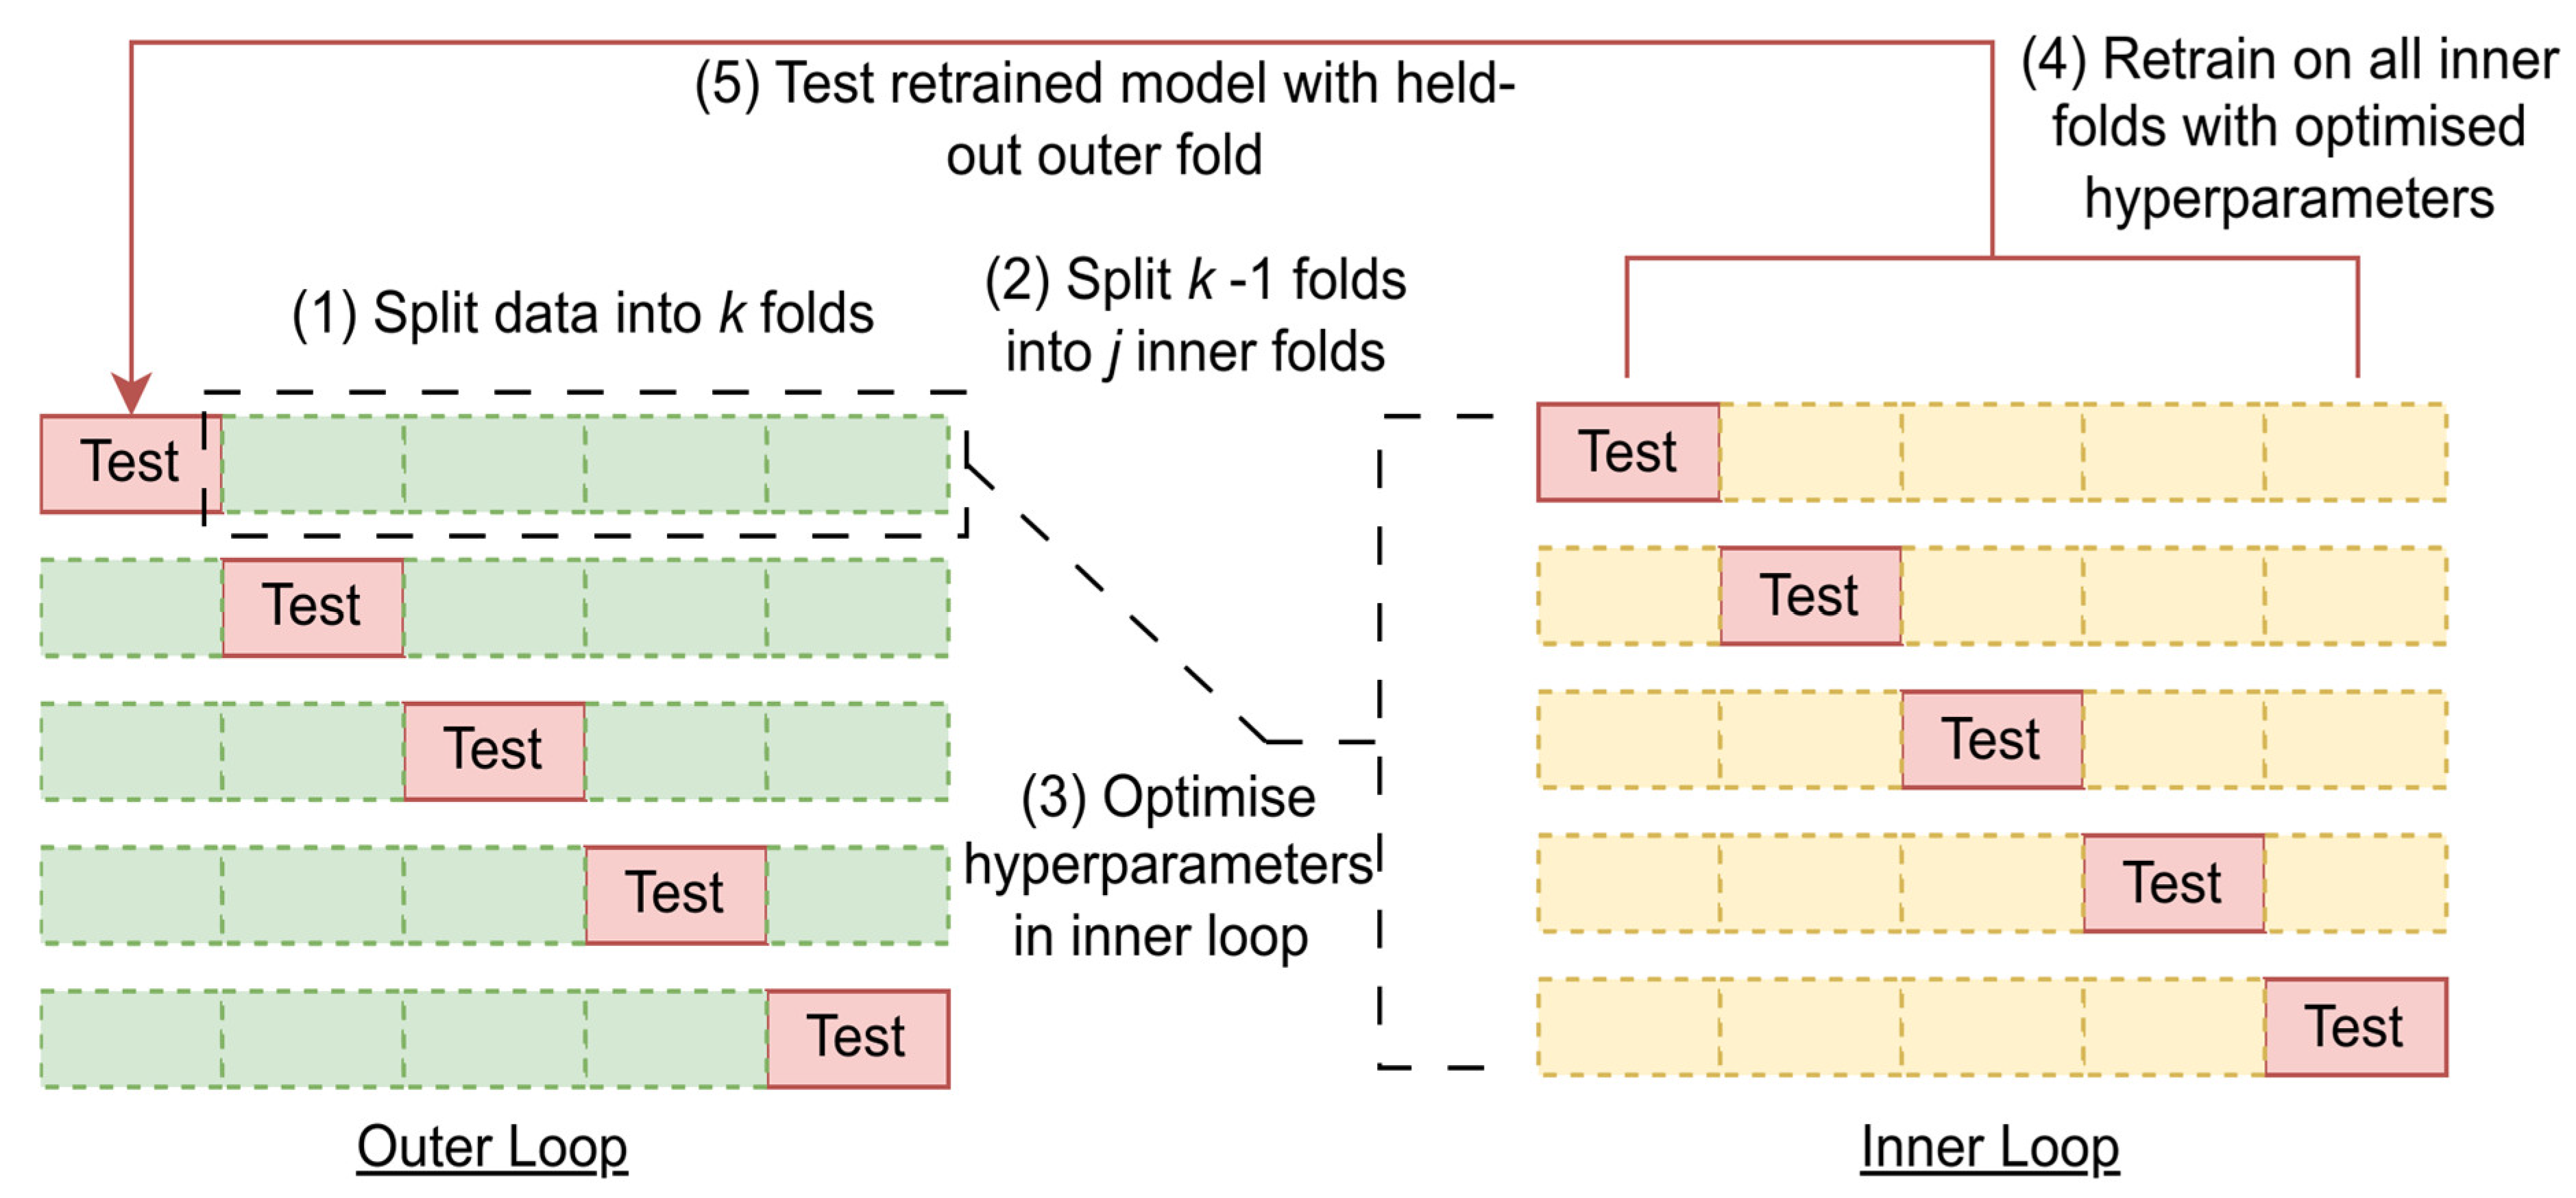
2.3. Data Partitioning, Preprocessing, and Analysis
2.3.1. Machine Learning Methods
2.3.2. Multi-Sensor Fusion Strategies
3. Results
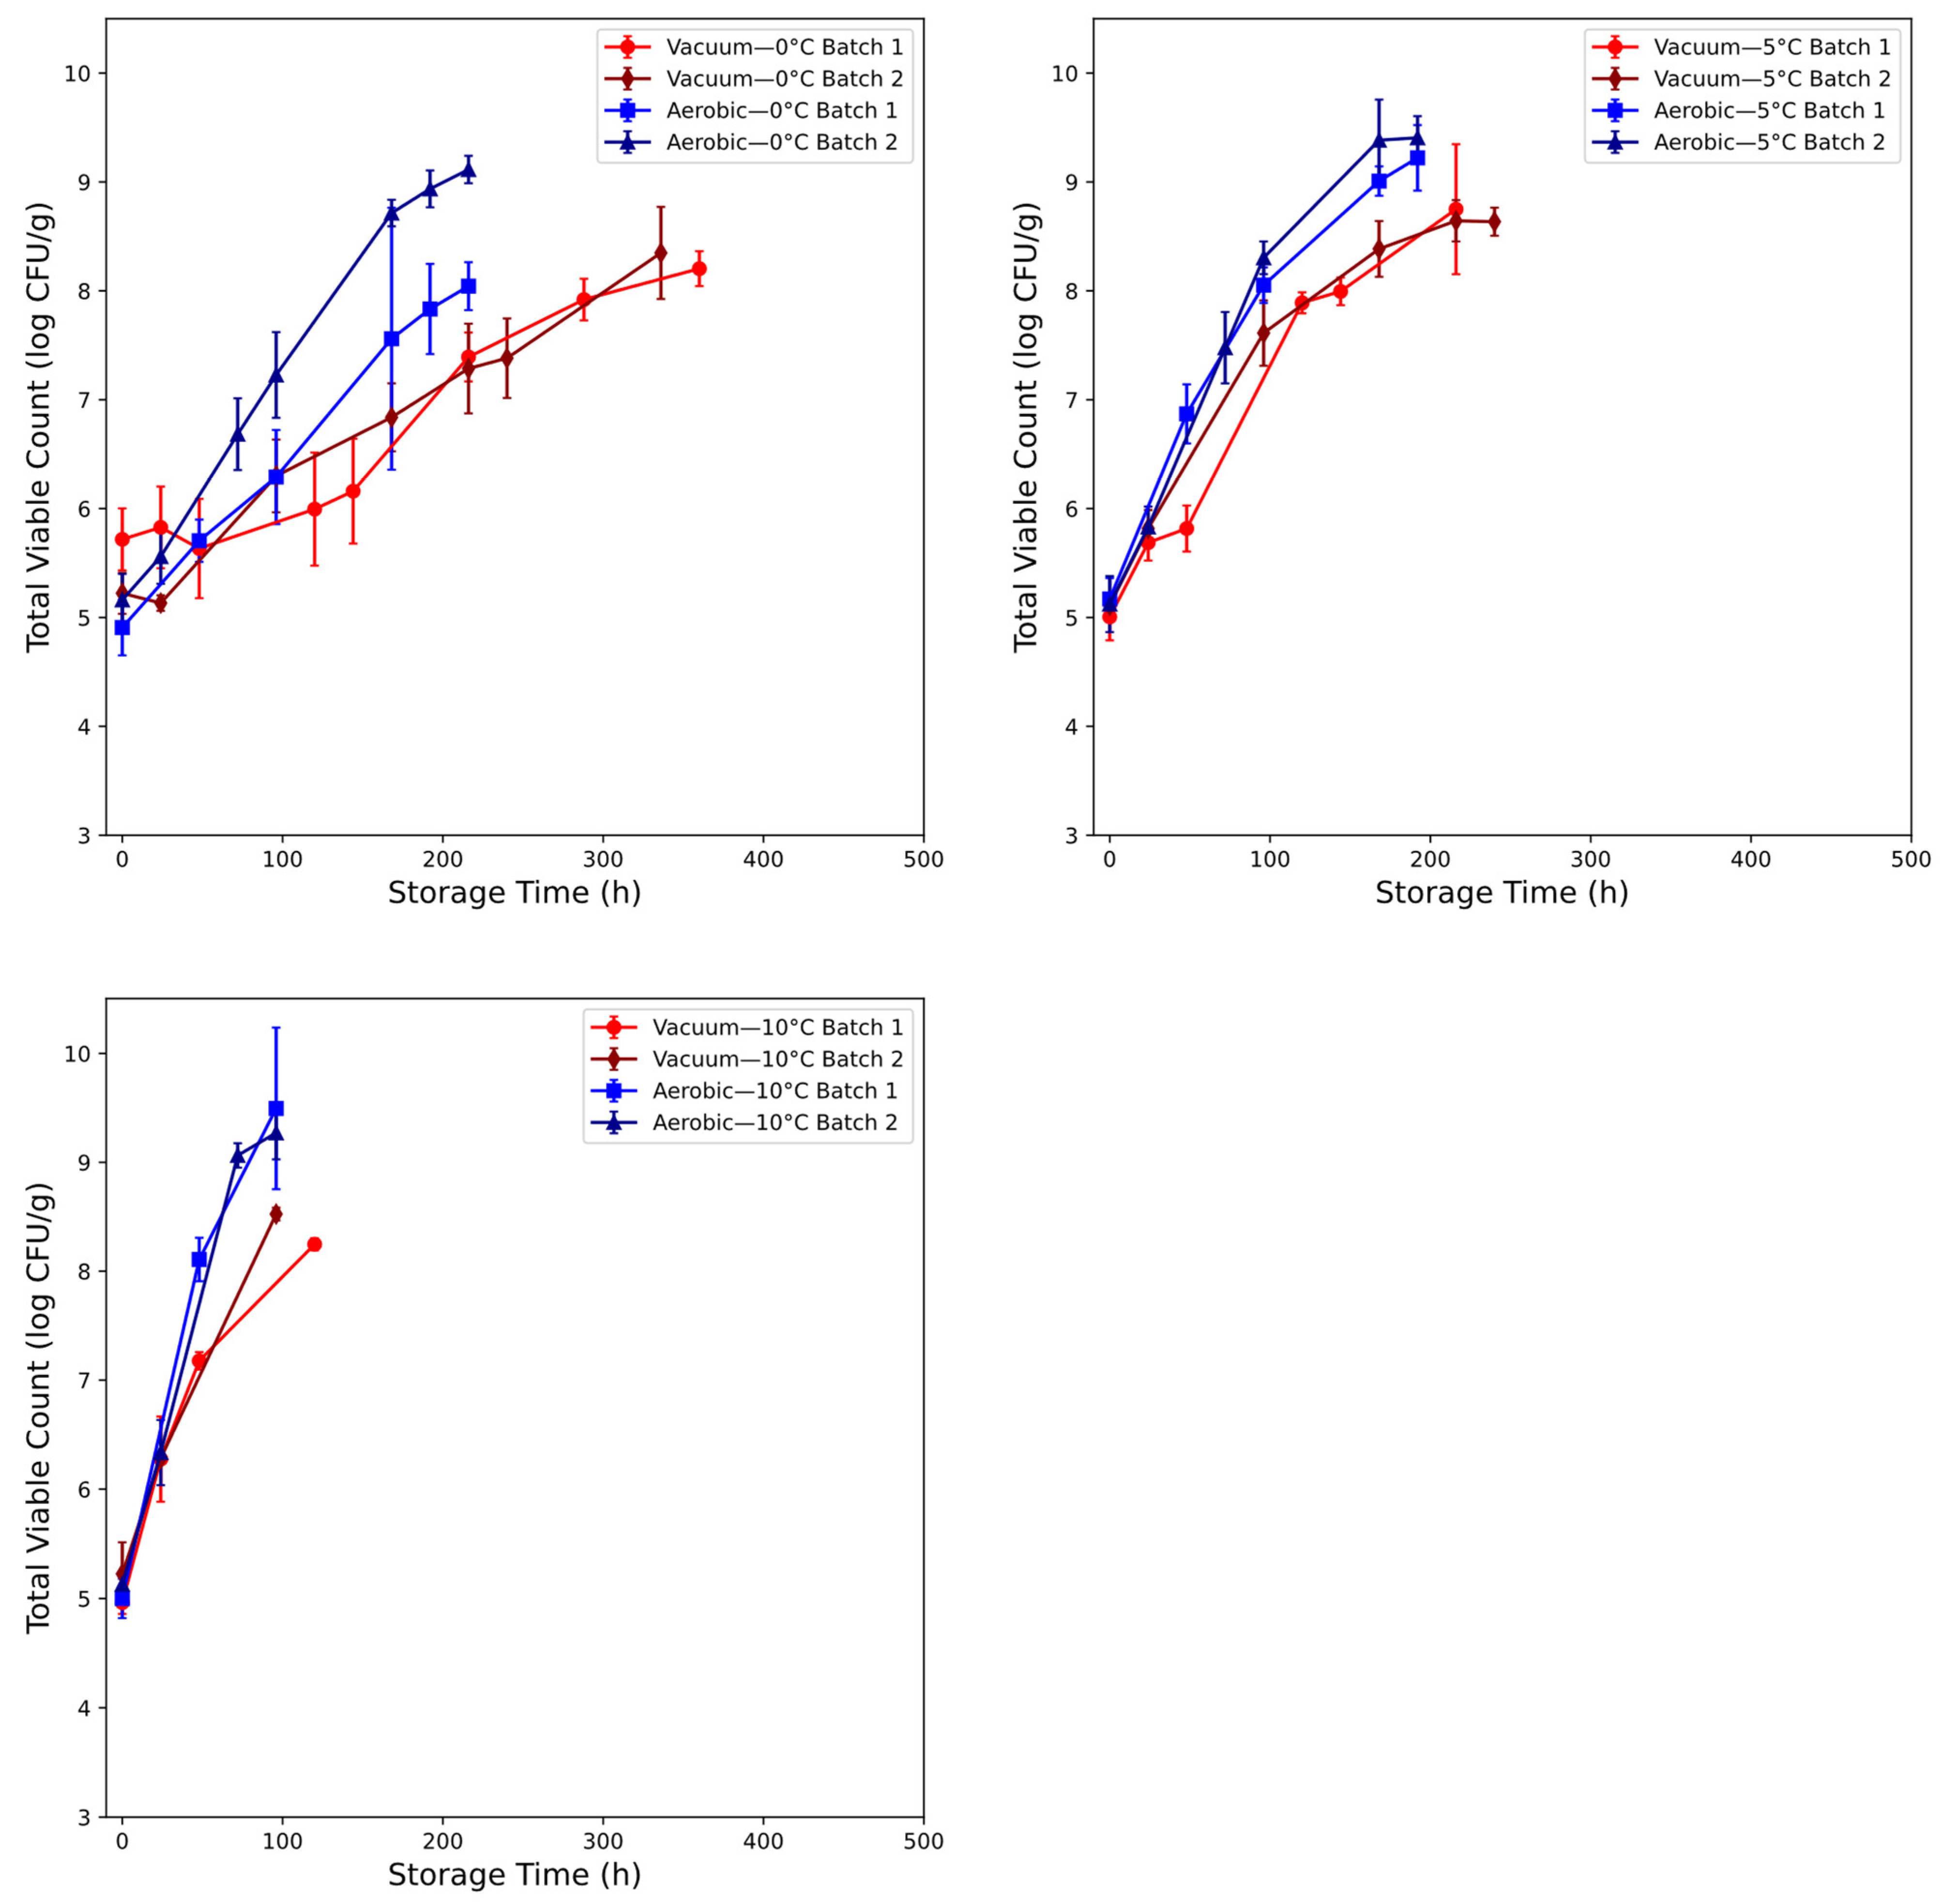
3.1. Microbial Assessment of Chicken Thigh Spoilage
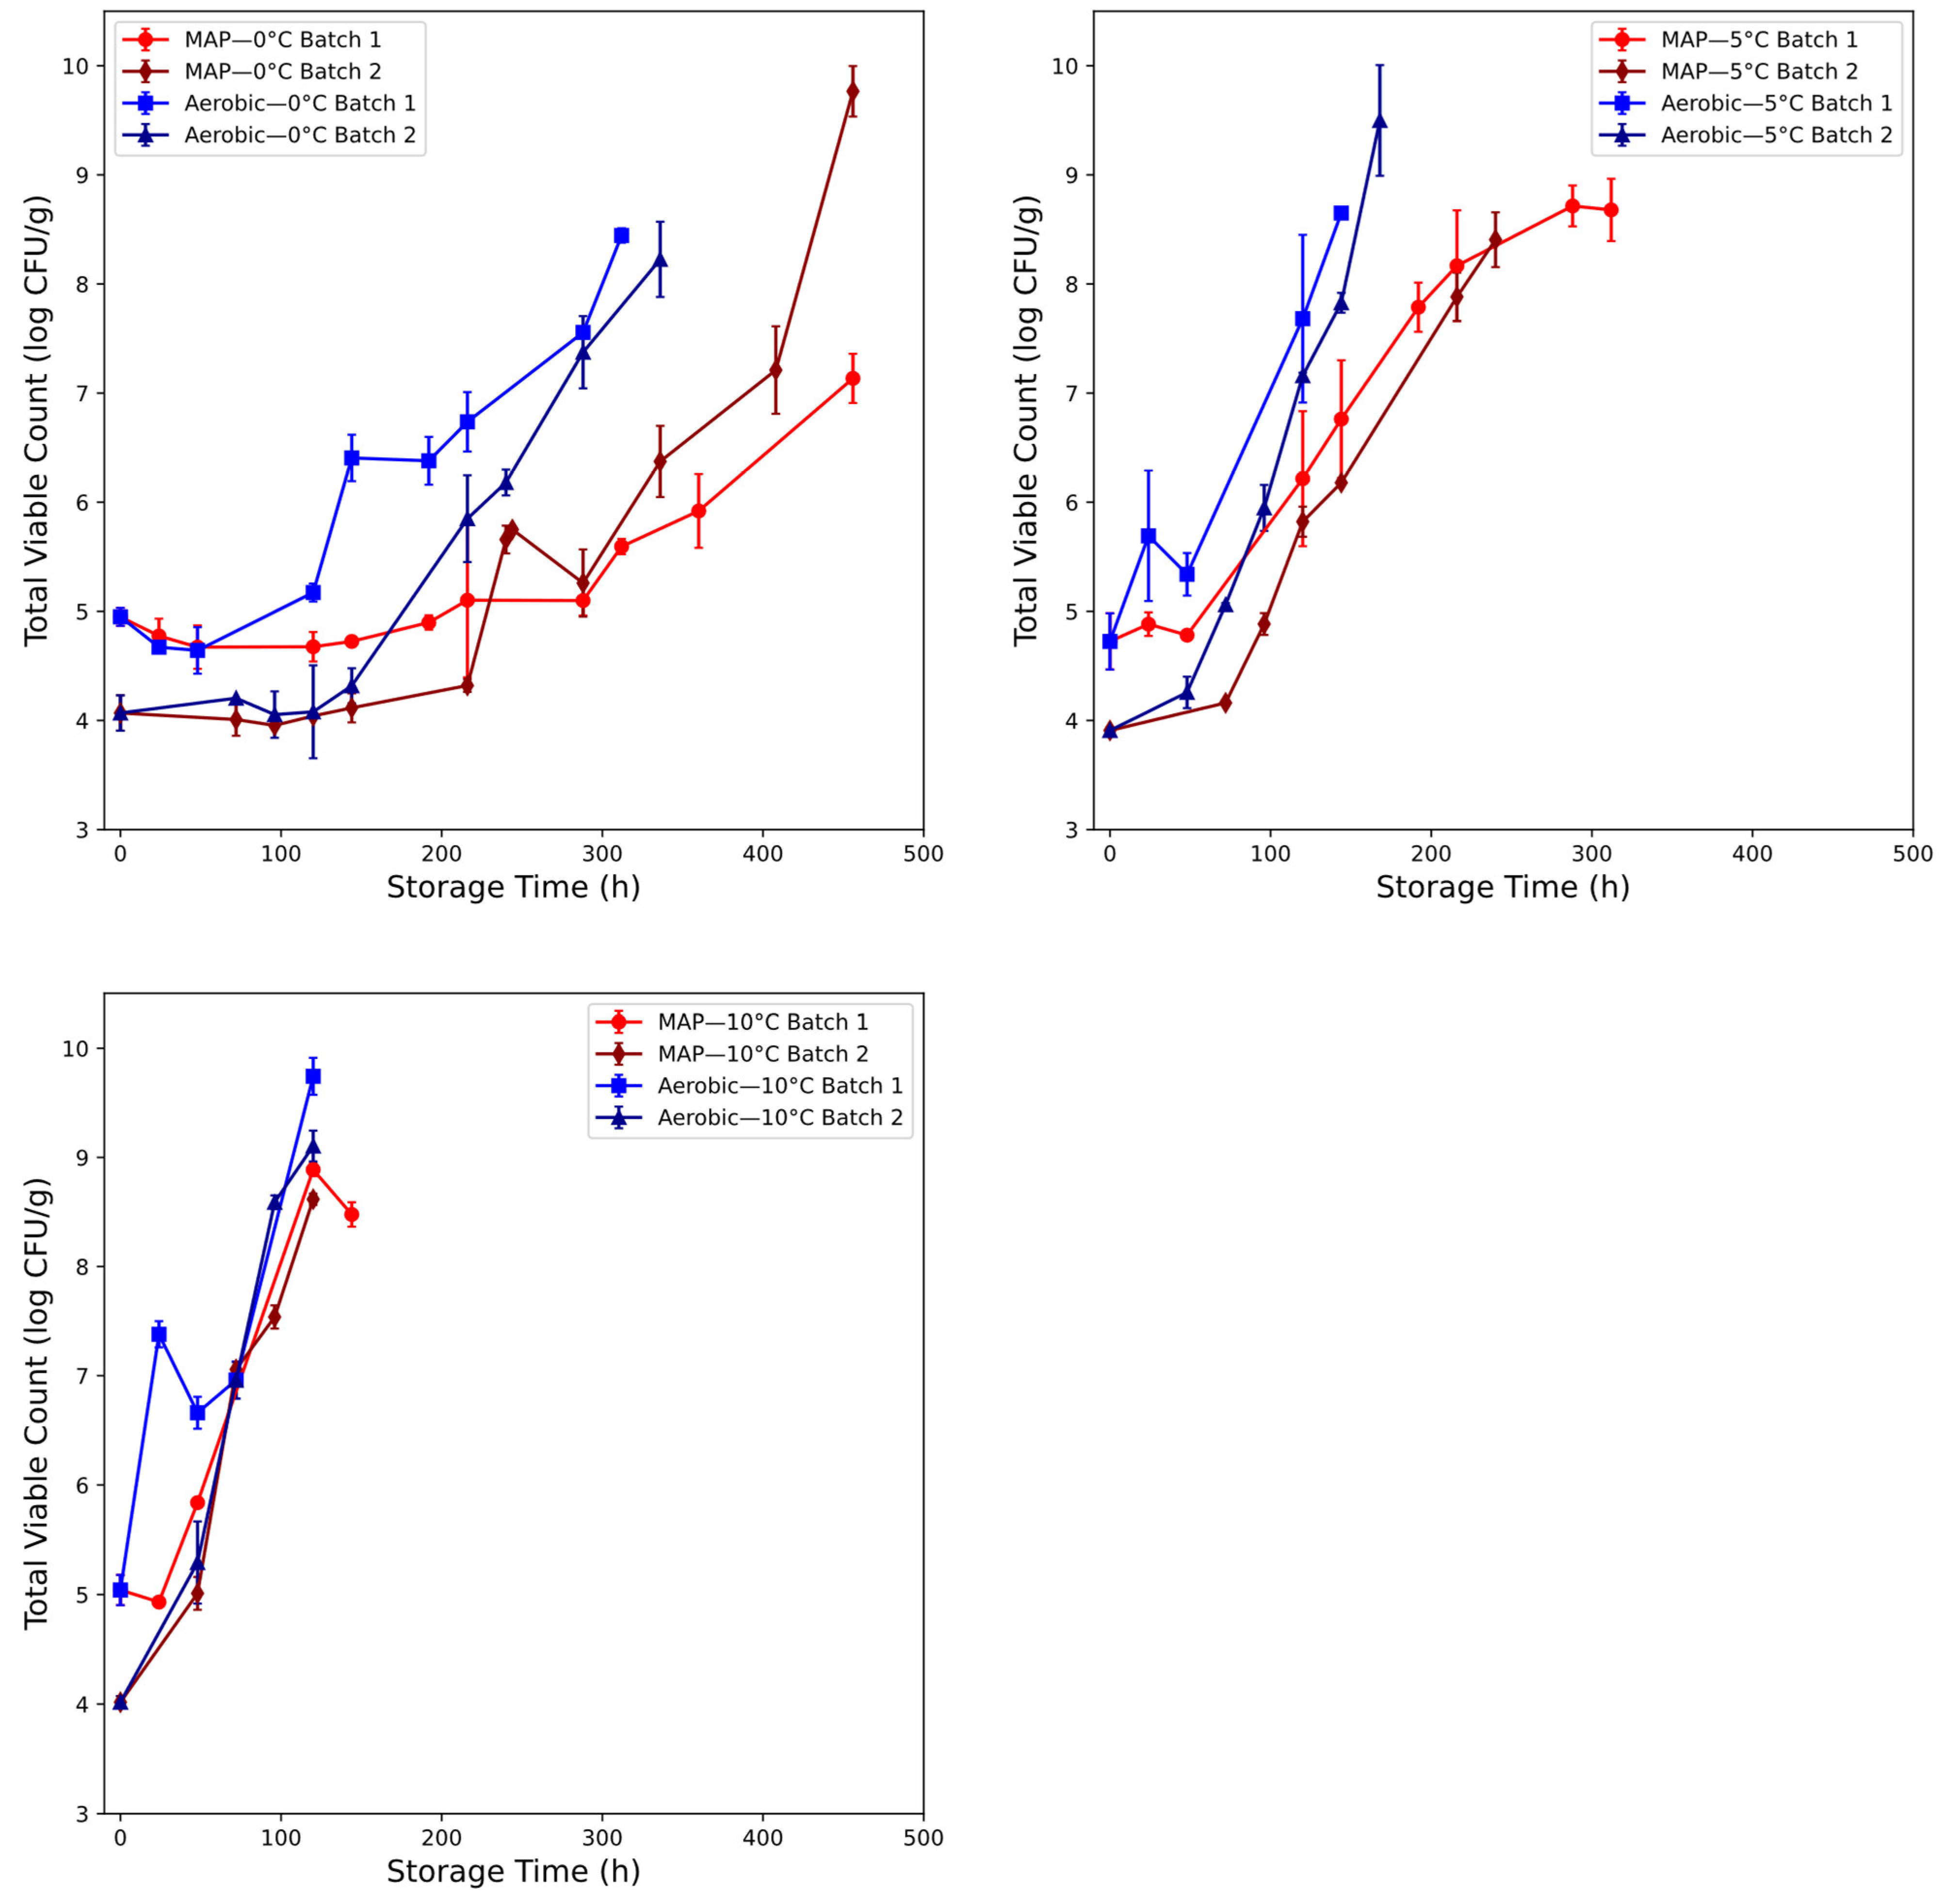
3.2. Microbial Assessment of Beef Spoilage
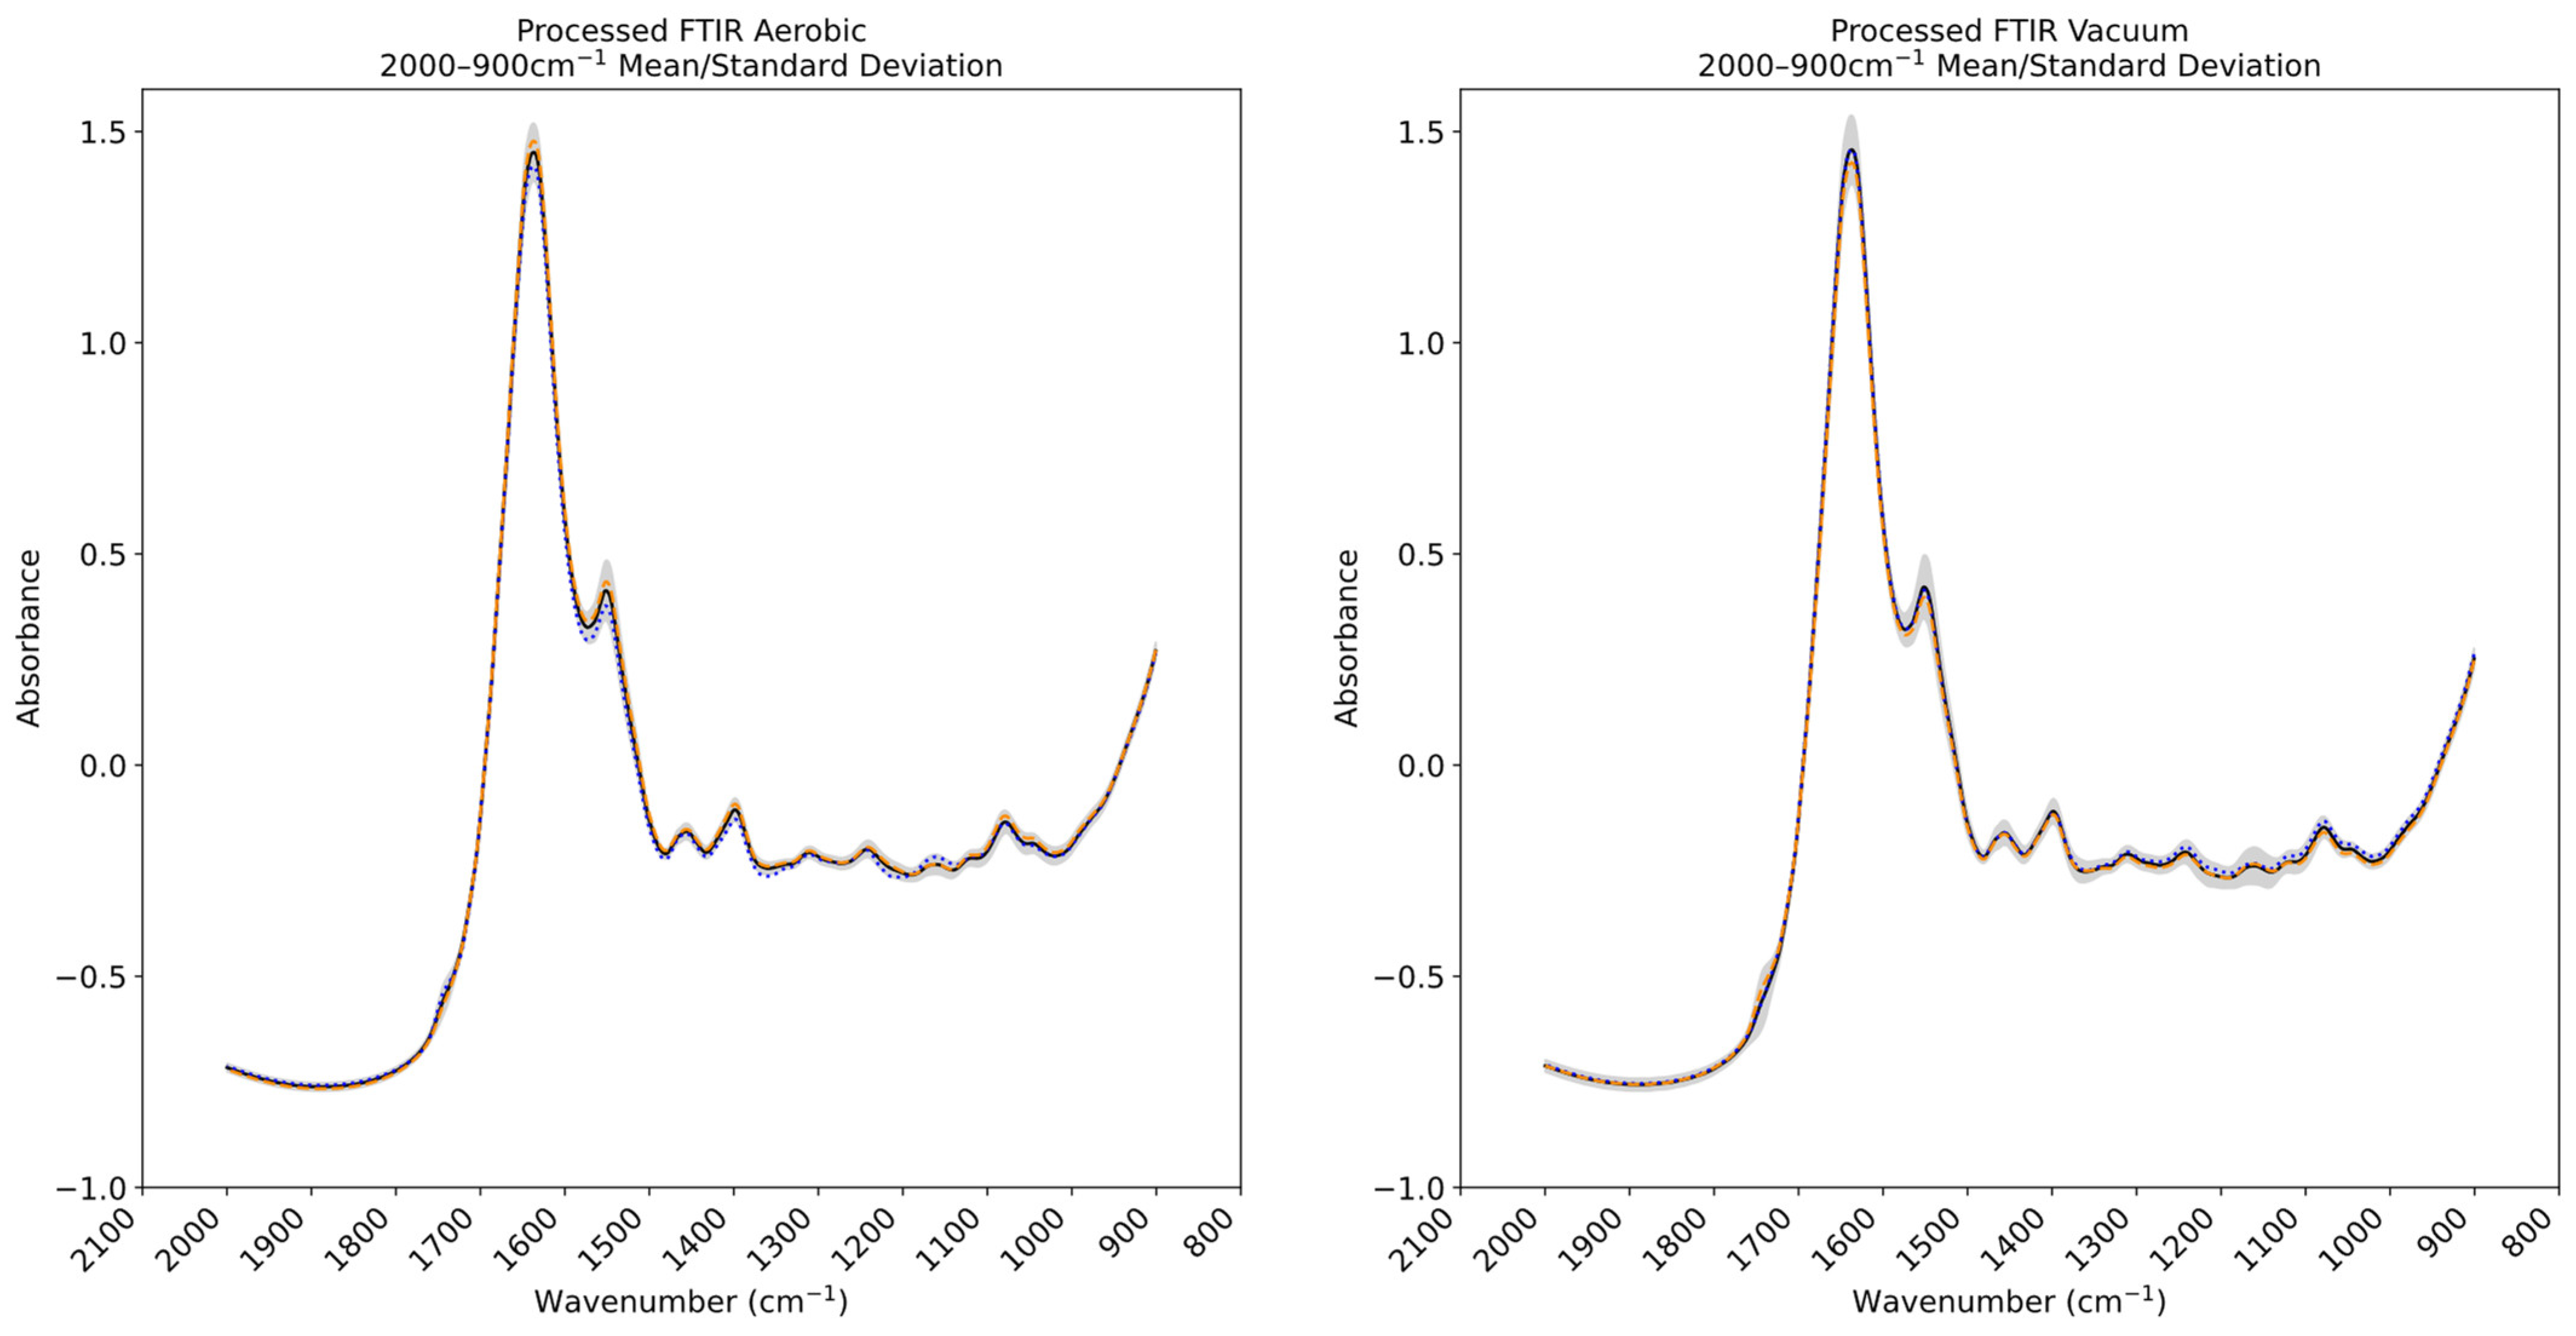
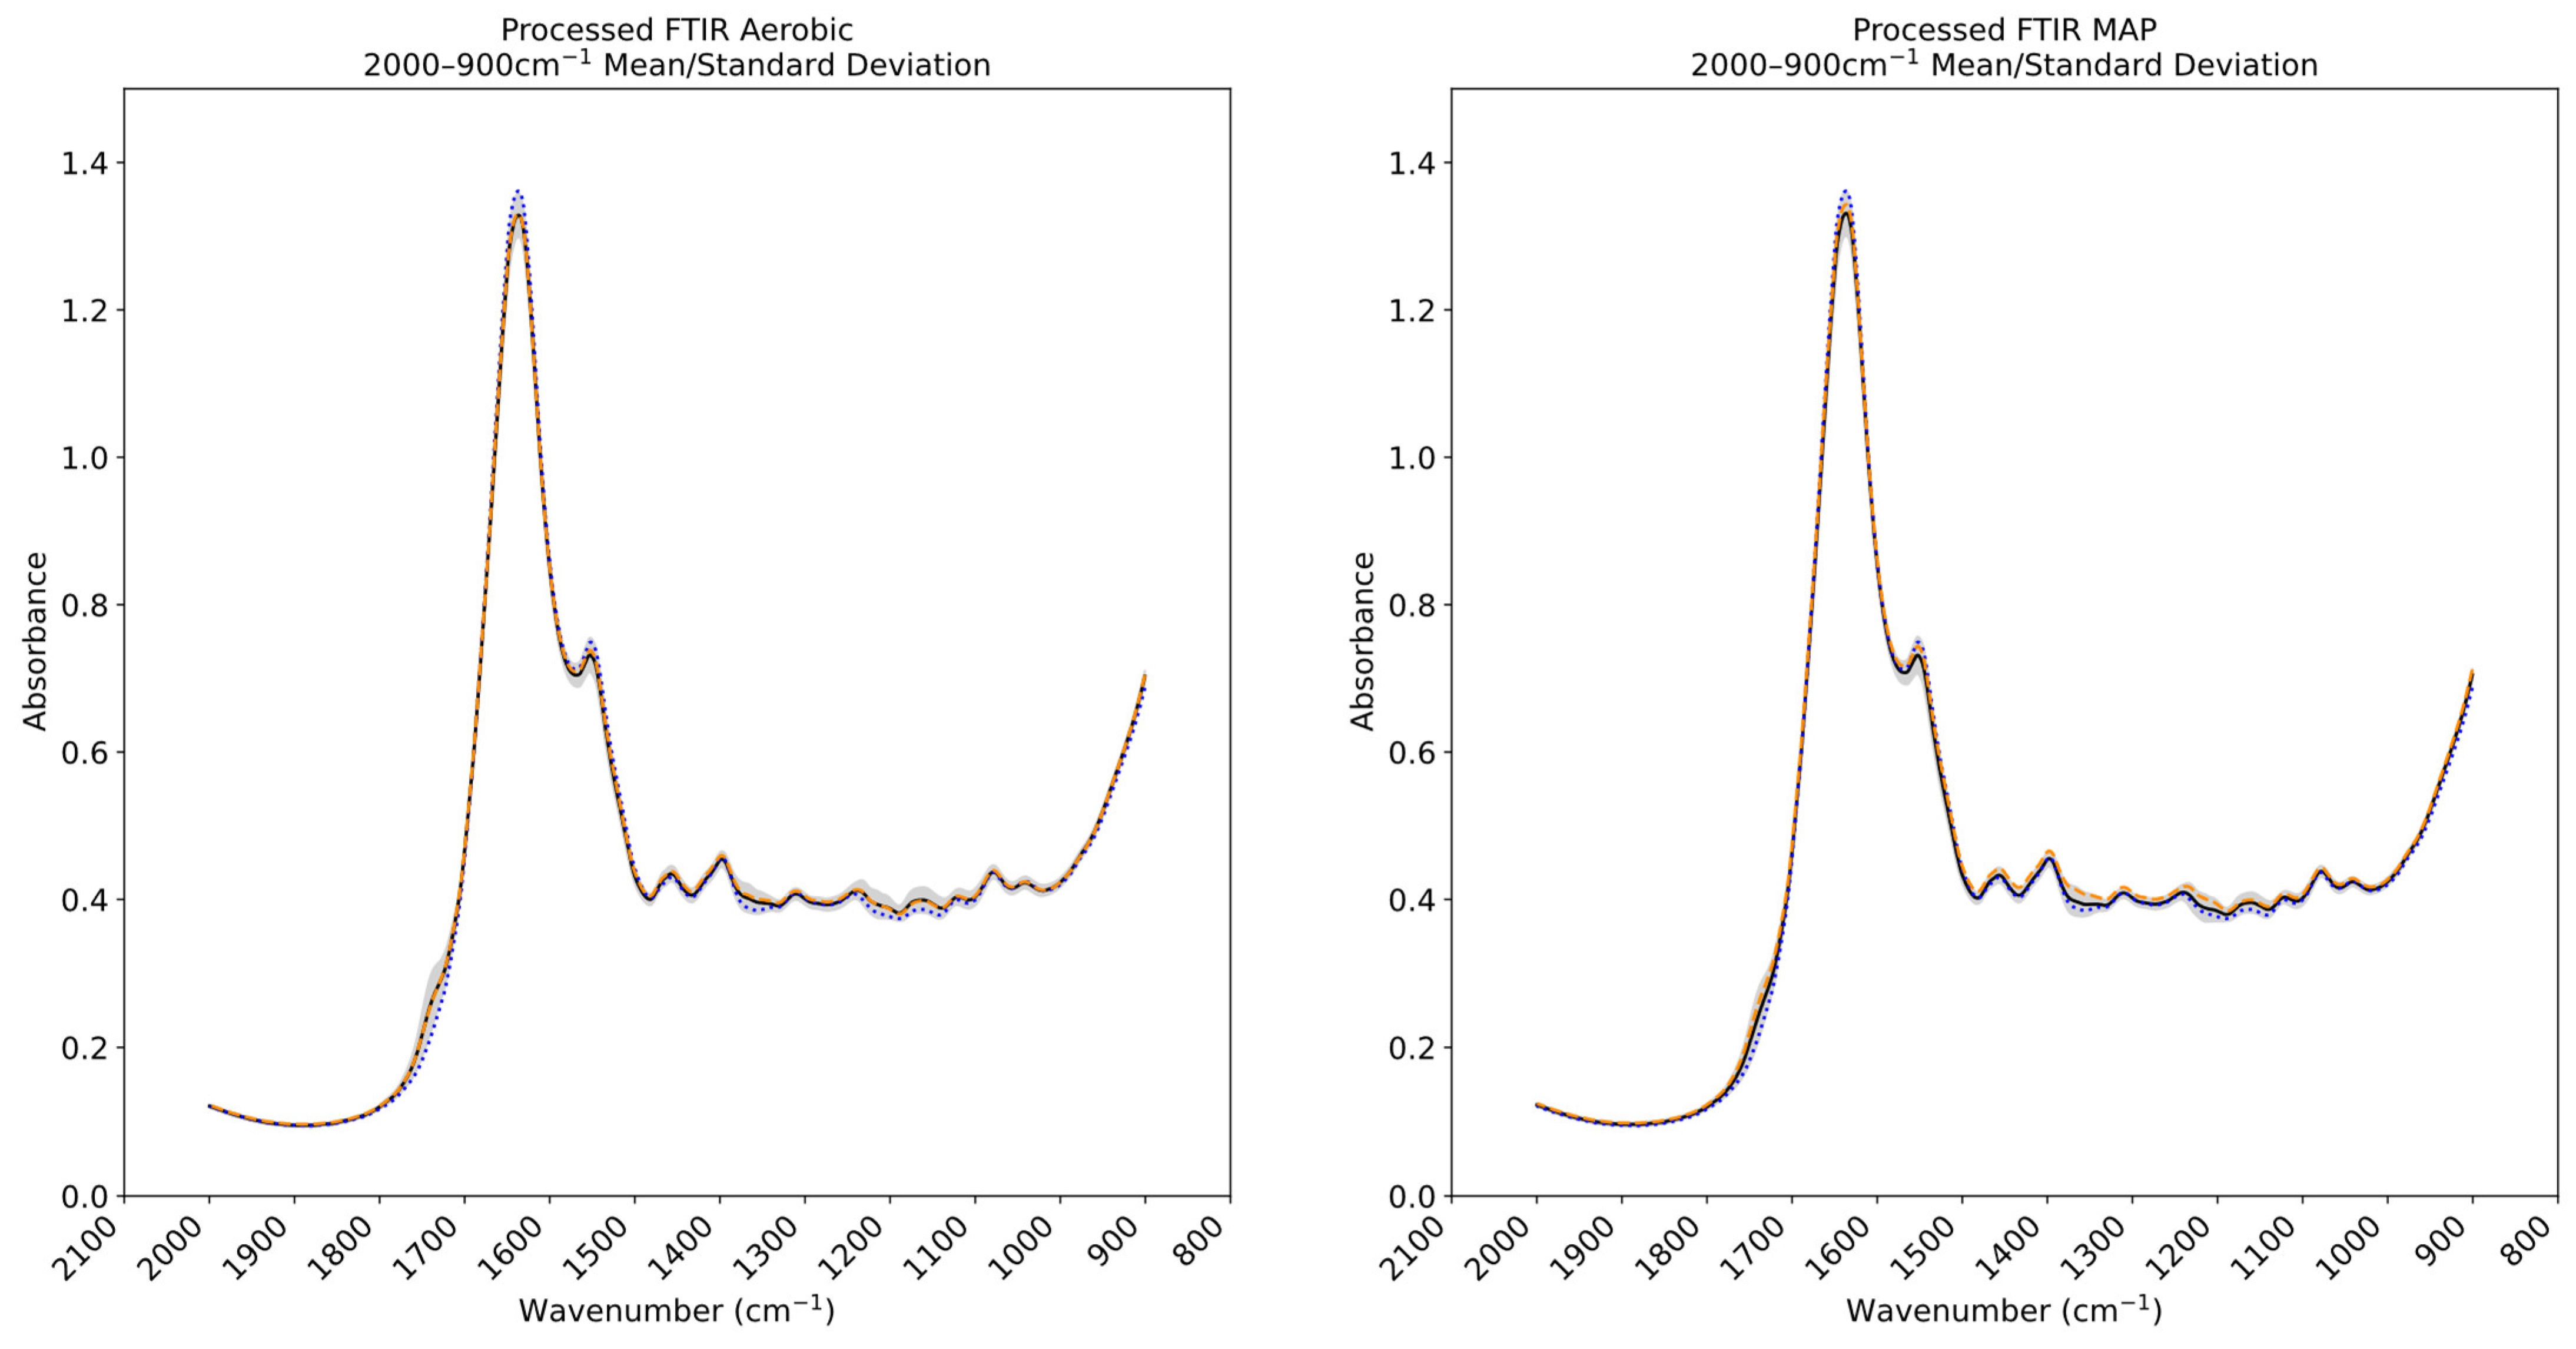
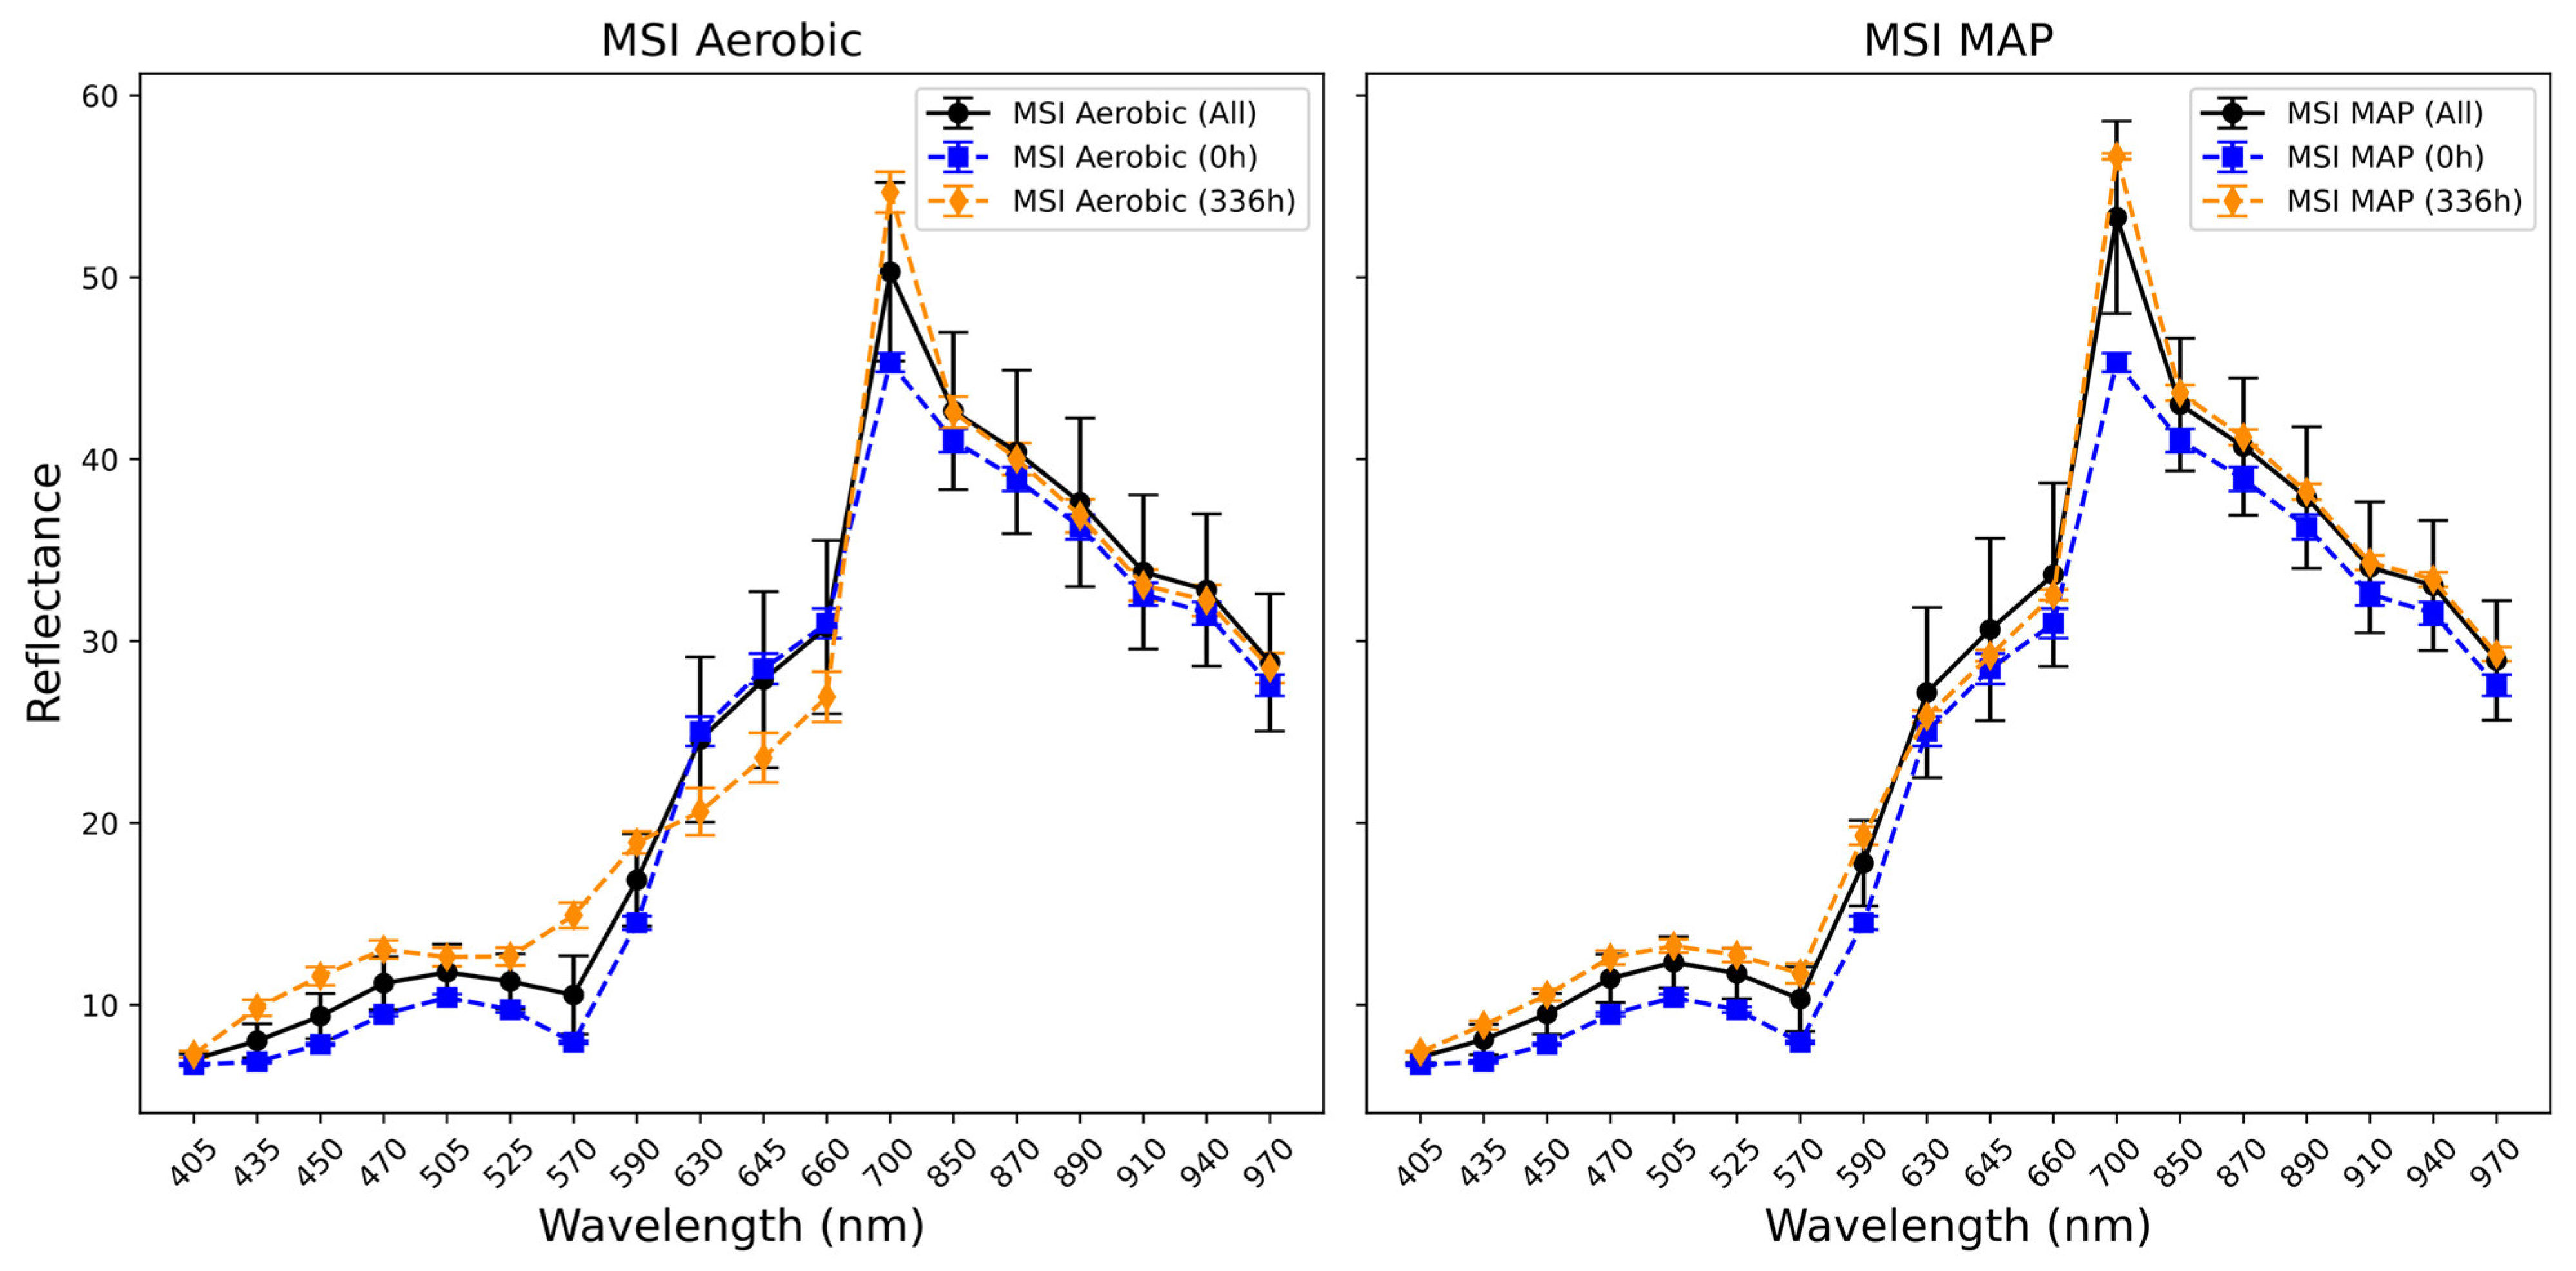
3.3. Fourier Transform Infrared and Multispectral Imaging Measurements of Chicken Thigh and Beef Mince
3.4. Estimation of Microbial Activity in Chicken Thigh Using Machine Learning Analysis
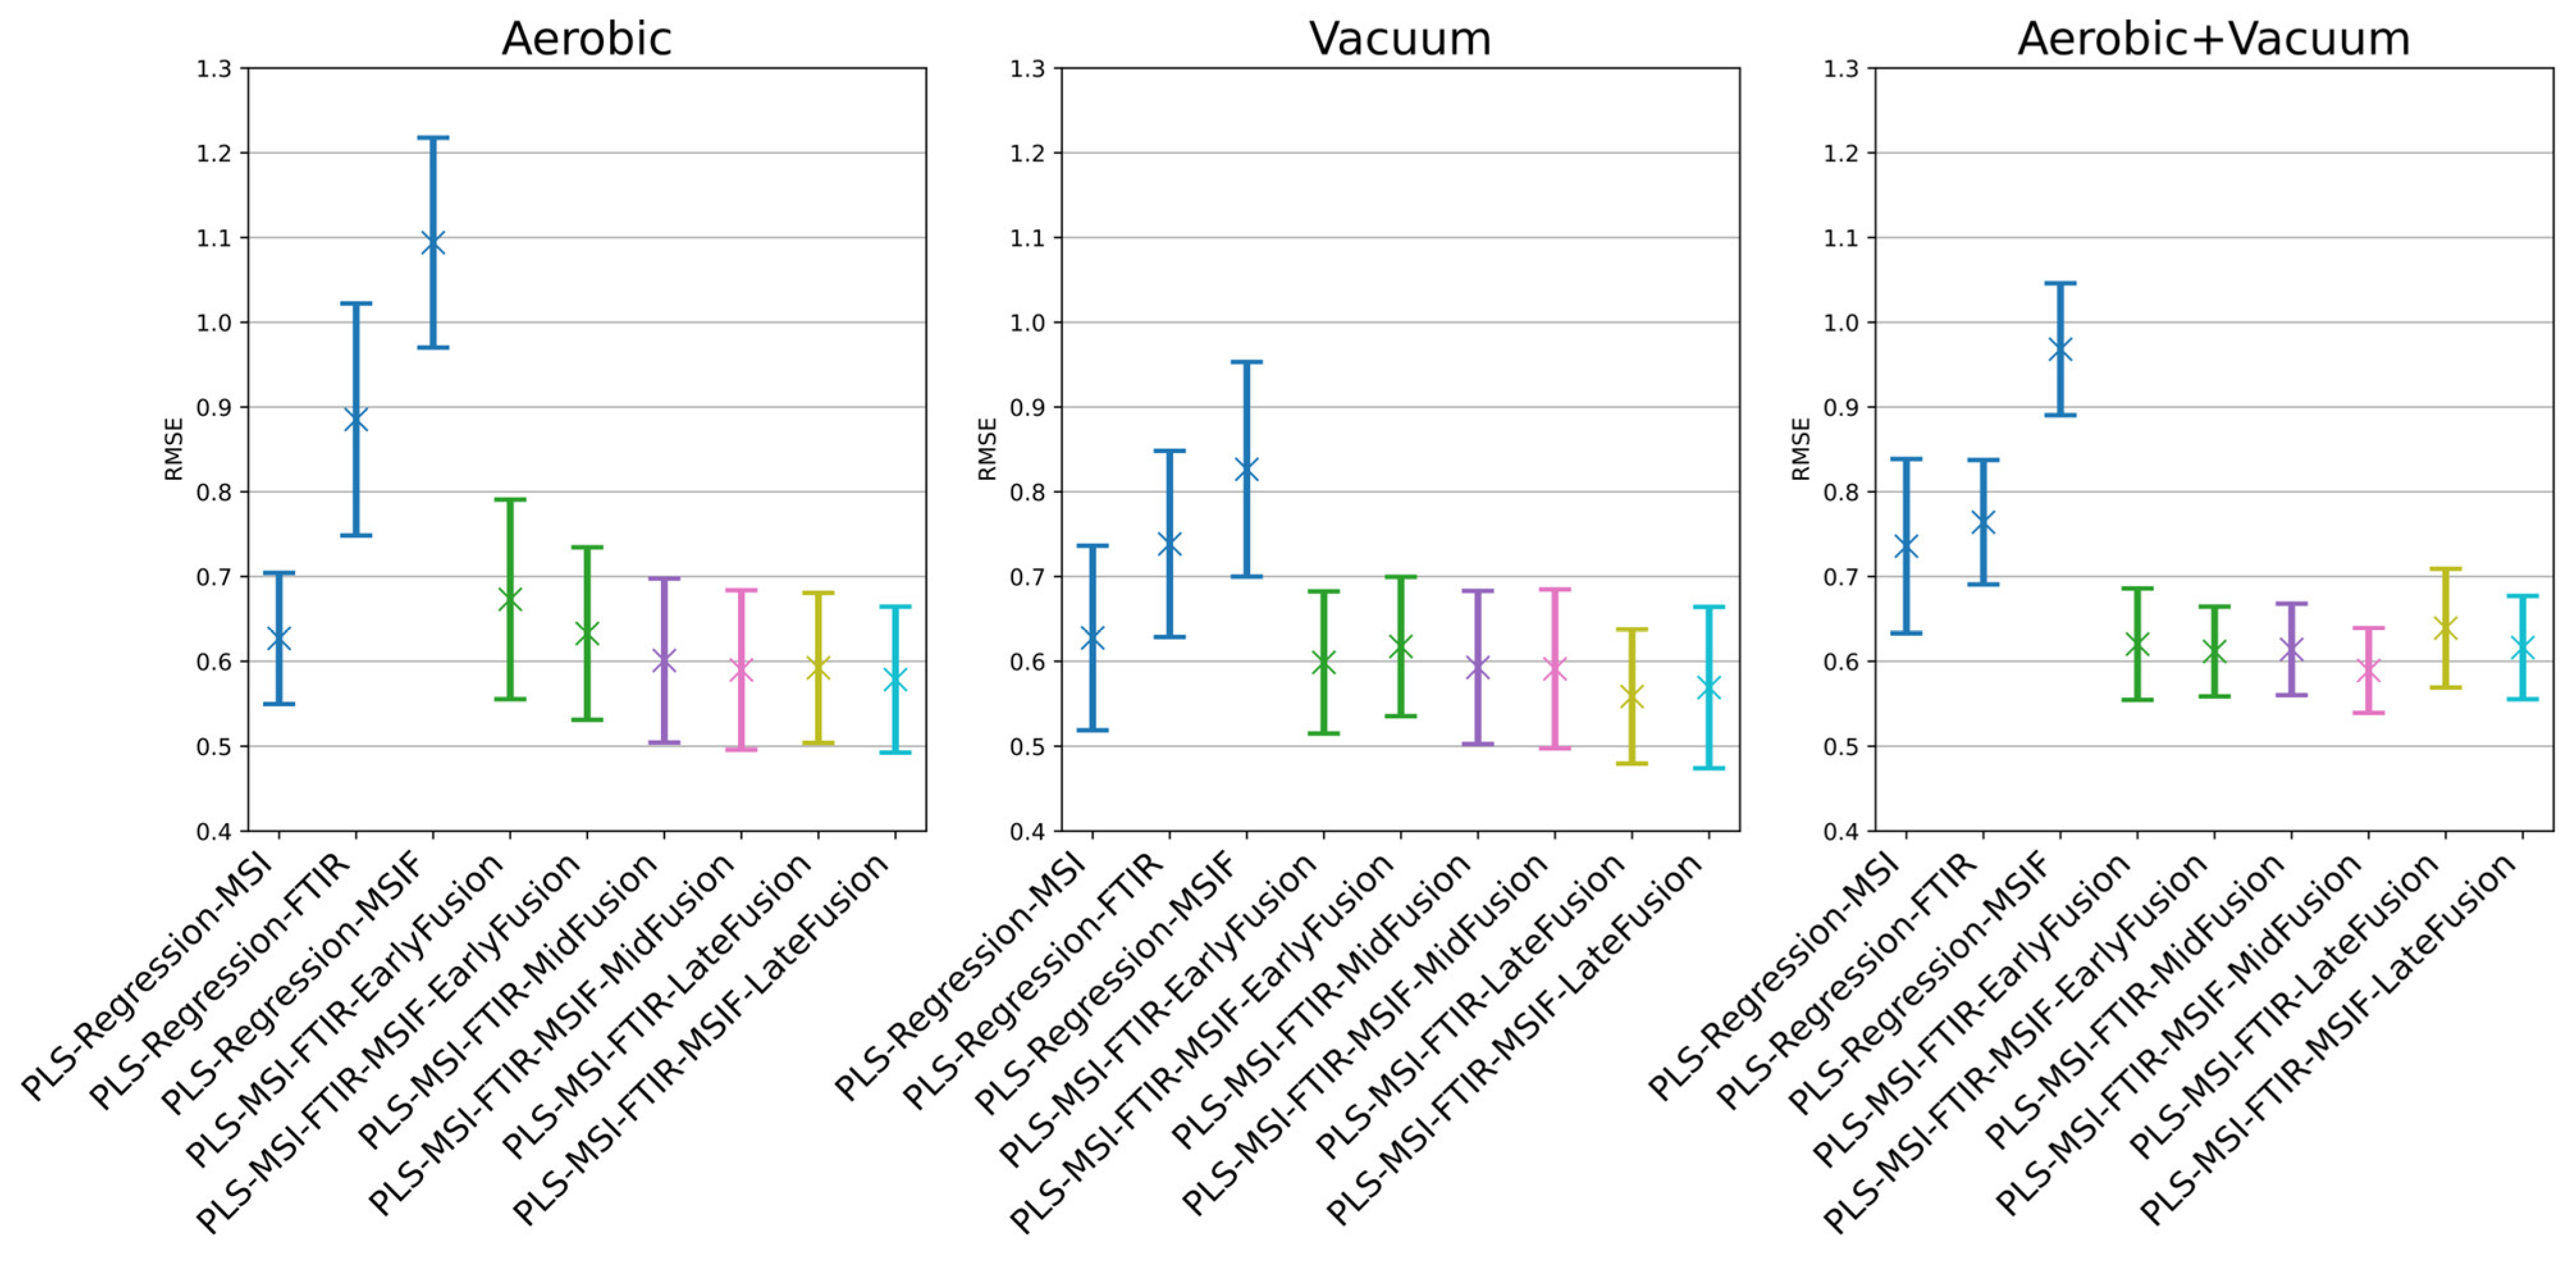
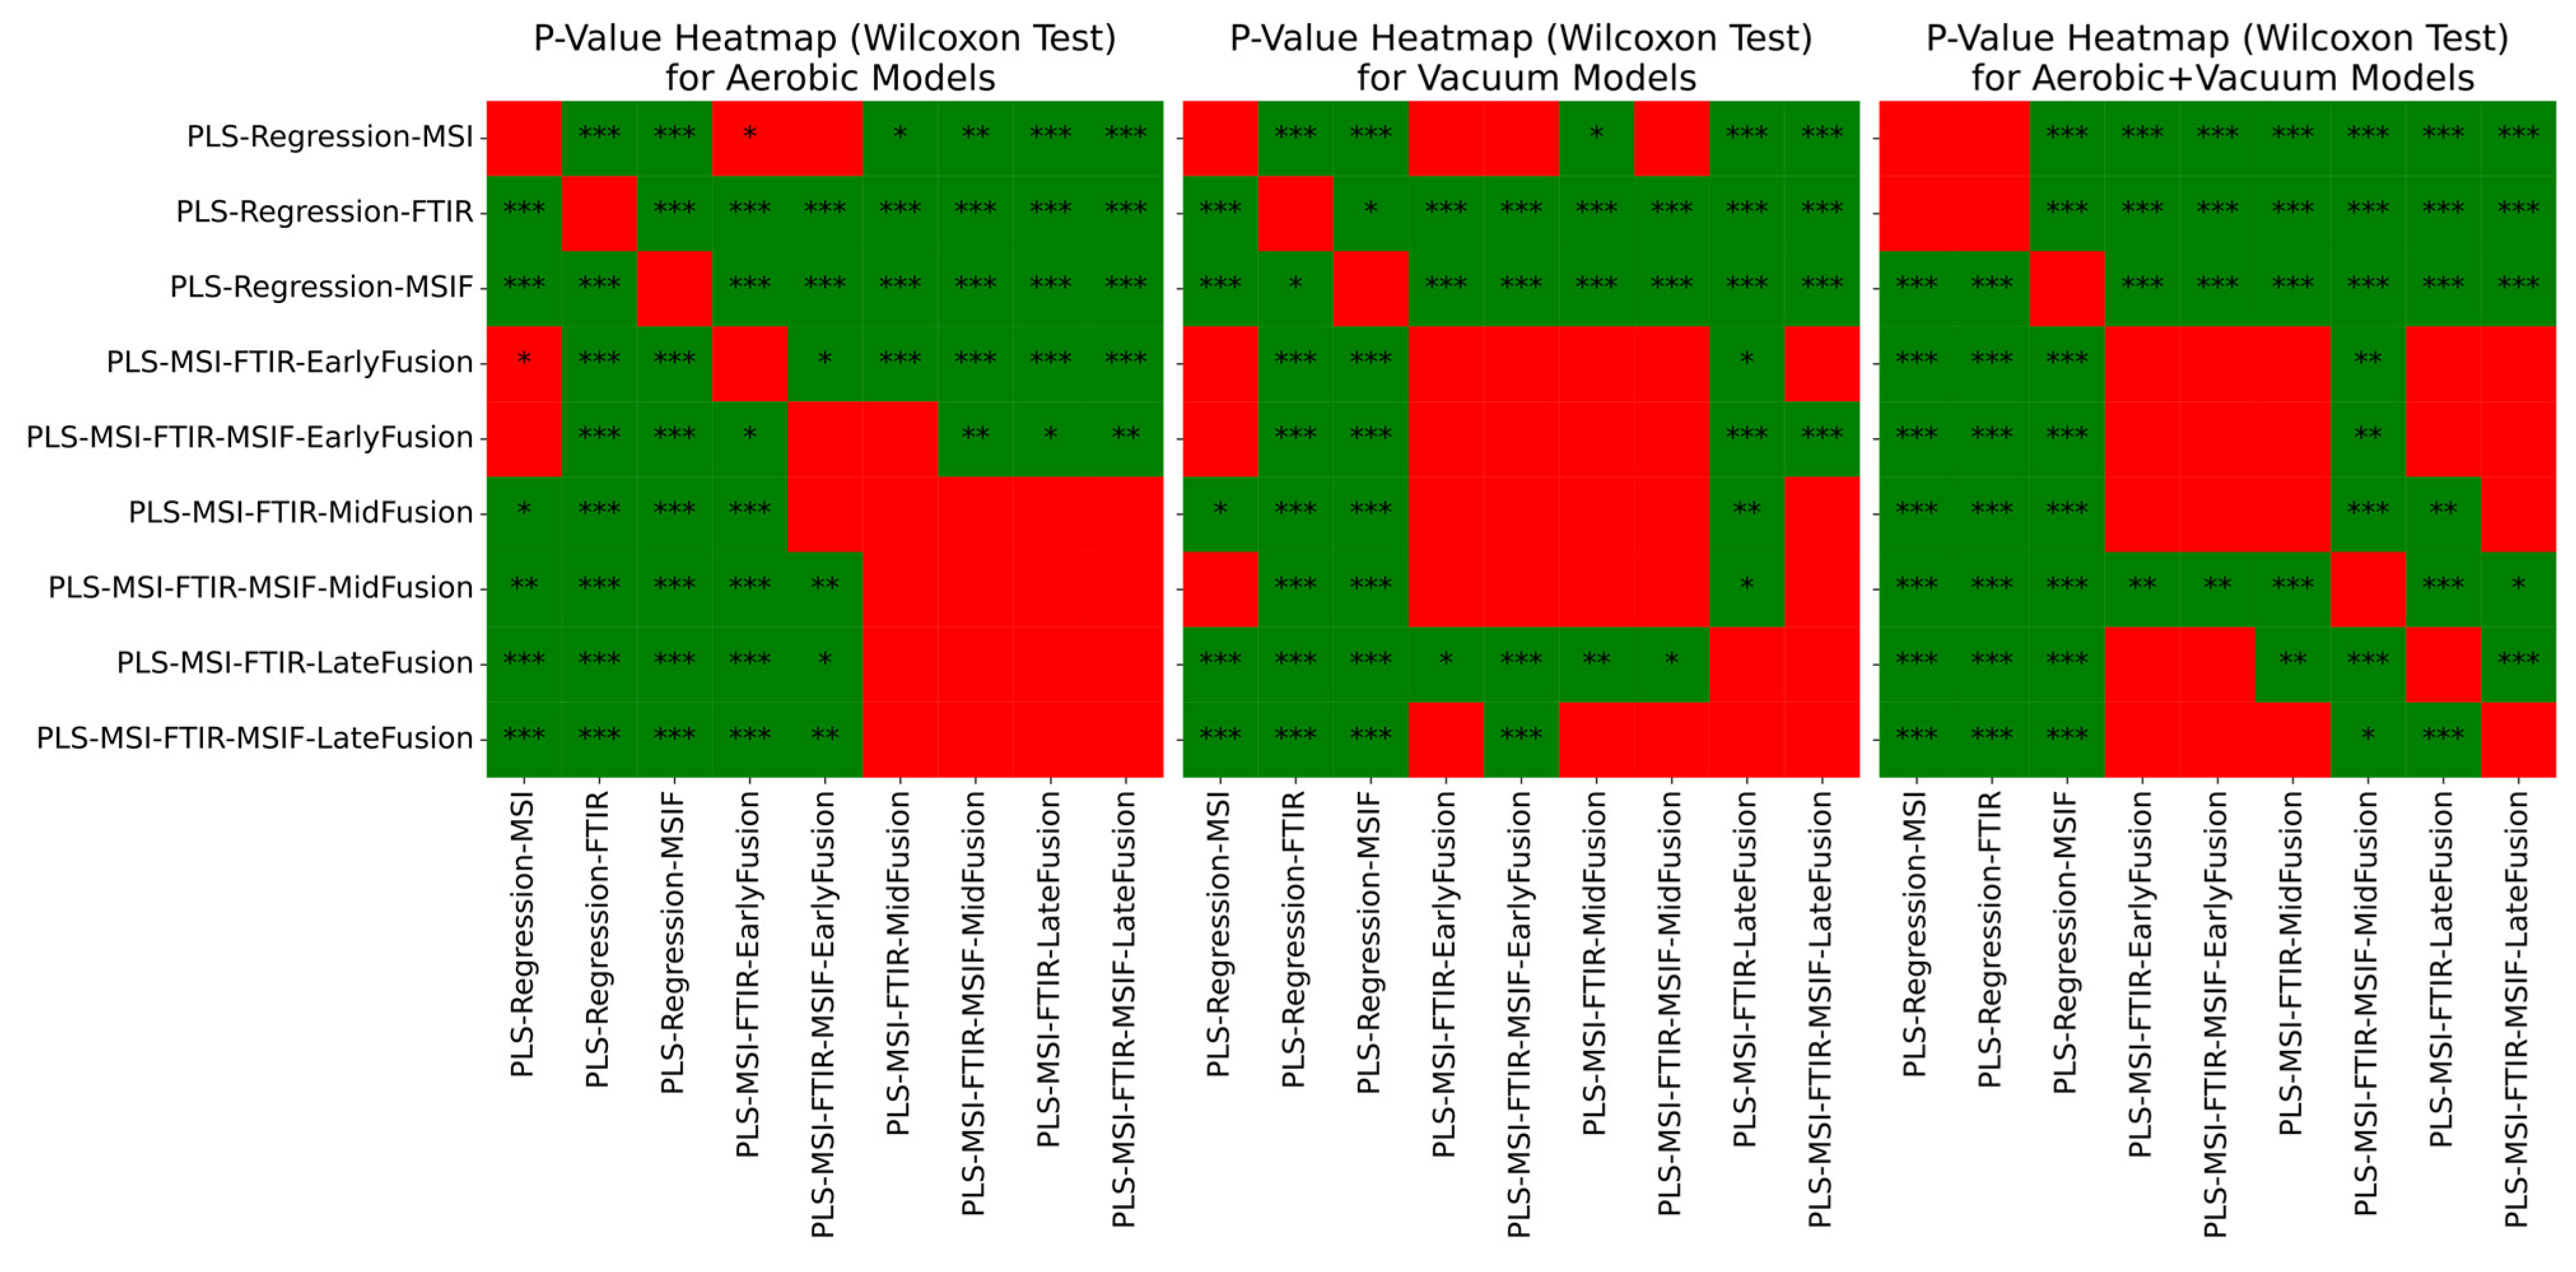
3.5. Estimation of Microbial Activity in Beef Mince Using Machine Learning Analysis
4. Discussion and Conclusions
Supplementary Materials
Author Contributions
Funding
Institutional Review Board Statement
Informed Consent Statement
Data Availability Statement
Conflicts of Interest
Abbreviations
| CFU | Colony Forming Units |
| FTIR | Fourier Transform Infrared |
| MSI(F) | Multispectral Imaging (Fluorescent) |
| PLS | Partial Least Squares |
| RMSE | Root Mean Squared Error |
| SNV | Singular Normal Variate |
| TVC | Total Viable Counts |
References
- USDA. What Is the Most Consumed Meat in the World?—US Department of Agriculture. 2024. Available online: https://ask.usda.gov/s/article/What-is-the-most-consumed-meat-in-the-world (accessed on 11 March 2024).
- Kandeepan, G.; Tahseen, A. Modified Atmosphere Packaging (MAP) of Meat and Meat Products: A Review. J. Packag. Technol. Res. 2022, 6, 137–148. [Google Scholar] [CrossRef]
- Kuzelov, A.; Vasilev, K.; Naseva, D.; Taskov, N.; Dusica, S. Impact of packaging in modiffied atmosphere of sustainability of minced meat products. Bulg. J. Agric. Sci. 2015, 21, 1172–1176. [Google Scholar]
- Nychas, G.-J.; Sims, E.; Tsakanikas, P.; Mohareb, F. Data Science in the Food Industry. Annu. Rev. Biomed. Data Sci. 2021, 4, 341–367. [Google Scholar] [CrossRef]
- United Nations. Food Loss and Waste Reduction. 2023. Available online: https://www.un.org/en/observances/end-food-waste-day (accessed on 9 April 2024).
- Commission Regulation (EC) No 2073/2005 of 15th November 2005 on Microbiological Criteria for Foodstuffs. 2005. Available online: https://op.europa.eu/publication-detail/-/publication/8264401a-68a2-11ea-b735-01aa75ed71a1 (accessed on 1 February 2025).
- Nychas, G.-J.E.; Panagou, E.Z.; Mohareb, F. Novel approaches for food safety management and communication. Curr. Opin. Food Sci. 2016, 12, 13–20. [Google Scholar] [CrossRef]
- Rodrigues, S.S.Q.; Dias, L.G.; Teixeira, A. Emerging Methods for the Evaluation of Sensory Quality of Food: Technology at Service. Curr. Food Sci. Technol. Rep. 2024, 2, 77–90. [Google Scholar] [CrossRef]
- Stelmach, A.; Cwiek-Ludwicka, K. Organoleptic analysis of food packaging. Rocz. Panstw. Zakl. Hig. 2006, 57, 355–360. [Google Scholar]
- Cozzolino, D. Sensors for the Food Industry: An Introduction; The Royal Society of Chemistry: London, UK, 2022. [Google Scholar] [CrossRef]
- Yousefi, H.; Su, H.-M.; Imani, S.M.; Alkhaldi, K.; MFilipe, C.D.; Didar, T.F. Intelligent Food Packaging: A Review of Smart Sensing Technologies for Monitoring Food Quality. ACS Sens. 2019, 4, 808–821. [Google Scholar] [CrossRef]
- Rahman, U.U.; Sahar, A.; Pasha, I.; Rahman, S.U.; Ishaq, A. Assessing the capability of Fourier transform infrared spectroscopy in tandem with chemometric analysis for predicting poultry meat spoilage. PeerJ 2018, 6, e5376. [Google Scholar] [CrossRef]
- Böcker, U.; Ofstad, R.; Wu, Z.; Bertram, H.C.; Sockalingum, G.D.; Manfait, M.; Egelandsdal, B.; Kohler, A. Revealing covariance structures in fourier transform infrared and Raman microspectroscopy spectra: A study on pork muscle fiber tissue subjected to different processing parameters. Appl. Spectrosc. 2007, 61, 1032–1039. [Google Scholar] [CrossRef]
- Spyrelli, E.D.; Ozcan, O.; Mohareb, F.; Panagou, E.Z.; Nychas, G.-J.E. Spoilage assessment of chicken breast fillets by means of fourier transform infrared spectroscopy and multispectral image analysis. Curr. Res. Food Sci. 2021, 4, 121–131. [Google Scholar] [CrossRef]
- Spyrelli, E.D.; Doulgeraki, A.I.; Argyri, A.A.; Tassou, C.C.; Panagou, E.Z.; Nychas, G.-J.E. Implementation of Multispectral Imaging (MSI) for Microbiological Quality Assessment of Poultry Products. Microorganisms 2020, 8, 552. [Google Scholar] [CrossRef]
- Yang, B.; Qi, L.; Wang, M.; Hussain, S.; Wang, H.; Wang, B.; Ning, J. Cross-Category Tea Polyphenols Evaluation Model Based on Feature Fusion of Electronic Nose and Hyperspectral Imagery. Sensors 2020, 20, 50. [Google Scholar] [CrossRef]
- Smolinska, A.; Engel, J.; Szymanska, E.; Buydens, L.; Blanchet, L. General Framing of Low-, Mid-, and High-Level Data Fusion with Examples in the Life Sciences. Data Handl. Sci. Technol. 2019, 31, 51–79. [Google Scholar] [CrossRef]
- Wolpert, D.H. Stacked generalization. Neural Netw. 1992, 5, 241–259. [Google Scholar] [CrossRef]
- Naimi, A.I.; Balzer, L.B. Stacked Generalization: An Introduction to Super Learning. Eur. J. Epidemiol. 2018, 33, 459–464. [Google Scholar] [CrossRef] [PubMed]
- Borràs, E.; Ferré, J.; Boqué, R.; Mestres, M.; Aceña, L.; Busto, O. Data fusion methodologies for food and beverage authentication and quality assessment—A review. Anal. Chim. Acta 2015, 891, 1–14. [Google Scholar] [CrossRef]
- Fengou, L.-C.; Lytou, A.E.; Tsekos, G.; Tsakanikas, P.; Nychas, G.-J.E. Features in visible and Fourier transform infrared spectra confronting aspects of meat quality and fraud. Food Chem. 2024, 440, 138184. [Google Scholar] [CrossRef] [PubMed]
- Videometer, D. VideometerLab—Multispectral Imaging Technology. 2021. Available online: https://videometer.com/videometerlab/ (accessed on 18 March 2024).
- Fengou, L.-C.; Spyrelli, E.; Lianou, A.; Tsakanikas, P.; Panagou, E.Z.; Nychas, G.-J.E. Estimation of Minced Pork Microbiological Spoilage through Fourier Transform Infrared and Visible Spectroscopy and Multispectral Vision Technology. Foods 2019, 8, 238. [Google Scholar] [CrossRef]
- Argyri, A.A.; Panagou, E.Z.; Tarantilis, P.A.; Polysiou, M.; Nychas, G.-J.E. Rapid qualitative and quantitative detection of beef fillets spoilage based on Fourier transform infrared spectroscopy data and artificial neural networks. Sens. Actuators B Chem. 2010, 145, 146–154. [Google Scholar] [CrossRef]
- Barnes, R.J.; Dhanoa, M.S.; Lister, S.J. Standard Normal Variate Transformation and De-Trending of Near-Infrared Diffuse Reflectance Spectra. Appl. Spectrosc. 1989, 43, 772–777. [Google Scholar] [CrossRef]
- Ropodi, A.I.; Pavlidis, D.E.; Mohareb, F.; Panagou, E.Z.; Nychas, G.-J.E. Multispectral image analysis approach to detect adulteration of beef and pork in raw meats. Food Res. Int. 2015, 67, 12–18. [Google Scholar] [CrossRef]
- Argyri, A.A.; Jarvis, R.M.; Wedge, D.; Xu, Y.; Panagou, E.Z.; Goodacre, R.; Nychas, G.-J.E. A comparison of Raman and FT-IR spectroscopy for the prediction of meat spoilage. Food Control. 2013, 29, 461–470. [Google Scholar] [CrossRef]
- Sahar, A.; Dufour, É. Use of Fourier transform-infrared spectroscopy to predict spoilage bacteria on aerobically stored chicken breast fillets. LWT. Food Sci. Technol. 2014, 56, 315–320. [Google Scholar] [CrossRef]
- Cawley, G.C.; Talbot, N. On Over-Fitting in Model Selection and Subsequent Selection Bias in Performance Evaluation—University of East Anglia. 2010. Available online: https://research-portal.uea.ac.uk/en/publications/on-over-fitting-in-model-selection-and-subsequent-selection-bias- (accessed on 24 January 2025).
- Borràs, E.; Ferré, J.; Boqué, R.; Mestres, M.; Aceña, L.; Calvo, A.; Busto, O. Prediction of olive oil sensory descriptors using instrumental data fusion and partial least squares (PLS) regression. Talanta 2016, 155, 116–123. [Google Scholar] [CrossRef]
- Abdi, H. Partial least squares regression and projection on latent structure regression (PLS Regression). WIREs Comput. Stat. 2010, 2, 97–106. [Google Scholar] [CrossRef]
- Fengou, L.-C.; Lianou, A.; Tsakanikas, P.; Gkana, E.N.; Panagou, E.Z.; Nychas, G.-J.E. Evaluation of Fourier transform infrared spectroscopy and multispectral imaging as means of estimating the microbiological spoilage of farmed sea bream. Food Microbiol. 2019, 79, 27–34. [Google Scholar] [CrossRef] [PubMed]
- James, G.; Witten, D.; Hastie, T.; Tibshirani, R. Resampling Methods. In An Introduction to Statistical Learning: With Applications in R; James, G., Witten, D., Hastie, T., Tibshirani, R., Eds.; Springer: New York, NY, USA, 2021; pp. 197–223. [Google Scholar] [CrossRef]
- Bergstra, J.; Bengio, Y. Random Search for Hyper-Parameter Optimization. J. Mach. Learn. Res. 2012, 13, 281–305. [Google Scholar]
- Draper, N.R.; Smith, H. Applied Regression Analysis, 3rd ed.; Wiley and Sons: Hoboken, NJ, USA, 1998; p. 736. Available online: https://www.wiley.com/en-gb/Applied+Regression+Analysis%2C+3rd+Edition-p-9780471170822 (accessed on 25 March 2024).
- van der Laan, M.J.; Polley, E.C.; Hubbard, A.E. Super Learner. Stat. Appl. Genet. Mol. Biol. 2007, 6. [Google Scholar] [CrossRef]
- Rouger, A.; Tresse, O.; Zagorec, M. Bacterial Contaminants of Poultry Meat: Sources, Species, and Dynamics. Microorganisms 2017, 5, 50. [Google Scholar] [CrossRef]
- US Institute of Medicine. Escherichia coli O157:H7 in Ground Beef. In Review of a Draft Risk Assessment; National Academies Press: Washington, DC, USA, 2002. Available online: http://www.ncbi.nlm.nih.gov/books/NBK221098/ (accessed on 8 May 2024).
- Ellis, D.I.; Broadhurst, D.; Kell, D.B.; Rowland, J.J.; Goodacre, R. Rapid and Quantitative Detection of the Microbial Spoilage of Meat by Fourier Transform Infrared Spectroscopy and Machine Learning. Appl. Environ. Microbiol. 2002, 68, 2822–2828. [Google Scholar] [CrossRef]
- Alexandrakis, D.; Downey, G.; Scannell, A.G.M. Rapid Non-destructive Detection of Spoilage of Intact Chicken Breast Muscle Using Near-infrared and Fourier Transform Mid-infrared Spectroscopy and Multivariate Statistics. Food Bioprocess Technol. 2012, 5, 338–347. [Google Scholar] [CrossRef]
- Pu, H.; Kamruzzaman, M.; Sun, D.-W. Selection of feature wavelengths for developing multispectral imaging systems for quality, safety and authenticity of muscle foods—A review. Trends Food Sci. Technol. 2015, 45, 86–104. [Google Scholar] [CrossRef]
- Liu, Y.; Lyon, B.G.; Windham, W.R.; Realini, C.E.; Pringle, T.D.D.; Duckett, S. Prediction of color, texture, and sensory characteristics of beef steaks by visible and near infrared reflectance spectroscopy. A feasibility study☆. Meat Sci. 2003, 65, 1107–1115. [Google Scholar] [CrossRef] [PubMed]
- Holm, S. A Simple Sequentially Rejective Multiple Test Procedure. Scand. J. Stat. 1979, 6, 65–70. [Google Scholar]
- Cheng, J.; Sun, J.; Yao, K.; Xu, M.; Tian, Y.; Dai, C. A decision fusion method based on hyperspectral imaging and electronic nose techniques for moisture content prediction in frozen-thawed pork. LWT 2022, 165, 113778. [Google Scholar] [CrossRef]
- Leardi, R.; Lupiáñez González, A. Genetic algorithms applied to feature selection in PLS regression: How and when to use them. Chemom. Intell. Lab. Syst. 1998, 41, 195–207. [Google Scholar] [CrossRef]


| Partition | |||
|---|---|---|---|
| Chicken Spoilage | Aerobic condition | Vacuum condition | Combined conditions |
| Calibration | 70 | 65 | 135 |
| CV | 70 | 65 | 135 |
| Prediction | 66 | 72 | 138 |
| Repeated Nested CV | 136 | 137 | 273 |
| Beef Spoilage | Aerobic condition | MAP condition | Combined conditions |
| Calibration | 46 | 57 | 103 |
| CV | 46 | 57 | 103 |
| Prediction | 46 | 56 | 102 |
| Repeated Nested CV | 92 | 113 | 205 |
| Model | Range |
|---|---|
| Single-Sensor Models and Mid-/Late Fusion Base Models | |
| MSI—pls__n_components | 2–17 |
| FTIR—pls__n_components | 2–20 |
| MSIF—pls__n_components | 2–7 |
| Early Fusion Models | |
| pls__n_components | 2–20 |
| Mid Fusion Models | |
| pls__n_components | 2–17 |
| Model | LOOCV Performance | Aerobic Performance | Vacuum Performance | ||||||
|---|---|---|---|---|---|---|---|---|---|
| RMSEcv (SD) | LVs (Meta LVs) | RMSEp | Acc % | R2 | RMSEp | Acc % | R2 | ||
| MSI | Aerobic | 0.6779 (0.1664) | 9 | 0.6147 | 86.3636 | 0.8604 | 1.4145 | 56.9444 | −0.1725 |
| Vacuum | 0.5199 (0.1702) | 4 | 0.8956 | 75.7576 | 0.7037 | 0.7933 | 75 | 0.6312 | |
| A + V | 0.6928 (0.1311) | 6 | 0.7311 | 81.8182 | 0.8025 | 0.809 | 72.2222 | 0.6165 | |
| MSIF | Aerobic | 0.8329 (0.2677) | 3 | 2.2473 | 30.303 | −0.8655 | 1.7561 | 41.6667 | −0.8073 |
| Vacuum | 0.7304 (0.3058) | 5 | 1.6805 | 42.4242 | −0.0432 | 1.0976 | 63.8889 | 0.2941 | |
| A + V | 0.8333 (0.1779) | 6 | 1.5469 | 42.4242 | 0.1161 | 0.9222 | 70.8333 | 0.5016 | |
| FTIR | Aerobic | 0.8936 (0.2631) | 6 | 1.604 | 53.0303 | 0.0496 | 1.7679 | 50 | −0.8315 |
| Vacuum | 0.6321 (0.1211) | 6 | 1.4657 | 56.0606 | 0.2064 | 1.2924 | 62.5 | 0.0212 | |
| A + V | 0.8764 (0.1789) | 7 | 1.131 | 63.6364 | 0.5275 | 1.0304 | 68.0556 | 0.3779 | |
| MSI +FTIR | Late (Decision) Fusion | ||||||||
| Aerobic | 0.6421 (0.2086) | 9,6 | 0.5466 | 93.9394 | 0.8896 | 1.3863 | 52.7778 | −0.1263 | |
| Vacuum | 0.4829 (0.1616) | 4,6 | 0.9821 | 63.6364 | 0.6437 | 0.6971 | 81.9444 | 0.7152 | |
| A + V | 0.6314 (0.1126) | 6,7 | 0.6779 | 84.8485 | 0.8302 | 0.6959 | 84.7222 | 0.7162 | |
| Mid- (Feature) Fusion | |||||||||
| Aerobic | 0.6483 (0.1857) | 9,6 (6) | 0.5607 | 93.9394 | 0.8838 | 1.3778 | 56.9444 | −0.1124 | |
| Vacuum | 0.4753 (0.1293) | 4,7 (5) | 0.9415 | 66.6667 | 0.6725 | 0.6638 | 84.7222 | 0.7418 | |
| A + V | 0.6049 (0.1400) | 6,7 (6) | 0.6782 | 89.3939 | 0.8301 | 0.752 | 87.5 | 0.6686 | |
| Early Fusion | |||||||||
| Aerobic | 0.8334 (0.2347) | 6 | 1.2906 | 72.7273 | 0.3847 | 1.7791 | 44.4444 | −0.8548 | |
| Vacuum | 0.5429 (0.1905) | 7 | 1.3672 | 53.0303 | 0.3094 | 1.2745 | 69.4444 | 0.0481 | |
| A + V | 0.7672 (0.1736) | 6 | 1.1962 | 66.6667 | 0.4713 | 1.2714 | 58.3333 | 0.0527 | |
| MSI +FTIR +MSIF | Late (Decision) Fusion | ||||||||
| Aerobic | 0.6399 (0.1930) | 9,6,3 | 0.6533 | 87.8788 | 0.8424 | 0.994 | 69.4444 | 0.421 | |
| Vacuum | 0.4997 (0.1603) | 4,6,5 | 0.9978 | 63.6364 | 0.6323 | 0.6918 | 83.3333 | 0.7195 | |
| A + V | 0.5943 (0.1210) | 6,7,6 | 0.7611 | 80.303 | 0.786 | 0.652 | 84.7222 | 0.7509 | |
| Mid- (Feature) Fusion | |||||||||
| Aerobic | 0.6269 (0.1938) | 9,6,3 (6) | 0.5907 | 90.9091 | 0.8711 | 1.0228 | 65.2778 | 0.387 | |
| Vacuum | 0.5026 (0.1956) | 4,6,5 (5) | 1.0467 | 62.1212 | 0.5952 | 0.701 | 83.3333 | 0.712 | |
| A + V | 0.5748 (0.1300) | 6,7,6 (5) | 0.7818 | 75.7576 | 0.7742 | 0.7544 | 80.5556 | 0.6665 | |
| Early Fusion | |||||||||
| Aerobic | 0.7731 (0.2164) | 6 | 1.0802 | 72.7273 | 0.569 | 1.6575 | 44.4444 | −0.6099 | |
| Vacuum | 0.5472 (0.2002) | 7 | 1.3565 | 45.4545 | 0.3203 | 1.2171 | 70.8333 | 0.132 | |
| A + V | 0.6884 (0.1774) | 6 | 1.1749 | 63.6364 | 0.4901 | 1.0544 | 63.8889 | 0.3486 | |
| Model | RMSE Mean | RMSE SD | Acc % Mean | Acc % SD | R2 Mean | R2 SD |
|---|---|---|---|---|---|---|
| Aerobic Models | ||||||
| PLS-Regression-MSI | 0.6270 | 0.0766 | 89.4921 | 5.5495 | 0.8313 | 0.0426 |
| PLS-Regression-FTIR | 0.8853 | 0.1355 | 75.4497 | 8.1551 | 0.6548 | 0.1428 |
| PLS-Regression-MSIF | 1.0940 | 0.1226 | 61.1323 | 8.1930 | 0.4876 | 0.1170 |
| PLS-MSI-FTIR-EarlyFusion | 0.6731 | 0.1165 | 86.3942 | 6.6007 | 0.8013 | 0.0757 |
| PLS-MSI-FTIR-MSIF-EarlyFusion | 0.6328 | 0.1007 | 88.5344 | 6.4148 | 0.8251 | 0.0590 |
| PLS-MSI-FTIR-MidFusion | 0.6010 | 0.0956 | 90.4233 | 6.0550 | 0.8432 | 0.0538 |
| PLS-MSI-FTIR-MSIF-MidFusion | 0.5899 | 0.0930 | 90.0026 | 5.7044 | 0.8494 | 0.0504 |
| PLS-MSI-FTIR-LateFusion | 0.5923 | 0.0875 | 91.6270 | 5.3435 | 0.8485 | 0.0479 |
| PLS-MSI-FTIR-MSIF-LateFusion | 0.5785 | 0.0851 | 91.7619 | 4.7053 | 0.8554 | 0.0471 |
| Vacuum Models | ||||||
| PLS-Regression-MSI | 0.6276 | 0.1076 | 89.1217 | 6.4258 | 0.7432 | 0.1014 |
| PLS-Regression-FTIR | 0.7385 | 0.1087 | 84.9841 | 5.0404 | 0.6475 | 0.1137 |
| PLS-Regression-MSIF | 0.8266 | 0.1254 | 78.0291 | 6.6680 | 0.5587 | 0.1415 |
| PLS-MSI-FTIR-EarlyFusion | 0.5988 | 0.0829 | 90.3651 | 5.3492 | 0.7688 | 0.0691 |
| PLS-MSI-FTIR-MSIF-EarlyFusion | 0.6176 | 0.0813 | 89.3439 | 5.0660 | 0.7537 | 0.0755 |
| PLS-MSI-FTIR-MidFusion | 0.5928 | 0.0893 | 91.1164 | 5.4086 | 0.7717 | 0.0801 |
| PLS-MSI-FTIR-MSIF-MidFusion | 0.5912 | 0.0927 | 90.1746 | 6.0481 | 0.7727 | 0.0804 |
| PLS-MSI-FTIR-LateFusion | 0.5586 | 0.0782 | 91.3201 | 5.5276 | 0.7977 | 0.0698 |
| PLS-MSI-FTIR-MSIF-LateFusion | 0.5691 | 0.0941 | 91.0291 | 5.5210 | 0.7891 | 0.0802 |
| Aerobic + Vacuum Models | ||||||
| PLS-Regression-MSI | 0.7358 | 0.1018 | 84.2222 | 4.4987 | 0.7344 | 0.1007 |
| PLS-Regression-FTIR | 0.7641 | 0.0727 | 82.1293 | 4.5691 | 0.7218 | 0.0599 |
| PLS-Regression-MSIF | 0.9682 | 0.0771 | 68.9360 | 6.2140 | 0.5536 | 0.0817 |
| PLS-MSI-FTIR-EarlyFusion | 0.6203 | 0.0650 | 89.7461 | 4.2534 | 0.8159 | 0.0431 |
| PLS-MSI-FTIR-MSIF-EarlyFusion | 0.6116 | 0.0524 | 90.0094 | 3.5852 | 0.8221 | 0.0324 |
| PLS-MSI-FTIR-MidFusion | 0.6141 | 0.0534 | 90.4431 | 3.2687 | 0.8198 | 0.0393 |
| PLS-MSI-FTIR-MSIF-MidFusion | 0.5892 | 0.0494 | 91.5091 | 3.2946 | 0.8346 | 0.0323 |
| PLS-MSI-FTIR-LateFusion | 0.6392 | 0.0693 | 88.9044 | 3.3687 | 0.8029 | 0.0561 |
| PLS-MSI-FTIR-MSIF-LateFusion | 0.6163 | 0.0603 | 89.8949 | 3.7594 | 0.8180 | 0.0440 |
| Model | LOOCV Performance | Aerobic Performance | MAP Performance | ||||||
|---|---|---|---|---|---|---|---|---|---|
| RMSEcv (SD) | LVs (Meta LVs) | RMSEp | Acc % | R2 | RMSEp | Acc % | R2 | ||
| MSI | Aerobic | 0.7170 (0.2614) | 4 | 1.3048 | 45.6522 | 0.4326 | 1.8746 | 37.5000 | −0.1164 |
| MAP | 0.5578 (0.1258) | 5 | 1.3074 | 56.5217 | 0.4303 | 1.4027 | 58.9286 | 0.3749 | |
| A + M | 0.7583 (0.1668) | 5 | 1.4338 | 47.8261 | 0.3148 | 1.3526 | 55.3571 | 0.4188 | |
| MSIF | Aerobic | 0.9630 (0.2673) | 5 | 1.7839 | 30.4348 | −0.0614 | 1.2002 | 51.7857 | 0.5422 |
| MAP | 0.8023 (0.2010) | 3 | 2.5896 | 19.5652 | −1.2368 | 1.3251 | 42.8571 | 0.4419 | |
| A + M | 0.8441 (0.2095) | 7 | 1.8263 | 30.4348 | −0.1124 | 1.0808 | 62.5000 | 0.6288 | |
| FTIR | Aerobic | 0.7764 (0.2573) | 9 | 1.3851 | 52.1739 | 0.3606 | 2.4253 | 39.2857 | −0.8688 |
| MAP | 0.8309 (0.3005) | 15 | 1.4396 | 47.8261 | 0.3093 | 1.6286 | 37.5000 | 0.1574 | |
| A + M | 0.7666 (0.1561) | 16 | 1.5534 | 50.0000 | 0.1958 | 1.7130 | 44.6429 | 0.0678 | |
| MSI +FTIR | Late (Decision) Fusion | ||||||||
| Aerobic | 0.5854 (0.2300) | 4,9 | 1.1663 | 56.5217 | 0.5467 | 2.0272 | 44.6429 | −0.3056 | |
| MAP | 0.5502 (0.1436) | 5,15 | 1.2636 | 63.0435 | 0.4678 | 1.2846 | 62.5000 | 0.4757 | |
| A + M | 0.6220 (0.1271) | 5,16 | 1.2273 | 56.5217 | 0.4980 | 1.4416 | 53.5714 | 0.3398 | |
| Mid- (Feature) Fusion | |||||||||
| Aerobic | 0.5893 (0.2259) | 4,9 (3) | 1.1896 | 58.6957 | 0.5284 | 2.0653 | 41.0714 | −0.3551 | |
| MAP | 0.5074 (0.1135) | 5,15 (5) | 1.2361 | 67.3913 | 0.4907 | 1.2968 | 66.0714 | 0.4657 | |
| A + M | 0.5145 (0.0929) | 5,16 (10) | 1.4185 | 54.3478 | 0.3290 | 1.6726 | 44.6420 | 0.1110 | |
| Early Fusion | |||||||||
| Aerobic | 0.6197 (0.2245) | 5 | 1.8869 | 41.3043 | −0.1866 | 1.7650 | 25.0000 | 0.0103 | |
| MAP | 0.5767 (0.1555) | 7 | 2.4270 | 17.3913 | −0.9631 | 1.9378 | 30.3571 | −0.1930 | |
| A + M | 0.6814 (0.1456) | 6 | 1.4526 | 45.6522 | 0.2968 | 1.3907 | 39.2857 | 0.3856 | |
| MSI +FTIR +MSIF | Late (Decision) Fusion | ||||||||
| Aerobic | 0.5907 (0.2308) | 4,9,5 | 1.1186 | 58.6957 | 0.5827 | 1.8653 | 51.7857 | −0.1058 | |
| MAP | 0.5535 (0.1447) | 5,15,3 | 1.2515 | 56.5217 | 0.4776 | 1.2531 | 62.5000 | 0.5010 | |
| A + M | 0.6282 (0.1277) | 5,16,7 | 1.1865 | 58.6957 | 0.5304 | 1.4244 | 53.5714 | 0.3551 | |
| Mid- (Feature) Fusion | |||||||||
| Aerobic | 0.5793 (0.1983) | 4,9,5 (3) | 1.1031 | 60.8696 | 0.5945 | 1.7455 | 51.7857 | 0.0321 | |
| MAP | 0.5457 (0.1266) | 5,15,3 (5) | 1.3075 | 60.8696 | 0.4302 | 1.3970 | 66.0714 | 0.3800 | |
| A + M | 0.6650 (0.1410) | 5,16,7 (4) | 1.2013 | 56.5217 | 0.5186 | 1.4952 | 55.3571 | 0.2894 | |
| Early Fusion | |||||||||
| Aerobic | 0.6411 (0.2394) | 5 | 1.7345 | 43.4783 | −0.0034 | 1.6092 | 26.7857 | 0.1770 | |
| MAP | 0.6035 (0.1595) | 7 | 2.1515 | 21.7391 | −0.5440 | 1.6677 | 35.7143 | 0.1161 | |
| A + M | 0.6963 (0.1450) | 6 | 1.3967 | 52.1739 | 0.3494 | 1.3136 | 44.6429 | 0.4516 | |
| Model | RMSE Mean | RMSE SD | Acc % Mean | Acc % SD | R2 Mean | R2 SD |
|---|---|---|---|---|---|---|
| Aerobic Models | ||||||
| PLS-Regression-MSI | 1.0622 | 0.2255 | 69.4444 | 10.2883 | 0.5332 | 0.1809 |
| PLS-Regression-FTIR | 0.9530 | 0.1668 | 73.0526 | 10.3674 | 0.6258 | 0.1233 |
| PLS-Regression-MSIF | 0.9709 | 0.1719 | 70.2515 | 8.6537 | 0.6106 | 0.1326 |
| PLS-MSI-FTIR-EarlyFusion | 0.9149 | 0.1584 | 76.0117 | 9.7809 | 0.6539 | 0.1158 |
| PLS-MSI-FTIR-MSIF-EarlyFusion | 0.8739 | 0.1351 | 78.7368 | 6.6358 | 0.6859 | 0.1021 |
| PLS-MSI-FTIR-MidFusion | 0.9170 | 0.1752 | 75.6842 | 9.5596 | 0.6491 | 0.1290 |
| PLS-MSI-FTIR-MSIF-MidFusion | 0.9432 | 0.1610 | 74.3333 | 7.7958 | 0.6309 | 0.1333 |
| PLS-MSI-FTIR-LateFusion | 0.8444 | 0.1567 | 78.9181 | 9.7589 | 0.7057 | 0.1024 |
| PLS-MSI-FTIR-MSIF-LateFusion | 0.8284 | 0.1499 | 76.9649 | 9.4674 | 0.7181 | 0.0908 |
| MAP Models | ||||||
| PLS-Regression-MSI | 0.9635 | 0.1831 | 74.7352 | 9.1533 | 0.6241 | 0.1577 |
| PLS-Regression-FTIR | 0.9419 | 0.1690 | 73.2846 | 9.3656 | 0.6419 | 0.1374 |
| PLS-Regression-MSIF | 0.9674 | 0.1402 | 70.5336 | 10.7800 | 0.6275 | 0.1141 |
| PLS-MSI-FTIR-EarlyFusion | 1.0374 | 0.2133 | 73.1383 | 9.5623 | 0.5593 | 0.1954 |
| PLS-MSI-FTIR-MSIF-EarlyFusion | 0.9287 | 0.1611 | 76.6680 | 9.0988 | 0.6476 | 0.1481 |
| PLS-MSI-FTIR-MidFusion | 0.8764 | 0.1532 | 76.9091 | 8.2672 | 0.6938 | 0.1011 |
| PLS-MSI-FTIR-MSIF-MidFusion | 0.7999 | 0.1389 | 79.9684 | 8.1167 | 0.7413 | 0.0943 |
| PLS-MSI-FTIR-LateFusion | 0.8151 | 0.1646 | 82.7747 | 7.7723 | 0.7315 | 0.1094 |
| PLS-MSI-FTIR-MSIF-LateFusion | 0.7924 | 0.1471 | 81.9130 | 8.9743 | 0.7491 | 0.0838 |
| Aerobic + MAP Models | ||||||
| PLS-Regression-MSI | 0.9904 | 0.1162 | 73.0244 | 7.0759 | 0.6210 | 0.0883 |
| PLS-Regression-FTIR | 0.8992 | 0.1111 | 75.7561 | 5.9825 | 0.6898 | 0.0650 |
| PLS-Regression-MSIF | 1.0356 | 0.1283 | 69.8537 | 7.1320 | 0.5817 | 0.1172 |
| PLS-MSI-FTIR-EarlyFusion | 0.8972 | 0.1010 | 77.5122 | 5.6106 | 0.6906 | 0.0643 |
| PLS-MSI-FTIR-MSIF-EarlyFusion | 0.8635 | 0.0865 | 77.6098 | 6.0670 | 0.7125 | 0.0600 |
| PLS-MSI-FTIR-MidFusion | 0.8467 | 0.1067 | 79.2683 | 5.8384 | 0.7234 | 0.0677 |
| PLS-MSI-FTIR-MSIF-MidFusion | 0.8247 | 0.1257 | 81.4634 | 6.6528 | 0.7369 | 0.0726 |
| PLS-MSI-FTIR-LateFusion | 0.8138 | 0.1123 | 81.9024 | 5.5638 | 0.7457 | 0.0597 |
| PLS-MSI-FTIR-MSIF-LateFusion | 0.7867 | 0.1227 | 83.8049 | 6.2233 | 0.7599 | 0.0704 |
Disclaimer/Publisher’s Note: The statements, opinions and data contained in all publications are solely those of the individual author(s) and contributor(s) and not of MDPI and/or the editor(s). MDPI and/or the editor(s) disclaim responsibility for any injury to people or property resulting from any ideas, methods, instructions or products referred to in the content. |
© 2025 by the authors. Licensee MDPI, Basel, Switzerland. This article is an open access article distributed under the terms and conditions of the Creative Commons Attribution (CC BY) license (https://creativecommons.org/licenses/by/4.0/).
Share and Cite
Heffer, S.; Anastasiadi, M.; Nychas, G.-J.; Mohareb, F. Fusion vs. Isolation: Evaluating the Performance of Multi-Sensor Integration for Meat Spoilage Prediction. Foods 2025, 14, 1613. https://doi.org/10.3390/foods14091613
Heffer S, Anastasiadi M, Nychas G-J, Mohareb F. Fusion vs. Isolation: Evaluating the Performance of Multi-Sensor Integration for Meat Spoilage Prediction. Foods. 2025; 14(9):1613. https://doi.org/10.3390/foods14091613
Chicago/Turabian StyleHeffer, Samuel, Maria Anastasiadi, George-John Nychas, and Fady Mohareb. 2025. "Fusion vs. Isolation: Evaluating the Performance of Multi-Sensor Integration for Meat Spoilage Prediction" Foods 14, no. 9: 1613. https://doi.org/10.3390/foods14091613
APA StyleHeffer, S., Anastasiadi, M., Nychas, G.-J., & Mohareb, F. (2025). Fusion vs. Isolation: Evaluating the Performance of Multi-Sensor Integration for Meat Spoilage Prediction. Foods, 14(9), 1613. https://doi.org/10.3390/foods14091613