Article

Acrylamide Intake in Senior Center Canteens: A Total Exposure Assessment Applying the Duplicate Diet Approach

by
Marta Mesias
,
Lucía González-Mulero
,
Francisco J. Morales
and
Cristina Delgado-Andrade
*
Institute of Food Science, Technology and Nutrition (ICTAN-CSIC), José Antonio Novais 6, 28040 Madrid, Spain
*
Author to whom correspondence should be addressed.
These authors contributed equally to this work.
Foods 2025, 14(6), 1073; https://doi.org/10.3390/foods14061073
Submission received: 21 February 2025 / Revised: 14 March 2025 / Accepted: 19 March 2025 / Published: 20 March 2025

Abstract

:
This study conducted a total acrylamide exposure assessment through the daily diet in two Spanish senior centers using the duplicate diet method. Among foods regulated in Europe, only instant coffee provided at senior center 1 (2831 µg/kg) exceeded the benchmark value of 850 µg/kg. The primary contributors to acrylamide intake were French fries (27.3 µg/serving) and Spanish omelet (21.6 µg/serving), followed by stews, soups, and creams (16.1–5.8 µg/serving). Total acrylamide exposure was estimated under lower bound (LB) and upper bound (UB) scenarios, being 0.36–0.40 and 0.48–0.54 µg/kg bw/day, respectively. In the LB scenario, cereal-based products were the largest contributors (≤90.4%), whereas in the UB scenario, other foods/meals, including stews and vegetal dishes, became the main contributors (≤83.4%). The margin of exposure (MOE) for neoplastic effects ranged between 314 and 474, indicating a potential health risk for consumers. These findings emphasize the need to integrate nutritional and food safety considerations when designing diets for elderly populations.

1. Introduction

Over recent decades, the increasing life expectancy and evolving societal structures in regions like Europe and North America have significantly elevated the demand for nursing homes, with populations aged 65 and older growing by over 20% [1]. Factors such as the reduction in available caregivers, particularly due to women’s growing workforce participation, and the complexity of managing chronic diseases have accelerated the shift toward professional elderly care services [2]. The acceptance of nursing homes has also been facilitated by advances in specialized care, offering an enhanced quality of life for residents who face loneliness or loss of autonomy. Today, these facilities have become crucial social and healthcare centers, providing both temporary and long-term solutions for elderly individuals in need of comprehensive support [3,4].
Nursing homes play an essential role in maintaining the nutritional health of their residents, addressing specific dietary needs, such as allergies, swallowing difficulties, nutrient deficiencies, and dietary restrictions. Proper nutrition is indispensable for preserving health, managing chronic conditions, and enhancing overall quality of life in older adults. There are different guidelines for designing menus in nursing homes, emphasizing the efficiency and large-scale preparation of food tailored to elderly residents’ dietary needs and preferences [4,5,6].
Several studies, such as the recent NutriCare study, indicate that nursing home residents often have suboptimal nutritional status [7,8]. Common deficiencies in calcium, magnesium, zinc, vitamin D, vitamin B6, and folate have been reported among residents [4]. For instance, studies have shown that over 60% of elderly residents in long-term care facilities suffer from vitamin D deficiency, while nearly half exhibit inadequate levels of calcium and magnesium, exacerbating risks for osteoporosis and cardiovascular issues. Similarly, adequate protein intake has been linked to improved muscle mass and strength, reducing fall risk in elderly individuals [4]. Paradoxically, despite these deficiencies suggesting malnutrition, elevated rates of overweight and obesity are also observed [3,9]. Given this dual burden of malnutrition and overweight, regularly assessing the nutritional profile of nursing home menus and their impact on residents’ nutritional status has become a standard practice. Regular assessments of nursing home menus are crucial, not only to evaluate their nutritional adequacy but also to address emerging food safety concerns, such as process contaminants, which are less frequently examined. Integrating both nutritional and food safety perspectives is imperative to meet the health challenges of an aging population effectively.
Acrylamide is a harmful compound with carcinogenic and genotoxic properties that develops during high-temperature cooking methods like baking, frying, or roasting. Acrylamide formation is linked to the Maillard reaction between the free amino acid asparagine and carbonyl compounds, its major mechanisms of formation [10]. Animal studies have established a link between acrylamide exposure and increased certain cancer risks across all age groups, highlighting a significant health risk for consumers, particularly for individuals who are exposed to high levels of acrylamide over extended periods. In addition to its carcinogenic potential, acrylamide exposure has been linked to other health problems, such as neurotoxic effects, particularly in sensitive populations like pregnant women and children, where brain function and development could be impaired [11].
Due to its potential toxicity, it is crucial to investigate the intake of thermally processed foods and the resulting dietary exposure to acrylamide. While thermally processed foods are widely consumed by the general population, elderly individuals tend to prefer more traditionally prepared meals. This preference is particularly advantageous in nursing center canteens, where such meals are both efficient to prepare and well-suited for large-scale food production. Evaluating dietary exposure to acrylamide in vulnerable populations, such as nursing home residents, is particularly important.
Numerous studies have evaluated acrylamide exposure using various assessment methods, including probabilistic models, dietary surveys, and reference levels of contaminants in food [12]. While those approaches have limitations, they have been used to assess exposure in both the general population and specific subgroups [13,14,15]. The EFSA recommends the duplicate diet approach to improve exposure assessment, as it allows for the accurate determination of actual dietary intake of contaminants [11]. However, despite this recommendation, studies directly analyzing acrylamide exposure across all food items in a complete diet, while also assessing the associated risk, remain limited, particularly among older populations living in specialized care centers [16].
To address this gap, this study aims to evaluate acrylamide exposure in the daily diets of Spanish nursing home residents using the duplicate diet method. The findings are intended to inform dietary planning and policy adjustments to reduce acrylamide intake, improve food safety standards, and promote healthier nutritional strategies tailored to the elderly population. By estimating associated health risks, it seeks to provide valuable insights into the implications of acrylamide intake in this vulnerable population. The findings are expected to contribute to the development of dietary strategies that integrate nutritional adequacy and food safety, ultimately improving the well-being of elderly individuals dependent on institutional care.

2. Materials and Methods

2.1. Study Design and Food Samples

Two senior center canteens located in Castilla-La Mancha (Spain) were chosen in this study. These facilities were operated by different food service companies, leading to differences in food handling and preparation methods. The study was conducted from February 2020 to December 2021 and followed a comprehensive protocol for data collection and analysis. Each canteen took part in a two-week trial, during which all foods and meals included in the daily menus from Monday to Friday were gathered using the duplicate diet approach (Table 1A–D). The duplicate diet method was chosen for its ability to accurately represent actual dietary intake by collecting identical portions of all meals consumed. Menus included breakfast, lunch, afternoon snack, and dinner, covering the entire diet of the senior adults. A total of 304 foods and meals were gathered throughout the study period. A code was given to each food sample, and pictures were taken before processing in the laboratory. Following the EFSA FoodEx2 classifications system [17,18], each meal was assigned a standard classification based on its composition and cooking procedure. This systematic approach facilitated precise evaluations of acrylamide exposure. For sample preparation, the edible portion of each meal was separated, weighed, and blended using a hand mixer (Taurus, Vital CM, Lérida, Spain). The homogenized samples were then divided into aliquots and stored at −20 °C until further analysis.

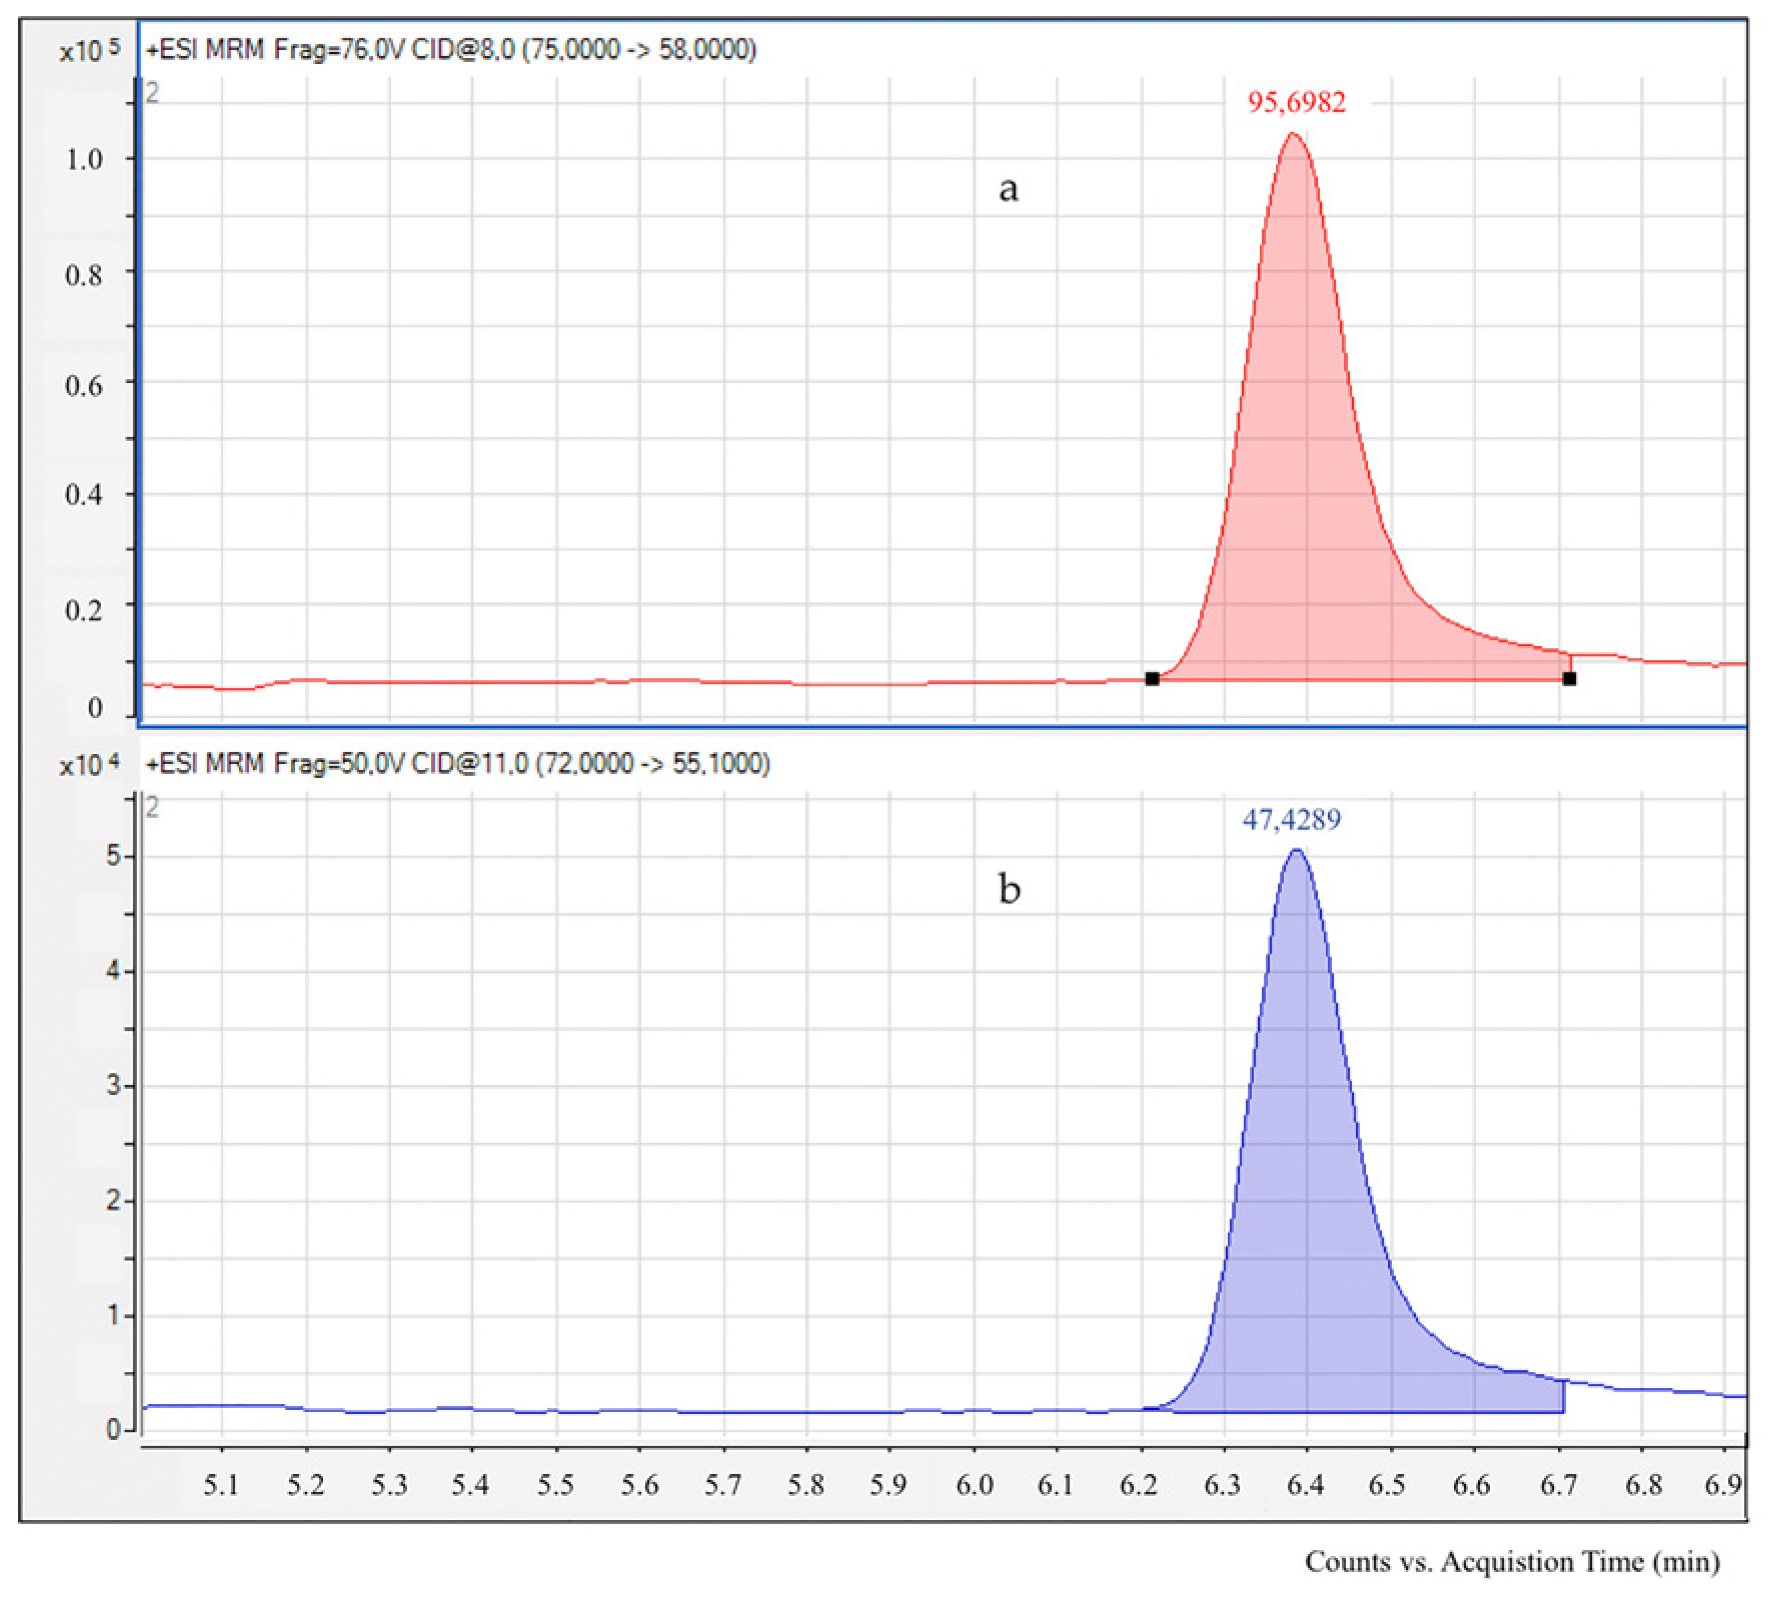
2.2. Acrylamide Determination by LC-ESI-MS/MS

Chemicals and reagents used for acrylamide determination were as follows: Acrylamide standard (99%), Carrez-I (potassium hexacyanoferrate (II) trihydrate, 98%), and Carrez-II (zinc acetate dihydrate (>99%) were purchased in Sigma (St. Louis, MO, USA). Acrylamide labeled isotopically with 13C3 (99%) was obtained from Cambridge Isotope Laboratories (Andover, MA, USA). Hexane, methanol (99.5%) and formic acid (98%) were provided by Panreac (Barcelona, Spain). Deionized water, used for all solutions, was obtained from a Milli-Q Integral 5 water purification system (Millipore, Billerica, MA, USA). Cellulose syringe filters (0.22 and 0.45 µm) were purchased from Análisis Vínicos (Tomelloso, Ciudad Real, Spain), while Oasis-HLB cartridges (30 mg, 1 mL) were supplied by Waters (Milford, MA, USA). All solvents, reagents, and chemicals were of analytical grade.
Acrylamide levels in foods and meals were measured using liquid chromatography coupled with electrospray ionization tandem mass spectrometry (LC-ESI-MS/MS), based on the validated method outlined by González-Mulero et al. [19]. An Agilent 1200 liquid chromatograph paired with an Agilent Triple Quadrupole MS detector (Agilent Technologies, Palo Alto, CA, USA) was utilized. Separation was performed on an Inertsil ODS-3 column (250 × 4.6 mm, 5 µm; GL Sciences Inc., Tokyo, Japan) at 30 °C. Isocratic elution was carried out with a mobile phase of formic acid in water (0.2 mL/100 mL) at a flow rate of 0.4 mL/min. The injection volume was 10 µL. Positive ionization mode was employed for electrospray ionization. Under these conditions, acrylamide eluted at 6.4 min. The needle voltage was set to 1.0 kV, with nitrogen as the nebulizer gas at flow rate 12.0 L/min. The temperature of the source was maintained at 350 °C. Signals at m/z 72.1–m/z 55.1 were monitored for acrylamide and signals at m/z 75.1–m/z 58.1 were monitored for (13C3)-acrylamide. The fragmentation for the transition m/z 72.0 > m/z 55.1 was set at 50 V with a collision energy of 11 V; while for the transition m/z 75.0 > m/z 58.1, fragmentation was set at 76 V and collision energy at 8 V. Masses were recorded using multiple reactions monitoring (MRM). For quantitation, the signals at m/z 75.1 and 78.1 were used, while signals at m/z 58.1 and 55.1 served for qualification (Figure 1). Matrix effects were considered during quantification by applying the recovery rate of the internal standard in each food or dish analysis. The accuracy, repeatability, and reproducibility of the method were evaluated through the analysis of several samples conducted on the same day (accuracy) by different analysts, which means repeatability, and across multiple days, which means reproducibility. Fortified samples with acrylamide at various concentrations achieved recovery rates ranging from 94% to 103%. Repeatability and reproducibility were tested using different analyses and over multiple days, with relative standard deviations (RSDs) consistently <10%. LOD (limit of detection) LOQ (limit of quantification) were determined by injecting progressively lower acrylamide concentrations and calculating their respective signal-to-noise ratios. The LOD was determined to be 4.5 µg/kg (signal-to-noise ratio of 3), while the LOQ was set at 15 µg/kg (signal-to-noise ratio of 10). The samples were analyzed by duplicate. The results were expressed in µg/kg of the edible portion.
To verify the method’s accuracy, proficiency tests were conducted using the Food Analysis Performance Assessment Scheme (FAPAS). The most recent proficiency test results included test ID number 30117 (coffee, December 2021), test ID number 30118 (crispbread, January 2022), and test ID number 30133 (potato crisps, March 2023), with z-scores of 0.1, −0.1, and −0.2, respectively, demonstrating the reliability of the findings.

2.3. Estimation of Acrylamide Exposure

Acrylamide exposure in senior adults consuming food and meals provided in the menus at senior center canteens was estimated by a deterministic approach. The acrylamide contribution from each meal was determined by multiplying the acrylamide concentration in the meal by the weight of its edible portion.
Values for foods with acrylamide levels below the limit of quantification (LOQ, <15 µg/kg) were replaced with zero (lower bound, LB) or the LOQ (upper bound, UB) in accordance with recommendations from food safety studies [11,20]. Dietary acrylamide exposure for senior adults was determined by summing the acrylamide contributions from all foods and meals consumed over one day and normalizing the total by body weight (bw) (Equation (1)). The average daily acrylamide exposure was calculated for centers 1 and 2, considering the single menu option provided each day.
Estimated   dietary   exposure = Σ acrylamide   content   of   food   µ g k g   ×   Food   consumption kg day Body   weight   ( kg )
Dietary exposure was calculated separately for males and females, using average body weight data for the Spanish population aged 65 years and older: 81 kg for males and 72 kg for females [1]. The results were presented as µg/kg bw/day.
Health risks linked to acrylamide exposure were evaluated by the calculation of the margin of exposure (MOE) for both neurotoxic and neoplastic effects, using Equation (2):
MOE = B M D L 10 ( µ g / kg   bw / day ) Estimated   dietary   exposure   ( µ g / kg   bw / day )
A benchmark dose lower confidence limit (BMDL10) of 430 µg/kg bw/day, obtained from studies in rats, was used to evaluate the risk of neurotoxic effects. MOE values < 125 were considered indicative of possible human health risks for neurotoxicity. For carcinogenic effects, a BMDL10 of 170 µg/kg bw/day, based on data from male mice with Harderian gland tumors, was applied. In this case, MOE values < 10,000 were interpreted as indicating a potential risk [11].

2.4. Statistical Analysis

Statistical analyses were performed applying Statgraphics Centurion XVI.I software. The results were presented as means and standard deviations (SD). The Shapiro–Wilk test was used to assess the normality of data distribution, and Levene’s test was applied to check for homogeneity of variances. A two-tailed Student’s t-test was used to compare acrylamide levels between the two senior centers. A significance threshold of p < 0.05 was established for all analyses.

3. Results and Discussion

3.1. Analysis of Menus Offered in Senior Center Canteens

The analysis of menus provided at two senior center canteens over a two-week trial revealed significant insights into their dietary composition and adherence to nutritional guidelines (Table 1A–D).
Based on AESAN dietary recommendations [6], the menus offered a variety of food groups to ensure balanced, sustainable meals for the elderly. Both centers provided three main meals and two snacks daily, including fruits, vegetables, cereals, dairy, and protein-rich foods. However, there were gaps in fruit (fewer than two servings per day) and legumes, which were below the recommended frequency. Culinary practices aimed to preserve the nutritional value, using methods like boiling, baking, grilling, and frying, of seasonal ingredients for added flavor. Meals were adjusted for dietary restrictions, including low-sodium options and modified textures for residents with swallowing or dental issues. Fortified foods, such as calcium- and vitamin D-enriched dairy products, were also used to address common nutrient deficiencies in the elderly, as highlighted by Sahin and Caferoglu [4].
The guidelines for maintaining balanced meals in Spanish senior centers are outlined in Law 17/2011 on Food Safety and Nutrition [21] and AESAN’s 2022 recommendations [22]. These documents require menus to include a first course, second course, and dessert, using seasonal foods to ensure balanced nutrition. They must also consider seniors’ nutritional status, food preferences, dietary restrictions, and medication interactions that can affect nutrient absorption or cause side effects. Texture is another important factor for those with dental issues, and adequate fluid intake should be ensured, especially through soups and water-rich foods, as well as drinks like milk or herbal infusions at meals.
A recently published document provides updated guidelines for preparing healthy, environmentally sustainable menus in senior centers. It recommends daily servings of 3 vegetables, 2–3 fruits, 3–6 cereals, 3 dairy products, and moderate consumption of potatoes. It also advises a weekly intake of 4 legumes, 3 fish or shellfish, 4–5 eggs, and a limit of 3 servings of meat or meat products [6].
Overall, the menus largely adhered to national dietary guidelines, which emphasizes the integration of sustainable and culturally relevant practices in meal planning for elderly populations. The distribution of food throughout the week was varied, as were the culinary techniques used for cooking. The menus provided at these senior centers conform to the nutritional directives established in international frameworks aimed at fostering healthy dietary practices within these public facilities.

3.2. Acrylamide Content in Foods and Meals Provided in Senior Center Canteens

Among the 304 food and meal samples collected from the two senior center canteens, acrylamide was detected in 41% of them. Detailed results are presented in Table 2A,B. At senior center 1, 148 food and meal samples were analyzed, and 54% (80 samples) contained acrylamide levels above the LOQ. The distribution of acrylamide-containing samples was relatively balanced across meal categories: breakfast (25.0%), lunch (22.5%), afternoon snacks (25.0%), and dinner (27.5%) (Figure 2). In contrast, senior center 2 had a lower percentage, with 29% (46 out of 156 samples) above the LOQ. At this center, acrylamide-containing foods were most frequently consumed at breakfast (43.5%), followed by afternoon snacks (21.7%), dinner (19.6%), and lunch (15.2%). This observation suggests that when a diet contains limited acrylamide sources, they are typically found in meals with a higher proportion of industrially processed foods, usually consumed at breakfast or during afternoon snacks.
The highest mean acrylamide concentrations were found in instant coffee and French fries at both centers, along with instant cocoa at senior center 1. For coffee, mean acrylamide levels ranged from 192 µg/kg (center 2) to 2831 µg/kg (center 1), exceeding the benchmark value of 850 µg/kg determined in the European Regulation 2017/2158 [23]. French fries reported mean levels between 213 µg/kg (center 1) and 304 µg/kg (center 2), which remained below the benchmark value of 500 µg/kg. In comparison, previous research has reported acrylamide levels of 187.6 µg/kg in French fries from Colombia [24] and 101.6–1174.8 µg/kg in fries from the Korean market [25]. The results align with previous studies conducted by our research group in public collectivities, which documented high levels of acrylamide in potato crisps and French fries [26,27]. Numerous other studies have also reported elevated acrylamide concentrations in potato-based products such as potato crisps and French fries, compared to other food items [28,29,30,31,32]. Potato-based dishes, such as Spanish omelet (mean 161 µg/kg, Table 2A) and oven-baked potatoes (mean 20 µg/kg, Table 2B), also contributed to acrylamide intake but at comparatively moderate levels.
Similarly, cereal-derived foods ranged from 21 µg/kg in muffins to 122 µg/kg in biscuits, all below the reference values specified by the European Commission for bread (50–100 µg/kg) and biscuits (350 µg/kg) [23]. Previous studies conducted in Hong Kong, Japan, and China identified vegetables cooked at high temperatures as significant dietary sources of acrylamide in their populations [33,34,35]. Vegetable-based preparations exhibited varied concentrations, with roasted red peppers containing 160 µg/kg and sautéed vegetable omelets ranging from 55 to 65 µg/kg. Moisture-rich dishes such as soups and stews generally had low acrylamide levels, but the presence of sautéed components or added spices might explain the detected concentrations. In this regard, mean acrylamide concentrations of 397.0 µg/kg in black pepper and 61.8 µg/kg in white pepper have been previously reported [25]. The remaining foods and meals showed very low acrylamide concentrations, varying between 17 µg/kg, detected in the typical chickpea stew made with pork and beef meat and vegetables, and 40 µg/kg, measured in the fish soup. Both dishes were prepared using boiling methods, which did not promote the Maillard reaction.

3.3. Acrylamide Intake in Senior Center Canteens

The estimation of the acrylamide daily intake among elderly residents at the two senior centers was calculated based on the concentrations measured in food samples and average consumption patterns throughout the 10-day study. Calculations were performed for the two exposure scenarios considered: one including only the consumption of foods with acrylamide concentrations above the LOQ (lower exposure scenario; Table 2A,B), and another that additionally incorporated foods with acrylamide levels < LOQ (upper exposure scenario; Table 3A,B).
It was considered that the entire collected edible portion was consumed, so these data reflect the maximum potential acrylamide intake. The acrylamide contribution of each food and meal was determined by factoring the acrylamide concentration in the samples and the size of the edible portion. All portions of food were edible except for the salmon stew with vegetables, rice with pork meat and vegetables, and chicken and garlic stew in the center 1, where the inedible portion was removed, the total portions being 160 g, 319 g and 160 g, respectively. In the center 2, all portions of food were edible except for the fried anchovies, breaded cod, and baked mako shark, the total portions being 47 g, 219 g and 208 g, respectively.
The highest contribution to the acrylamide daily intake among elderly residents was found in potato-based foods, such as French fries (27.3 µg/serving) and Spanish omelet (21.6 µg/serving), followed by stews, soups, and creams, with seafood soup (16.1 µg/serving) and tomato soup (14.0 µg/serving) being the most notable. To estimate the UB scenario, an acrylamide value of 15 µg/kg was set to all dishes and foods with levels below the quantification limit but above the detection limit. With this assumption, among the dishes assigned the LOQ value, the main contributions came from different stews (5.4–7.9 µg/serving) and vegetable-based dishes (below 7.8 µg/serving) (Table 3A,B).
The variability of the weekly outcomes for each center in both scenarios is depicted through a box-and-whisker plot presented in Figure 3. Furthermore, the figure elucidates the average weekly intake throughout the period of the study. In the LB scenario, daily acrylamide intake ranged from 17.4 to 72.1 µg in senior center 1 and from 6.1 to 40.0 µg in senior center 2. The weekly average for both centers was 37.7 µg/day and 20.5 µg/day, respectively, with statistically significant differences (p = 0.021). The overall average for the two canteens was 29.1 µg/day. In the UB scenario, daily intake was considerably higher, reaching an average value of 39.0 µg/day. In this case, daily intake ranged between 24.4 and 72.1 µg in center 1, and between 16.9 and 50.4 µg in center 2, resulting in weekly mean values of 44.8 µg/day and 32.9 µg/day, with no significant differences between them (p = 0.068).
Nematollahi et al. [14] reported a mean acrylamide intake of 37.11 µg/day in the Iranian population aged 61–96 years, similar to the estimates from our study. However, a limitation of their study is that it only considered the consumption of foods primarily based on bakery products, various snacks, nuts, and fast food (pizza, hamburgers, and assorted cold cuts). Comparable ranges of acrylamide consumption have been reported in adults from Poland (23.1 µg/day) [36], Japan (4.7–15.8 µg/day) [37], China (14.6 µg/day) [38], the United States (18.1–71.4 µg/day) [39], Italy (33.6 µg/day), and Australia (22.8 µg/day) [40], with even higher values in the European population (261 µg/day) [41].
The relative contribution of food groups to the total daily acrylamide intake was calculated and expressed as a percentage. The results are presented as ranges of contribution (minimum and maximum) for both lower and upper exposure scenarios (Table 4). In the lower exposure scenario, the largest contributors were cereal-based products, accounting for up to 90.4%, followed by other foods/meals (84.6%), potato-based dishes (70.6%), and, to a lesser extent, coffee (33.4%) and cocoa (21.5%). This distribution shifted in the upper exposure scenario, where other foods/meals became the largest contributors (83.4%) followed by potato-based dishes (54.2%), and cereal-based products (43.7%). Coffee and cocoa continued to contribute to a lesser extent, accounting for 23.7 and 15.3%, respectively. The findings were consistent with those reported by other total dietary exposure assessment studies considering coffee, cocoa, cereal-based products, and potato-based dishes [12,25,32,38], some of them also focusing on the elderly population [38]. Similarly, data from the EFSA on elderly individuals highlights these food sources as the primary contributors to the total acrylamide exposure, with other products based on potatoes, cereals, and cocoa accounting for approximately 40% of the total exposure [11]. However, and this is a key aspect that sets our study apart from others, previous investigations typically did not consider other food categories, such as breaded foods, stews, and dishes containing processed vegetables. Although many of these foods contained relatively low levels of acrylamide, their larger serving sizes resulted in a higher contribution to acrylamide intake, making up as much as 80% of the total intake on certain days.
Consistent with the findings of Zhu et al. [35], it is important to consider the variety of foodstuffs that may undergo heat processing under different conditions when modelling dietary exposure to acrylamide. In line with results from total dietary exposure assessment studies conducted on Chinese populations [33,42] and Irish adult populations [5], vegetables contribute to acrylamide exposure. Authors of both investigations also emphasized that only a few studies consider the presence of acrylamide in vegetables other than potatoes. As a result, these foods are often excluded as potential contributors to acrylamide exposure. Our research demonstrates that an important food category contributing to acrylamide exposure—not because of its high contaminant content, but due to its high frequency of consumption and portion size—is being underestimated. From a toxicological standpoint, it is well known that the combined exposure to a toxic substance from multiple small sources can lead to the emergence of unexpected toxic effects over time, even at low levels below the established safe thresholds [43].

3.4. Dietary Exposure to Acrylamide in Senior Center Canteens and Risk Assessment

Acrylamide exposure through consumption of the daily diet prepared in senior center canteens, along with the associated risk, was estimated for both the LB and UB scenarios, considering 72 kg as a reference of an average body weight for women and 81 kg for men [1] (Table 5). Daily acrylamide exposure was higher in senior center 1, with significant differences compared to center 2 only in the LB scenario (p = 0.021). While differences in the UB scenario were not statistically significant (p > 0.05), women exhibited higher exposure levels (0.52–0.62 µg/kg bw/day at center 1 and 0.28–0.46 µg/kg bw/day at center 2) than men (0.46–0.55 µg/kg bw/day at center 1 and 0.25–0.41 µg/kg bw/day at center 2) due to lower average body weight. Consequently, MOE values for both neurological and neoplastic effects were lower for women.
For neurological effects, MOE values across all scenarios exceeded the reference value of 125, meaning no risk. Nevertheless, MOE values for neoplastic effects were significantly lower than 10,000 (reference value), highlighting a considerable health risk. The average MOE values in the LB scenario were 421 for men and 474 for women, decreasing to 314 and 353, respectively, in the UB scenario. These findings underscore the need for targeted measures to reduce acrylamide exposure in elderly institutional diets.
It is also important to consider that acrylamide is only one of many dietary risk factors affecting elderly populations. Overall, the cumulative impact of consuming highly processed foods alongside a low intake of fresh fruits and vegetables may significantly contribute to multiple diet-related diseases. While this study focuses specifically on acrylamide risk assessment, broader dietary improvements could play a crucial role in reducing overall health risks in institutional settings.
The values of exposure observed in this investigation were higher than those observed in other countries. Health Canada [44] reported an average exposure of 0.187 µg/kg bw/day in adults aged 51–70 years, while Wong et al. [33] recorded values of 0.213 µg/kg bw/day in a Hong Kong adult population. Similar lower estimates were observed in Ireland (0.16–0.38 µg/kg bw/day) [5]; the Netherlands (median 0.3 µg/kg bw/day) [45]; France (mean 0.43 µg/kg bw/day) [46]; and China (mean 0.319 µg/kg bw/day) [42]. A wider range of exposure was noted in Japan (0.008–1.582 µg/kg bw/day, mean 0.215 µg/kg bw/day) [16]; and Taiwan (0–2.67 µg/kg bw/day, median 0.25 µg/kg bw/day) [47].
Direct comparisons with these studies are challenging due to methodological differences. The duplicate diet method used in this study, while limited to 10 days of sample collection, offers a more accurate reflection of population exposure compared to methods relying on food frequency questionnaires or national databases, which often approximate portion sizes and acrylamide levels. Differences may also partly arise from variations in dietary habits between countries and, more significantly, from the differing methodologies employed, which can influence the results. For instance, Vryonidis et al. [48] demonstrated significant discrepancies in acrylamide intake estimates when comparing data derived from hemoglobin adduct levels (0.24 µg/kg bw/day) to those obtained through probabilistic modelling based on dietary surveys (0.26–0.30 µg/kg bw/day). Exposure estimations based on databases and dietary surveys often fail to account for all consumed foods, exact portion sizes, and precise acrylamide levels, relying instead on approximations of average consumption and acrylamide content in a broad range of processed foods. In contrast, although the evaluation period for duplicate diet studies is shorter, these involve the collection of meals over several consecutive days, providing a more accurate and desirable method for describing population exposure.

3.5. Limitations and Uncertainties

The estimation of acrylamide exposure through the diet in the context of this research presents various limitations and uncertainties associated with the consumed foods, their acrylamide levels, the study subjects, and the employed methodology, among other factors. This study considers a limited sample size, as exposure was evaluated in two centers over a limited time period, including the assessment of the diet consumed over two weeks. Additionally, only the consumption of food from Monday to Friday was considered, without accounting for weekends, during which food consumption may vary compared to weekdays. The study estimates a scenario in which the canteen attendee consumed the complete menu, without considering variability in consumption among subjects. It also does not consider the possibility that foods outside the canteen menu could be consumed, which might contribute to acrylamide exposure. Another limitation is the assigned weight to each serving, as only one example of each food or dish was weighed.
The acrylamide concentration in each food can be a new source of uncertainty, related to the analytical method and the detection and quantification limits of the determination. Added to this are the values assigned to samples with acrylamide levels below the detection/quantification limit in the upper and lower exposure scenarios. Culinary habits and the foods used for dish preparation can contribute to another source of uncertainty, influenced by the regional or seasonal differences.
Another factor is the body weight of the subjects. When individual body weights are not known, an average body weight value is applied, which can introduce its own uncertainty. Regarding the methodology, other tools for assessing acrylamide exposure, such as the use of biomarkers, could also be employed. However, in that case, it is not possible to discriminate between acrylamide exposure through diet or through other sources, potentially overestimating contaminant exposure compared to the methodology used in the present study.

4. Conclusions

This study highlights the importance of assessing acrylamide exposure in institutional diets, particularly among elderly populations who rely on pre-determined menus. The findings indicate that daily dietary acrylamide exposure in senior center canteens ranged from 0.36 to 0.54 µg/kg bw/day, with women generally exhibiting higher exposure levels than men because of lower body weight. The margin of exposure (MOE) for neoplastic effects was as low as 314, significantly below the recommended threshold of 10,000, suggesting a potential health risk. Among the analyzed foods, French fries (27.3 µg/serving) and Spanish omelet (21.6 µg/serving) were the main contributors to acrylamide intake, followed by stews, soups, and creams (ranging from 16.1 to 5.8 µg/serving). Although some of these dishes are often overlooked due to their relatively low acrylamide content, their frequent consumption and large portion sizes can substantially contribute to daily intake.

Author Contributions

Conceptualization, M.M., F.J.M. and C.D.-A.; Data curation, M.M., L.G.-M. and C.D.-A.; Funding acquisition, M.M. and C.D.-A.; Investigation, M.M., F.J.M. and C.D.-A.; Methodology, M.M. and L.G.-M.; Project administration, M.M. and C.D.-A.; Resources, M.M., F.J.M. and C.D.-A.; Supervision, M.M., F.J.M. and C.D.-A.; Validation, M.M. and C.D.-A.; Visualization, M.M., F.J.M. and C.D.-A.; Writing—review and editing, M.M., F.J.M. and C.D.-A.; Formal analysis, L.G.-M.; Software, L.G.-M. and F.J.M.; Writing—original draft, L.G.-M. All authors have read and agreed to the published version of the manuscript.

Funding

The present research was funded by the R&D project ACRINTAKE (RTI2018-094402-B-I00), financed by MCIN/AEI/10.13039/501100011033/ and the Regional Development European Fund (“FEDER”): A way to make Europe.

Institutional Review Board Statement

Not applicable.

Informed Consent Statement

Not applicable.

Data Availability Statement

The original contributions presented in the study are included in the article, further inquiries can be directed to the corresponding author.

Acknowledgments

The authors thank USTA (Analysis Service Unit facilities) of ICTAN for the analysis of chromatography and mass spectrometry.

Conflicts of Interest

The authors declare that they have no known competing financial interests or personal relationships that could have appeared to influence the work reported in this paper.

References

  1. Pérez-Rodrigo, C.; Gianzo, M.; Bárbara, G.H.; Aranceta-Bartrina, J. Prevalencia de obesidad y obesidad abdominal en la población española de 65 y más años de edad: Estudio ENPE. Med. Clín. 2022, 158, 49–57. [Google Scholar] [CrossRef]
  2. Schweighart, R.; O’Sullivan, J.L.; Klemmt, M.; Teti, A.; Neuderth, S. Wishes and needs of nursing home residents: A scoping review. Healthcare 2022, 10, 854. [Google Scholar] [CrossRef]
  3. Stokke, R.; Wibe, T.; Sogstad, M. Forming nursing home practices that support quality of care for residents. A qualitative observational study. J. Multidiscip. Healthc. 2023, 16, 2667–2680. [Google Scholar] [PubMed]
  4. Sahin, G.A.; Caferoglu, Z. The food service quality and its effects on nutritional status in nursing home residents. Clin. Nutr. ESPEN 2022, 47, 233–239. [Google Scholar]
  5. Food Safety Authority of Ireland. Monitoring & Surveillance Series, Chemical. Report on a Total Diet Study Carried Out by the Food Safety Authority of Ireland in the Period 2012–2014. Dublin. 2016. Available online: https://www.fsai.ie/getmedia/b96c171b-dce0-419b-a32e-43c3bce8e65a/tds-2014-final.pdf?ext=.pdf (accessed on 15 October 2024).
  6. AESAN (Agencia Española de Seguridad Alimentaria y Nutrición). Orientaciones para la Elaboración de Menús Saludables y Medioambientalmente Sostenibles en Centros Residenciales y Centros de día para Personas Mayores. 2023. Available online: https://www.aesan.gob.es/AECOSAN/docs/documentos/nutricion/ORIENTACIONES_MAYORES.pdf (accessed on 25 November 2024).
  7. Lavriša, Ž.; Pravst, I.; Krušič, S.; Hren, N.; Gregorič, N.; Hren, I.; Koroušić Seljak, B.; Hristov, H. Nutrition among nursing home residents: Results from the NutriCare study. Front. Nutr. 2024, 11, 1423658. [Google Scholar]
  8. Abdelhay, S.M.M.; Ragab, H.M.; Hussein, Y.H.H. Assessment of Nutritional status and Malnutrition Problems among Elderly: An Egyptian Experience. Zagazig Univ. Med. J. 2024, 30, 1738–1749. [Google Scholar]
  9. Harris, J.A.; Castle, N.G. Obesity and nursing home care in the united states: A systematic review. Gerontologist 2019, 59, e196–e206. [Google Scholar]
  10. Stadler, R.H.; Blank, I.; Varga, N.; Robert, F.; Hau, J.; Guy, P.A.; Robert, M.; Riediker, S. Acrylamide from Maillard reaction products. Nature 2002, 419, 449–450. [Google Scholar]
  11. EFSA (European Food Safety Authority). Scientific opinion on acrylamide in food. EFSA J. 2015, 13, 4104. [Google Scholar]
  12. Cieślik, I.; Cieślik, E.; Topolska, K.; Wiczkowski, W. Dietary acrylamide exposure from traditional food products in Lesser Poland and associated risk assessment. Ann. Agric. Environ. Med. 2020, 27, 225–230. [Google Scholar]
  13. Almeida Costa, S.S.; Correia, D.M.; Carvalho, C.; Vilela, S.; Severo, M.; Lopes, C.; Torres, D. Risk characterization of dietary acrylamide exposure and associated factors in the Portuguese population. Food Addit. Contam. 2022, 39, 888–900. [Google Scholar]
  14. Nematollahi, A.; Kamankesh, M.; Hosseini, H.; Ghasemi, J.; Hosseini-Esfahani, F.; Mohammadi, A.; Khaneghah, A.M. Acrylamide content of collected food products from Tehran’s market: A risk assessment study. Environ. Sci. Poll. Res. Int. 2020, 27, 30558–30570. [Google Scholar]
  15. González, N.; Marquès, M.; Calderón, J.; Collantes, R.; Corraliza, L.; Timoner, I.; Bosch, J.; Castell, V.; Domingo, J.L.; Nadal, M. Occurrence and dietary intake of food processing contaminants (FPCs) in Catalonia, Spain. J. Food Comp. Anal. 2022, 106, 104272. [Google Scholar]
  16. Kawahara, J.; Zheng, Y.; Terui, M.; Shinohara, A.; Uyama, K.; Yoneyama, M.; Nakajima, D.; Shibata, Y.; Adachi, S. Dietary exposure to acrylamide in a group of Japanese adults based on 24-hour duplicate diet samples. Food Add. Contam. Part A 2019, 36, 15–25. [Google Scholar]
  17. EFSA (European Food Safety Authority). The Food Classification and Description System FoodEx 2 (Draft-revision 1). EFSA Support. Publ. 2011, 215, 1–438. [Google Scholar]
  18. EFSA (European Food Safety Authority). The Food Classification and Description System FoodEx 2 (Revision 2). EFSA Support. Publ. 2015, 12, 1–90. [Google Scholar]
  19. González-Mulero, L.; Mesías, M.; Morales, F.J.; Delgado-Andrade, C. Acrylamide exposure from common culinary preparations in Spain, in household, catering and industrial settings. Foods 2021, 10, 2008. [Google Scholar] [CrossRef]
  20. Branciari, R.; Ranucci, D.; Altissimi, M.S.; Mercuri, M.L.; Haouet, N. Estimation of acrylamide exposure in Italian schoolchildren consuming a canteen menu: Health concern in three age groups. Int. J. Food Sci. Nutr. 2020, 71, 122–131. [Google Scholar]
  21. BOE (Boletín Oficial del Estado). 17/2011 Law, of July 5th, on Food Safety and Nutrition. Boletín Oficial del Estado 160. 6 July 2011. Available online: https://www.boe.es/boe/dias/2011/07/06/pdfs/BOE-A-2011-11604.pdf (accessed on 20 January 2023).
  22. AESAN (Agencia Española de Seguridad Alimentaria y Nutrición). Recomendaciones Dietéticas Saludables y Sostenibles Complementadas con Recomendaciones de Actividad Física Para la Población Española. 2022. Available online: https://www.aesan.gob.es/AECOSAN/docs/documentos/nutricion/RECOMENDACIONES_DIETETICAS.pdf (accessed on 25 November 2024).
  23. EC (European Commission). Commission Regulation (EU) 2017/2158 of 20 November 2017 Establishing Mitigation Measures and Benchmark Levels for the Reduction of the Presence of Acrylamide in Food. Off. J. Eur. Union 2017, L304, 24–44. Available online: http://data.europa.eu/eli/reg/2017/2158/oj (accessed on 10 October 2022).
  24. Barón Cortés, W.R.; Vásquez Mejía, S.M.; Suárez Mahecha, H. Consumption study and margin of exposure of acrylamide in food consumed by the Bogotá population in Colombia. J. Food Comp. Anal. 2021, 100, 103934. [Google Scholar]
  25. Jeong, H.; Hwang, S.; Kwon, H. Survey for acrylamide in processed foods from Korean market and individual exposure estimation using a non-parametric probabilistic model. Food Add. Contam. Part A 2020, 37, 916–930. [Google Scholar]
  26. González-Mulero, L.; Delgado-Andrade, C.; Morales, F.J.; Mesías, M. Assessment of dietary acrylamide exposure in children attending school canteens using the duplicate diet method. Food Chem. Toxicol. 2023, 181, 114066. [Google Scholar] [PubMed]
  27. González-Mulero, L.; Delgado-Andrade, C.; Morales, F.J.; Mesías, M. Dietary exposure to acrylamide in Spanish university canteens by the duplicate diet method. Foods 2024, 12, 4263. [Google Scholar]
  28. Perestrelo, S.; Schwerbel, K.; Hessel-Pras, S.; Schäfer, B.; Kaminski, M.; Lindtner, O.; Sarvan, I. Results of the BfR MEAL Study: Acrylamide in foods from the German market with highest levels in vegetable crisps. Food Chem. X 2024, 22, 101403. [Google Scholar]
  29. Kuek, S.L.; Tarmizi, A.H.A.; Razak, R.A.A.; Jinap, A.; Norliza, S.; Sanny, M. Contribution of lipid towards acrylamide formation during intermittent frying of French fries. Food Contr. 2020, 118, 107430. [Google Scholar]
  30. Lee, S.; Kim, H.J. Dietary Exposure to Acrylamide and Associated Health Risks for the Korean Population. Int. J. Environ. Res. Pub. Health 2020, 17, 7619. [Google Scholar] [CrossRef]
  31. Pogurschi, E.N.; Zugravu, C.A.; Ranga, I.N.; Trifunschi, S.; Munteanu, M.F.; Popa, D.C.; Tudorache, M.; Custura, I. Determination of Acrylamide in Selected Foods from the Romanian Market. Foods 2021, 10, 2110. [Google Scholar] [CrossRef] [PubMed]
  32. Hidayah, J.N.; Razis, A.F.A.; Jambari, N.N.; Chai, L.C.; You, L.; Sanny, M. Dietary exposure to acrylamide among the Malaysian adult population. Food Chem. Toxicol. 2024, 185, 114502. [Google Scholar]
  33. Wong, W.W.K.; Chung, S.W.C.; Lam, C.-H.; Ho, Y.Y.; Xiao, Y. Dietary exposure of Hong Kong adults to acrylamide: Results of the first Hong Kong Total Diet Study. Food Add. Contam. Part A 2014, 31, 799–805. [Google Scholar]
  34. Food Safety Commission of Japan. Acrylamide in foods generated through heating. Food Saf. 2016, 4, 74–88. [Google Scholar]
  35. Zhu, F.; Wang, Y.; Liu, H.; Lyu, B.; Chen, D.; Li, J.; Ji, W.; Zhao, Y.; Wu, Y. Exposure to Acrylamide in the Sixth Total Diet Study—China, 2016–2019. China CDC Wkly. 2022, 4, 161–164. [Google Scholar] [CrossRef]
  36. Mojska, H.; Gieleciśska, I.; Szponar, L.; Ołtarzewski, M. Estimation of the dietary acrylamide exposure of the Polish population. Food Chem. Toxicol. 2010, 48, 2090–2096. [Google Scholar] [CrossRef] [PubMed]
  37. Kito, K.; Ishihara, J.; Yamamoto, J.; Hosoda, T.; Kotemori, A.; Takachi, R.; Nakamura, K.; Tanaka, J.; Yamaji, T.; Shimazu, T.; et al. Variations in the estimated intake of acrylamide from food in the Japanese population. Nutr. J. 2020, 19, 17. [Google Scholar] [CrossRef]
  38. Liu, Z.; Tse, L.A.; Ho, S.C.; Wu, S.; Chen, B.; Chan, D.; Wong, S.Y. Dietary acrylamide exposure was associated with increased cancer mortality in Chinese elderly men and women: A 11-year prospective study of Mr. and Ms. OS Hong Kong. J. Cancer Res. Clin. Oncol. 2017, 143, 2317–2326. [Google Scholar]
  39. Tran, N.; Barraj, L.; Murphy, M.; Bi, X. Dietary acrylamide exposure and hemoglobin adducts—National Health and Nutrition Examination Survey (2003–04). Food Chem. Toxicol. 2010, 48, 3098–3108. [Google Scholar] [CrossRef] [PubMed]
  40. Pelucchi, C.; Rosato, V.; Bracci, P.M.; Li, D.; Neale, R.E.; Lucenteforte, E.; Serraino, D.; Anderson, K.E.; Fontham, E.; Holly, E.A.; et al. Dietary acrylamide and the risk of pancreatic cancer in the International Pancreatic Cancer Case–Control Consortium (PanC4). Ann. Oncol. 2017, 28, 408–414. [Google Scholar]
  41. Lujan-Barroso, L.; González, C.A.; Slimani, N.; Obón-Santacana, M.; Ferrari, P.; Freisling, H.; Overvad, K.; Clavel-Chapelon, F.; Boutron-Ruault, M.-C.; Racine, A.; et al. Dietary intake of acrylamide and esophageal cancer risk in the European Prospective Investigation into Cancer and Nutrition cohort. Cancer Causes Control 2014, 25, 639–646. [Google Scholar] [CrossRef]
  42. Gao, J.; Zhao, Y.F.; Zhu, F.; Ma, Y.J.; Li, X.W.; Miao, H.; Wu, Y. Dietary exposure of acrylamide from the fifth Chinese Total Diet Study. Food Chem. Toxicol. 2016, 87, 97–102. [Google Scholar] [CrossRef]
  43. Mititelu, M.; Udeanu, D.I.; Docea, A.O.; Tsatsakis, A.; Calina, D.; Arsene, A.L.; Nedelescu, M.; Neacsu, S.M.; Velescu, B.S.; Ghica, M. New method for risk assessment in environmental health: The paradigm of heavy metals in honey. Environ. Res. 2023, 236, 115194. [Google Scholar]
  44. Health Canada. 2012. Health Canada’s Revised Exposure Assessment of Acrylamide in Food. Available online: https://www.canada.ca/content/dam/hc-sc/migration/hc-sc/fn-an/alt_formats/pdf/securit/chem-chim/food-aliment/acrylamide/rev-eval-exposure-exposition-eng.pdf (accessed on 7 October 2024).
  45. Geraets, L.; te Biesebeek, J.D.; van Donkersgoed, G.; Koopman, N.; Boon, P.E. The Intake of Acrylamide, Nitrate and Ochratoxin A in People Aged 7 to 69 Living in The Netherlands; RIVM Letter Report: 2014-0002; National Institute for Public Health and the Environment: Bilthoven, The Netherlands, 2014. Available online: https://www.rivm.nl/bibliotheek/rapporten/2014-0002.pdf (accessed on 20 July 2024).
  46. Sirot, V.; Hommet, F.; Tard, A.; Leblanc, J.C. Dietary acrylamide exposure of French population: Results of the second French Total Study. Food Chem. Toxicol. 2012, 50, 889–894. [Google Scholar]
  47. Liao, K.W.; Chang, F.C.; Chang, C.H.; Huang, Y.F.; Pan, W.H.; Chen, M.L. Associating acrylamide internal exposure with dietary pattern and health risk in the general population of Taiwan. Food Chem. 2022, 374, 131653. [Google Scholar] [CrossRef] [PubMed]
  48. Vryonidis, E.; Törnqvist, M.; Myhre, O.; Dirven, H.; Husøy, T. Dietary intake of acrylamide in the Norwegian EuroMix biomonitoring study: Comparing probabilistic dietary estimates with haemoglobin adduct measurements. Food Chem. Toxicol. 2023, 180, 114031. [Google Scholar] [PubMed]
Figure 1. LC chromatograms and mass spectra of acrylamide isotopically labelled with 13C3 used as an internal standard (a) and acrylamide (b).
Foods 14 01073 g001
Figure 2. Percentage of foods and meals with acrylamide concentrations exceeding the LOQ and their distribution in the dishes that make up the daily diet in both senior center canteens.
Foods 14 01073 g002
Figure 3. Daily intake of acrylamide in the evaluated senior center canteens. Lower exposure scenario (LB); Higher exposure scenario (UB); Week (W). * The symbol between bars denotes statistical differences between centers (p < 0.05).
Foods 14 01073 g003
Table 1. (AD) Different menus gathered from senior centers.
(A) Menus from Senior Center 1, Week 1
BreakfastLunchAfternoon SnackDinner
MondayMilk
Instant decaffeinated coffee
Muffin
Stewed beans
Breaded dab with French fries
Orange
Bread
Milk
Instant cocoa
Biscuits
Cauliflower gratin
Breaded pork fillet with ham and cheese
Yogurt
Whole wheat bread
TuesdayMilk
Instant decaffeinated coffee
Toasted bread with oil/butter
Soup
Typical chickpea stew made with pork and beef meat and vegetables
Banana
Bread
Milk
Instant cocoa
Biscuits
Carrot puree
Breaded eggs with bechamel sauce and sautéed vegetables
Yogurt
Whole wheat bread
WednesdayMilk
Instant decaffeinated coffee
Muffin
Breadcrumbs with pork meat and vegetables
Salmon stew with vegetables
Apple
Bread
Milk
Instant cocoa
Biscuits
Pork and beef meat and vegetable soup
Breaded chicken with French fries
Yogurt
Whole wheat bread
ThursdayMilk
Instant decaffeinated coffee
Muffin
Noodles with pork meat and vegetables
Breaded tilapia with salad
Apple
Bread
Milk
Instant cocoa
Biscuits
Vegetable puree
Spanish omelet with roasted red peppers
Yogurt
Whole wheat bread
FridayMilk
Instant decaffeinated coffee
Toasted bread with oil/butter
Rice with pork meat and vegetables
Chicken and garlic stew with French fries
Apple
Bread
Milk
Instant cocoa
Biscuits
Sautéed green beans
Assorted cold cuts
Yogurt
Whole wheat bread
(B) Menus from Senior Center 1, Week 2
BreakfastLunchAfternoon SnackDinner
MondayMilk
Instant decaffeinated coffee
Muffin
Stewed lentils
Breaded ham with bechamel sauce and salad
Pear
Bread
Milk
Instant cocoa
Biscuits
Fish soup
Spanish omelet with roasted red peppers
Yogurt
Whole wheat bread
TuesdayMilk
Instant decaffeinated coffee
Muffin
Rice with chicken
Stewed pork with tomato and vegetables
Banana
Bread
Milk
Instant cocoa
Biscuits
Sautéed vegetables
Breaded tilapia with French fries
Yogurt
Whole wheat bread
WednesdayMilk
Instant decaffeinated coffee
Toasted bread with oil/butter
Soup
Typical chickpea stew made with pork and beef meat and vegetables
Pear
Bread
Milk
Instant cocoa
Biscuits
Breaded squid
Tomato salad
Yogurt
Whole wheat bread
ThursdayMilk
Instant decaffeinated coffee
Muffin
Macaroni with pork meat and tomato
Fried eggs with French fries
Apple
Bread
Milk
Instant cocoa
Biscuits
Assorted cold cuts
Yogurt
Whole wheat bread
FridayMilk
Instant decaffeinated coffee
Muffin
Stewed beans
Breaded hake with sautéed vegetables
Banana
Bread
Milk
Instant cocoa
Biscuits
Mackerel with roasted red peppers
Yogurt
Whole wheat bread
(C) Menus from Senior Center 2, Week 1
BreakfastLunchAfternoon SnackDinner
MondayFruit juice
Milk
Instant decaffeinated coffee
Mix of cereals and dairy products
Mixed salad
Rice with pork meat, fish and vegetables
Profiteroles
Bread
Milk
Instant cocoa
Bakery products
Tomato soup
Tuna omelet
Mandarin oranges
Bread
TuesdayFruit juice
Milk
Instant decaffeinated coffee
Mix of cereals and dairy products
Stewed beans
Tuna patties with salad
Pear
Bread
Milk
Instant cocoa
Bakery products
Zucchini puree
Fried anchovies with roasted pepper salad
Yogurt
Bread
WednesdayFruit juice
Milk
Instant decaffeinated coffee
Mix of cereals and dairy products
Roasted vegetables
Potato stew with beef meat
Yogurt
Bread
Milk
Instant cocoa
Bakery products
Rice soup
Fresh cheese with quince jam
Mandarin orange
Bread
ThursdayFruit juice
Milk
Instant decaffeinated coffee
Mix of cereals and dairy products
Fideuá with seafood
Breaded pork fillet with ham and cheese
Banana
Bread
Milk
Instant cocoa
Bakery products
Mushroom cream
Breaded hake with oven-baked potatoes
Roasted apple
Bread
FridayFruit juice
Milk
Instant decaffeinated coffee
Mix of cereals and dairy products
Seafood soup
Fried eggs with sautéed vegetables
Custard
Bread
Milk
Instant cocoa
Bakery products
Sautéed red cabbage
Zucchini omelet
Yogurt
Bread
(D) Menus from Senior Center 2, Week 2
BreakfastLunchAfternoon SnackDinner
MondayFruit juice
Milk
Instant decaffeinated coffee
Mix of cereals and dairy products
Stewed lentils
Ham croquettes with salad
Pear
Bread
Milk
Instant cocoa
Bakery products
Vegetable soup
Breaded cod
Apple pie
Bread
TuesdayFruit juice
Milk
Instant decaffeinated coffee
Mix of cereals and dairy products
Stuffed eggplants with pork meat
Potato stew with fish and seafood
Yogurt
Bread
Milk
Instant cocoa
Bakery products
Vegetable puree
Roasted ham with oven-baked potatoes
Mandarin orange
Bread
WednesdayFruit juice
Milk
Instant decaffeinated coffee
Mix of cereals and dairy products
Roasted red pepper salad
Macaroni with tuna
Banana
Bread
Milk
Instant cocoa
Bakery products
Pork and beef meat and vegetable soup
Vegetable omelet
French toast
Bread
ThursdayFruit juice
Milk
Instant decaffeinated coffee
Mix of cereals and dairy products
Soup
Typical chickpea stew made with pork and beef meat and vegetables
Custard
Bread
Milk
Instant cocoa
Bakery products
Scrambled eggs with mushrooms
Baked mako shark with oven-baked potatoes
Mandarin orange
Bread
FridayFruit juice
Milk
Instant decaffeinated coffee
Mix of cereals and dairy products
Mixed salad
Rice with pork meat, fish and vegetables
Mandarin orange
Bread
Milk
Instant cocoa
Bakery products
Tomato soup
Stewed chicken with vegetables and French fries
Yogurt
Bread
Table 2. (A,B). Acrylamide content (µg/kg), edible serving (g), and acrylamide contribution (µg/serving) in foods/meals compounding menus provided by senior centers.
(A) Senior Center 1
MealFoodsnFoodEx2 CodeAcrylamide Content
(µg/kg)
Edible Serving
(g)
Acrylamide Contribution
(µg/Serving)
Breakfast and afternoon snackInstant decaffeinated coffee10A03GR2831 ± 18125.7 ± 0.4
Instant cocoa10A03HG261 ± 30143.6 ± 0.4
Muffins7A00BC21 ± 5310.9 ± 0.1
Toasted bread3A006D34 ± 7230.8 ± 0.2
Biscuits10A009X122 ± 120212.7 ± 2.7
Lunches and dinnersStewed beans2A03VT33 ± 2541311.6 ± 5.4
Stewed lentils1A00QD#F28. A07GM272827.6
Carrot puree1A03XY#F04. A05JG314112.5
Pork and beef meat and vegetable soup1A041V224329.4
Fish soup1A041X4035314.2
Typical chickpea stew made with pork and beef meat and vegetables2A03VK#F04. A00SL$F28. A07GM17 ± 43395.8 ± 0.1
Breadcrumbs with pork meat and vegetables1A007A#F04. A022Y$F04. A00HC$F04. A05CN$F04. A05CP$F28. A07GT10115615.8
Breaded ham with bechamel sauce1A022T#F04. A043X$F28. A07HK331173.8
Breaded pork fillet with ham and cheese1A03XD24862.1
Breaded eggs with bechamel sauce1A032B#F04. A043X$F28. A07HK231052.4
Breaded chicken1A01SP#F28. A07HK$F28. A07GS261022.6
Spanish omelet2A03YN#F28. A00ZT161 ± 613421.6 ± 0.1
Roasted red peppers2A05CN#F28. A07GX160 ± 10426.7 ± 0.3
French fries5A0BYV213 ± 1586913.9 ± 11.9
Whole wheat bread10A005E29 ± 7491.4 ± 0.5
Bread10A004Y28 ± 0.6481.3 ± 0.1
(B) Senior center 2
MealFoodsnFoodEx2 codeAcrylamide Content
(µg/kg)
Edible Serving
(g)
Acrylamide Contribution
(µg/Serving)
Breakfast and afternoon snackInstant decaffeinated coffee10A03GR192 ± 420.4 ± 0.1
Instant cocoa10A03HG20 ± 2100.2 ± 0.1
Mix of cereals and dairy products10A06DX45 ± 21245.5 ± 0.2
Lunches and dinnersStuffed eggplants with pork meat1A03YF#F04. A00JD$F04. A049S$F04. A16FE3629010.5
Stewed beans1A03VT234059.2
Seafood soup1A03XK2955516.1
Tomato soup2A041N26 ± 1548614.0 ± 12.3
Tuna patties1A0FBT#F02. A00CC04. A00ZD411044.2
Breaded pork fillet with ham and cheese1A03XD321013.2
Vegetable omelet1A03YQ651509.8
Zucchini omelet1A03YN#F04. A00JR551809.9
Rice with pork meat, fish and vegetables2A041D25 ± 53358.4 ± 2.5
Sautéed vegetables1A03YD253097.7
Oven-baked potatoes3A011R20 ± 91062.0 ± 0.6
French fries1A0BYV3049027.3
Apple pie1A00BA#F04. A01DJ30932.8
The data are presented as mean ± SD. The variable “n” represents the number of times the food/meal was collected throughout the study period. Only dishes with acrylamide concentrations > LOQ (15 µg/kg) are shown (47 out of 156 foods/meals analyzed in senior center 1 and 82 out of 148 foods/meals analyzed in senior center 2). SD is not provided when n = 1, as only one portion of the food was analyzed. All servings were edible.
Table 3. (A,B). Edible serving (g) and acrylamide contribution (µg/serving) in foods/meals compounding menus provided by the canteens of the senior centers with acrylamide content < LOQ (applied in the upper exposure scenario).
(A) Senior Center 1
MealFoodsnFoodEx2 CodeEdible Serving
(g)
Acrylamide Contribution
(µg/Serving)
Lunches and dinnersNoodles with pork meat and vegetables1A041V#F04. A007D5277.9
Rice with pork meat and vegetables1A041J3054.6
Rice with chicken1A041H3625.4
Macaroni with pork meat and tomato1A040Q#F04. A049S$F04. A16FE3685.5
Sautéed vegetables1A03YD3224.8
Vegetable puree1A03XY3675.5
Cauliflower gratin1A03YF#F04. A00FR2163.2
Sautéed green beans1A00PG#F28. A07GT1862.8
Breaded dab1A02AS#F28. A07HK$F28. A07GS671.0
Salmon stew with vegetables1A028P#F04. A044E1372.0
Breaded tilapia2A028A#F28. A07HK$F28. A07GS681.0 ± 0.1
Chicken and garlic stew1A01SP#F04. A045A$F28. A07GM1141.7
Stewed pork with tomato and vegetables1A03VK1692.5
Fried eggs1A032C450.7
Breaded hake1A02CB #F28. A07HK841.3
Sautéed vegetables2A03YD1191.8 ± 0.3
Breaded squid1A02JJ#F28. A07HL$F28. A07GV771.2
Mackerel with roasted red peppers1A02CR#F04. A05CNA05CN$F28. A07GX991.5
(B) Senior center 2
MealFoodsnFoodEx2 codeEdible Serving
(g)
Acrylamide Contribution
(µg/Serving)
Lunches and dinnersRoasted vegetables1A03YF1692.5
Roasted red pepper salad1A042D#F04. A05CN1502.3
Potato stew with beef meat1A03VJ3605.4
Fideuá with seafood1A040Q#F04. A0EYX2293.4
Sautéed red cabbage1A00GA#F28. A07GT1792.7
Stewed lentils1A00QD#F04. A025C$F28. A07GM5127.7
Potato stew with fish and seafood1A03XQ#F04. A0EYX4176.3
Roasted pepper salad1A05CN#F28. A07GX1612.4
Zucchini pure1A03XY#F04. A00JR4296.4
Mushroom cream1A03XY#F04. A00TQ4516.8
Vegetable soup1A041S3064.6
Vegetable puree1A03XY3925.9
Pork and beef meat and vegetable soup1A041V3595.4
Roasted ham1A023K620.9
Fried eggs1A032C1221.8
Ham croquettes1A022TA022T#F04. A043X$F28. A07HL$F28. A07GS1241.9
Macaroni with tuna1A007S#F04. A0FBT2854.3
Typical chickpea stew made with pork and beef meat and vegetables1A03VK#F04. A00SL$F28. A07GM3034.5
Tuna omelet1A03YN#$F04. A0FBT851.3
Fried anchovies1A02DD#F28. A07GS410.6
Quince jam1A01DR#F28. A07JQ661.0
Breaded hake1A02CB#F28. A07HK$F28. A07GS911.4
Breaded cod1A02BV#F28. A07HK$F28. A07GS1852.8
Scrambled eggs with mushrooms1A03YN#$F04. A00TQ2613.9
Baked mako shark1A052E#F28. A07GX1452.2
Stewed chicken with vegetables1A03VK#F04. A01SP2133.2
Roasted apple1A01DJ#F28. A07GX1141.7
Profiteroles1A00AK580.9
French toast1A0DRD#F04. A02LT$F04. A 0BY6$F04. A019V$F28. A07GV1322.0
Custard1A02PX1201.8 ± 0.1
Bread20A004Y450.7 ± 0.1
Afternoon snackBakery products10A009T350.5 ± 0.1
The acrylamide concentration in all samples was below the LOQ but above the LOD, so each was assigned a value of 15 μg/kg. The variable “n” refers to the number of times the food was consumed during the two-week testing period. SD is not provided when n = 1, as only one portion of the food was analyzed.
Table 4. Minimum and maximum relative contribution of food groups to the total daily acrylamide intake (%) in senior center canteens for both lower and upper exposure scenarios.
Lower Exposure Scenario
Coffee
(%)
Cereal-Based Products (%)Potato-Based Dishes
(%)
Cocoa
(%)
Other Foods/Meals
(%)
Senior center 1
Week 111.8–17.38.0–20.70–53.57.6–11.10–58.0
Week 27.9–33.48.9–45.70–70.65.1–21.50–46.2
Senior center 2
Week 11.0–6.313.9–90.400.5–3.30–84.6
Week 21.0–4.413.8–63.30–68.30.5–2.30–61.6
Both centers1.0–33.48.0–90.40–70.60.5–21.50–84.6
Upper Exposure Scenario
Coffee
(%)
Cereal-Based Products (%)Potato-Based Dishes
(%)
Cocoa
(%)
Other Foods/Meals
(%)
Senior center 1
Week 19.2–15.37.7–19.30–42.75.9–9.920.1–59.7
Week 27.9–23.76.8–32.00–54.15.1–15.321.7–46.2
Senior center 2
Week 10.9–2.315.4–43.70–31.90.4–1.220.8–83.4
Week 20.8–1.714.7–32.10–54.20.4–0.930.0–71.2
Both centers0.8–23.76.8–43.70–54.20.4–15.320.1–83.4
Table 5. Acrylamide daily exposure from consuming menus served in senior center canteens and assessment of the associated risk.
WomenMen
LBUBLBUB
Senior center 1
Exposure range (µg/kg bw/day)0.52 ± 0.23 a0.62 ± 0.22 a0.47 ± 0.21 a0.55 ± 0.19 a
MOE for neurotoxic effects820691923307
MOE for neoplastic effects324273365777
Senior center 2
Mean exposure (µg/kg bw/day)0.28 ± 0.19 b0.46 ± 0.15 a0.25 ± 0.17 b0.41 ± 0.13 a
MOE for neurotoxic effects151993417081051
MOE for neoplastic effects600369675415
p value0.0210.0690.0210.069
Both centers
Mean exposure (µg/kg bw/day)0.40 ± 0.240.54 ± 0.200.36 ± 0.210.48 ± 0.18
MOE for neurotoxic effects10657951198894
MOE for neoplastic effects421314474353
Lower exposure scenario (LB). Upper exposure scenario (UB). Different letters represent statistically significant differences in exposure between centers for the same scenario (p < 0.05). Significant differences were not detected between the exposure of both sexes in any of the larger centers individually or combined (p > 0.05). Exposure data are expressed as mean ± SD.
Disclaimer/Publisher’s Note: The statements, opinions and data contained in all publications are solely those of the individual author(s) and contributor(s) and not of MDPI and/or the editor(s). MDPI and/or the editor(s) disclaim responsibility for any injury to people or property resulting from any ideas, methods, instructions or products referred to in the content.

