Assessment of Tenderness and Anthocyanin Content in Zijuan Tea Fresh Leaves Using Near-Infrared Spectroscopy Fused with Visual Features
Abstract
1. Introduction
2. Materials and Methods
2.1. Sample Preparation
2.2. Determination of Key Physicochemical Components in Zijuan Tea Fresh Leaves
2.2.1. Anthocyanin Extraction
2.2.2. UHPLC-Q-Exactive/MS Analysis
2.2.3. Standard Solution Preparation
2.2.4. Quantification of Anthocyanins in Zijuan Tea Fresh Leaves
2.3. Near-Infrared Spectral Acquisition and Spectral Preprocessing
2.4. Extraction of Visual Color and Texture Features
2.5. Data Fusion Strategies
2.6. Establishment of Tenderness Classification Models for Zijuan Tea Fresh Leaves
2.7. Development of Prediction Models for Key Anthocyanin Content in Zijuan Tea Fresh Leaves
2.8. Data Analysis Software
3. Results and Analysis
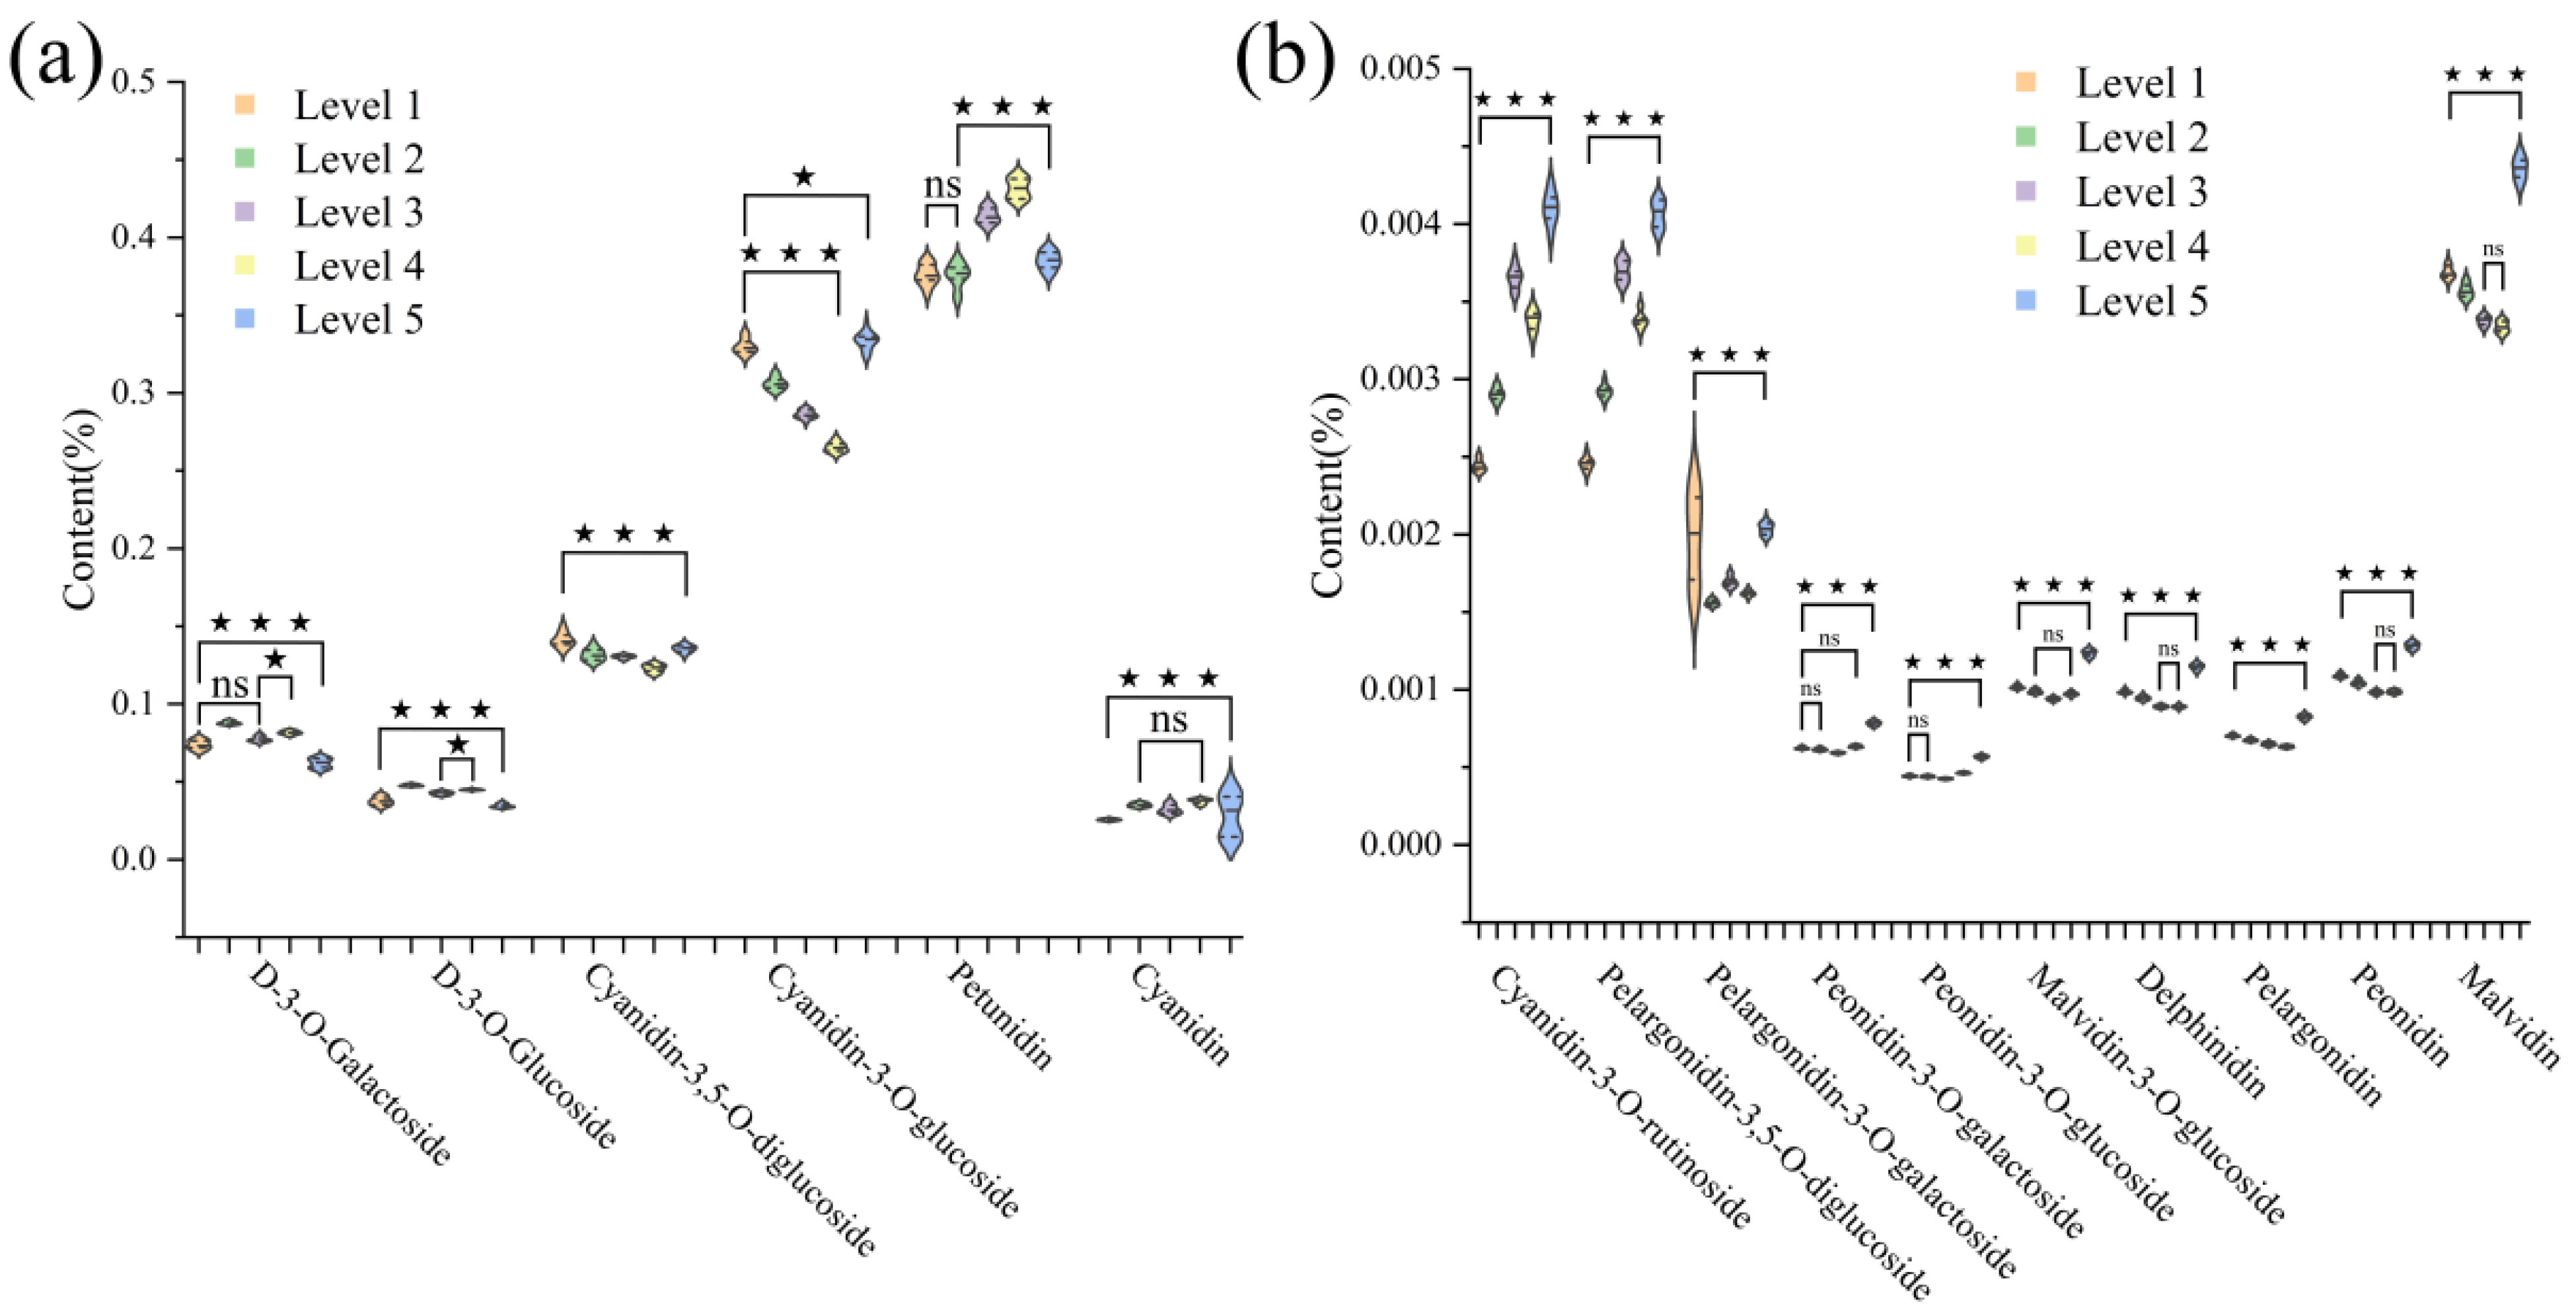
3.1. Analysis of Anthocyanin Content Differences in Zijuan Tea Fresh Leaves
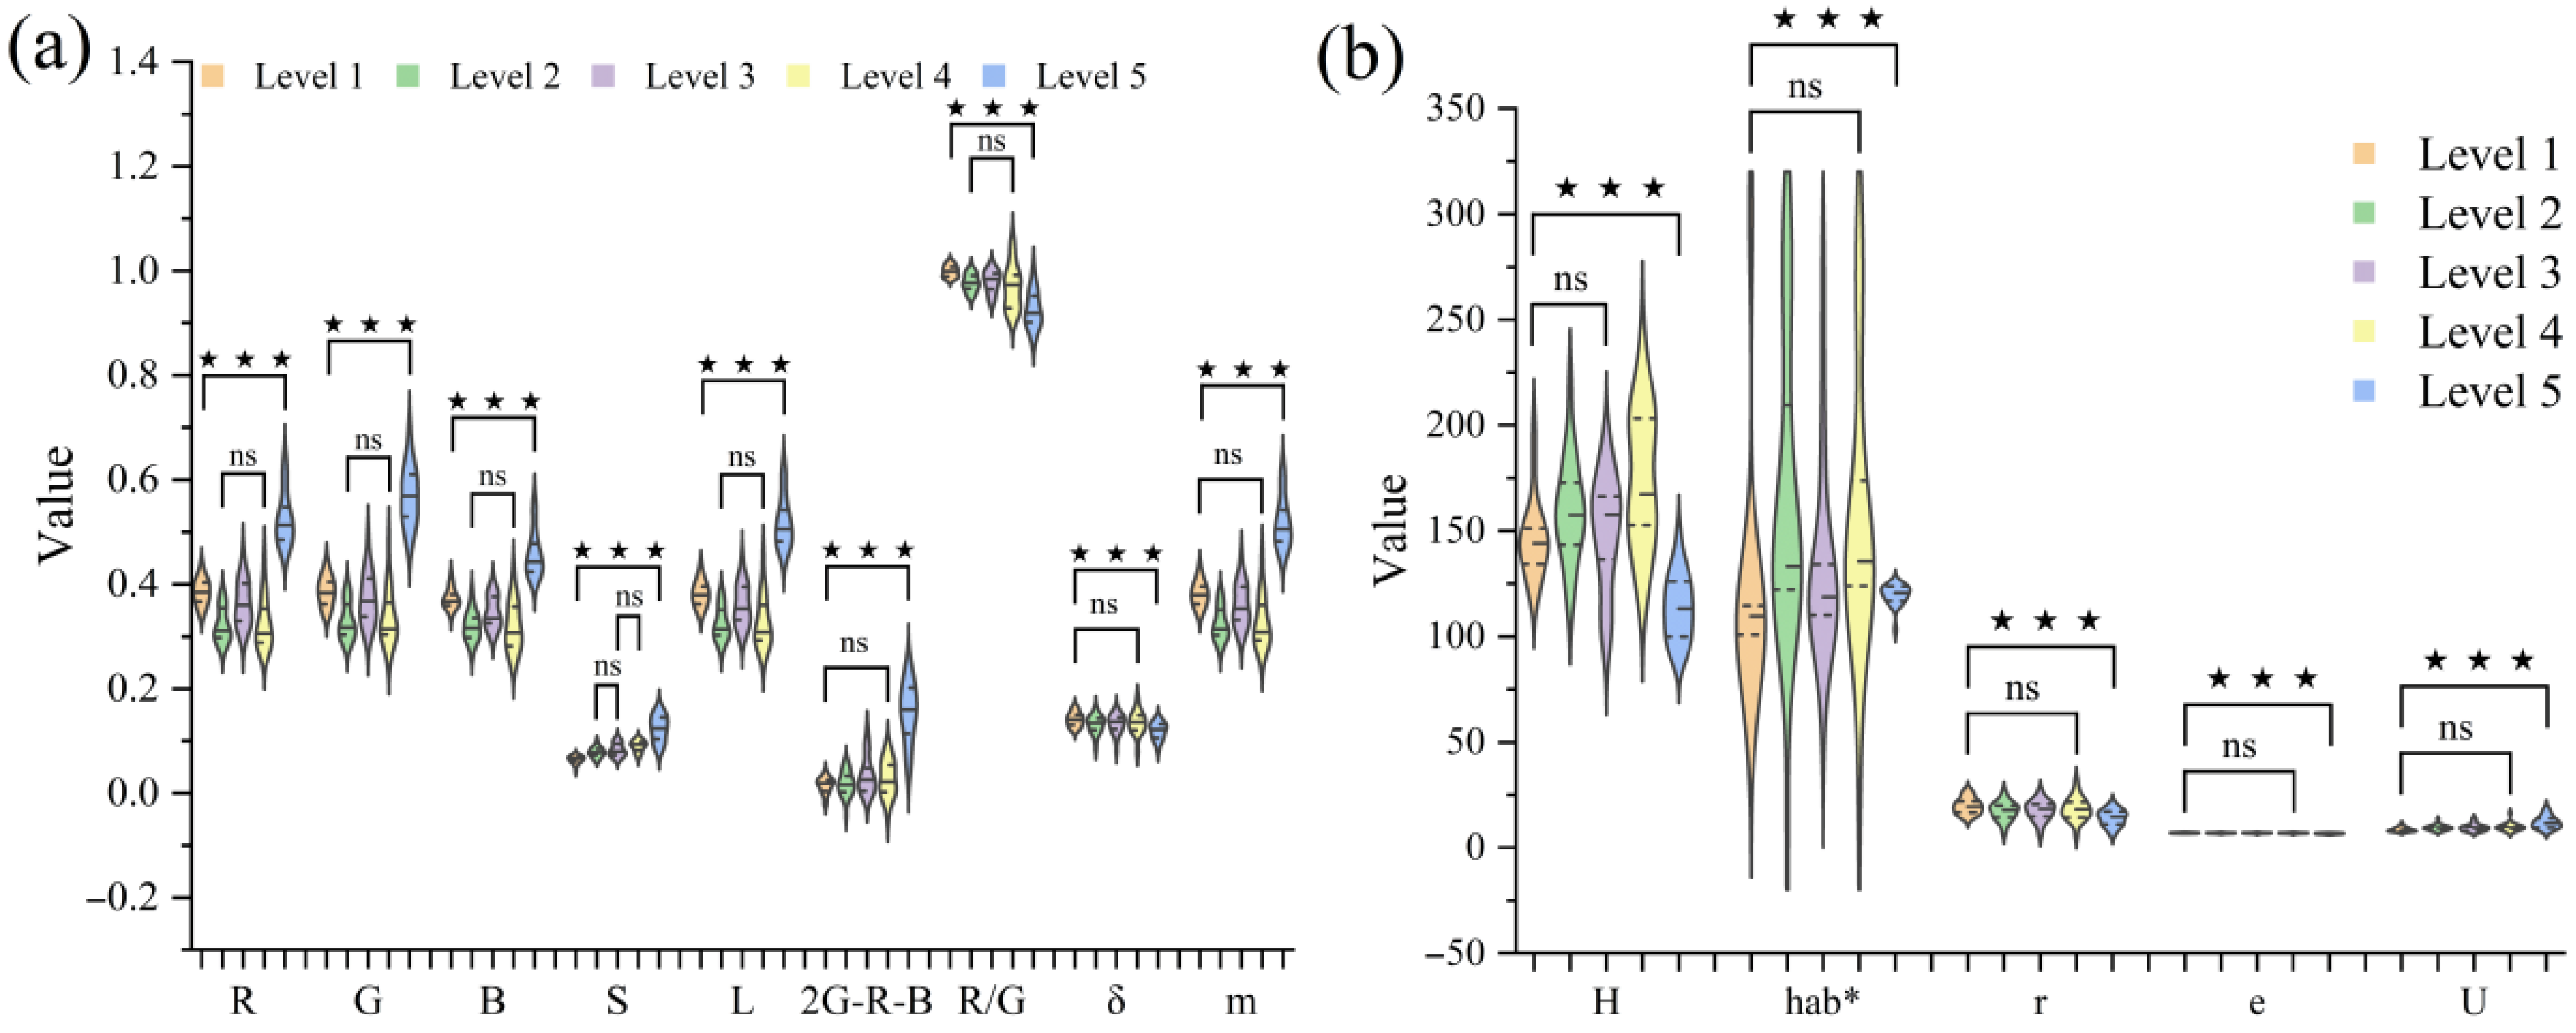
3.2. Analysis of Visual Color and Texture Features
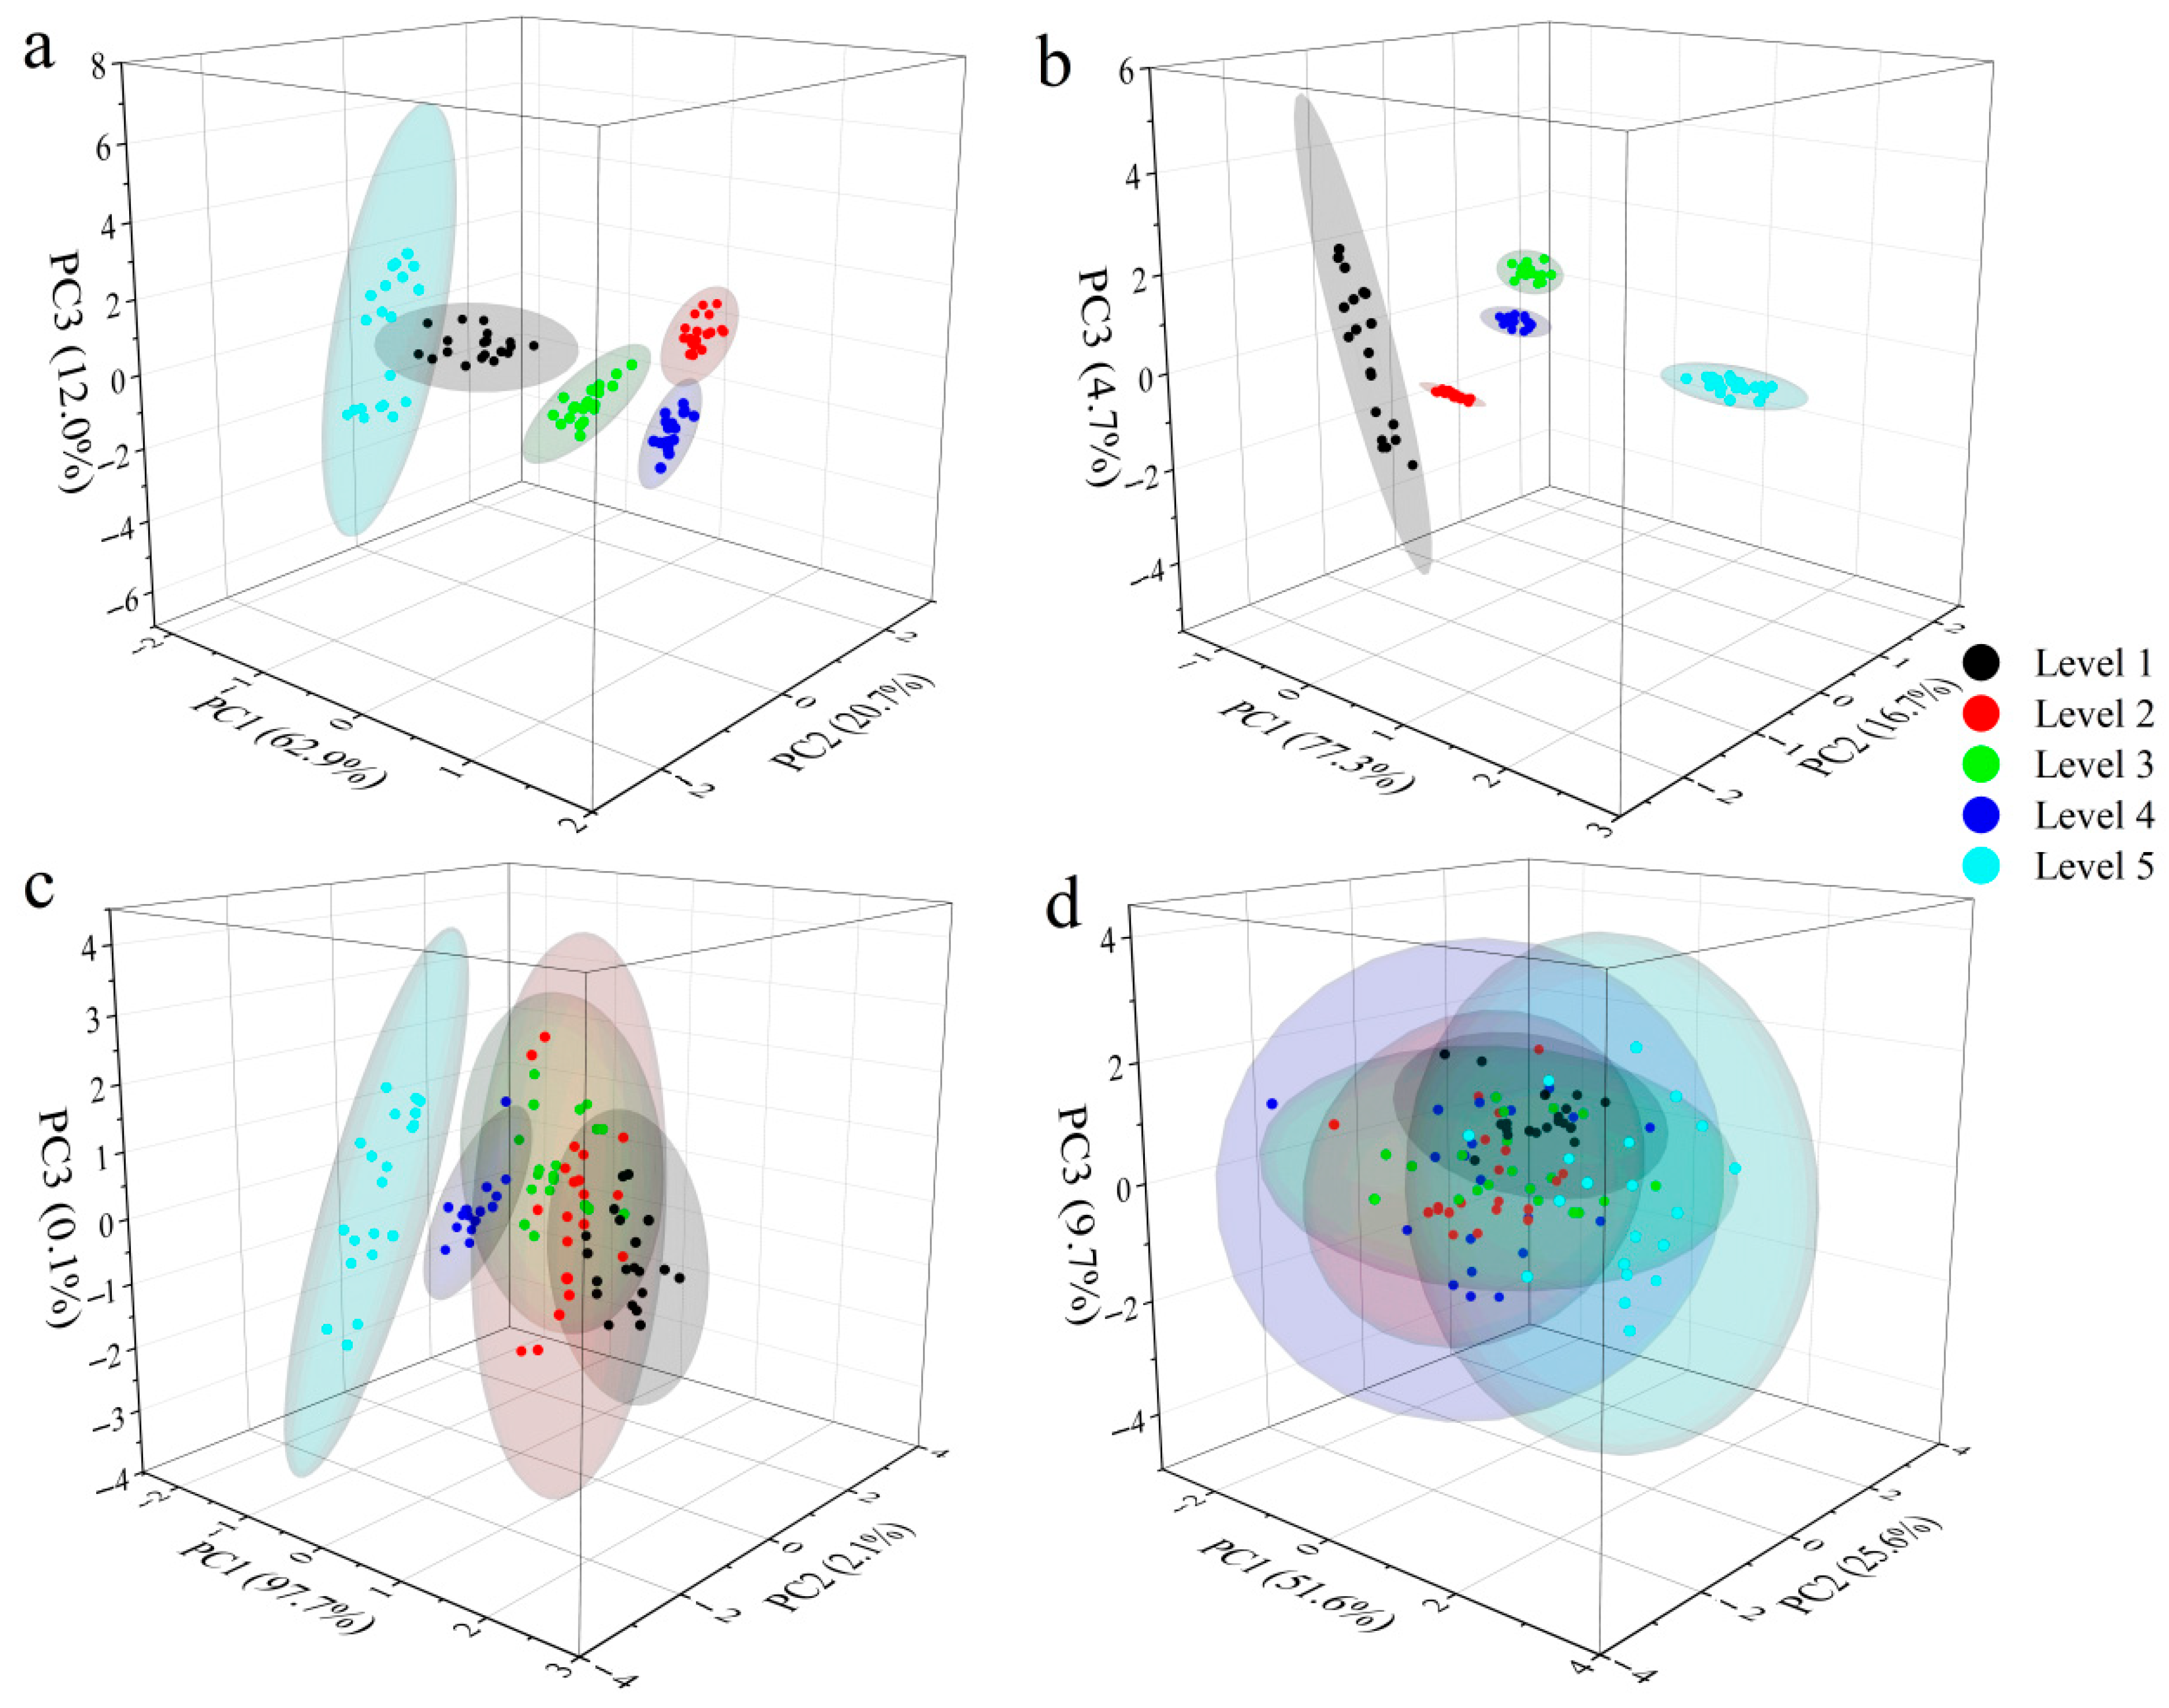
3.3. PCA Cluster Analysis
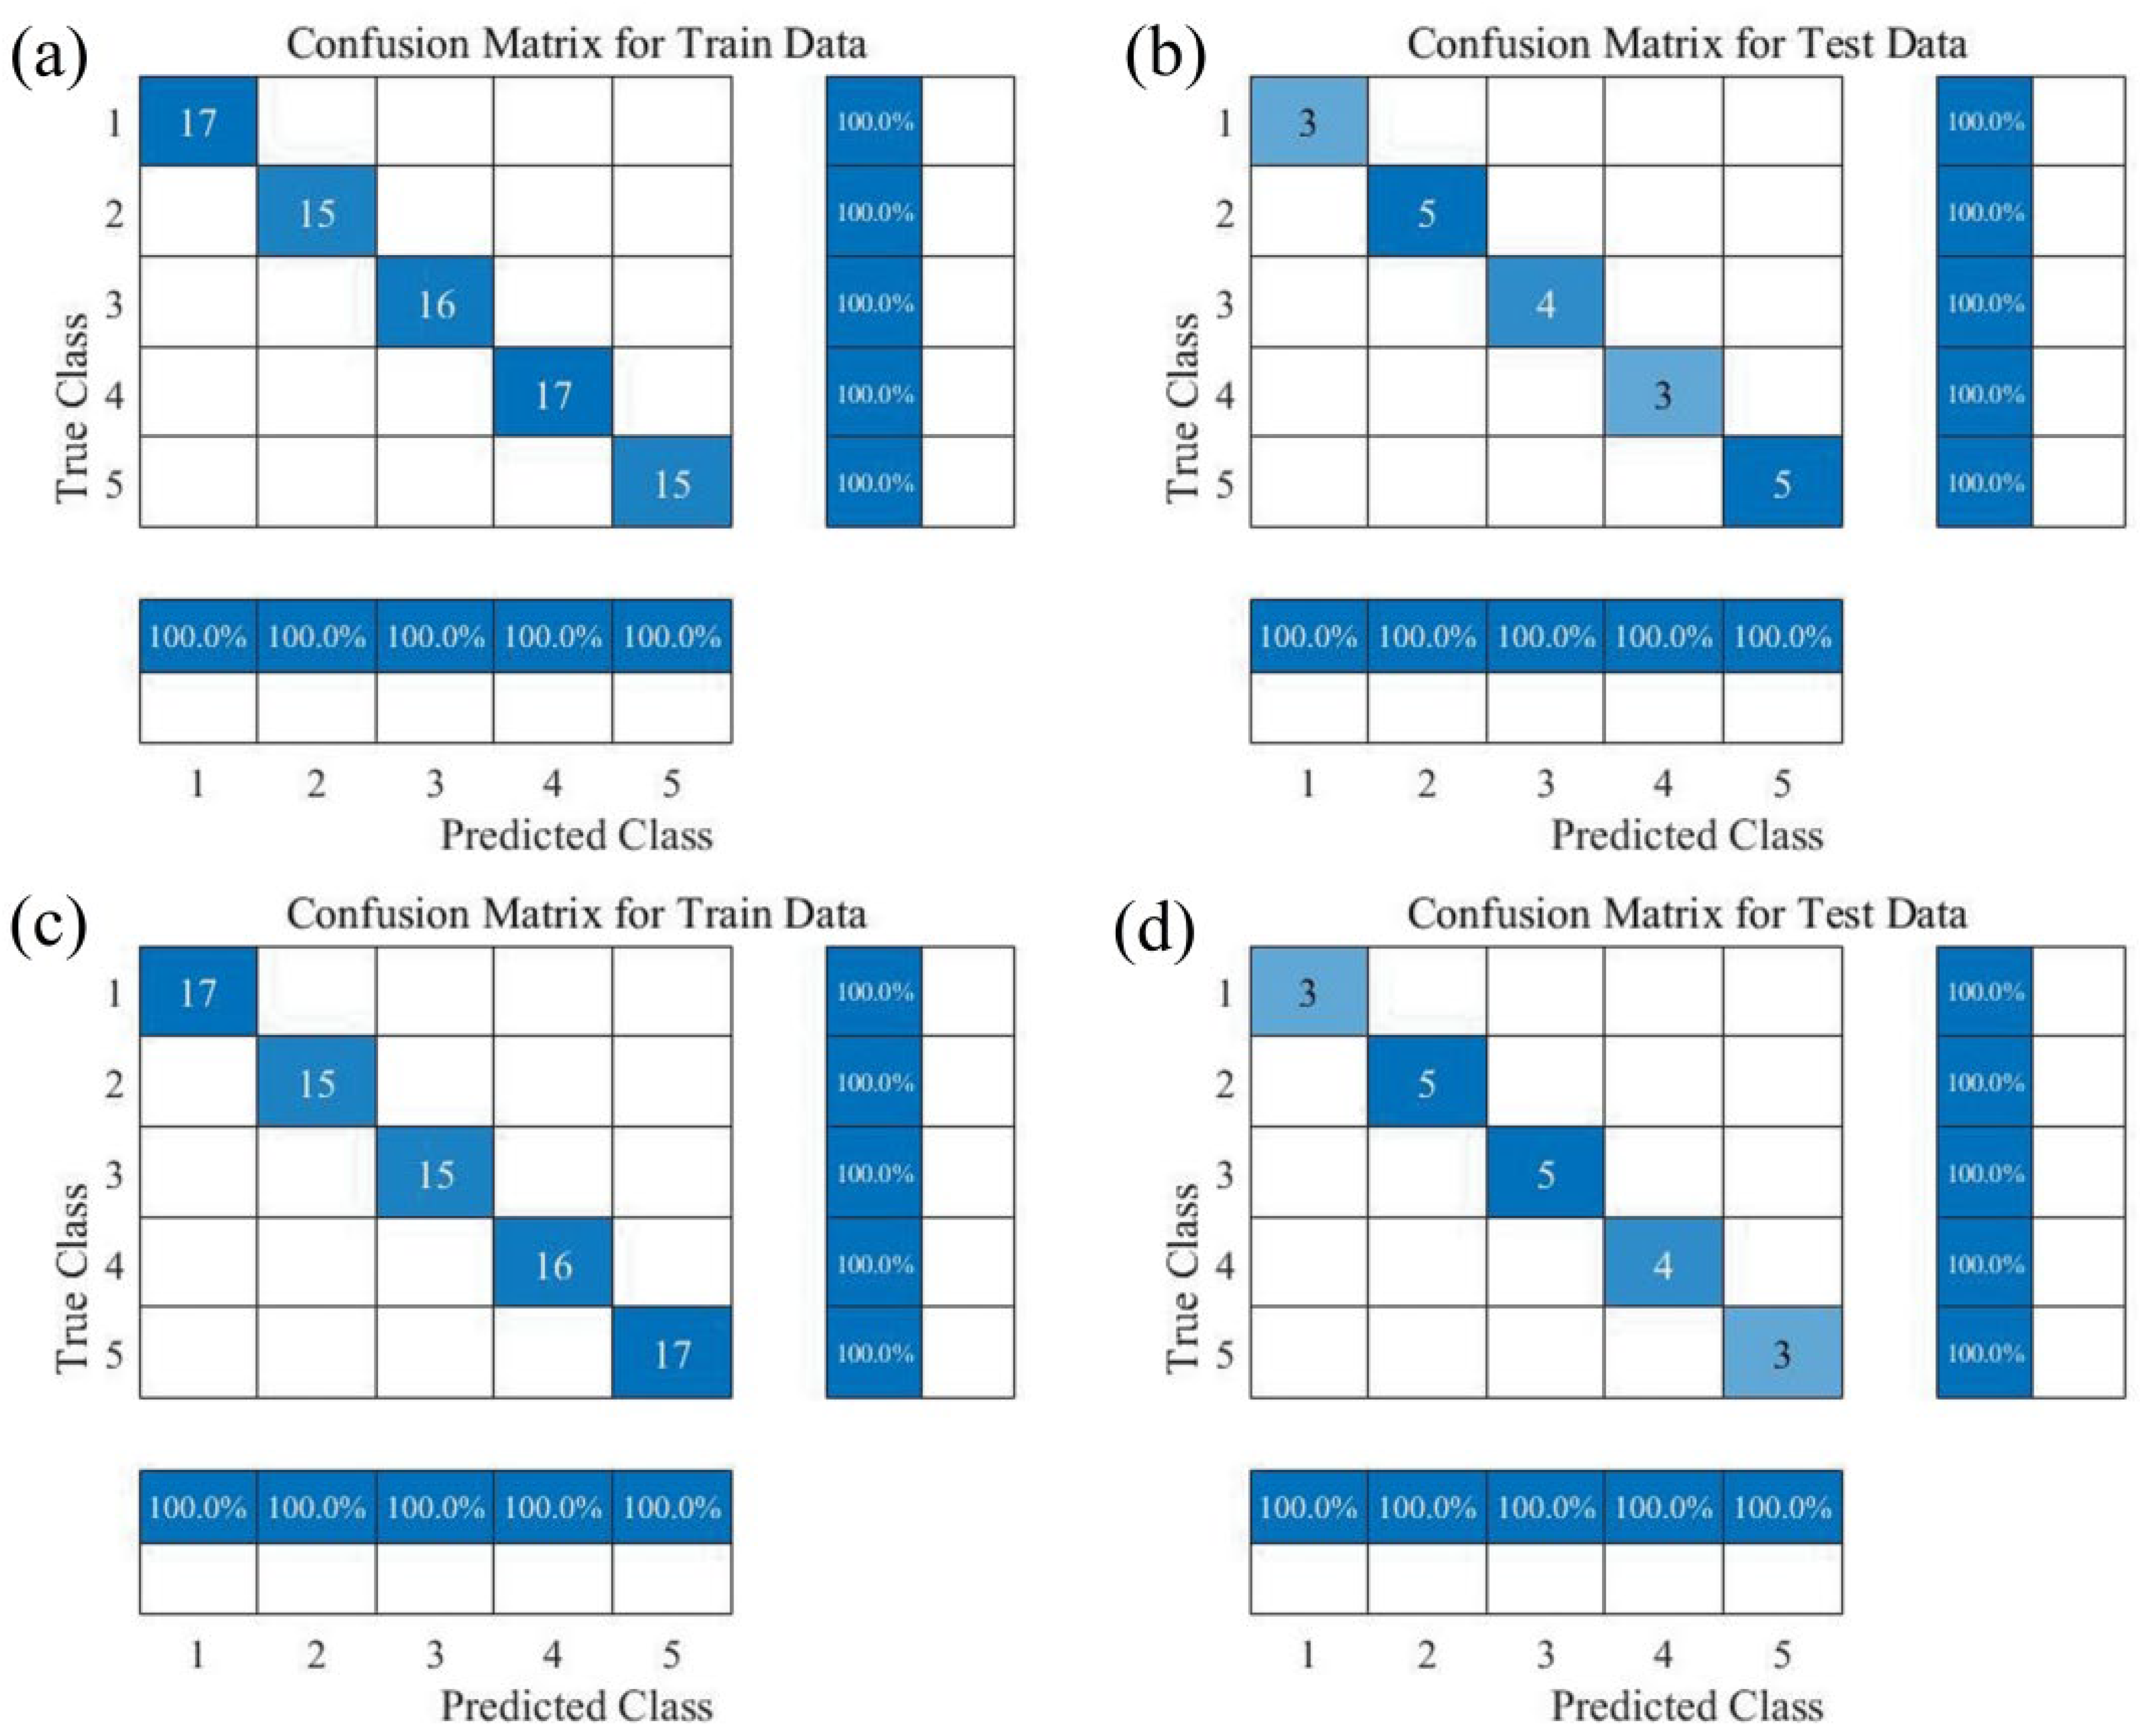
3.4. Preprocessing Near-Infrared Spectra of Zijuan Tea Fresh Leaves and Establishment of Tenderness Classification Models
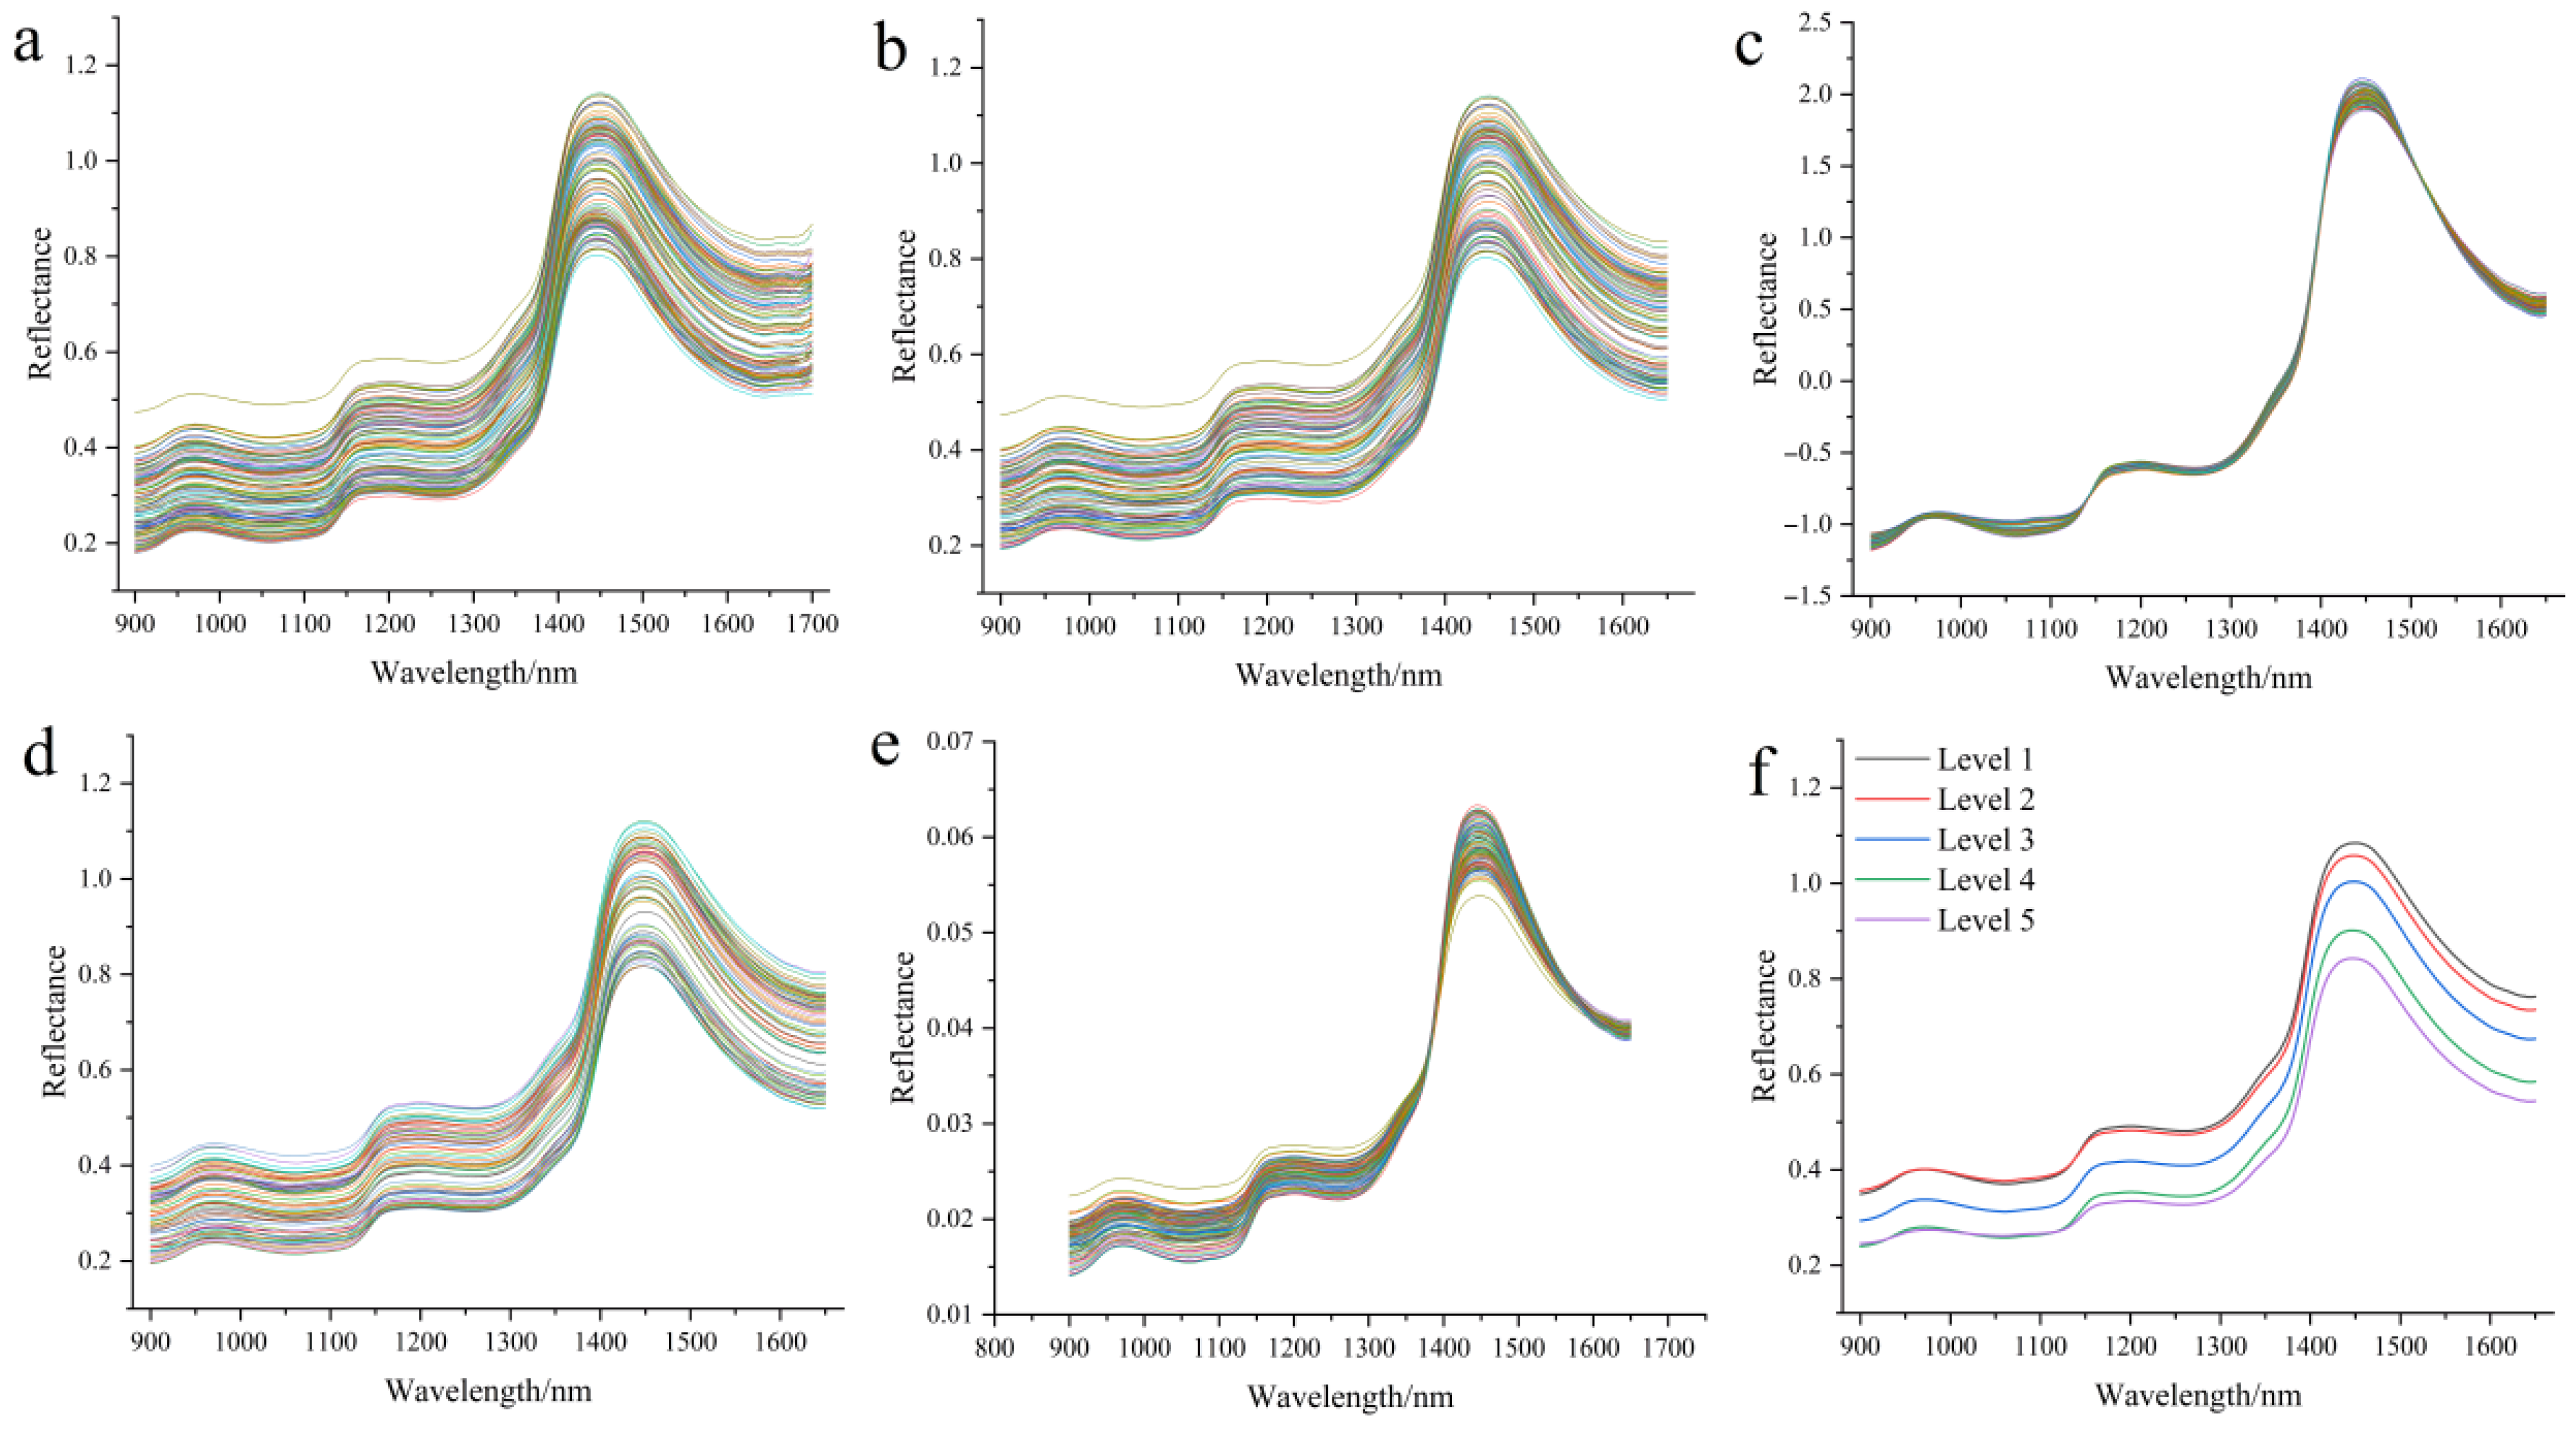
3.5. Analysis of Near-Infrared Spectra of Zijuan Tea Fresh Leaves and Optimization of Data Fusion Preprocessing
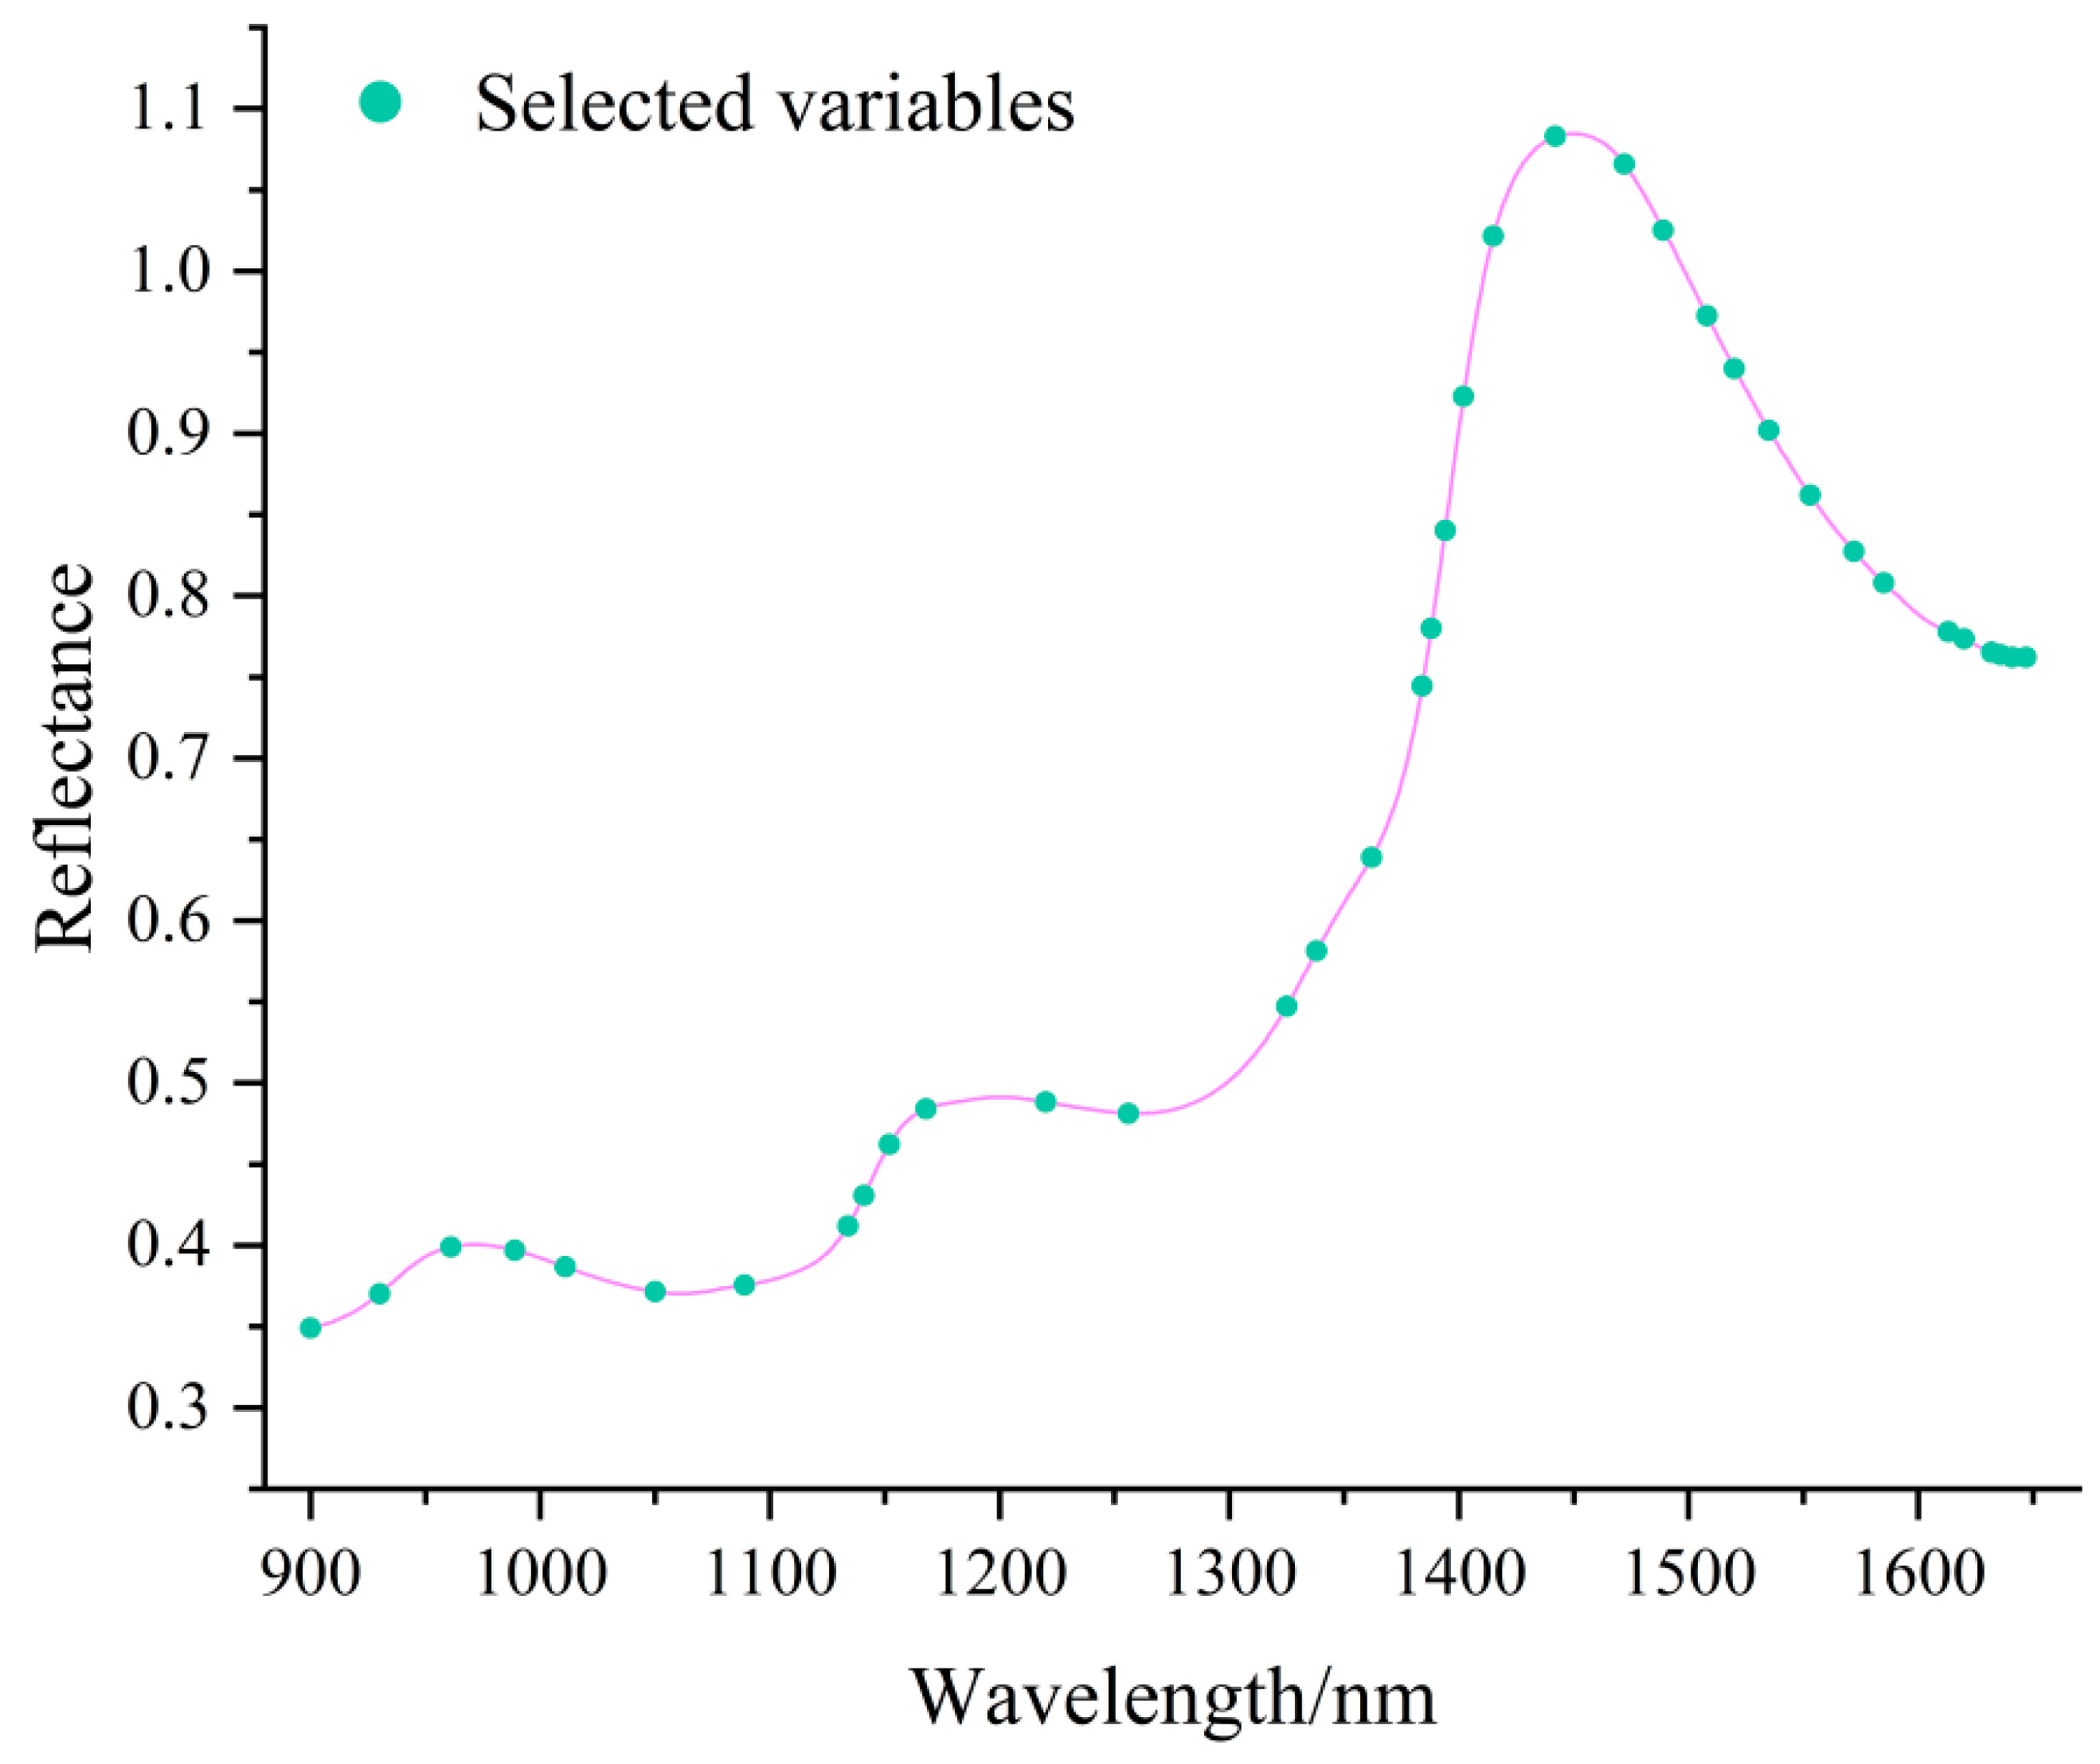
3.6. Near-Infrared Spectral Feature Band Selection
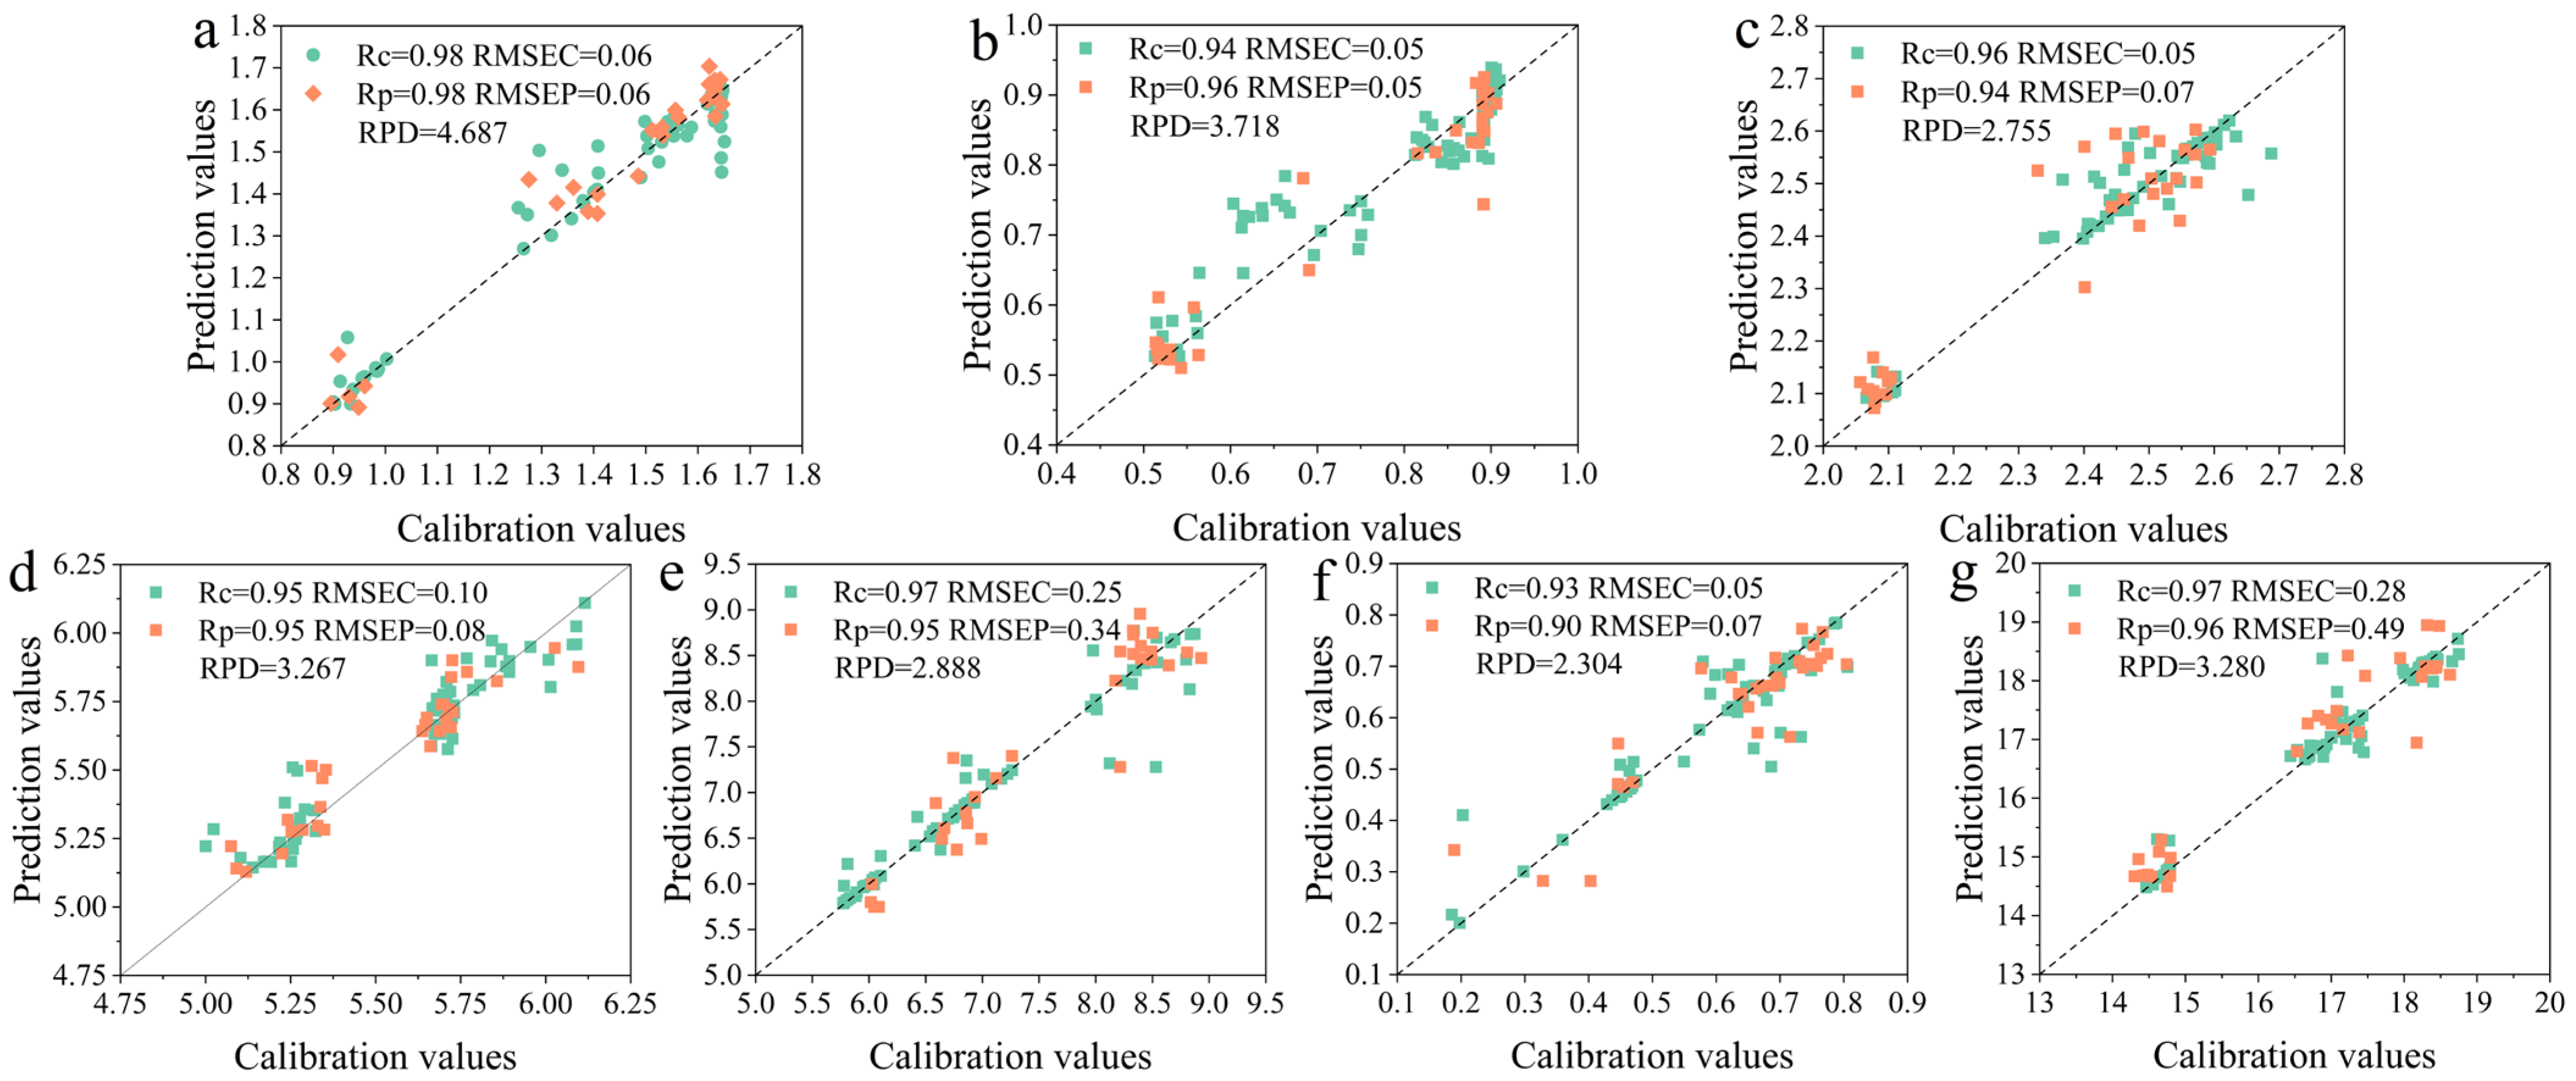
3.7. Optimization of Prediction Models for Key Anthocyanin Components
4. Conclusions
Supplementary Materials
Author Contributions
Funding
Data Availability Statement
Conflicts of Interest
References
- Wang, S.; Altaner, C.; Feng, L.; Liu, P.; Song, Z.; Li, L.; Gui, A.; Wang, X.; Ning, J.; Zheng, P. A review: Integration of NIRS and chemometric methods for tea quality control-principles, spectral preprocessing methods, machine learning algorithms, research progress, and future directions. Food Res. Int. 2025, 205, 115870. [Google Scholar] [CrossRef]
- Zou, C.; Li, R.-Y.; Chen, J.-X.; Wang, F.; Gao, Y.; Fu, Y.-Q.; Xu, Y.-Q.; Yin, J.-F. Zijuan tea- based kombucha: Physicochemical, sensorial, and antioxidant profile. Food Chem. 2021, 363, 130322. [Google Scholar] [CrossRef]
- Chen, Y.; Yang, J.; Meng, Q.; Tong, H. Non-volatile metabolites profiling analysis reveals the tea flavor of “Zijuan” in different tea plantations. Food Chem. 2023, 412, 135534. [Google Scholar] [CrossRef]
- Dai, F.; Shi, J.; Yang, C.; Li, Y.; Zhao, Y.; Liu, Z.; An, T.; Li, X.; Yan, P.; Dong, C. Detection of anthocyanin content in fresh Zijuan tea leaves based on hyperspectral imaging. Food Control 2023, 152, 109839. [Google Scholar] [CrossRef]
- Guo, M.; Chen, Z.; Ding, Z.; Wang, D.; Qi, D.; Lu, M.; Wang, M.; Dong, C. Traceability of Rizhao green tea origin based on multispectral data fusion strategy and chemometrics. Food Chem. X 2025, 27, 102346. [Google Scholar] [CrossRef] [PubMed]
- Zhong, K.; Hu, X.; Li, Y.; Tang, L.; Sun, X.; Li, X.; Zhang, J.; Meng, Y.; Ma, R.; Wang, S.; et al. A colorimetric and NIR fluorescent probe for ultrafast detecting bisulfite and organic amines and its applications in food, imaging, and monitoring fish freshness. Food Chem. 2024, 438, 137987. [Google Scholar] [CrossRef] [PubMed]
- Liang, J.; Guo, J.; Xia, H.; Ma, C.; Qiao, X. A black tea quality testing method for scale production using CV and NIRS with TCN for spectral feature extraction. Food Chem. 2025, 464 Pt 1, 141567. [Google Scholar] [CrossRef]
- Zhang, J.; Zhang, Y.; Zhou, G.; Li, C.; Wen, L.; Li, W. Adulteration identification strategy for Acanthopanax Senticosus based on data fusion of portable mass spectrometry and near-infrared spectroscopy. Food Chem. 2025, 491, 145239. [Google Scholar] [CrossRef]
- Wu, L.; Xu, Q.; Su, C.; Yin, X.; Huo, X.; Zhao, X.; Zhou, Y.; Huang, J. Classification of quality grading of Anji white tea using hyperspectral imaging and data fusion techniques. J. Food Compos. Anal. 2025, 142, 107563. [Google Scholar] [CrossRef]
- Wang, Z.; Han, Y.; Zhang, L.; Ye, Y.; Wei, L.; Li, L. The utilization of a data fusion approach to investigate fingerprint profiles of dark tea from China’s different altitudes. Food Chem. X 2024, 22, 101447. [Google Scholar] [CrossRef]
- Chen, Y.; Guo, M.; Chen, K.; Jiang, X.; Ding, Z.; Zhang, H.; Lu, M.; Qi, D.; Dong, C. Predictive models for sensory score and physicochemical composition of Yuezhou Longjing tea using near-infrared spectroscopy and data fusion. Talanta 2024, 273, 125892. [Google Scholar] [CrossRef] [PubMed]
- Zhang, L.; Zhang, Z.; Hou, Y.Z.; Ocholi, S.S.; Wang, L.; Fu, Z.; Liu, C.; Zhang, Z.; Han, L. Evaluation of changes in chemical composition and antioxidant activities from vine tea at different harvest times based on LC-MS, GC-MS, and data fusion algorithms. Food Chem. X 2025, 27, 102363. [Google Scholar] [CrossRef] [PubMed]
- Li, L.; Chen, Y.; Dong, S.; Shen, J.; Cao, S.; Cui, Q.; Song, Y.; Ning, J. Rapid and comprehensive grade evaluation of Keemun black tea using efficient multidimensional data fusion. Food Chem. X 2023, 20, 100924. [Google Scholar] [CrossRef]
- Chen, Q.; Sun, C.; Ouyang, Q.; Wang, Y.; Liu, A.; Li, H.; Zhao, J. Classification of different varieties of Oolong tea using novel artificial sensing tools and data fusion. LWT-Food Sci. Technol. 2015, 60, 781–787. [Google Scholar] [CrossRef]
- Yin, Y.; Li, J.; Ling, C.; Zhang, S.; Liu, C.; Sun, X.; Wu, J. Fusing spectral and image information for characterization of black tea grade based on hyperspectral technology. LWT 2023, 185, 115150. [Google Scholar] [CrossRef]
- Tan, L.; Zhang, P.; Cui, D.; Yang, X.; Zhang, D.; Yang, Y.; Chen, W.; Tang, D.; Tang, Q.; Li, P. Multi-omics analysis revealed anthocyanin accumulation differences in purple tea plants ‘Ziyan’, ‘Zijuan’ and their dark-purple hybrid. Sci. Hortic. 2023, 321, 112275. [Google Scholar] [CrossRef]
- Shi, X.; Song, J.; Wang, H.; Lv, X.; Zhu, Y.; Zhang, W.; Bu, W.; Zeng, L. Improving soil organic matter estimation accuracy by combining optimal spectral preprocessing and feature selection methods based on pXRF and vis-NIR data fusion. Geoderma 2023, 430, 116301. [Google Scholar] [CrossRef]
- Ndao, M.L.; Youness, G.; Niang, N.; Saporta, G. Improving predictive maintenance: Evaluating the impact of preprocessing and model complexity on the effectiveness of eXplainable Artificial Intelligence methods. Eng. Appl. Artif. Intell. 2025, 144, 110144. [Google Scholar] [CrossRef]
- Bi, Y.; Yuan, K.; Xiao, W.; Wu, J.; Shi, C.; Xia, J.; Chu, G.; Zhang, G.; Zhou, G. A local pre-processing method for near-infrared spectra, combined with spectral segmentation and standard normal variate transformation. Anal. Chim. Acta 2016, 909, 30–40. [Google Scholar] [CrossRef]
- Jiang, X.; Cao, X.; Liu, Q.; Wang, F.; Fan, S.; Yan, L.; Wei, Y.; Chen, Y.; Yang, G.; Xu, B.; et al. Prediction of multi-task physicochemical indices based on hyperspectral imaging and analysis of the relationship between physicochemical composition and sensory quality of tea. Food Res. Int. 2025, 211, 116455. [Google Scholar] [CrossRef] [PubMed]
- Guo, M.; Zhao, Y.; Chen, Y.; Chen, Z.; Chen, Y.; Qi, D.; Lu, M.; Dong, C. Determination of quality differences and origin tracing of green tea from different latitudes based on TG-FTIR and machine learning. Food Res. Int. 2025, 203, 115853. [Google Scholar] [CrossRef] [PubMed]
- Guhdar, M.; Mohammed, A.O.; Mstafa, R.J. Advanced deep learning framework for ECG arrhythmia classification using 1D-CNN with attention mechanism. Knowl.-Based Syst. 2025, 315, 113301. [Google Scholar] [CrossRef]
- Mirikharaji, Z.; Abhishek, K.; Bissoto, A.; Barata, C.; Avila, S.; Valle, E.; Celebi, M.E.; Hamarneh, G. A survey on deep learning for skin lesion segmentation. Med. Image Anal. 2023, 88, 102863. [Google Scholar] [CrossRef]
- Sheng, C.; Lu, M.; Zhang, J.; Zhao, W.; Jiang, Y.; Li, T.; Wang, Y.; Ning, J. Metabolomics and electronic-tongue analysis reveal differences in color and taste quality of large-leaf yellow tea under different roasting methods. Food Chem. X 2024, 23, 101721. [Google Scholar] [CrossRef]
- Wang, Z.; Ahmad, W.; Zhao, S.; Zhu, A.; Huo, S.; Chen, Q. Temporal analysis of non-targeted flavor component variation in green tea storage and rapid prediction of storage duration. Food Chem. 2025, 464 Pt 3, 141898. [Google Scholar] [CrossRef]
- Zhang, Y.; Chen, X.; Chen, D.; Zhu, L.; Wang, G.; Chen, Z. Machine learning-based classification and prediction of typical Chinese green tea taste profiles. Food Res. Int. 2025, 203, 115796. [Google Scholar] [CrossRef]
- Shen, S.; Ren, N.; Zheng, H.; Xue, X.; Ye, Y.; Liu, T.; Zhang, Q.; Yu, G. Rapid and real time detection of black tea rolling quality by using an inexpensive machine vison system. Food Res. Int. 2025, 205, 115983. [Google Scholar] [CrossRef]
- Ma, C.; Wang, Q.; Tian, D.; Yuan, W.; Tang, X.; Deng, X.; Liu, Y.; Gao, C.; Fan, G.; Xiao, X.; et al. HS-SPME-GC-MS combined with relative odor activity value identify the key aroma components of flowery and fruity aroma in different types of GABA tea. Food Chem. X 2024, 24, 101965. [Google Scholar] [CrossRef] [PubMed]
- Chen, K.; Gao, Y.; Zhang, Z.; Zhu, Y.; Cui, Z.; Lin, Y.; Yan, Y.; Shen, J.; Chen, W.; Zhu, J.; et al. Intelligent non-destructive biosensing of fresh tea leaves by portable spectroscopy and enhanced transformer. Food Control 2025, 178, 111527. [Google Scholar] [CrossRef]
- Zan, J.; Li, H.; Cai, L.; Wu, C.; Fan, Z.; Sun, T. Detection of tea seed oil adulteration based on near-infrared and Raman spectra information fusion. LWT 2024, 213, 117064. [Google Scholar] [CrossRef]
- Liu, L.; Zareef, M.; Wang, Z.; Li, H.; Chen, Q.; Ouyang, Q. Monitoring chlorophyll changes during Tencha processing using portable near-infrared spectroscopy. Food Chem. 2023, 412, 135505. [Google Scholar] [CrossRef]
- Zhou, X.; Wu, X.; Wu, B. Comparative study of indirect and direct feature extraction algorithms in classifying tea varieties using near-infrared spectroscopy. Curr. Res. Food Sci. 2025, 10, 101065. [Google Scholar] [CrossRef] [PubMed]
- Song, Y.; Yi, W.; Liu, Y.; Zhang, C.; Wang, Y.; Ning, J. A robust deep learning model for predicting green tea moisture content during fixation using near-infrared spectroscopy: Integration of multi-scale feature fusion and attention mechanisms. Food Res. Int. 2025, 203, 115874. [Google Scholar] [CrossRef] [PubMed]
- Deng, X.; Liu, Z.; Zhan, Y.; Ni, K.; Zhang, Y.; Ma, W.; Shao, S.; Lv, X.; Yuan, Y.; Rogers, K.M. Predictive geographical authentication of green tea with protected designation of origin using a random forest model. Food Control 2020, 107, 106807. [Google Scholar] [CrossRef]
- Li, M.; Jin, X.; Ma, W.; Du, S.; Wang, Y.; Ji, Z.; Qi, H.; Zhao, X. A Gastrodia elata green tea pulsed light sterilization model based on cost-benefit and GA-SVR algorithm. Food Control 2025, 177, 111445. [Google Scholar] [CrossRef]
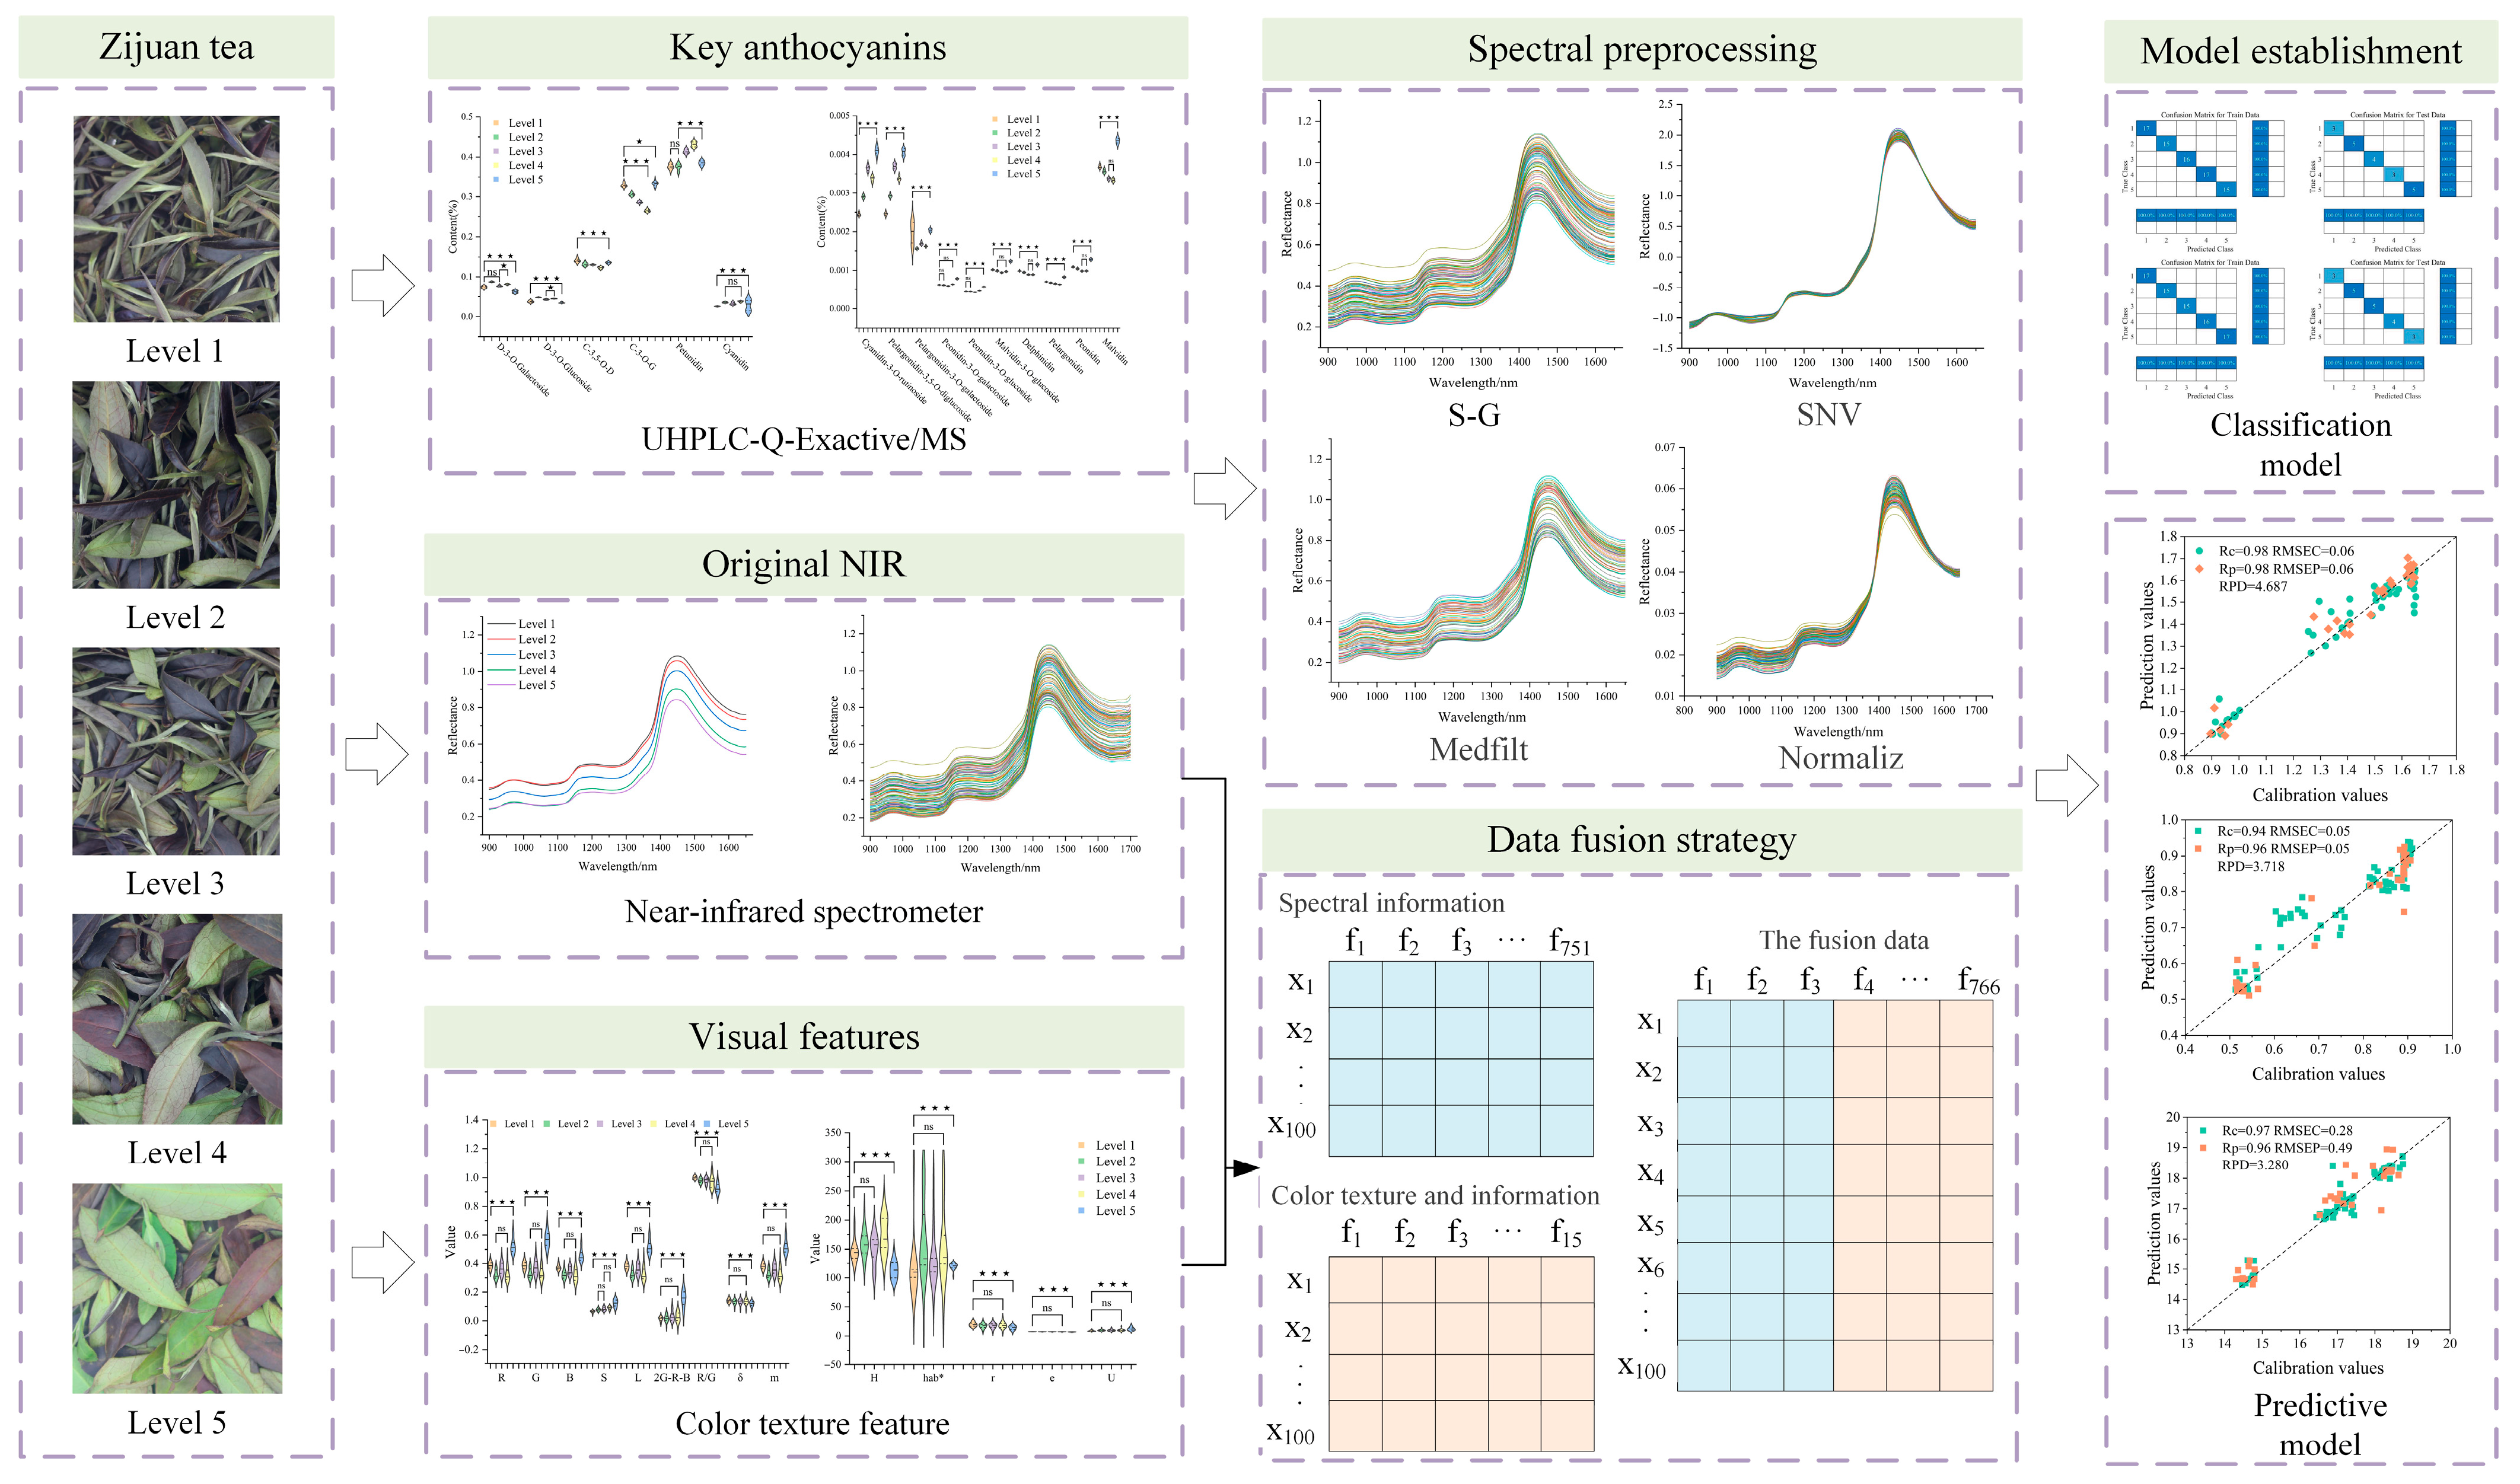
| Tea | Research Target | Technology | Machine Learning Algorithm | Reference |
|---|---|---|---|---|
| Vine tea | Chemical composition (myricetin, dihydromyricetin, quercetin, kaempferol, and quercitrin.) | LC-MS, GC-MS | PCA, RF | [12] |
| Dark tea | Classification of black tea at different altitudes | HPLC, DAD, ELSD | HPLC, HPLC-DAD, HPLC-ELSD | [10] |
| Keemun black tea | Classification of black tea, quantitative prediction of the concentrations of chemical components (GA, CAFF, EGC, C, EGCG, EC, GCG, total catechins) | micro-NIR, CV, CAS | SVM, LS-SVM, ELM, PLS-DA | [13] |
| Oolong tea | Variety classification | Gustative sensor system, CSA | PCA, LDA, CA, ANN | [14] |
| Black tea | Grade evaluation | Hyperspectral | PLS-DA, SVM, PNN | [15] |
| White tea | Grade evaluation, chemical composition (catechins, tea polyphenols, and free amino acids), sensory evaluation | Color texture feature, hyperspectral | SVM, KNN | [9] |
| Abbreviation | Instructions |
|---|---|
| NIR | Spectral data from 900 to 1700 nm |
| TEX | Nine color feature factors and five texture feature factors |
| NIR + TEX | The fusion data of NIR and TEX |
| Level | Range (mg/g) | Mean | STD | CV |
|---|---|---|---|---|
| Level 1 | 17.498–18.303 | 17.931 | 0.211 | 0.012 |
| Level 2 | 18.215–18.998 | 18.668 | 0.241 | 0.013 |
| Level 3 | 19.477–20.120 | 19.783 | 0.180 | 0.009 |
| Level 4 | 19.665–20.325 | 19.963 | 0.217 | 0.011 |
| Level 5 | 14.965–15.843 | 15.377 | 0.262 | 0.017 |
| Model | Data Fusion Methods | Preprocessing Method | PCs | Calibration Set | Prediction Set | ||
|---|---|---|---|---|---|---|---|
| Result | CCR | Result | CCR | ||||
| PSO-SVM | NIR | Raw | 12 | 74/80 | 92.50% | 16/20 | 80.00% |
| S-G | 11 | 74/80 | 92.50% | 16/20 | 80.00% | ||
| SNV | 10 | 65/80 | 81.50% | 15/20 | 75.00% | ||
| Medfilt | 16 | 77/80 | 96.50% | 18/20 | 90.00% | ||
| Normaliz | 11 | 71/80 | 88.75% | 14/20 | 70.00% | ||
| TEX | Raw | 10 | 80/80 | 100.00% | 9/20 | 45.00% | |
| S-G | 10 | 80/80 | 100.00% | 15/20 | 75.00% | ||
| SNV | 8 | 58/80 | 72.50% | 8/20 | 40.00% | ||
| Medfilt | 10 | 80/80 | 100.00% | 18/20 | 90.00% | ||
| Normaliz | 18 | 62/80 | 77.50% | 8/20 | 40.00% | ||
| NIR + TEX | Raw | 18 | 20/80 | 25.00% | 0/20 | 0.00% | |
| S-G | 19 | 78/80 | 97.50% | 13/20 | 65.00% | ||
| SNV | 21 | 66/80 | 82.50% | 12/20 | 60.00% | ||
| Medfilt | 9 | 80/80 | 100.00% | 17/20 | 85.00% | ||
| Normaliz | 19 | 62/80 | 77.50% | 10/20 | 50.00% | ||
| Model | Data Fusion Methods | Preprocessing Method | PCs | Calibration Set | Prediction Set | ||
|---|---|---|---|---|---|---|---|
| Result | CCR | Result | CCR | ||||
| RF | NIR | Raw | 12 | 80/80 | 100.00% | 15/20 | 75.00% |
| S-G | 10 | 80/80 | 100.00% | 18/20 | 90.00% | ||
| SNV | 11 | 80/80 | 100.00% | 19/20 | 95.00% | ||
| Medfilt | 11 | 80/80 | 100.00% | 19/20 | 95.00% | ||
| Normaliz | 11 | 80/80 | 100.00% | 16/20 | 80.00% | ||
| TEX | Raw | 10 | 80/80 | 100.00% | 17/20 | 85.00% | |
| S-G | 12 | 80/80 | 100.00% | 15/20 | 75.00% | ||
| SNV | 8 | 80/80 | 100.00% | 12/20 | 60.00% | ||
| Medfilt | 10 | 80/80 | 100.00% | 20/20 | 100.00% | ||
| Normaliz | 8 | 80/80 | 100.00% | 11/20 | 55.00% | ||
| NIR + TEX | Raw | 19 | 80/80 | 100.00% | 15/20 | 75.00% | |
| S-G | 15 | 80/80 | 100.00% | 14/20 | 70.00% | ||
| SNV | 21 | 80/80 | 100.00% | 16/20 | 80.00% | ||
| Medfilt | 9 | 80/80 | 100.00% | 17/20 | 85.00% | ||
| Normaliz | 19 | 80/80 | 100.00% | 13/20 | 65.00% | ||
| Model | Data Fusion Methods | Preprocessing Method | PCs | Calibration Set | Prediction Set | ||
|---|---|---|---|---|---|---|---|
| Result | CCR | Result | CCR | ||||
| CNN | NIR | Raw | 12 | 80/80 | 100.00% | 17/20 | 85.00% |
| S-G | 10 | 80/80 | 100.00% | 19/20 | 95.00% | ||
| SNV | 14 | 80/80 | 100.00% | 19/20 | 95.00% | ||
| Medfilt | 11 | 80/80 | 100.00% | 20/20 | 100.00% | ||
| Normaliz | 11 | 80/80 | 100.00% | 13/20 | 65.00% | ||
| TEX | Raw | 10 | 79/80 | 98.75% | 12/20 | 60.00% | |
| S-G | 12 | 80/80 | 100.00% | 9/20 | 45.00% | ||
| SNV | 8 | 80/80 | 100.00% | 9/20 | 45.00% | ||
| Medfilt | 10 | 78/80 | 97.50% | 17/20 | 85.00% | ||
| Normaliz | 8 | 80/80 | 100.00% | 10/20 | 50.00% | ||
| NIR + TEX | Raw | 21 | 80/80 | 100.00% | 15/20 | 75.00% | |
| S-G | 15 | 80/80 | 100.00% | 15/20 | 75.00% | ||
| SNV | 21 | 80/80 | 100.00% | 15/20 | 75.00% | ||
| Medfilt | 25 | 80/80 | 100.00% | 19/20 | 95.00% | ||
| Normaliz | 19 | 80/80 | 100.00% | 13/20 | 65.00% | ||
| Component | Data Fusion Method | Preprocessing Method | PCs | Calibration Set | Prediction Set | RPD | ||
|---|---|---|---|---|---|---|---|---|
| Rc | RMSEC (mg/g) | Rp | RMSEP (mg/g) | |||||
| Delphinidin-3-O-galactoside | NIR | Raw | 16 | 0.99 | 0.01 | 0.77 | 0.10 | 1.441 |
| S-G | 17 | 0.97 | 0.07 | 0.80 | 0.10 | 1.528 | ||
| SNV | 15 | 0.97 | 0.07 | 0.79 | 0.12 | 1.540 | ||
| Medfilt | 10 | 0.99 | 0.03 | 0.95 | 0.08 | 2.776 | ||
| Normaliz | 16 | 0.91 | 0.11 | 0.85 | 0.12 | 1.804 | ||
| TEX | Raw | 5 | 0.94 | 0.09 | 0.90 | 0.12 | 2.214 | |
| S-G | 5 | 0.97 | 0.06 | 0.97 | 0.08 | 4.072 | ||
| SNV | 8 | 0.99 | 0.04 | 0.90 | 0.10 | 2.244 | ||
| Medfilt | 5 | 0.98 | 0.06 | 0.98 | 0.06 | 4.687 | ||
| Normaliz | 6 | 0.97 | 0.07 | 0.92 | 0.09 | 2.588 | ||
| NIR + TEX | Raw | 24 | 0.98 | 0.06 | 0.91 | 0.13 | 2.032 | |
| S-G | 16 | 0.98 | 0.06 | 0.90 | 0.12 | 2.287 | ||
| SNV | 21 | 0.97 | 0.07 | 0.89 | 0.12 | 2.145 | ||
| Medfilt | 7 | 0.97 | 0.06 | 0.96 | 0.08 | 3.368 | ||
| Normaliz | 26 | 0.99 | 0.01 | 0.89 | 0.12 | 1.957 | ||
| Component | Data Fusion Method | Preprocessing Method | PCs | Calibration Set | Prediction Set | RPD | ||
|---|---|---|---|---|---|---|---|---|
| Rc | RMSEC (mg/g) | Rp | RMSEP (mg/g) | |||||
| Delphinidin-3-O-glucoside | NIR | Raw | 16 | 0.99 | 0.02 | 0.51 | 0.10 | 1.111 |
| S-G | 13 | 0.99 | 0.02 | 0.51 | 0.10 | 1.111 | ||
| SNV | 13 | 0.96 | 0.04 | 0.89 | 0.05 | 2.158 | ||
| Medfilt | 9 | 0.99 | 0.01 | 0.88 | 0.06 | 2.082 | ||
| Normaliz | 13 | 0.98 | 0.03 | 0.71 | 0.09 | 1.421 | ||
| TEX | Raw | 5 | 0.87 | 0.07 | 0.82 | 0.10 | 1.525 | |
| S-G | 9 | 0.94 | 0.05 | 0.96 | 0.05 | 3.718 | ||
| SNV | 8 | 0.96 | 0.04 | 0.88 | 0.06 | 2.109 | ||
| Medfilt | 7 | 0.97 | 0.03 | 0.95 | 0.05 | 2.992 | ||
| Normaliz | 6 | 0.93 | 0.06 | 0.86 | 0.07 | 1.973 | ||
| NIR + TEX | Raw | 18 | 0.99 | 0.02 | 0.82 | 0.10 | 1.545 | |
| S-G | 15 | 0.98 | 0.03 | 0.87 | 0.08 | 1.948 | ||
| SNV | 17 | 0.94 | 0.05 | 0.78 | 0.09 | 1.570 | ||
| Medfilt | 8 | 0.98 | 0.03 | 0.93 | 0.06 | 2.616 | ||
| Normaliz | 17 | 0.98 | 0.03 | 0.82 | 0.09 | 1.636 | ||
| Component | Data Fusion Method | Preprocessing Method | PCs | Calibration Set | Prediction Set | RPD | ||
|---|---|---|---|---|---|---|---|---|
| Rc | RMSEC (mg/g) | Rp | RMSEP (mg/g) | |||||
| Cyanidin-3,5-O-diglucoside | NIR | Raw | 9 | 0.97 | 0.05 | 0.75 | 0.08 | 1.328 |
| S-G | 9 | 0.97 | 0.05 | 0.77 | 0.07 | 1.471 | ||
| SNV | 7 | 0.94 | 0.07 | 0.80 | 0.08 | 1.680 | ||
| Medfilt | 6 | 0.97 | 0.05 | 0.91 | 0.07 | 2.410 | ||
| Normaliz | 7 | 0.96 | 0.05 | 0.85 | 0.08 | 1.823 | ||
| TEX | Raw | 7 | 0.97 | 0.04 | 0.91 | 0.09 | 2.294 | |
| S-G | 10 | 0.96 | 0.05 | 0.94 | 0.07 | 2.755 | ||
| SNV | 7 | 0.90 | 0.08 | 0.84 | 0.10 | 1.628 | ||
| Medfilt | 7 | 0.89 | 0.08 | 0.87 | 0.09 | 2.026 | ||
| Normaliz | 7 | 0.92 | 0.08 | 0.84 | 0.10 | 1.657 | ||
| NIR + TEX | Raw | 17 | 0.95 | 0.06 | 0.92 | 0.08 | 2.510 | |
| S-G | 14 | 0.99 | 0.03 | 0.92 | 0.09 | 2.439 | ||
| SNV | 15 | 0.93 | 0.07 | 0.91 | 0.07 | 2.442 | ||
| Medfilt | 7 | 0.92 | 0.07 | 0.93 | 0.07 | 2.736 | ||
| Normaliz | 16 | 0.97 | 0.05 | 0.90 | 0.07 | 2.242 | ||
| Component | Data Fusion Method | Preprocessing Method | PCs | Calibration Set | Prediction Set | RPD | ||
|---|---|---|---|---|---|---|---|---|
| Rc | RMSEC (mg/g) | Rp | RMSEP (mg/g) | |||||
| Cyanidin-3-O-glucoside | NIR | Raw | 6 | 0.94 | 0.11 | 0.91 | 0.10 | 2.396 |
| S-G | 11 | 0.95 | 0.10 | 0.88 | 0.11 | 2.157 | ||
| SNV | 6 | 0.92 | 0.13 | 0.91 | 0.10 | 2.214 | ||
| Medfilt | 4 | 0.95 | 0.10 | 0.95 | 0.08 | 3.267 | ||
| Normaliz | 11 | 0.95 | 0.11 | 0.94 | 0.09 | 2.969 | ||
| TEX | Raw | 10 | 0.91 | 0.12 | 0.85 | 0.16 | 1.877 | |
| S-G | 10 | 0.97 | 0.07 | 0.94 | 0.09 | 2.866 | ||
| SNV | 8 | 0.95 | 0.09 | 0.85 | 0.15 | 1.739 | ||
| Medfilt | 10 | 0.94 | 0.11 | 0.90 | 0.12 | 2.319 | ||
| Normaliz | 7 | 0.97 | 0.07 | 0.84 | 0.16 | 1.795 | ||
| NIR + TEX | Raw | 16 | 0.96 | 0.08 | 0.93 | 0.12 | 2.405 | |
| S-G | 14 | 0.99 | 0.02 | 0.94 | 0.11 | 2.865 | ||
| SNV | 23 | 0.98 | 0.07 | 0.89 | 0.13 | 2.120 | ||
| Medfilt | 9 | 0.98 | 0.06 | 0.94 | 0.11 | 2.815 | ||
| Normaliz | 24 | 0.99 | 0.02 | 0.90 | 0.12 | 2.227 | ||
| Component | Data Fusion Method | Preprocessing Method | PCs | Calibration Set | Prediction Set | RPD | ||
|---|---|---|---|---|---|---|---|---|
| Rc | RMSEC (mg/g) | Rp | RMSEP (mg/g) | |||||
| Petunidin | NIR | Raw | 9 | 0.97 | 0.25 | 0.76 | 0.54 | 1.525 |
| S-G | 10 | 0.99 | 0.17 | 0.81 | 0.50 | 1.648 | ||
| SNV | 8 | 0.98 | 0.18 | 0.87 | 0.45 | 2.040 | ||
| Medfilt | 8 | 0.97 | 0.23 | 0.91 | 0.42 | 2.465 | ||
| Normaliz | 9 | 0.98 | 0.21 | 0.86 | 0.48 | 2.000 | ||
| TEX | Raw | 6 | 0.83 | 0.56 | 0.51 | 0.89 | 1.082 | |
| S-G | 10 | 0.98 | 0.20 | 0.89 | 0.53 | 2.023 | ||
| SNV | 7 | 0.81 | 0.62 | 0.56 | 0.81 | 1.090 | ||
| Medfilt | 10 | 0.99 | 0.04 | 0.84 | 0.62 | 1.706 | ||
| Normaliz | 8 | 0.91 | 0.43 | 0.55 | 0.83 | 1.190 | ||
| NIR + TEX | Raw | 16 | 0.95 | 0.31 | 0.74 | 0.64 | 1.385 | |
| S-G | 21 | 0.99 | 0.16 | 0.79 | 0.65 | 1.528 | ||
| SNV | 15 | 0.96 | 0.31 | 0.77 | 0.61 | 1.545 | ||
| Medfilt | 12 | 0.92 | 0.39 | 0.75 | 0.69 | 1.495 | ||
| Normaliz | 14 | 0.92 | 0.41 | 0.75 | 0.65 | 1.387 | ||
| Component | Data Fusion Method | Preprocessing Method | PCs | Calibration Set | Prediction Set | RPD | ||
|---|---|---|---|---|---|---|---|---|
| Rc | RMSEC (mg/g) | Rp | RMSEP (mg/g) | |||||
| Cyanidin | NIR | Raw | 7 | 0.75 | 0.11 | 0.61 | 0.08 | 1.246 |
| S-G | 12 | 0.96 | 0.05 | 0.68 | 0.07 | 1.320 | ||
| SNV | 8 | 0.81 | 0.10 | 0.70 | 0.09 | 1.359 | ||
| Medfilt | 4 | 0.93 | 0.05 | 0.90 | 0.07 | 2.304 | ||
| Normaliz | 13 | 0.78 | 0.10 | 0.41 | 0.12 | 1.103 | ||
| TEX | Raw | 5 | 0.69 | 0.11 | 0.40 | 0.15 | 1.055 | |
| S-G | 13 | 0.94 | 0.05 | 0.50 | 0.15 | 1.149 | ||
| SNV | 6 | 0.74 | 0.11 | 0.68 | 0.10 | 1.333 | ||
| Medfilt | 10 | 0.70 | 0.11 | 0.64 | 0.12 | 1.168 | ||
| Normaliz | 7 | 0.83 | 0.09 | 0.88 | 0.07 | 2.012 | ||
| NIR + TEX | Raw | 7 | 0.80 | 0.09 | 0.41 | 0.14 | 0.987 | |
| S-G | 8 | 0.99 | 0.02 | 0.73 | 0.10 | 1.488 | ||
| SNV | 8 | 0.81 | 0.09 | 0.62 | 0.11 | 1.285 | ||
| Medfilt | 7 | 0.85 | 0.08 | 0.66 | 0.11 | 1.272 | ||
| Normaliz | 8 | 0.99 | 0.01 | 0.87 | 0.08 | 1.857 | ||
| Component | Data Fusion Method | Preprocessing Method | PCs | Calibration Set | Prediction Set | RPD | ||
|---|---|---|---|---|---|---|---|---|
| Rc | RMSEC (mg/g) | Rp | RMSEP (mg/g) | |||||
| Total anthocyanins | NIR | Raw | 10 | 0.97 | 0.34 | 0.65 | 0.74 | 1.245 |
| S-G | 10 | 0.99 | 0.22 | 0.72 | 0.64 | 1.434 | ||
| SNV | 8 | 0.94 | 0.50 | 0.87 | 0.53 | 1.980 | ||
| Medfilt | 6 | 0.98 | 0.26 | 0.95 | 0.43 | 2.979 | ||
| Normaliz | 10 | 0.99 | 0.22 | 0.85 | 0.60 | 1.860 | ||
| TEX | Raw | 5 | 0.91 | 0.55 | 0.82 | 0.84 | 1.694 | |
| S-G | 10 | 0.97 | 0.28 | 0.96 | 0.49 | 3.280 | ||
| SNV | 6 | 0.88 | 0.68 | 0.76 | 0.81 | 1.505 | ||
| Medfilt | 5 | 0.96 | 0.37 | 0.94 | 0.51 | 2.749 | ||
| Normaliz | 6 | 0.91 | 0.60 | 0.82 | 0.69 | 1.753 | ||
| NIR + TEX | Raw | 23 | 0.99 | 0.08 | 0.91 | 0.76 | 1.818 | |
| S-G | 20 | 0.99 | 0.04 | 0.85 | 0.89 | 1.639 | ||
| SNV | 24 | 0.99 | 0.12 | 0.89 | 0.66 | 1.945 | ||
| Medfilt | 11 | 0.94 | 0.46 | 0.86 | 0.75 | 1.949 | ||
| Normaliz | 24 | 0.99 | 0.22 | 0.87 | 0.67 | 1.769 | ||
| Component | Optimal Combination | Method | Variable Number | PCs | Calibration Set | Prediction Set | RPD | ||
|---|---|---|---|---|---|---|---|---|---|
| Rc | RMSEC (mg/g) | Rp | RMSEP (mg/g) | ||||||
| Petunidin | NIR + Medfilt | Raw | 751 | 8 | 0.97 | 0.23 | 0.91 | 0.42 | 2.465 |
| CARS | 52 | 11 | 0.99 | 0.04 | 0.93 | 0.40 | 2.584 | ||
| BOSS | 20 | 8 | 0.99 | 0.03 | 0.89 | 0.49 | 1.995 | ||
| SPA | 37 | 5 | 0.97 | 0.25 | 0.95 | 0.34 | 2.888 | ||
| Component | Optimal Combination | Model | PCs | Calibration Set | Prediction Set | RPD | ||
|---|---|---|---|---|---|---|---|---|
| Rc | RMSEC (mg/g) | Rp | RMSEP (mg/g) | |||||
| Delphinidin-3-O-galactoside | TEX + Medfilt | PLSR | 5 | 0.89 | 0.12 | 0.95 | 0.08 | 3.135 |
| SVR | 5 | 0.98 | 0.06 | 0.98 | 0.06 | 4.687 | ||
| RF | 5 | 0.99 | 0.06 | 0.97 | 0.09 | 3.726 | ||
| Delphinidin-3-O-glucoside | TEX + S-G | PLSR | 9 | 0.92 | 0.05 | 0.96 | 0.05 | 3.567 |
| SVR | 9 | 0.94 | 0.05 | 0.96 | 0.05 | 3.718 | ||
| RF | 9 | 0.98 | 0.04 | 0.96 | 0.07 | 2.901 | ||
| Cyanidin-3,5-O-diglucoside | TEX + S-G | PLSR | 10 | 0.83 | 0.09 | 0.94 | 0.07 | 2.850 |
| SVR | 10 | 0.96 | 0.05 | 0.94 | 0.07 | 2.755 | ||
| RF | 10 | 0.98 | 0.05 | 0.94 | 0.11 | 2.438 | ||
| Cyanidin-3-O-glucoside | NIR + Medfilt | PLSR | 4 | 0.93 | 0.11 | 0.93 | 0.10 | 2.629 |
| SVR | 4 | 0.95 | 0.10 | 0.95 | 0.08 | 3.267 | ||
| RF | 4 | 0.98 | 0.07 | 0.93 | 0.11 | 3.532 | ||
| Petunidin | NIR + Medfilt + SPA | PLSR | 5 | 0.47 | 0.90 | 0.72 | 0.71 | 0.958 |
| SVR | 5 | 0.97 | 0.25 | 0.95 | 0.34 | 2.888 | ||
| RF | 5 | 0.98 | 0.30 | 0.92 | 0.44 | 2.573 | ||
| Cyanidin | NIR + Medfilt | PLSR | 4 | 0.15 | 0.15 | 0.55 | 0.13 | 0.334 |
| SVR | 4 | 0.93 | 0.05 | 0.90 | 0.07 | 2.304 | ||
| RF | 4 | 0.96 | 0.05 | 0.65 | 0.11 | 1.893 | ||
| Total anthocyanins | TEX + S-G | PLSR | 10 | 0.89 | 0.57 | 0.94 | 0.55 | 2.732 |
| SVR | 10 | 0.97 | 0.28 | 0.96 | 0.49 | 3.280 | ||
| RF | 10 | 0.99 | 0.37 | 0.95 | 0.85 | 2.455 | ||
Disclaimer/Publisher’s Note: The statements, opinions and data contained in all publications are solely those of the individual author(s) and contributor(s) and not of MDPI and/or the editor(s). MDPI and/or the editor(s) disclaim responsibility for any injury to people or property resulting from any ideas, methods, instructions or products referred to in the content. |
© 2025 by the authors. Licensee MDPI, Basel, Switzerland. This article is an open access article distributed under the terms and conditions of the Creative Commons Attribution (CC BY) license (https://creativecommons.org/licenses/by/4.0/).
Share and Cite
Chen, S.; Dai, F.; Guo, M.; Dong, C. Assessment of Tenderness and Anthocyanin Content in Zijuan Tea Fresh Leaves Using Near-Infrared Spectroscopy Fused with Visual Features. Foods 2025, 14, 2938. https://doi.org/10.3390/foods14172938
Chen S, Dai F, Guo M, Dong C. Assessment of Tenderness and Anthocyanin Content in Zijuan Tea Fresh Leaves Using Near-Infrared Spectroscopy Fused with Visual Features. Foods. 2025; 14(17):2938. https://doi.org/10.3390/foods14172938
Chicago/Turabian StyleChen, Shuya, Fushuang Dai, Mengqi Guo, and Chunwang Dong. 2025. "Assessment of Tenderness and Anthocyanin Content in Zijuan Tea Fresh Leaves Using Near-Infrared Spectroscopy Fused with Visual Features" Foods 14, no. 17: 2938. https://doi.org/10.3390/foods14172938
APA StyleChen, S., Dai, F., Guo, M., & Dong, C. (2025). Assessment of Tenderness and Anthocyanin Content in Zijuan Tea Fresh Leaves Using Near-Infrared Spectroscopy Fused with Visual Features. Foods, 14(17), 2938. https://doi.org/10.3390/foods14172938


