1. Introduction
China is the world’s leading producer and exporter of wheat, which is the staple food for approximately 40% of the global population and plays a pivotal role in the Chinese diet. Wheat is rich in nutrients [
1], including starch, protein, fat, minerals, calcium, iron, thiamine, riboflavin, niacin, vitamin A, and vitamin C [
2]. However, fluctuations in environmental parameters during storage can lead to nutrient loss [
3]. Consequently, the establishment of an optimal storage environment emerges as a pivotal strategy to ensure the preservation of quality. Empirical evidence has demonstrated that effective wheat storage conditions are characterized by low temperatures, minimal humidity, and adequate ventilation. These conditions impede the occurrence of enzymatic reactions, reduce lipid oxidation [
4], and hinder microbial metabolism, thereby sustaining the physiological activity of wheat. When the storage temperature is too high, respiration and the rate of fatty acid rancidity increase significantly, while high humidity can lead to the rapid spread of mold [
5], causing the accumulation of harmful substances such as aflatoxins. Therefore, precisely controlling the temperature and humidity gradient and their coupling effect has become the core proposition for balancing storage safety and economy.
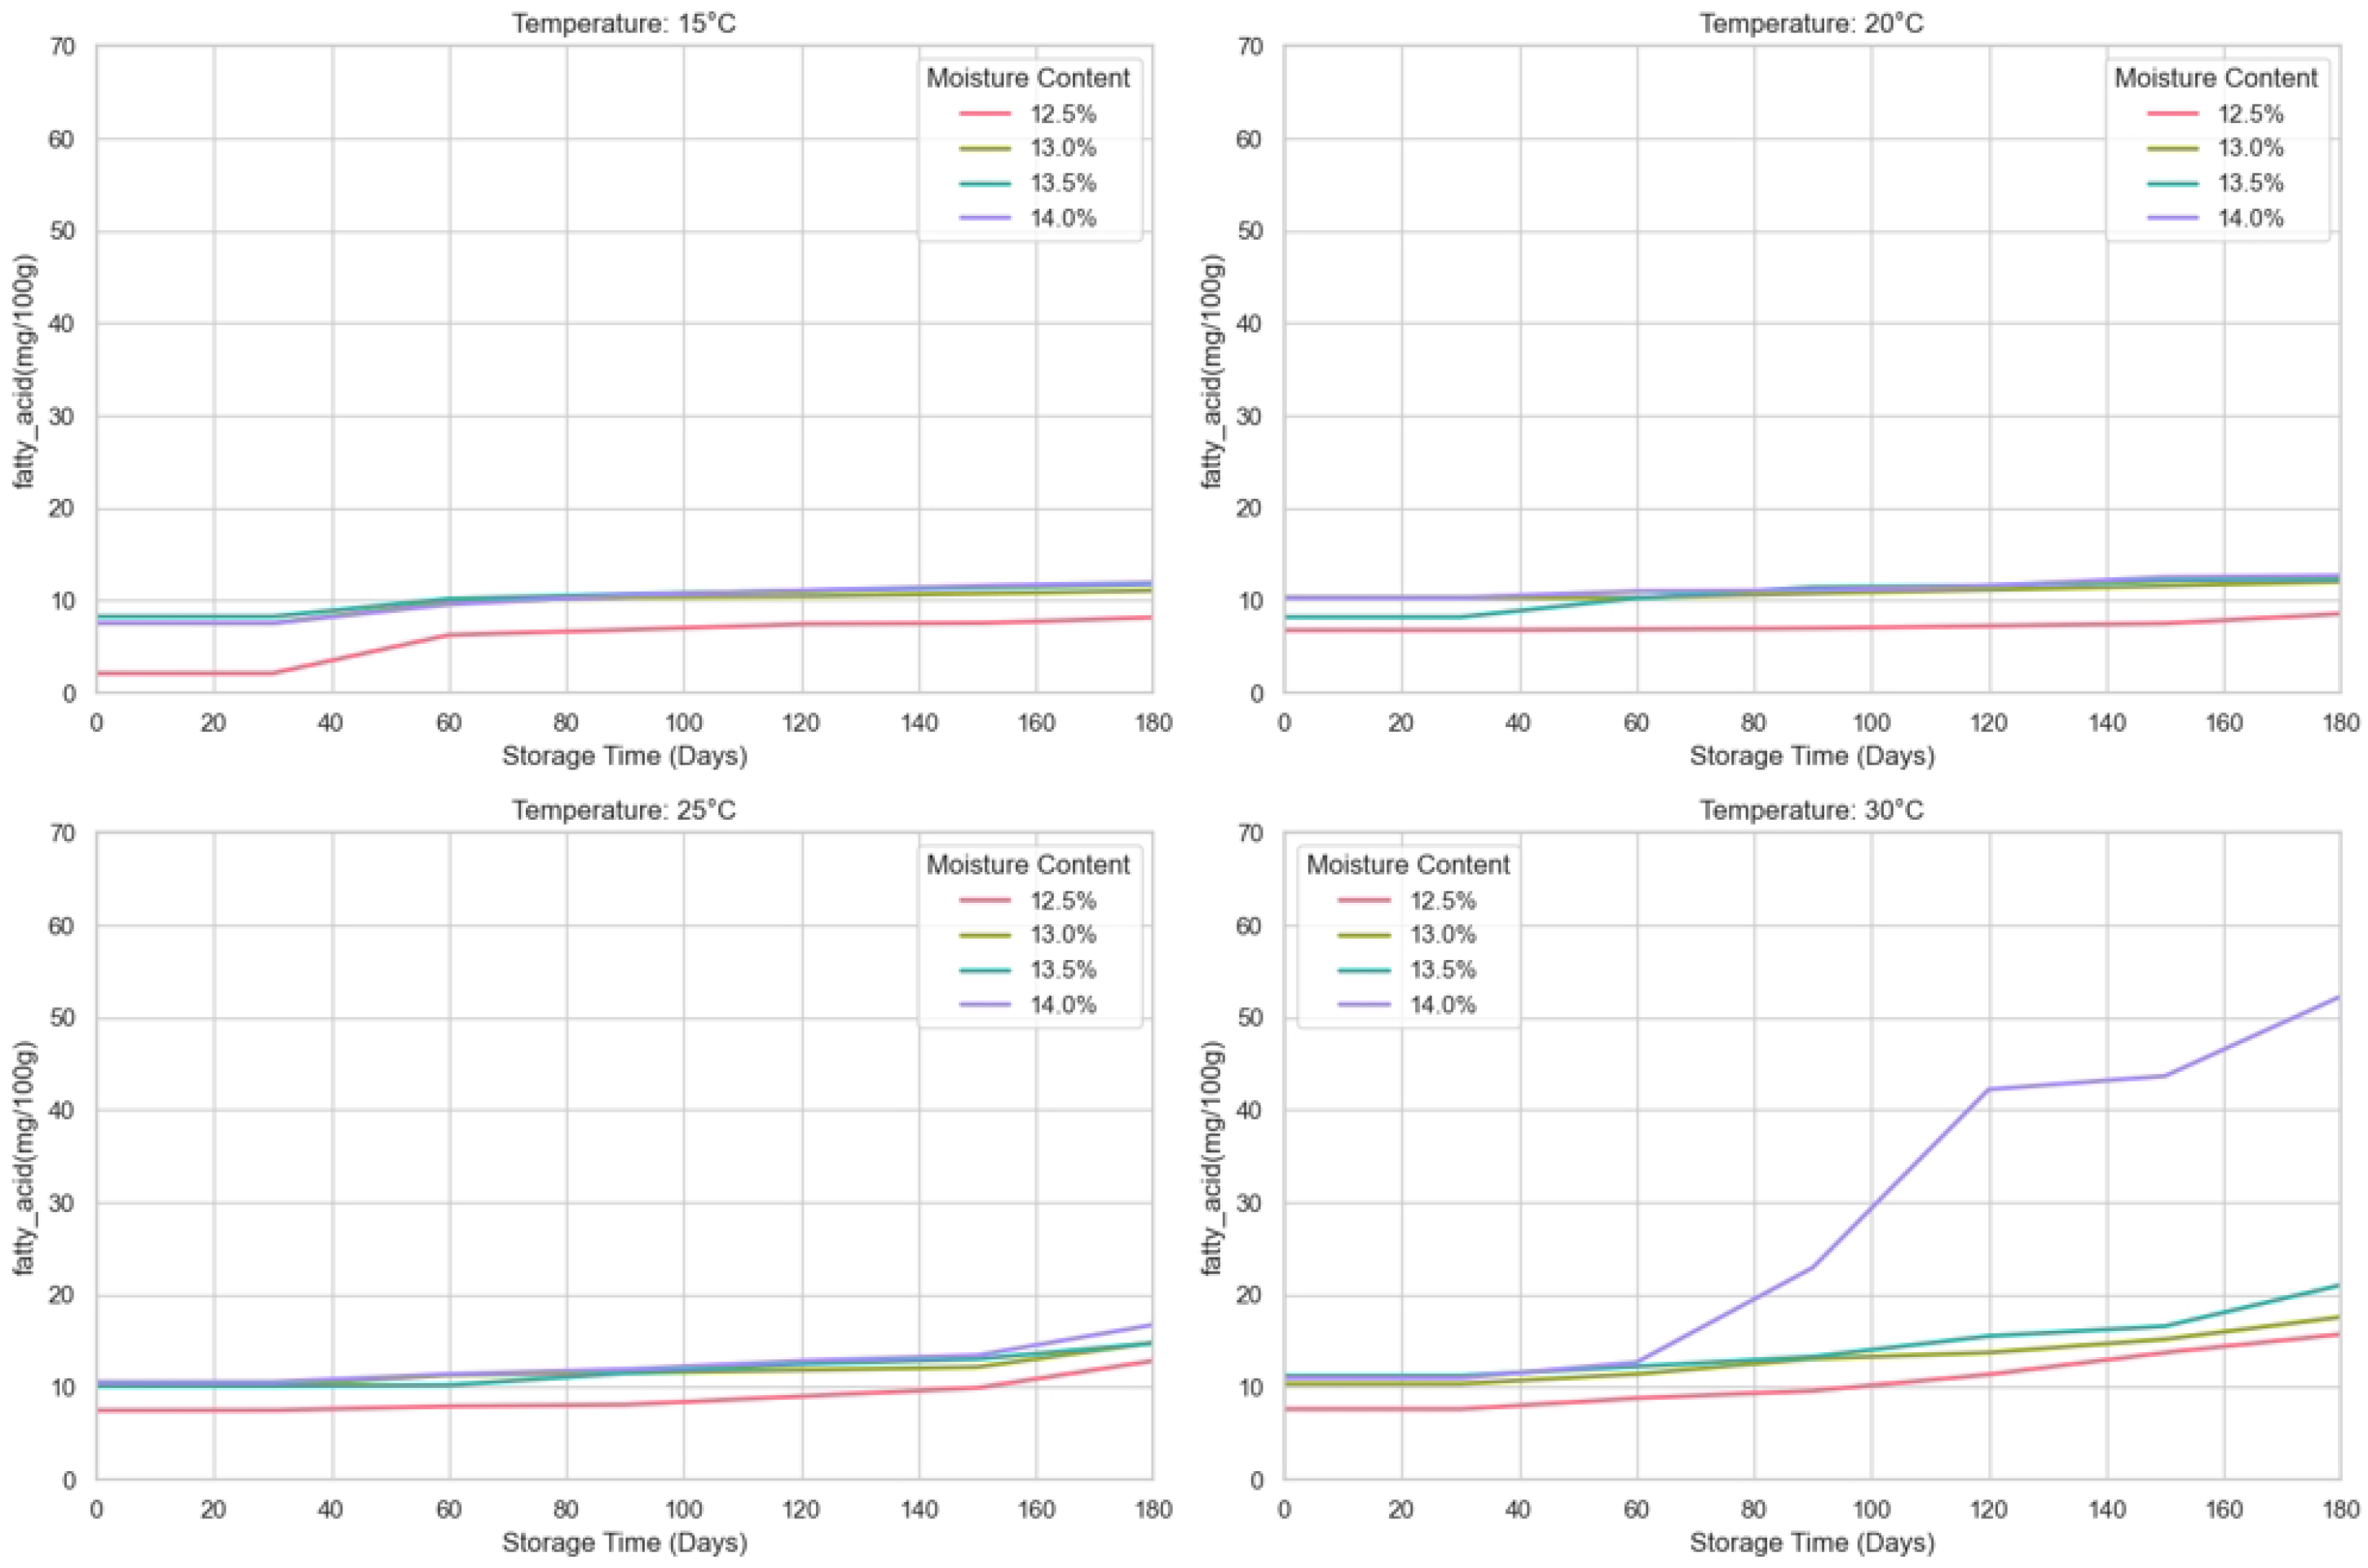
This study takes a multidimensional approach to the quality deterioration process and establishes a three-in-one evaluation system for physiological activity, chemical stability, and physical characteristics. The germination rate is used as an indicator of the physiological and metabolic strength of the seed, the fatty acid value is used to monitor lipid oxidation, and the weight capacity index is introduced to quantify the physical basis of processing performance. These three key parameters correspond to the cell-level viability maintenance ability, molecular-level component stability, and macro-level process adaptability of wheat during storage, and together they form an early warning signal network for quality deterioration.
During storage, the physiological state of wheat is a key factor affecting its quality. Wheat germination rate [
5,
6] is an important indicator of seed vitality, which directly reflects the health of the seed during storage [
7]. In addition to physiological indicators, chemical indicators of wheat are also an important basis for predicting storage quality. The fatty acid value is a measure of the degree of lipid oxidation in wheat, which is significantly affected by storage temperature and humidity. Lipid oxidation not only causes off-flavors in wheat but also reduces its processing suitability and affects the sensory quality of the final food product. The indicator of the physical property dimension, the test weight, is directly related to the compactness of the endosperm structure and the efficiency of flour extraction, providing a quantitative basis for processing suitability. Ivica Strelec et al. [
8] continuously monitored the dynamic changes in multiple quality indicators of three wheat varieties during a 12-month storage period under different storage temperature and humidity conditions and drew important conclusions based on the results.
With the development of human society, people around the world are paying more and more attention to the quality of food every year, and how to protect the quality of food during storage has become one of the important issues. Different storage environments are crucial for the protection of food quality. Therefore, choosing the storage environment for food storage is one of the urgent problems that needs to be solved. Clare Kyomugasho et al. [
9] established a link between the relative position of the storage conditions of beans along the Tg line (their glass transition temperatures) and the degree of hard cooking (HTC) development. The rate of change in cooking time with storage time during storage was thus obtained. Coradi, P.C. et al. [
10] explored the seed quality of different varieties of soybean seeds after 6 months of storage in different packages and concluded that the technical laminated packaging is more advantageous. Wawrzyniak, J. et al. [
11] developed a model to predict the impact of mycotoxins in stored barley, which can be used to estimate the severity of fungal contamination in large quantities. Mohamed Nejib El Melki et al. [
12] constructed a multi-parameter storage simulation system to systematically monitor the population changes in the Dominican wheat midge (
Sitophilus dominicanus) under gradient temperature and humidity and ventilation intensity. The research revealed the development and reproduction threshold of this storage pest, established a mapping relationship between the three-dimensional distribution of temperature and humidity and the pest index, and ultimately formed a pest suppression plan based on environmental regulation.
Researchers have found that time-series analysis, as a key technique for revealing the evolution of systems, has evolved from traditional statistical modeling to a research system that integrates multiple methods. Classical statistical models [
13,
14] construct a stable sequence prediction framework through differential operations and linear combinations, maintaining theoretical advantages in scenarios that satisfy the Gaussian assumption. However, in the face of the nonlinear characteristics and time-varying covariance structure in complex systems, support vector regression, gradient boosted trees, and other methods based on machine learning [
15,
16] have effectively improved modeling capabilities through feature engineering. In recent years, deep learning architectures [
17,
18,
19] have made breakthroughs in capturing long-term dependencies with their multi-level feature extraction mechanisms. The research paradigm has shifted from single model optimization to hybrid modeling strategies, with a focus on the physical interpretability of models and an in-depth analysis of the coupling mechanisms of dynamic systems, marking a new stage in time-series analysis, with the integration of multi-scale features [
20,
21]. Han, H.M. et al. [
22] proposed an EEG-GCN architecture for predicting time-series data, utilizing GCN to identify feature interactions between sub-signals and map the interdependencies among data. Cheng, J.D. et al. [
23] proposed a tensor form to comprehensively describe the information of time-series PolSAR data (time-series polarimetric synthetic aperture radar, an effective technique for crop classification and agricultural activity monitoring), including spatial context information, polarization scattering information, and temporal context information. Geovane da Silva André et al. [
24] comparing the performance parameters of four types of predictive models (ANN, REPTree, M5P, RF and LR), it was found that the prediction errors of the random forest (RF) and the rapid decision tree (REPTree) for the physical integrity (damage rate, moisture content) and physiological potential (enzyme activity, germination potential) of soybean seeds were significantly lower than those of the traditional linear regression model, which verified the advantages of tree structure algorithms in modeling nonlinear agricultural data. Lance E.R. et al. [
25] investigated the trend of wheat moisture content over storage time and used an ARIMA model to predict it. Koomson P. et al. [
26] used an LSTM model to predict grain temperature based on past collected data to predict stored grain temperature, thereby avoiding deterioration of the grain during storage. Uma Kamboj et al. [
27] studied the quality parameters of wheat grains stored for one year. Principal component analysis (PCA) scores and other methods were used to analyze the reference data and near-infrared spectroscopy data. All models were able to accurately predict the protein and carbohydrate content of stored wheat, with PLS and SVM providing the best results. Liang Ge et al. [
28] proposed a CLSTM model, which was used to predict the temperature inside the grain pile, thereby reducing grain loss and improving quality.
In recent years, clustering algorithms have been applied to time-series analysis. Wang, R. et al. [
29] proposed the i-MFEA time-series clustering algorithm based on evolutionary multi-task optimization, which uses an improved multi-factor evolutionary algorithm to simultaneously optimize multiple clustering tasks. Lee, J. et al. [
30] proposed the TMRC model to address time-series clustering. By extracting features from different temporal patterns using TMRL, these features are then utilized for time-series clustering.
It is different from the existing models that only use time-series analysis models [
31] to predict some indicators of crops during the storage process, thereby screening out the environment more suitable for storing crops, or only use related models, such as clustering, to classify the indicators of crops by grade. This study aims to investigate a complete dual-model system for wheat storage and grade classification. This is not merely a simple combination of the two models. Instead, an efficient time-series prediction model is established first, and an accurate clustering model is designed based on the time-series prediction results. These steps are interlinked to form a dual-model system for wheat quality prediction and evaluation. Provide theoretical support and technical guidance for the storage management and quality improvement of wheat.
The present study focuses on the multidimensional evolution of wheat quality during storage. By integrating time-series prediction and dynamic clustering methods, the collaborative degradation mechanism of physiological activity, chemical stability, and physical properties is systematically analyzed. In response to the need for dynamic quality prediction under the coupled action of temperature and moisture content, a multimodal time-series prediction framework based on the SGCNiFormer model is proposed. The model incorporates a graph convolutional network (GCN) to establish the topological correlation between the environment and quality indicators, and it introduces a dynamic gating mechanism to integrate time-series features and spatial dependencies. The development of a K-Smeans clustering algorithm that incorporates time-series information was based on these innovations. The construction of a spatiotemporal feature matrix integrates historical observations and future predictions, and this matrix is then used to classify storage quality levels. Experimental findings demonstrate that the SGCNiFormer model enhances the prediction accuracy of key indicators, while the K-Smeans clustering algorithm enhances the clustering evaluation indicators in comparison to traditional K-means, effectively classifying wheat quality into five interpretable levels. This dual-model system differs from existing models in that it can more accurately predict wheat quality evaluation indicators while utilizing time-series data and clustering algorithms to classify wheat quality indicators. This enables not only the prediction of future data for quality indicators of different wheat varieties under different storage conditions, but also the prediction of changes in quality grades caused by storage. This provides a quantitative decision-making basis for precise control of storage parameters, significantly enhancing the predictability and scientific nature of storage management.
The primary contributions of this study are as follows:
The GCN-based temporal model SGCNiFormer, which has been demonstrated to outperform mainstream models in the context of long-term multivariate temporal prediction, achieving a 58% reduction in MAE;
A dynamic clustering framework, K-Smeans, integrating temporal dependencies to classify wheat quality into five interpretable grades, which has been validated to outperform K-means clustering after evaluation using clustering metrics such as the contour coefficient;
Establishing a “prediction-evaluation” dual-model system based on SGCNiFormer and K-means, providing a quantifiable decision-making basis for intelligent grain warehouse management.
3. Results and Discussion
3.1. Comparison of Predictive Models
In this section, in order to effectively evaluate the performance of SGCNiFormer in predicting the changes in various quality evaluation indicators during wheat storage, seven recognized prediction models are selected as benchmarks, including Autoformer [
35], Crossformer [
36], TimesNet [
37], TiDE [
38], FEDformer [
39], Stationary [
40], and PatchTST [
41]. With the same training set, test set, and validation set, each model is tested, and its prediction error is analyzed. To accurately and objectively evaluate the performance of the above models, we used five evaluation metrics from time-series analysis to calculate the error value of each model, including MSE, RMSE, MSPE, MAPE, and MAE.
The model was built using the open-source deep learning framework PyTorch, and experiments were run using NVIDIA 4090 GPUs. The time-series experiment settings were as follows: batch size of 32, learning rate of 0.0001, number of GCN layers of three, number of epochs of 20, and Adam as the optimizer.
In this paper, we propose the SGCNiFormer model and validate its superiority through comparative experiments. The table above lists the performance of SGCNiFormer and other mainstream models on multiple evaluation metrics, as shown in
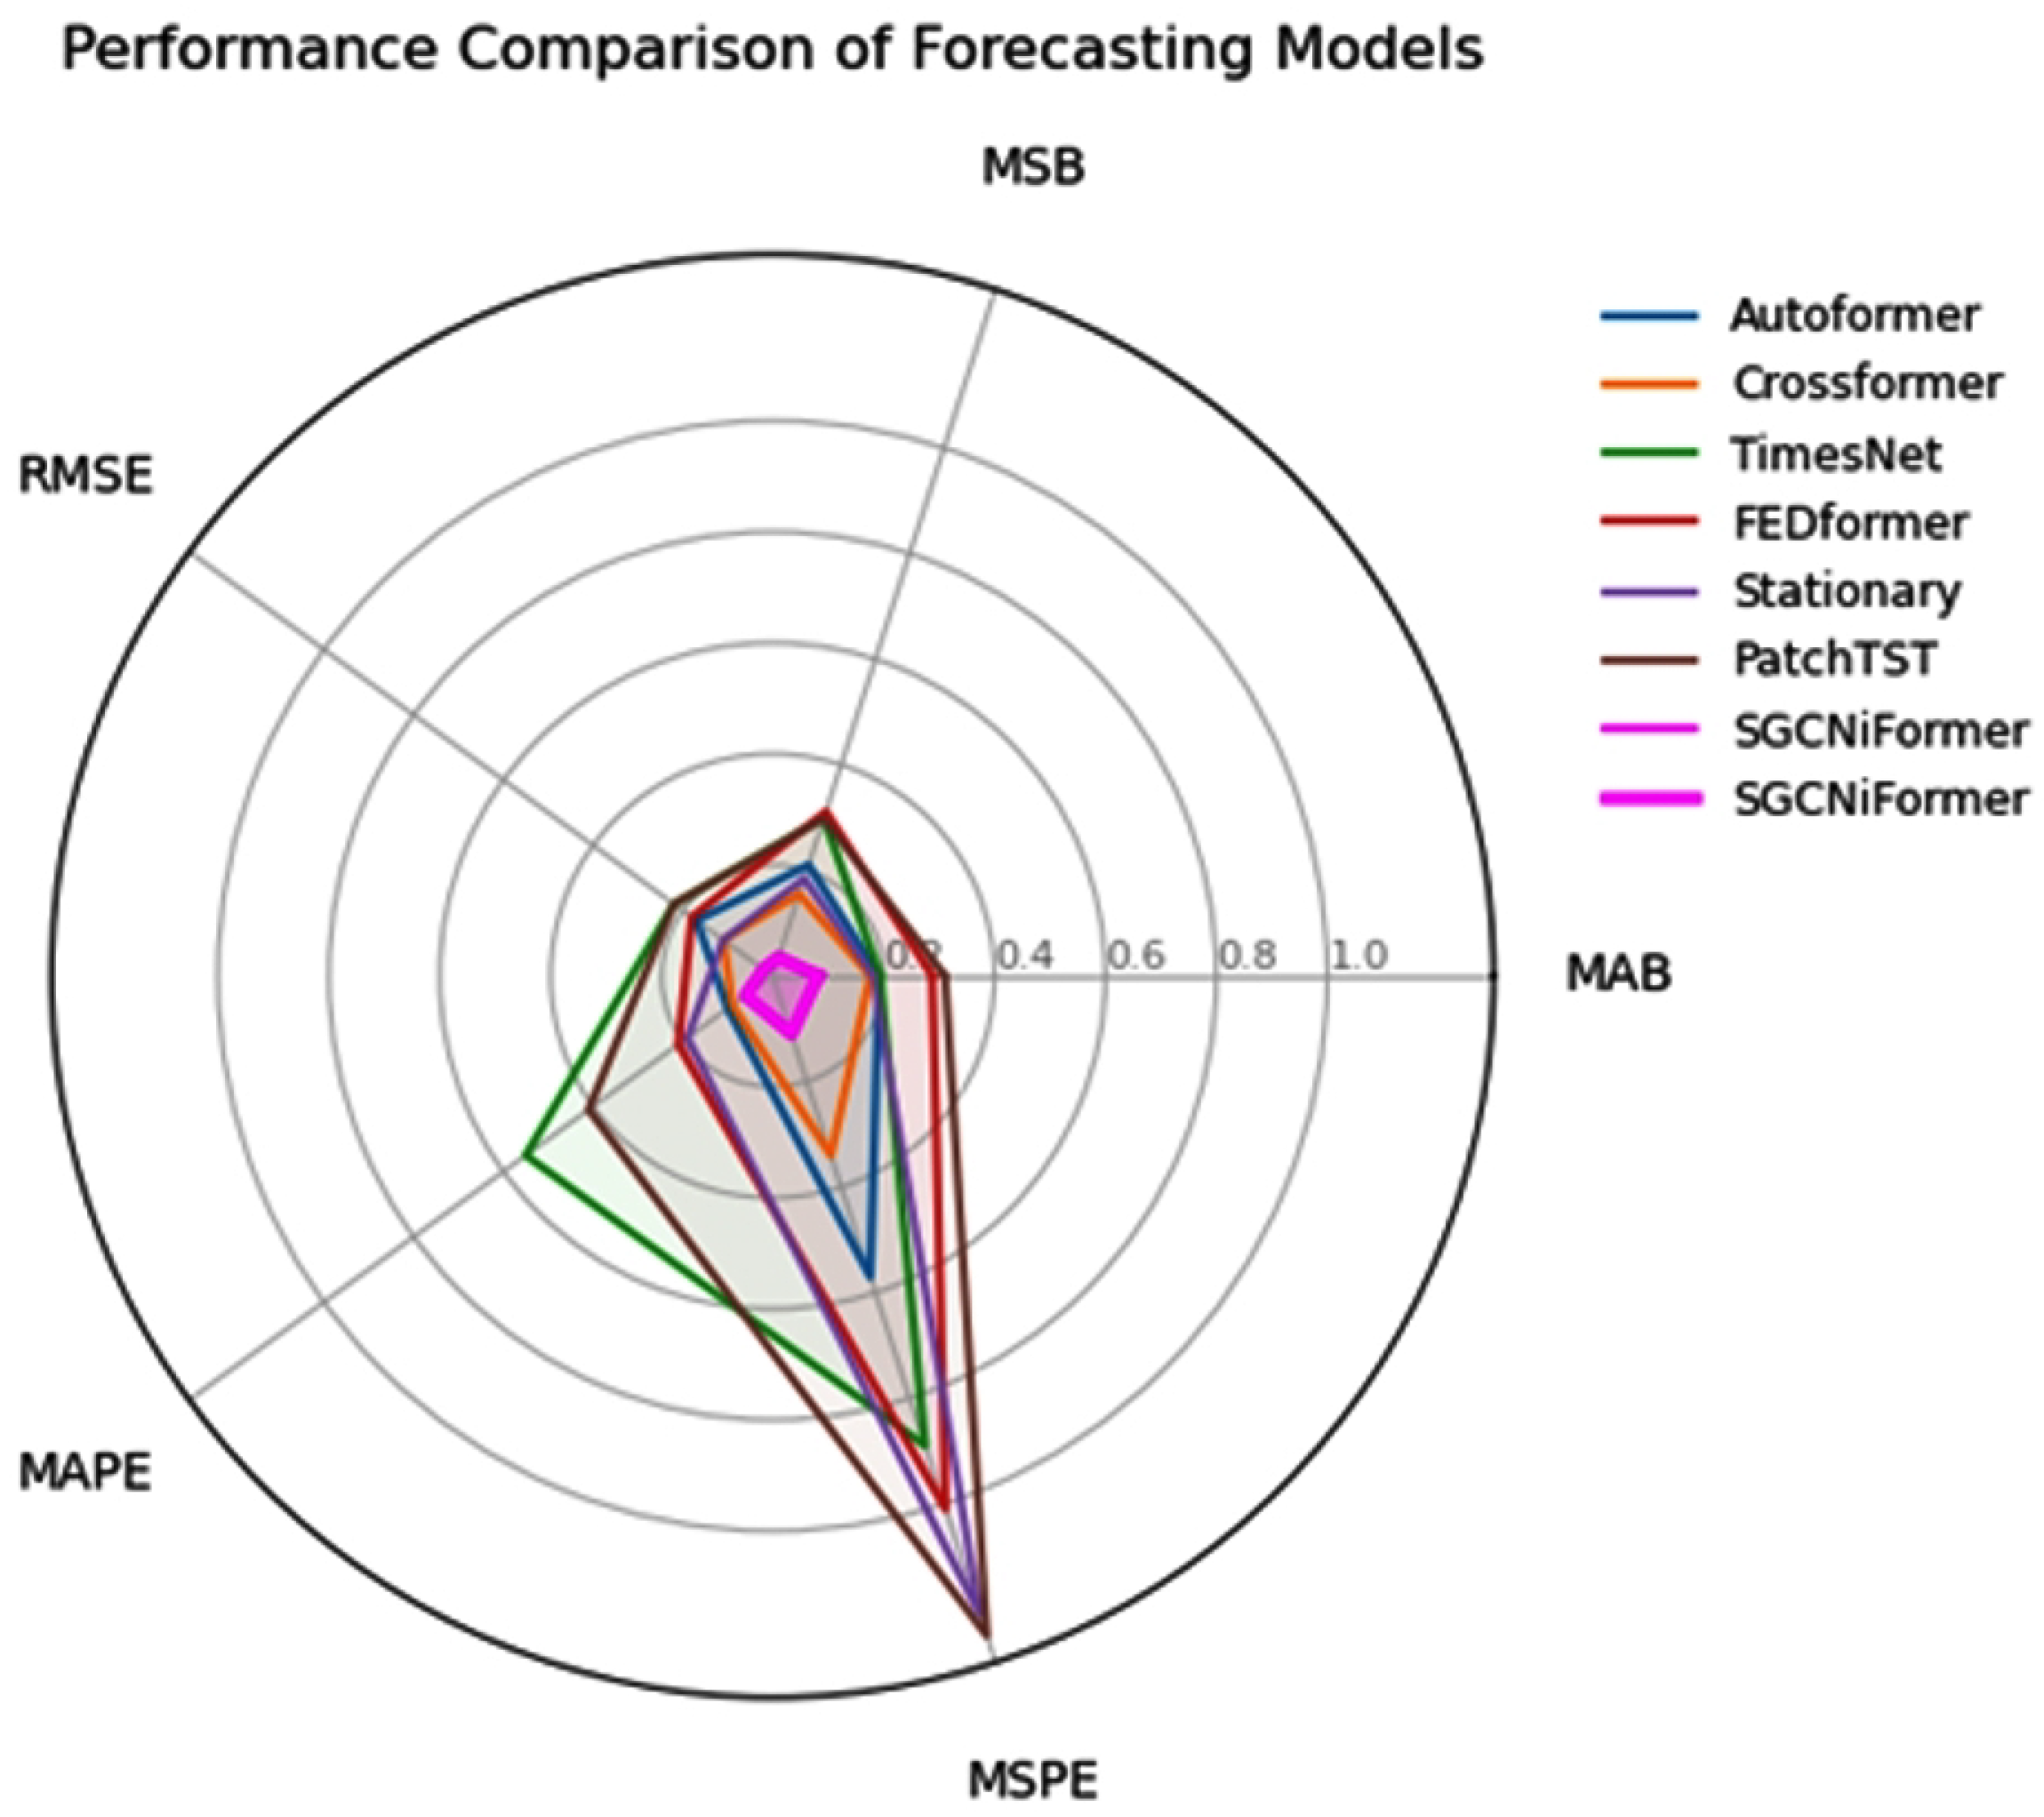
Table 2. First, from the metrics of MAE, MSE, and RMSE, SGCNiFormer performs excellently in all metrics, especially in MAE and MSE, with values of 0.082 and 0.035, respectively, significantly better than other comparison models. This result indicates that SGCNiFormer has significantly improved the accuracy of time-series prediction. As shown in
Figure 5, this study compared the performance of various time-series prediction models through radar charts. All indicators are indicated as having better performance with smaller values. The SGCNiFormer model shows significant advantages in all indicators. Its radar map polygon area is the smallest and closest to the coordinate origin, indicating that its prediction error is comprehensively lower than that of the baseline model.
The superior performance of SGCNiFormer is primarily attributed to its innovative integration of the advantages of graph convolutional networks (GCN) and the Transformer architecture. Specifically, the GCN module introduces a graph neural network (GNN) structure, enabling the model to deeply mine the complex relationships between nodes in time-series data, especially in scenarios with strong nonlinearity and multivariate dependencies. GCN effectively captures local and global dependencies between nodes through multi-layer graph convolution operations, thereby enhancing the model’s ability to learn complex time-dependent patterns. This capability is particularly important when handling multi-variable complex time-series data, as traditional methods often struggle to directly model such high-dimensional dependency structures. Compared with traditional time-series models, GCN has the advantage of automatically establishing dependencies between nodes through graph convolution without the need for manually setting specific dependency structures. Through this mechanism, SGCNiFormer can more accurately capture the potential spatio-temporal dependency patterns in the data, which are particularly critical for complex time-series prediction, especially in scenarios where long-term interactions between different variables need to be considered. Additionally, the multi-head self-attention mechanism in the Transformer architecture further enhances the performance of SGCNiFormer. The Transformer module efficiently handles long-range dependencies, while the multi-head self-attention mechanism enables the model to compute attention weights in parallel across different subspaces, thereby capturing multi-level dependencies in time-series data. Combined with the graph structure of GCN, SGCNiFormer performs well in processing long time-series data, avoiding the limitations of traditional models in modeling long-term dependencies.
By combining the advantages of GCN and Transformer, SGCNiFormer not only effectively captures complex dependencies in time-series data but also globally handles dependencies over long time spans, further improving the prediction accuracy of the model. When compared with other advanced time-series prediction models (such as PatchTST, FEDformer, TimesNet, etc.), SGCNiFormer performs outstandingly in MAPE and MSPE, with an MAPE of 0.06 and an MSPE of 0.11, far lower than other models, proving its superiority in complex time series prediction tasks. This finding indicates that SGCNiFormer not only effectively reduces errors but also provides more reliable prediction results when dealing with complex and diverse real-world applications.
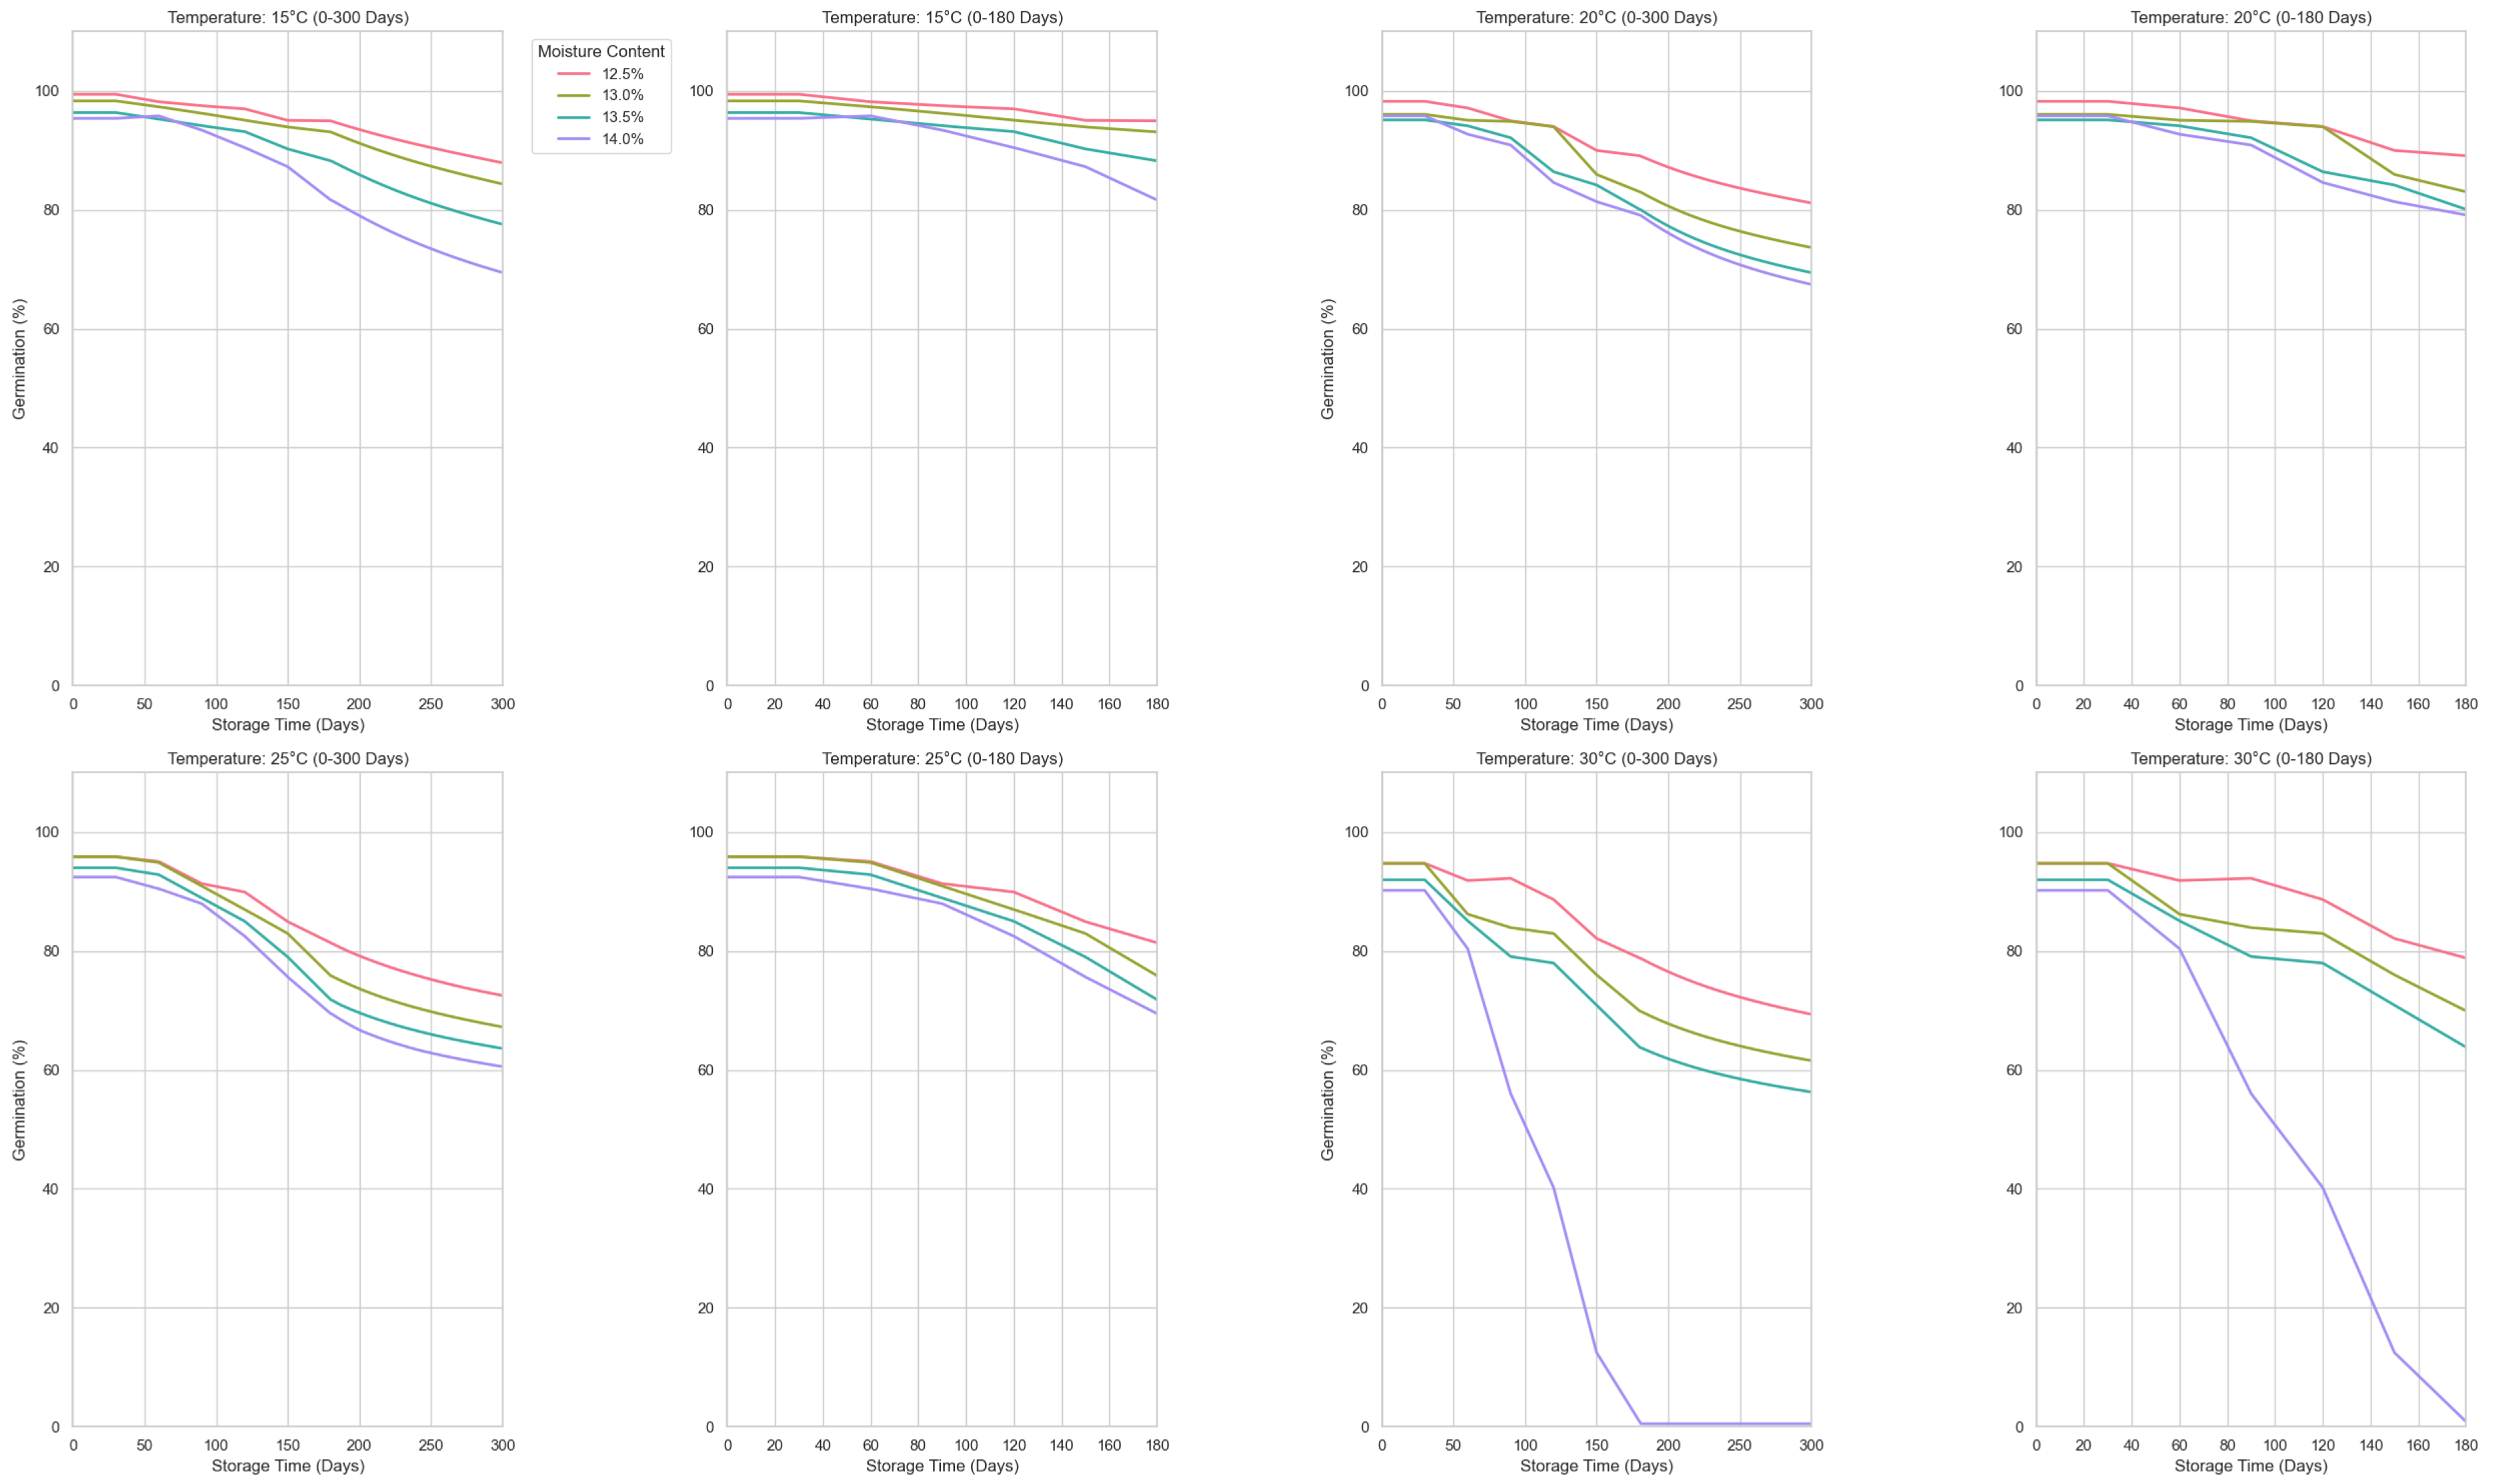
Figure 6 shows the changes in germination rate at different storage temperatures. The first and third columns are the output results of the prediction model, and the second and fourth columns are the line graphs of the results collected every thirty days in the experimental data. Specifically, under all test conditions, the model successfully predicted the variation of the germination rate with storage time and accurately reflected the differences under different humidity levels. It can be seen from this that the SGCNiFormer model shows high accuracy, especially in effectively predicting the changing trend of wheat germination rate under different storage temperatures and humidity conditions.
In summary, SGCNiFormer innovatively integrates graph convolutional networks and the Transformer architecture, particularly leveraging GCN’s ability to capture complex relationships in time-series data, enabling it to achieve significant advantages across multiple key evaluation metrics. This demonstrates its potential and application value in complex time-series prediction tasks. Future work can focus on further optimizing the model structure to enhance its performance on large-scale datasets and in real-time prediction scenarios.
3.2. Ablation Experiments of Predictive Models
In the SGCNiFormer model, the roles of each module and their impact on performance can be systematically analyzed through ablation experiment results, as shown in
Table 3. First, the GCN module plays a decisive role in modeling the spatial dependency between environmental variables and wheat quality indicators. Comparing Model 1 and Model 2, the introduction of GCN reduces MAE from 0.12 to 0.09, MSE from 0.091 to 0.032, and RMSE from 0.12 to 0.07. This significant improvement indicates that GCN captures the nonlinear interaction characteristics between temperature, humidity, and quality indicators through graph structure, effectively resolving the topological associations in multidimensional data, and thus becoming the core driver of model performance.
Second, the Dynamic Gate Module (DGM) further optimizes model performance by adaptively integrating features from GCN and Transformer. Compared with Model 2 and the complete model SGCNiFormer, the RMSE decreases from 0.07 to 0.02, and the MAPE decreases from 0.11 to 0.06 after adding DGM. DGM dynamically coordinates the weight allocation of spatial and temporal features through a gating mechanism. For example, in long-term trend prediction, it emphasizes the global temporal modeling capabilities of the Transformer, while in environmental variable coupling analysis, it reinforces the spatial interaction effects of the GCN, thereby avoiding modal conflicts and improving generalization capabilities. Although Model 2 MSE is slightly lower than that of SGCNiFormer, the significant optimization of RMSE and MAPE highlights the necessity of DGM in complex scenarios.
Finally, iTransformer provides basic temporal encoding capabilities as the backbone network. Model 1’s MAE and MAPE are significantly higher than other models, indicating that temporal encoding alone is insufficient to fully model the complexity of dynamic systems. However, when combined with GCN, its performance improves significantly, demonstrating a synergistic effect between iTransformer’s attention mechanism and GCN’s spatial modeling capabilities. For example, iTransformer captures the nonlinear decay trend of germination rate, while GCN analyzes the modulating effect of environmental variables on this trend, and the two complement each other to enhance the model’s overall prediction capability.
3.3. Comparison of Clustering Models
In this study, we propose the K-Smeans clustering algorithm for the classification of wheat quality, taking into account three quality evaluation indicators: germination rate, fatty acid value, and weight per unit area. These indicators are derived from physiological, chemical, and physical properties.As the sampled values of each index are obtained at different times, this paper proposes an efficient time prediction model, SGCNiFormer, to supplement the sample information of each index value. The results demonstrate that the prediction is within a reasonable range. Consequently, the K-Smeans clustering algorithm incorporates temporal data to enhance the stability and rationality of the clustering process. This study further investigates the merits of K-Smeans in wheat quality clustering by contrasting it with the K-means++ clustering algorithm. During the clustering analysis, the clustering results with different numbers of clusters are evaluated using three different clustering evaluation metrics: the silhouette coefficient, the Davies–Bouldin index (DB index), and the Dunn index. The optimal number of clusters is determined based on these results.
As demonstrated in
Figure 7 and
Figure 8, the silhouette score of K-Smeans clustering attains its maximum value when the number of clusters is 7, signifying that the similarity of the samples within a cluster is high at this point, while the dissimilarity between clusters is substantial. The DB index and Dunn index, on the other hand, demonstrate the minimum and maximum values, respectively, thereby validating the conclusion that the clustering outcome is optimal when the number of clusters is 7. Consequently, based on the evaluation indices of the clustering process, it can be concluded that the optimal number of clusters for K-Smeans clustering is 7. However, in contrast, the K-means++ algorithm, despite exhibiting a marginally elevated silhouette coefficient when the number of clusters is 7, demonstrates suboptimal performance in both the DB index and the Dunn index. This suggests that K-means++ tends to exhibit significant overlap between clusters, resulting in a suboptimal clustering outcome. The underlying cause of this phenomenon is that the initial cluster center selection of the K-means++ algorithm relies on a random process, which is prone to local optima and thus affects the accuracy and stability of the clustering results. K-Smeans avoids this problem by selecting the farthest data point as the cluster center during initialization, further enhancing the stability and accuracy of clustering.
A comparison of the two algorithms reveals that K-Smeans offers significant advantages in the analysis of wheat quality. First, the K-Smeans algorithm can reasonably classify samples into different quality grades based on historical and future predicted data of wheat quality, thereby improving the stability and accuracy of the clustering results. Second, the K-Smeans algorithm improves the effectiveness of the clustering results by optimizing the selection of the initial cluster center, avoiding the instability of the traditional K-means algorithm in the selection of the initial cluster center. This enhances the adaptability of K-Smeans to the dynamic characteristics of data, particularly in the context of complex datasets such as wheat quality classification, thereby providing a more scientific and objective approach to evaluating wheat quality grades.
The K-Smeans algorithm boasts significant advantages in the context of cluster analysis of wheat quality indicators, particularly when the number of clusters is set at seven. In such instances, all evaluation indicators attain their optimal values, signifying that the clustering results are the most rational at that particular juncture. The K-Smeans algorithm facilitates more effective classification of wheat samples into distinct quality grades, thereby providing a scientific foundation for the assessment and classification of wheat quality. This approach enables not only the scientific evaluation of historical data but also the incorporation of future predicted trends, thereby providing more reliable support for the accurate classification of wheat quality.
3.4. Analysis of Results
The integration of time-series prediction and K-Smeans clustering analysis has led to substantial enhancements in the management of wheat quality, particularly with regard to preserving its stability during storage. Conventional quality assessment methods frequently depend on static data and fail to consider the temporal variations in wheat quality, which can result in errors or inaccuracies in quality management. To address these limitations, a novel clustering analysis method is proposed, underpinned by the K-Smeans algorithm. This approach not only utilizes historical data but also incorporates the prediction of future data, thereby enhancing the adaptability of clustering analysis to the time-dynamic changes in wheat quality.
First, time-series prediction provides critical time-dimension information for clustering analysis. In conventional clustering methods, data are typically static, precluding the analysis of changes in wheat quality over time. However, with a time-series prediction model, we can forecast the probable trend of wheat quality over time. Specifically, we constructed a time-series model based on historical data to predict wheat quality at a future point in time. These future predictions were then integrated with historical data to inform the clustering analysis, ensuring that the quality characteristics of each sample reflected not only the present state but also past changes and future trends. This approach enhanced the comprehensiveness of the clustering process, enabling more precise capture of the dynamic changes in wheat quality. Consequently, this methodology facilitates the identification and prediction of fluctuations in wheat quality during storage and subsequently enables the implementation of appropriate measures to control and maintain wheat quality.
Secondly, the employment of the K-Smeans clustering algorithm in this study serves to further optimize the shortcomings of the conventional K-means algorithm. The K-means algorithm is highly sensitive to the selection of the initial cluster center, which frequently leads to the discovery of local optima. These local optima have the potential to adversely impact the accuracy and stability of the clustering process. To address this issue, the K-Smeans algorithm utilizes a more effective method for selecting the initial cluster center. Specifically, K-Smeans selects the data point that is farthest from the selected cluster center as the new cluster center during initialization. This strategy effectively avoids the common problem of improper selection of initial cluster centers in the K-means algorithm, ensuring the stability and accuracy of the clustering results. Through this optimization, K-Smeans can better cluster different wheat qualities, thereby providing a more scientific basis for quality classification in wheat storage, as shown in
Table 4 and
Table 5.
The integration of time-series prediction with K-Smeans cluster analysis enables the accurate assessment of current wheat quality and the prediction of future quality changes, facilitating the implementation of suitable storage management strategies. Specifically, storage managers can utilize the outcomes of cluster analysis to comprehensively understand the quality characteristics of each cluster, enabling the implementation of targeted measures based on these characteristics. For instance, for wheat of lower quality, specific preservation measures can be implemented, such as reducing storage temperature or adjusting humidity levels, to decelerate the rate of quality decline. Conversely, for wheat of higher quality, conventional storage conditions can be employed to minimize unnecessary expenses. Additionally, through time-series prediction, storage managers can ascertain the timing of potential quality fluctuations, enabling proactive preparation and mitigation of losses incurred by sudden quality declines.
However, this method also has certain limitations. In practical applications, data quality significantly impacts the accuracy of prediction results. Wheat quality is influenced by various factors, such as storage conditions and climate changes. If data collection contains errors or omissions, this may affect the model’s predictive accuracy. Additionally, the model’s generalization ability may face challenges when applied to different crop types or storage environments. Although this method demonstrates excellent performance in wheat storage management, its applicability to other crops or environments requires further validation.
The integration of time-series prediction with K-S means clustering analysis empowers wheat storage management to not only ensure the stability of wheat quality but also more effectively classify and manage wheat of varying qualities. Leveraging historical data and predictive information, managers can scientifically adjust storage strategies to ensure that wheat maintains its optimal quality during storage, thereby mitigating market risks associated with quality fluctuations. This approach enhances the efficacy of wheat storage management and provides a novel technical framework for the long-term storage and quality control of agricultural products.


