


Effectiveness of Cyclic Voltammetry in Evaluation of the Synergistic Effect of Phenolic and Amino Acids Compounds on Antioxidant Activity: Optimization of Electrochemical Parameters

 ,
,  ,
,  and
and
Abstract
1. Introduction
2. Materials and Methods
2.1. Standards and Reagents
2.2. Cyclic Voltammetry Measurement
2.3. Statistical Analysis
3. Results and Discussion
3.1. Electrochemistry of Phenolic Compounds
3.1.1. Optimization of Electrochemical Conditions
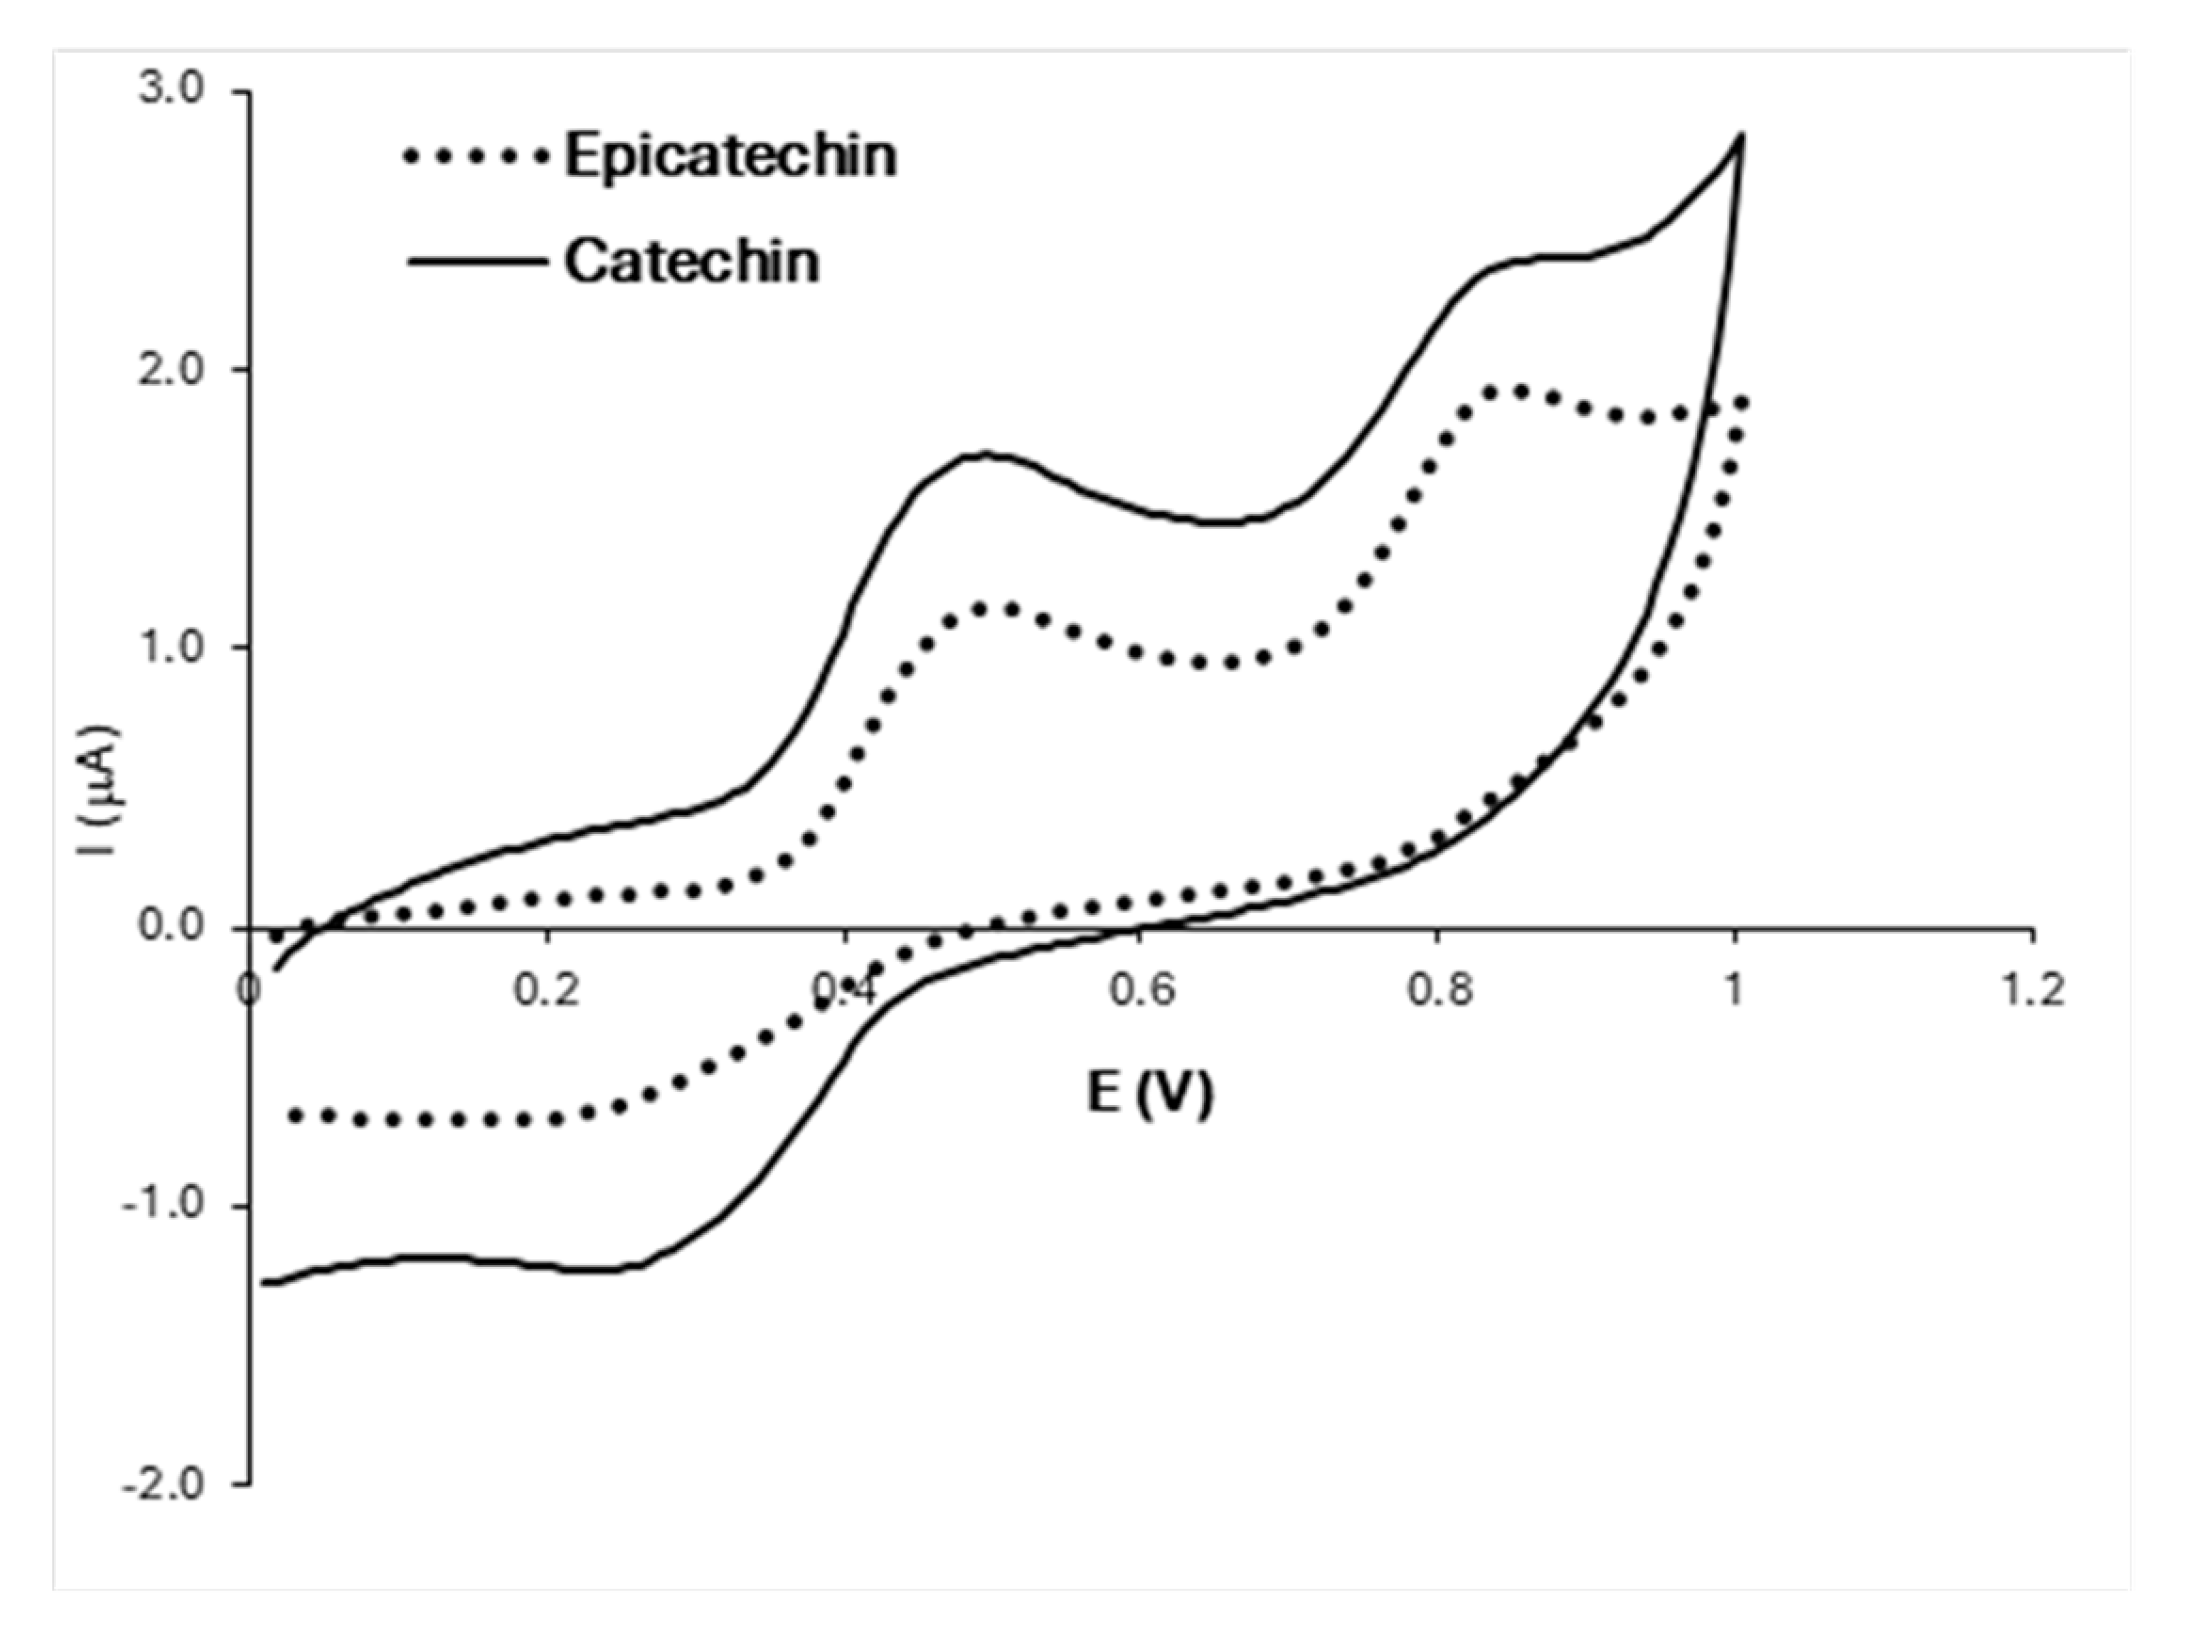
3.1.2. Electrochemistry of Phenolic Compounds: Individual Model Solutions
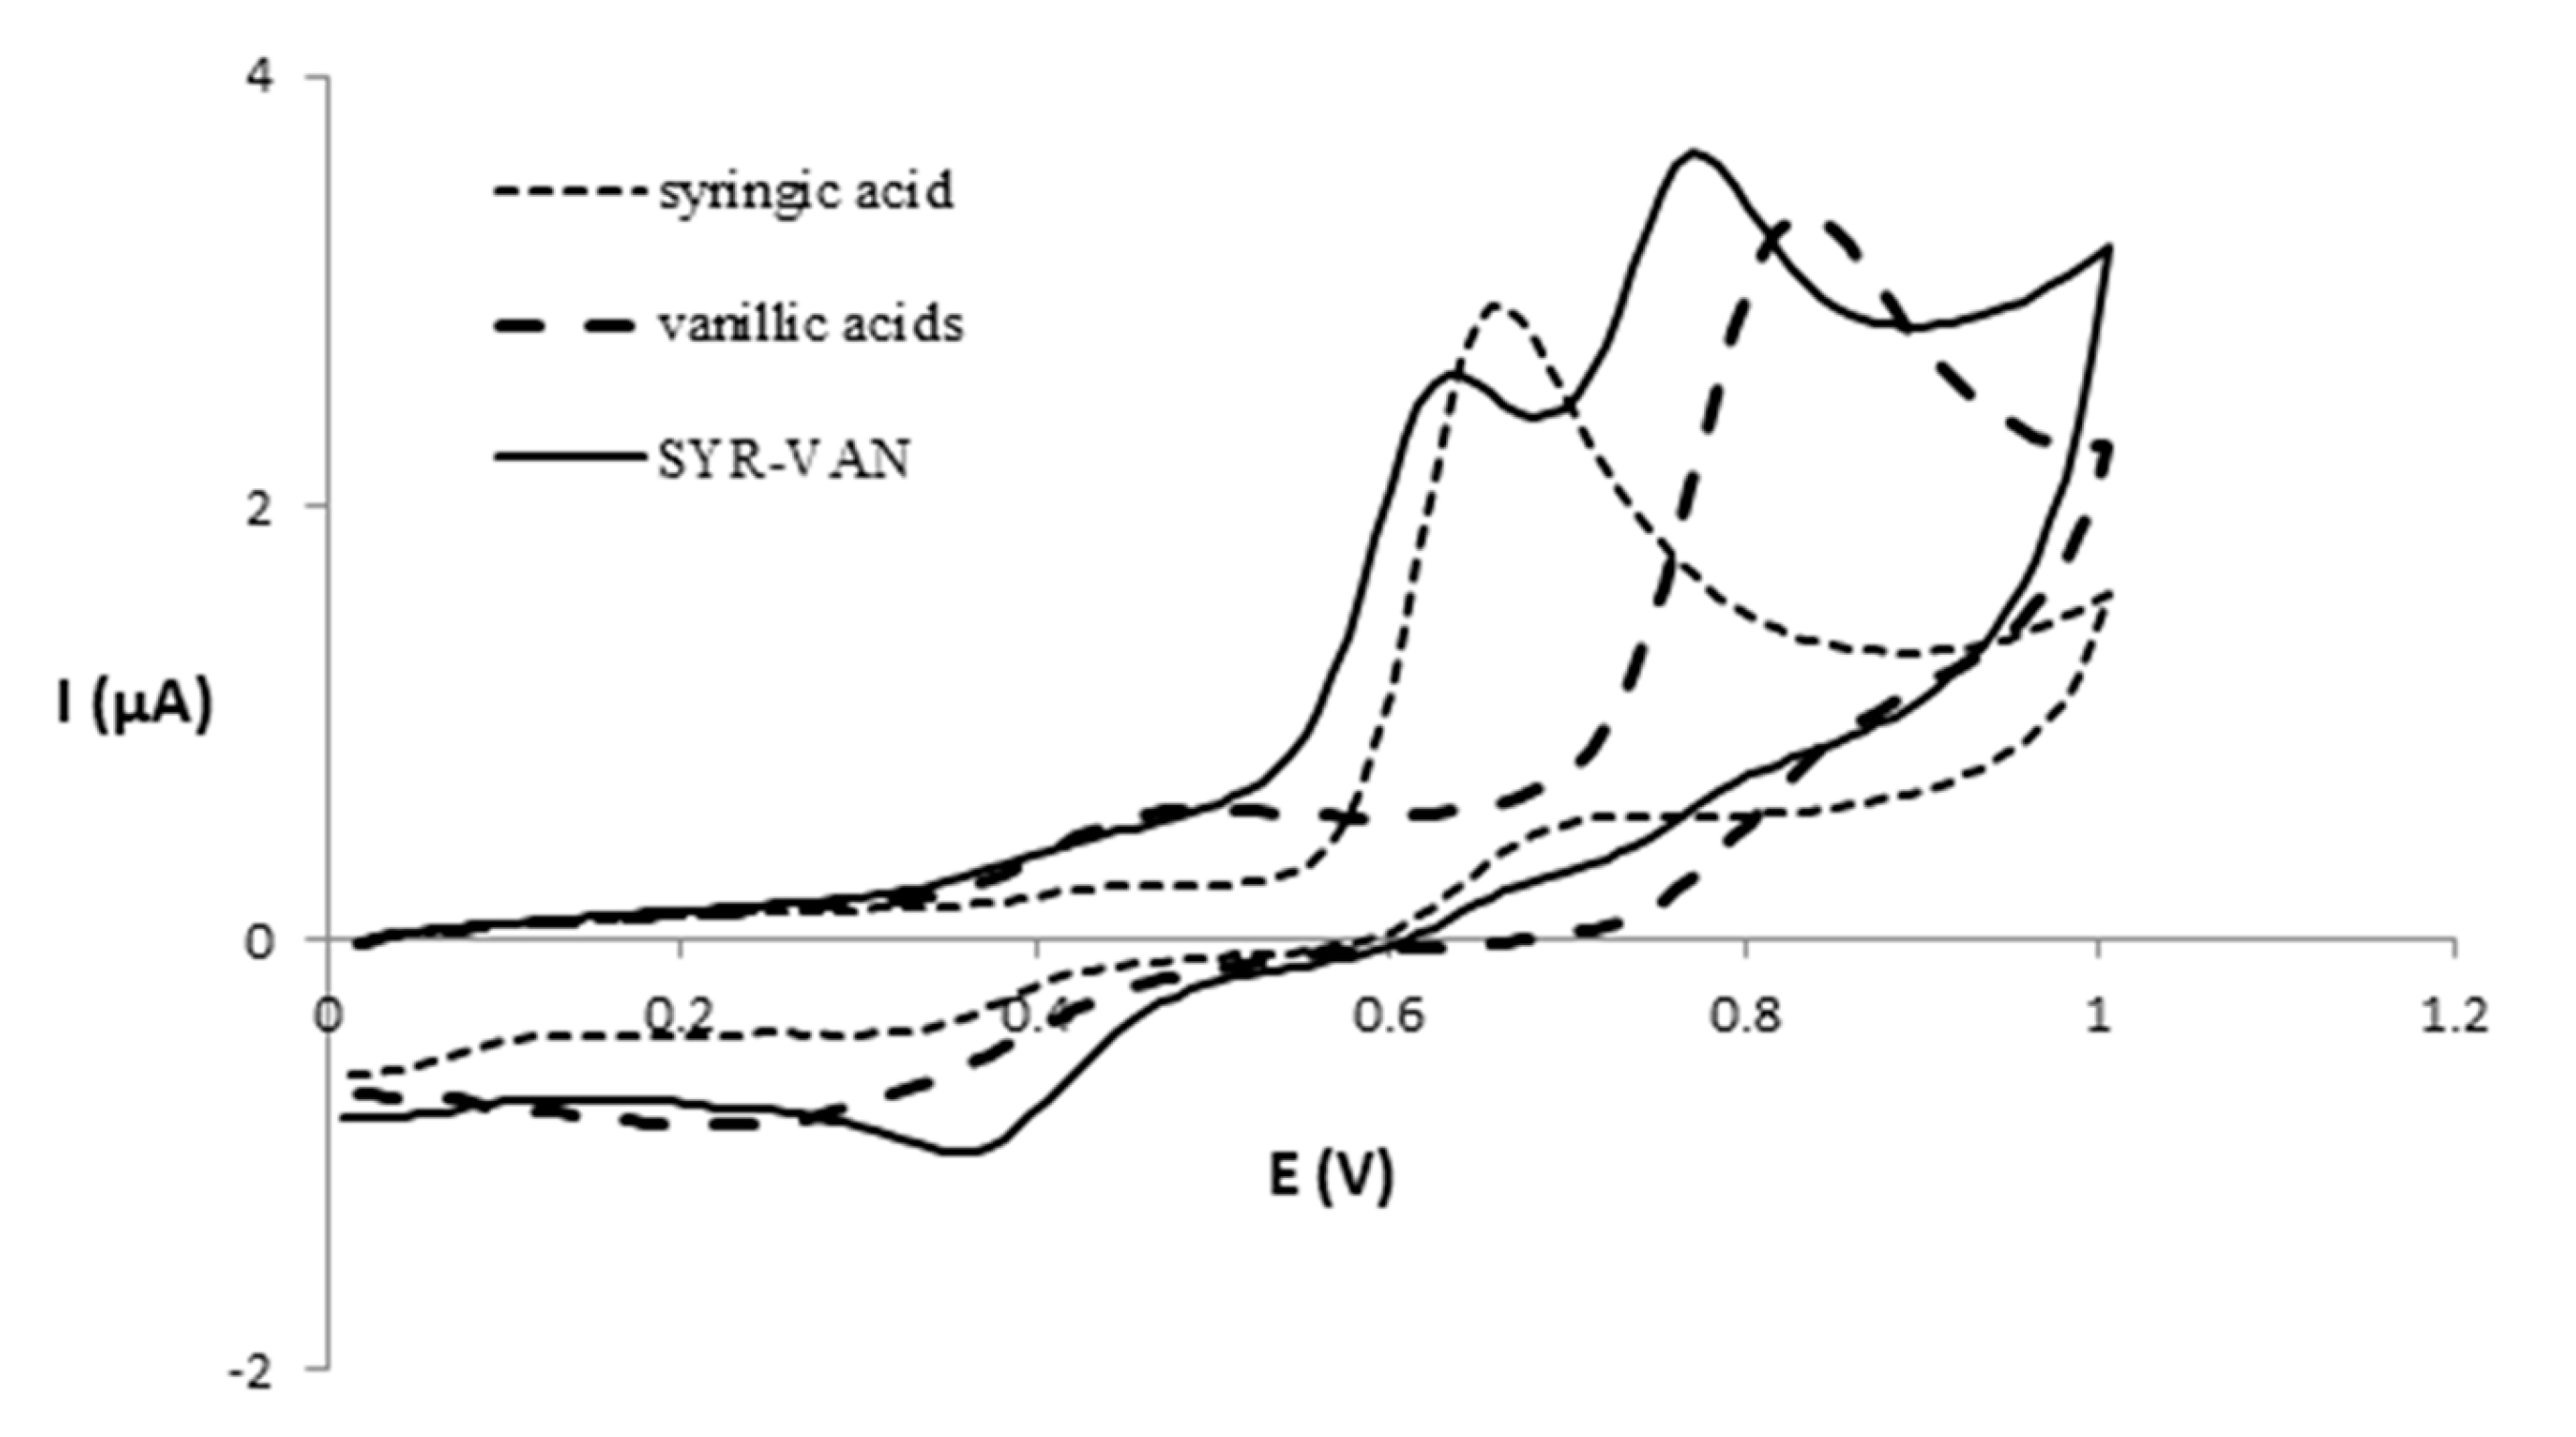
3.1.3. Electrochemistry of Phenolic Compounds: Binary Model Solutions
3.2. Electrochemistry of Amino Acids
3.2.1. Optimization of Electrochemical Conditions
3.2.2. Electrochemistry of Amino Acids: Individual Model Solutions
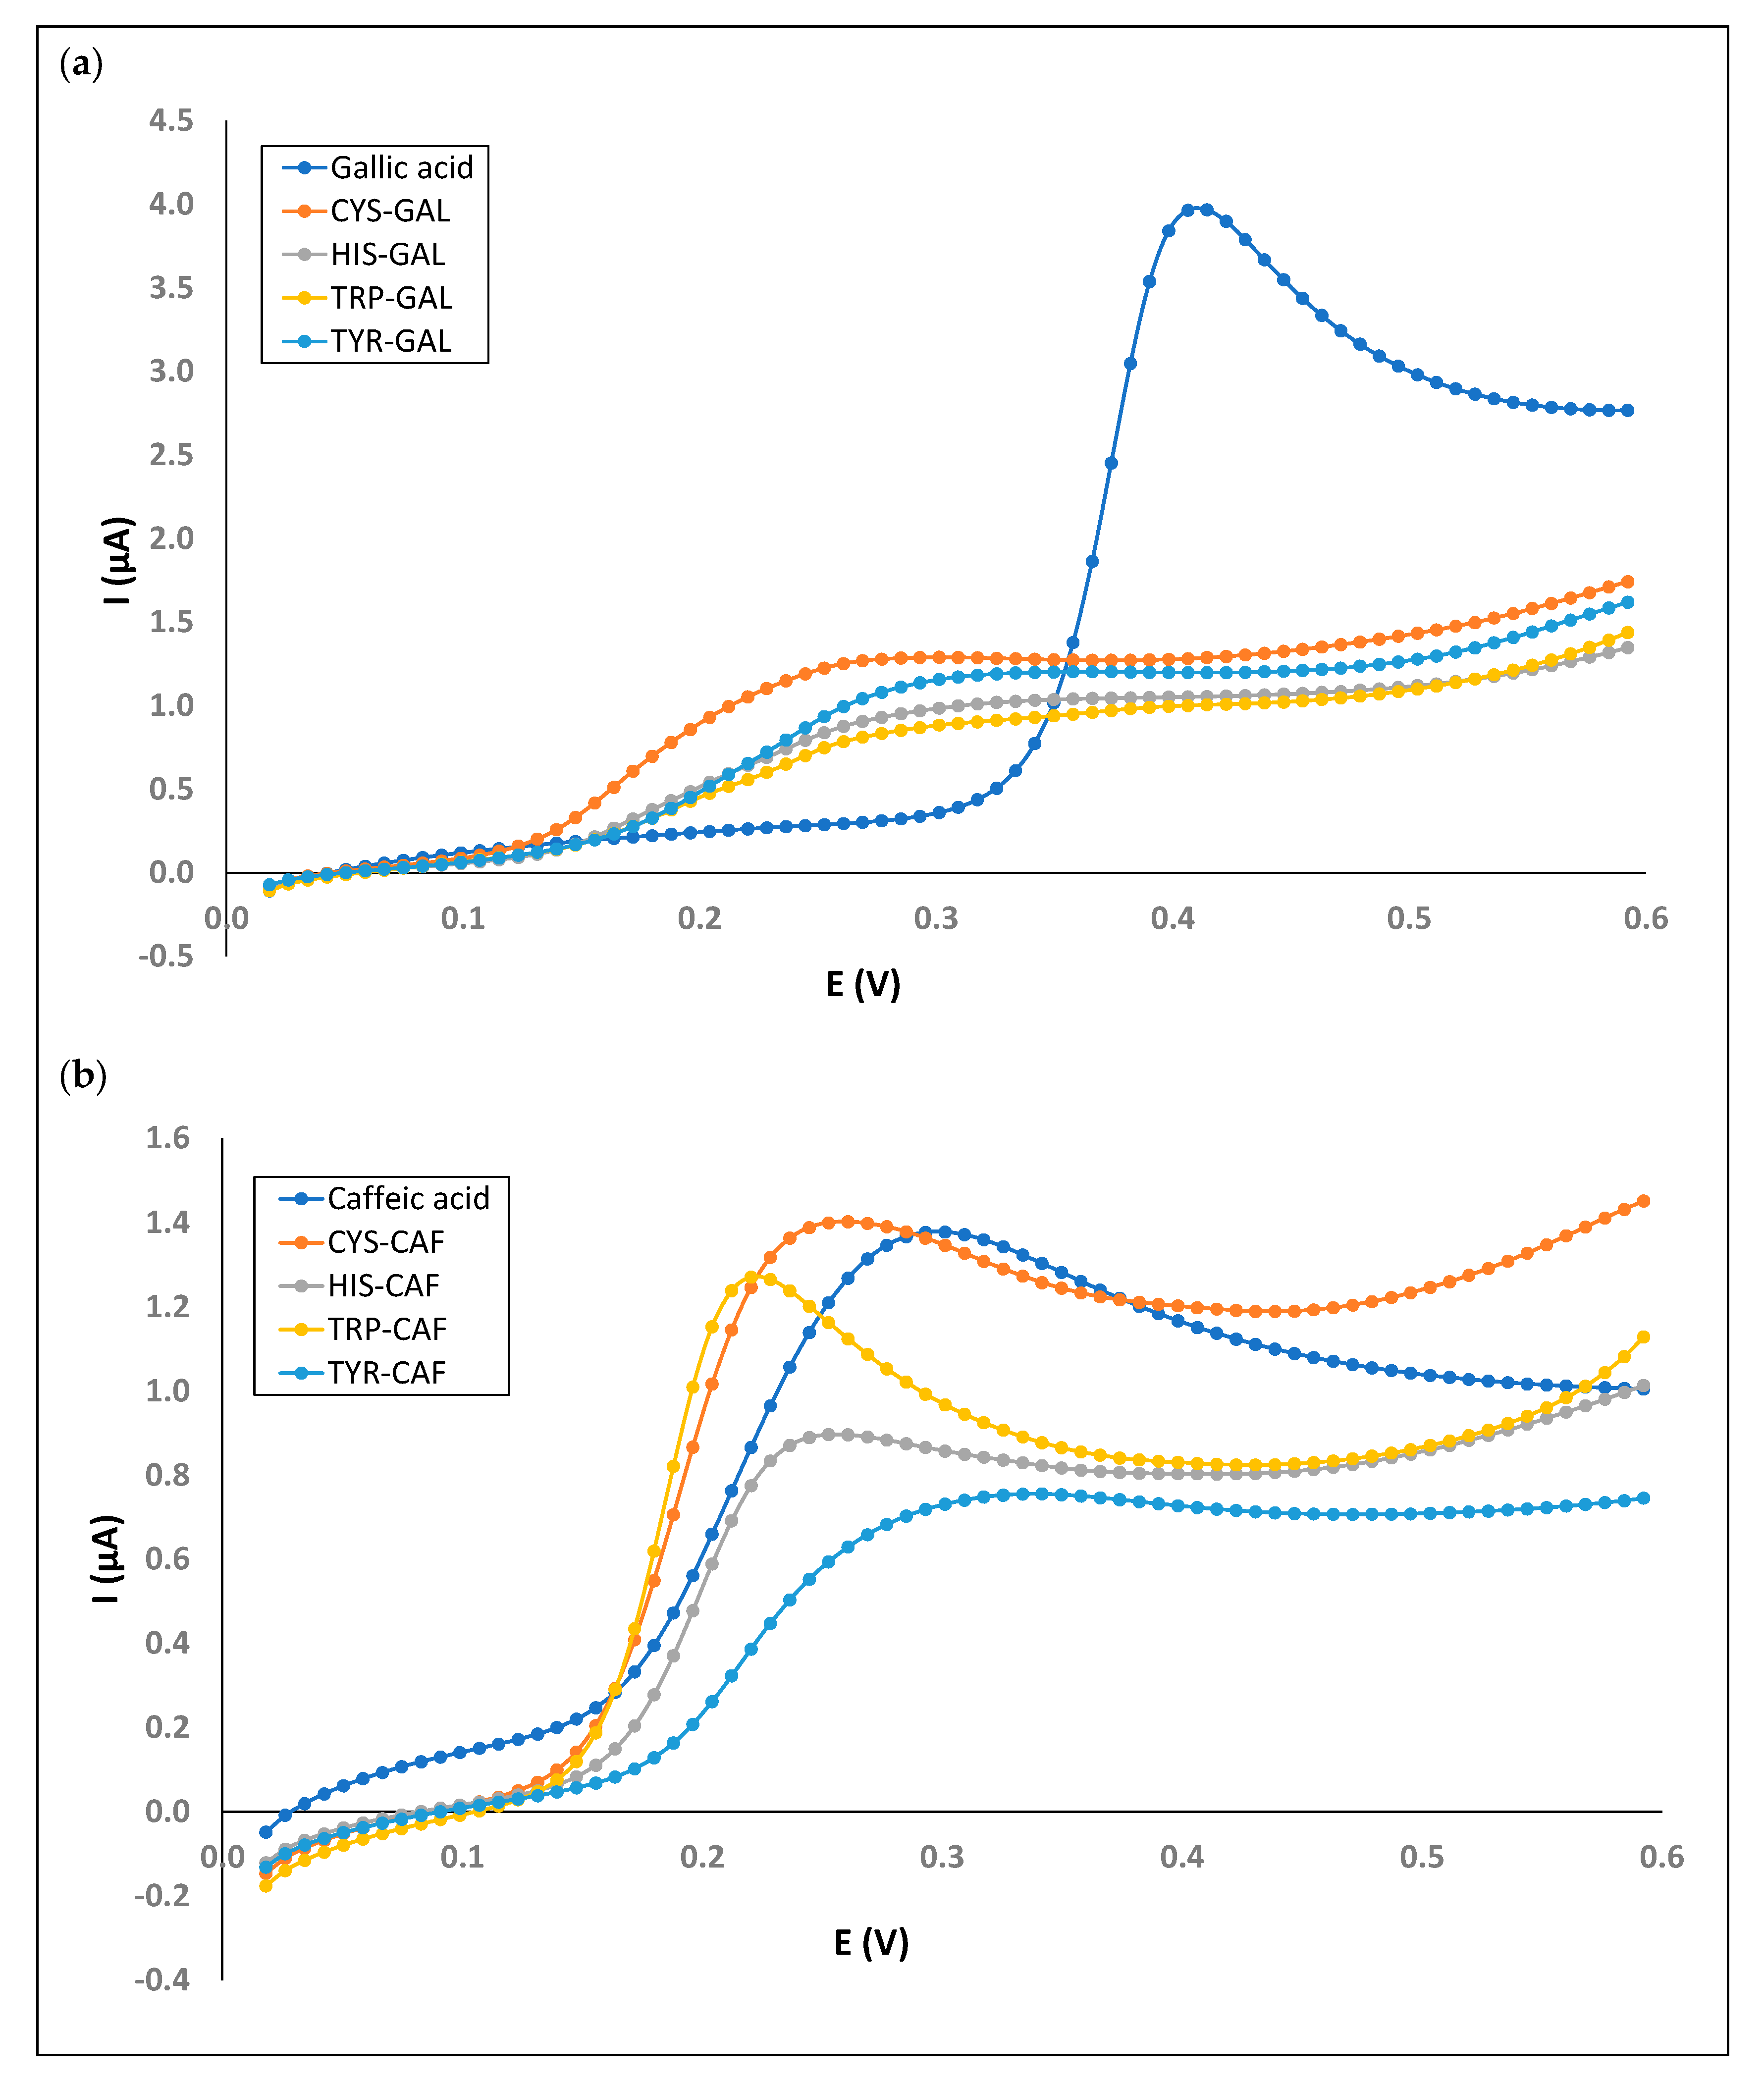
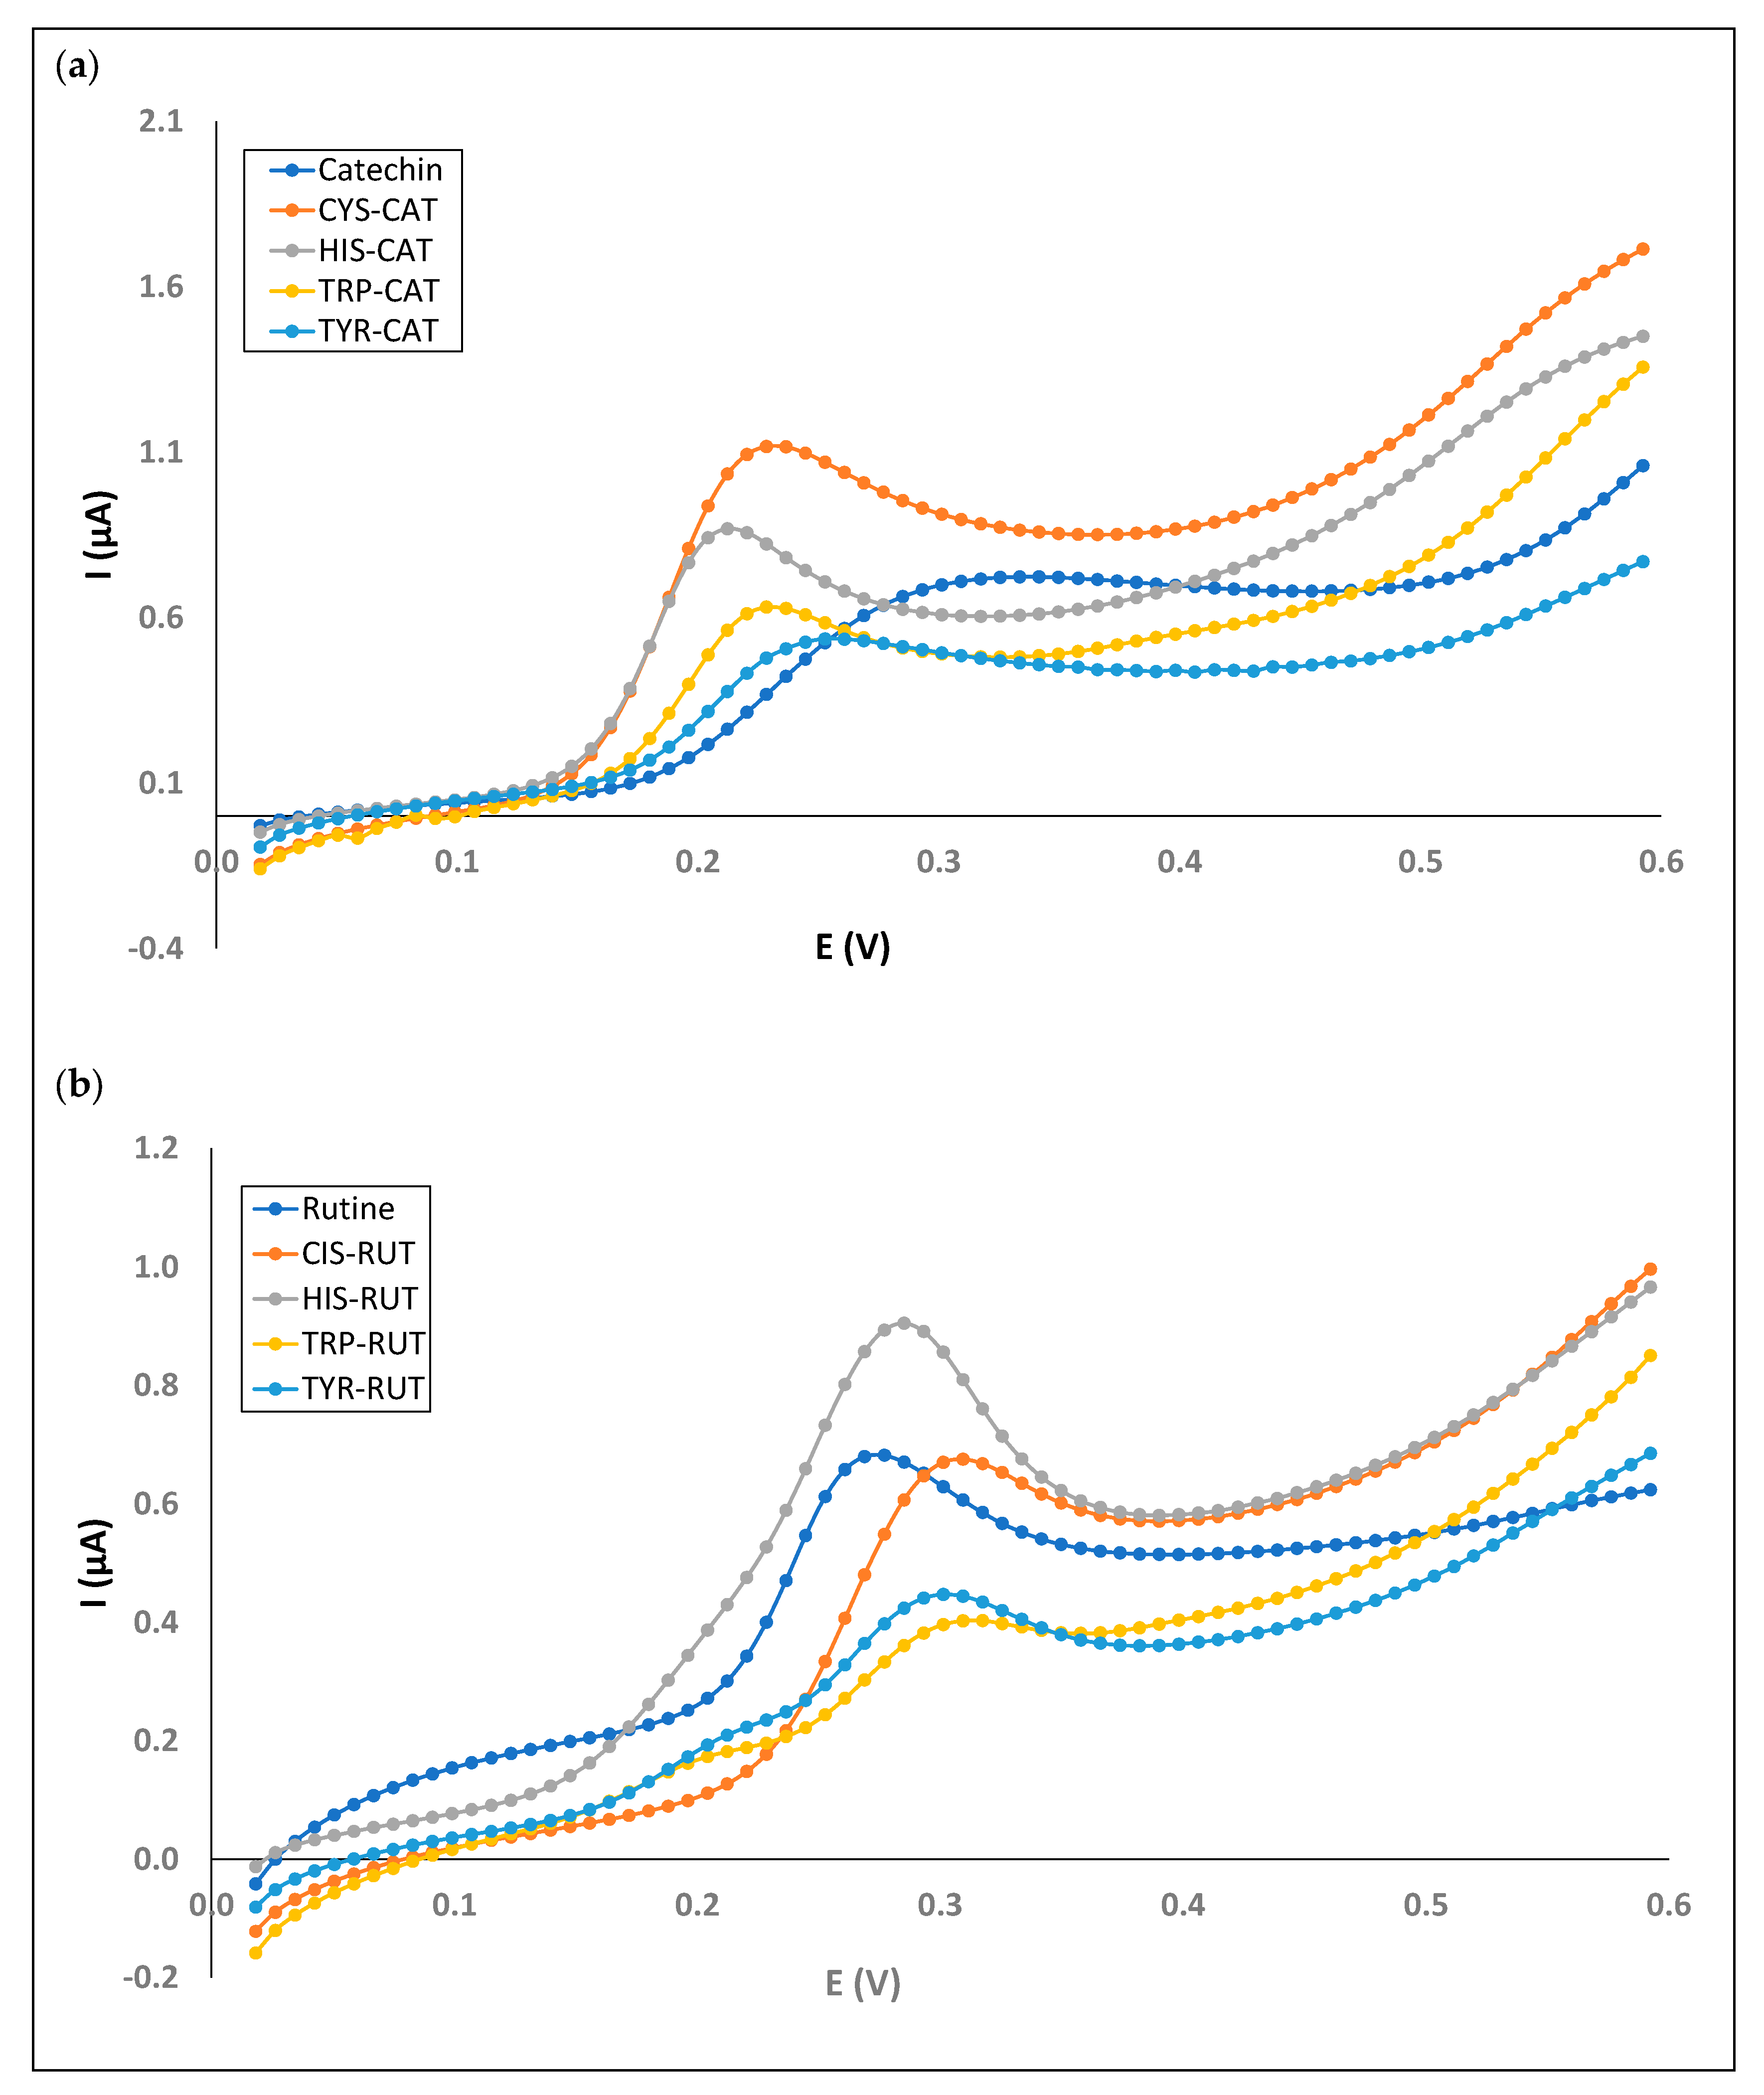
3.2.3. Electrochemistry of Amino Acids: Binary Model Solutions
3.3. Electrochemistry of Mixed Phenol–Amino Acid Solutions
4. Conclusions
Author Contributions
Funding
Institutional Review Board Statement
Informed Consent Statement
Data Availability Statement
Acknowledgments
Conflicts of Interest
References
- Hernanz, D.; Jara-Palacios, M.J.; Escudero-Gilete, M.L.; Heredia, F.J. Applications of the voltammetric analysis to wine products. In Applications of the Voltammetry; Stoytcheva, M., Zlatev, R., Eds.; IntechOpen: London, UK, 2017; pp. 109–127. [Google Scholar]
- Kilmartin, P.A.; Zou, H.; Waterhouse, A.L. A cyclic voltammetry method suitable for characterizing antioxidant properties of wine and wine phenolics. J. Agric. Food Chem. 2001, 49, 1957–1965. [Google Scholar] [CrossRef]
- Oroian, M.; Escriche, I. Antioxidants: Characterization, natural sources, extraction and analysis. Food Res. Int. 2015, 74, 10–36. [Google Scholar] [CrossRef]
- Jiao, Y.; Kilmartin, P.A.; Fan, M.; Quek, S.Y. Assessment of phenolic contributors to antioxidant activity of new kiwifruit cultivars using cyclic voltammetry combined with HPLC. Food Chem. 2018, 268, 77–85. [Google Scholar] [CrossRef]
- Lino, F.M.A.; de Sá, L.Z.; Torres, I.M.S.; Rocha, M.L.; Dinis, T.C.P.; Ghedini, P.C.; Somerset, V.S.; Gil, E.S. Voltammetric and spectrometric determination of antioxidant capacity of selected wines. Electrochim. Acta 2014, 128, 25–31. [Google Scholar] [CrossRef]
- De Oliveira Neto, J.R.; Garcia Rezende, S.; Sanz Lobón, G.; Alves Garcia, T.; Lopes Macedo, I.Y.; Ferreira Garcia, L.; Farias Alves, V.; Sapateiro Torres, I.M.; Fontes Santiago, M.; Schmidt, F.; et al. Electroanalysis and laccase-based biosensor on the determination of phenolic content and antioxidant power of honey samples. Food Chem. 2017, 237, 1118–1123. [Google Scholar] [CrossRef]
- Kilmartin, P.A.; Hsu, C.F. Characterisation of polyphenols in green, oolong, and black teas, and in coffee, using cyclic voltammetry. Food Chem. 2003, 82, 501–512. [Google Scholar] [CrossRef]
- Samoticha, J.; Jara-Palacios, M.J.; Hernandez-Hierro, J.M.; Heredia, F.J.; Wojdyło, A. Phenolic compounds and antioxidant activity of twelve grape cultivars measured by chemical and electrochemical methods. Eur. Food Res. Technol. 2018, 244, 1933–1943. [Google Scholar] [CrossRef]
- Vilas-Boas, Â.; Valderrama, P.; Fontes, N.; Geraldo, D.; Bento, F. Evaluation of total polyphenol content of wines by means of voltametric techniques: Cyclic voltammetry vs. differential pulse voltammetry. Food Chem. 2019, 276, 719–725. [Google Scholar] [CrossRef] [PubMed]
- Chen, J.; Gorton, L.; Åkesson, B. Electrochemical studies on antioxidants in bovine milk. Anal. Chim. Acta 2002, 474, 137–146. [Google Scholar] [CrossRef]
- Jara-Palacios, M.J.; Escudero-Gilete, M.L.; Hernández-Hierro, J.M.; Heredia, F.J.; Hernanz, D. Cyclic voltammetry to evaluate the antioxidant potential in winemaking by-products. Talanta 2017, 165, 211–215. [Google Scholar] [CrossRef]
- Enache, T.A.; Oliveira-Brett, A. Boron doped diamond and glassy carbon electrodes comparative study of the oxidation behaviour of cysteine and methionine. Bioelectrochemistry 2011, 81, 46–52. [Google Scholar] [CrossRef]
- Diculescu, V.C.; Enache, T.A. Voltammetric and mass spectrometry investigation of methionine oxidation. J. Electroanal. Chem. 2019, 834, 124–129. [Google Scholar] [CrossRef]
- Rebelo, M.J.; Rego, R.; Ferreira, M.; Oliveira, M.C. Comparative study of the antioxidant capacity and polyphenol content of Douro wines by chemical and electrochemical methods. Food Chem. 2013, 141, 566–573. [Google Scholar] [CrossRef] [PubMed]
- Yakovleva, K.E.; Kurzeev, S.A.; Stepanova, E.V.; Fedorova, T.V.; Kuznetsov, B.A.; Koroleva, O.V. Characterization of plant phenolic compounds by byclic voltammetry. Biotechnol. Appl. Biochem. 2007, 43, 661–668. [Google Scholar]
- Liu, X.; Ding, Z.; He, Y.; Xue, Z.; Zhao, X.; Lu, X. Electrochemical behavior of hydroquinone at multi-walled carbon nanotubes and ionic liquid composite vilm modified electrode. Colloids Surf. B 2010, 79, 27–32. [Google Scholar] [CrossRef]
- Kilmartin, P.A.; Zou, H.; Waterhouse, A.L. Correlation of wine phenolic composition versus cyclic voltammetry response. Am. J. Enol. Vitic. 2002, 53, 294–302. [Google Scholar] [CrossRef]
- Gargouri, O.D.; Gargouri, B.; Trabelsi, S.K.; Bouaziz, M.; Abdelhédi, R. Synthesis of 3-O-methylgallic acid a powerful antioxidant by electromemical conversión of syringic acid. Biochim. Biophys. Acta 2013, 1830, 3643–3649. [Google Scholar] [CrossRef]
- Elaoud, S.C.; Abdelhedi, R.; Savall, A. Oxydation électrochimique de l’acide vanillique sur des oxides d’or et de plomb. J. Soc. Chim. Tunis. 2001, 4, 1029–1042. [Google Scholar]
- Kallel Trabelsi, S.; Belhadj Tahar, N.; Trabelsi, B.; Abdelhedi, R. Electrochemical oxidation of ferulic acid in aqueous solutions at gold oxide and lead dioxide electrodes. J. Appl. Electrochem. 2005, 35, 967–973. [Google Scholar] [CrossRef]
- Petrovic, S. Correlation of perceived wine astringency to cyclic voltammetric response. Am. J. Enol. Vitic. 2009, 60, 373–378. [Google Scholar] [CrossRef]
- Cosio, M.S.; Buratti, S.; Mannino, S.; Benedetti, S. Use of an electrochemical to evaluate the antioxidant activity of herb extracts from the Labiatae family. Food Chem. 2006, 97, 725–731. [Google Scholar] [CrossRef]
- Samra, M.A.; Chedea, V.S.; Economou, A.; Calokerinos, A.; Kefala, P. Antioxidant/pro-oxidant properties of model phenolic compounds: Part I. Studies on equimolar mixtures by chemiluminescence and cyclic voltammetry. Food Chem. 2011, 125, 622–629. [Google Scholar] [CrossRef]
- Enache, T.A.; Oliveira-Brett, A. Peptide methionine sulfoxide reductase A (MsrA): Direct electrochemical oxidation on carbon electrodes. Bioelectrochemistry 2013, 89, 11–18. [Google Scholar] [CrossRef] [PubMed]
- Enache, T.A.; Oliveira-Brett, A. Pathways of Electrochemical Oxidation of Indolic Compounds. Electroanalysis 2011, 23, 1337–1344. [Google Scholar] [CrossRef]
- Enache, T.A.; Oliveira-Brett, A. Phenol and para-substituted phenols electrochemical oxidation pathways. J. Electroanal. Chem. 2011, 655, 9–16. [Google Scholar] [CrossRef]
- Enache, T.A.; Oliveira-Brett, A. Alzheimer’s disease amyloid beta peptides in vitro electrochemical oxidation. Bioelectrochemistry 2017, 114, 13–23. [Google Scholar] [CrossRef]


| Compounds | pH | C (g/L) | V (mV/s) | Epa1 (V) | Epc1 (V) | Ipa1 (μA) | Ipc1 (μA) | E°1 (V) | ΔE1 (V) | Epa2 (V) | Ipa2 (μA) |
|---|---|---|---|---|---|---|---|---|---|---|---|
| Gallic acid | 3 | 1 | 100 | 0.414 * | 0.350 | 3.965 | −0.282 | 0.382 * | 0.065 * | 0.786 * | 3.952 |
| 50 | 0.414 * | 0.350 | 2.160 | 0.603 | 0.382 * | 0.065 * | 0.786 * | 2.209 | |||
| 0.5 | 100 | 0.414 * | 0.366 | 1.66 | −0.254 | 0.390 * | 0.048 * | 0.803 * | 1.900 | ||
| 50 | 0.406 * | 0.358 | 1.032 | −0.162 | 0.382 * | 0.048 * | 0.786 * | 1.097 | |||
| 7 | 1 | 100 | 0.358 * | - | 1.349 | - | - | - | 0.633 * | 2.044 | |
| 50 | 0.350 * | - | 1.024 | - | - | - | 0.641 * | 1.402 | |||
| 0.5 | 100 | 0.301 * | - | 0.515 | - | - | - | 0.625 * | 0.916 | ||
| 50 | 0.350 * | - | 0.428 | - | - | - | 0.641 * | 0.620 | |||
| Caffeic acid | 3 | 1 | 100 | 0.439 * | 0.309 * | 1.802 | −1.056 ** | 0.374 * | 0.129 | - | - |
| 50 | 0.423 * | 0.334 * | 1.122 | −0.754 ** | 0.378 * | 0.089 | - | - | |||
| 0.5 | 100 | 0.447 * | 0.334 * | 1.717 | −1.415 ** | 0.390 * | 0.113 | - | - | ||
| 50 | 0.431 * | 0.350 * | 1.079 | −0.850 ** | 0.390 * | 0.081 | - | - | |||
| 7 | 1 | 100 | 0.301 * | 0.099 * | 1.471 | −1.446 ** | 0.200 * | 0.202 | - | - | |
| 50 | 0.309 * | 0.083 * | 0.820 | −0.766 ** | 0.196 * | 0.226 | - | - | |||
| 0.5 | 100 | 0.261 * | 0.131 * | 0.831 | −0.780 ** | 0.196 * | 0.129 | - | - | ||
| 50 | 0.253 * | 0.139 * | 0.544 | −0.526 ** | 0.196 * | 0.113 | - | - | |||
| Catechin | 3 | 1 | 100 | 0.495 * | 0.261 * | 1.693 | −1.209 | 0.378 * | 0.235 *** | 0.835 | 2.355 |
| 50 | 0.479 * | 0.285 * | 0.867 | −0.625 | 0.382 * | 0.194 *** | 0.843 | 1.218 | |||
| 0.5 | 100 | 0.447 * | 0.325 * | 1.481 | −1.374 | 0.386 * | 0.121 *** | 0.811 | 1.111 | ||
| 50 | 0.487 * | 0.301 * | 0.612 | −0.533 | 0.394 * | 0.186 *** | 0.827 | 0.692 | |||
| 7 | 1 | 100 | 0.334 * | 0.107 * | 0.723 | −0.540 | 0.220 * | 0.226 *** | 0.681 | 1.371 | |
| 50 | 0.342 * | 0.107 * | 0.311 | −0.286 | 0.224 * | 0.235 *** | 0.706 | 0.692 | |||
| 0.5 | 100 | 0.293 * | 0.131 * | 0.705 | −0.703 | 0.212 * | 0.162 *** | 0.641 | 0.800 | ||
| 50 | 0.293 * | 0.123 * | 0.403 | −0.379 | 0.208 * | 0.170 *** | 0.673 | 0.494 | |||
| Quercetin−3-O-rutinoside | 3 | 1 | 100 | 0.479 * | 0.431 * | 0.965 | −0.517 | 0.455 * | 0.049 | 0.754 | 0.860 |
| 50 | 0.479 * | 0.431 * | 0.648 | −0.344 | 0.455 * | 0.049 | 0.730 | 0.542 | |||
| 0.5 | 100 | 0.487 * | 0.309 * | 0.969 | −0.583 | 0.398 * | 0.178 | - | - | ||
| 50 | 0.479 * | 0.325 * | 0.507 | −0.336 | 0.402 * | 0.154 | - | - | |||
| 7 | 1 | 100 | 0.277 * | 0.212 * | 0.682 | −0.419 | 0.245 * | 0.065 | 0.867 | 1.555 | |
| 50 | 0.277 * | 0.220 * | 0.415 | −0.251 | 0.249 * | 0.057 | 0.867 | 1.103 | |||
| 0.5 | 100 | 0.301 * | - | 0.465 | - | - | - | 0.916 | 1.000 | ||
| 50 | 0.301 * | - | 0.226 | - | - | - | 0.916 | 0.545 |
| Compounds | Epa1 (V) | Epc1 (V) | Ipa1 (μA) | Ipc1 (μA) | E°1 (V) | ΔE1 (V) | Epa2 (V) | Ipa2 (μA) | Epa3 (V) | Ipa3 (μA) |
|---|---|---|---|---|---|---|---|---|---|---|
| Individual Model solutions | ||||||||||
| Gallic acid | 0.414 | 0.350 | 3.965 | −0.282 | 0.382 | 0.065 | 0.786 | 3.952 | - | - |
| Syringic acid | 0.447 | 0.333 | 0.243 | −0.436 | 0.390 | 0.114 | 0.673 | 2.931 | - | - |
| Vanillic acid | 0.487 | 0.228 | 0.594 | −0.867 | 0.358 | 0.259 | 0.835 | 3.359 | - | - |
| Caffeic acid | 0.439 | 0.309 | 1.802 | −1.056 | 0.374 | 0.129 | - | - | - | - |
| Ferulic acid | 0.471 | 0.269 | 0.629 | −0.997 | 0.370 | 0.202 | 0.754 | 2.418 | - | - |
| Catechin | 0.495 | 0.261 | 1.693 | −1.209 | 0.378 | 0.235 | 0.835 | 2.355 | ||
| Epicatechin | 0.495 | 0.148 | 1.146 | −0.694 | 0.321 | 0.348 | 0.851 | 1.931 | - | - |
| Quercetin 3-rutinoside | 0.479 | 0.431 | 0.965 | −0.517 | 0.455 | 0.049 | 0.754 | 0.860 | - | - |
| Quercetin | 0.439 | 0.228 | 1.733 | −0.856 | 0.334 | 0.210 | 0.851 | 1.684 | - | - |
| Binary model solutions 1 | ||||||||||
| CAF-RUT | 0.479 | 0.269 | 1.344 | −0.757 | 0.374 | 0.210 | - | - | - | - |
| CAT-CAF | 0.511 | 0.212 | 1.269 | −0.823 | 0.362 | 0.299 | 0.859 | 1.474 | - | - |
| CAT-RUT | 0.592 | 0.245 | 0.799 | −0.514 | 0.418 | 0.348 | 0.883 | 1.371 | - | - |
| CAT-EPICAT | 0.552 | 0.115 | 1.212 | −0.673 | 0.334 | 0.437 | 0.867 | 2.074 | - | - |
| FER-CAF | 0.511 | 0.212 | 1.592 | −1.135 | 0.362 | 0.299 | 0.722 | 2.046 | - | - |
| GAL-SYR | 0.552 | 0.164 | 1.297 | −0.427 | 0.358 | 0.388 | 0.706 | 2.030 | - | - |
| GAL-VAN | 0.552 | - | 1.318 | - | - | - | 0.851 | 2.550 | - | - |
| CAF-EPICAT | 0.455 | 0.285 | 1.694 | −1.033 | 0.370 | 0.170 | 0.819 | 1.810 | - | - |
| CAF-SYR | 0.455 | 0.309 | 1.468 | −0.975 | 0.382 | 0.146 | 0.665 | 2.376 | - | - |
| CAF-VAN | 0.495 | 0.220 | 1.277 | −0.896 | 0.358 | 0.275 | 0.835 | 2.351 | - | - |
| FER-CAT | 0.536 | 0.204 | 1.087 | −0.968 | 0.370 | 0.332 | 0.835 | 2.249 | - | - |
| FER-EPICAT | 0.503 | 0.172 | 0.896 | −0.778 | 0.338 | 0.332 | 0.835 | 2.127 | - | - |
| FER-GAL | 0.439 | 0.334 | 1.823 | −0.505 | 0.386 | 0.105 | 0.633 | 2.716 | 0.738 | 3.026 |
| FER-QUER | 0.439 | 0.196 | 1.458 | −1.078 | 0.317 | 0.243 | 0.851 | 2.148 | - | - |
| FER-RUT | 0.479 | 0.301 | 0.788 | −0.726 | 0.390 | 0.178 | 0.730 | 1.723 | - | - |
| GAL-EPICAT | 0.439 | 0.342 | 2.428 | −0.724 | 0.390 | 0.097 | 0.762 | 3.014 | - | - |
| GAL-QUER | 0.536 | 0.293 | 2.313 | −0.821 | 0.414 | 0.243 | 0.843 | 2.856 | - | - |
| CAT-QUER | 0.463 | 0.293 | 2.208 | −1.282 | 0.378 | 0.170 | 0.859 | 3.288 | - | - |
| EPICAT-QUER | 0.455 | 0.261 | 2.061 | −1.139 | 0.358 | 0.194 | 0.851 | 3.021 | - | - |
| EPICAT-RUT | 0.471 | 0.293 | 1.826 | −1.080 | 0.382 | 0.178 | 0.811 | 2.104 | - | - |
| SYR-CAT | 0.479 | 0.277 | 1.208 | −1.040 | 0.378 | 0.202 | 0.657 | 2.272 | 0.843 | 2.212 |
| SYR-EPICAT | 0.487 | 0.228 | 1.104 | −0.881 | 0.358 | 0.259 | 0.673 | 2.131 | 0.827 | 2.120 |
| SYR-QUER | 0.423 | 0.237 | 1.481 | −0.829 | 0.330 | 0.186 | 0.859 | 2.049 | - | - |
| SYR-RUT | 0.479 | 0.228 | 0.842 | −0.570 | 0.354 | 0.251 | 0.681 | 1.550 | - | - |
| SYR-VAN | 0.406 | 0.358 | 0.411 | −0.987 | 0.382 | 0.049 | 0.633 | 2.620 | 0.770 | 3.638 |
| VAN-CAT | 0.487 | 0.253 | 1.098 | −1.296 | 0.370 | 0.235 | 0.795 | 4.771 | - | - |
| VAN-EPICAT | 0.471 | 0.261 | 1.175 | −1.193 | 0.366 | 0.210 | 0.803 | 3.275 | - | - |
| VAN-QUER | 0.423 | 0.196 | 1.659 | −0.992 | 0.309 | 0.226 | 0.843 | 3.092 | - | - |
| FER-VAN | 0.479 | 0.261 | 0.529 | −0.960 | 0.370 | 0.218 | 0.641 | 1.435 | 0.811 | 2.896 |
| CAF-QUER | 0.414 | 0.212 | 1.559 | −1.239 | 0.313 | 0.202 | 0.544 | 2.108 | 0.875 | 2.029 |
| RUT-QUER | 0.463 | 0.293 | 1.565 | −0.740 | 0.378 | 0.170 | 0.851 | 1.689 | - | - |
| CAF-GAL | 0.463 | 0.325 | 2.465 | −0.610 | 0.394 | 0.137 | 0.795 | 1.830 | - | - |
| FER-SYR | 0.495 | 0.293 | 0.604 | −0.759 | 0.394 | 0.202 | 0.673 | 2.480 | 0.754 | 2.415 |
| GAL-CAT | 0.487 | 0.293 | 1.947 | −0.535 | 0.390 | 0.194 | 0.843 | 2.201 | - | - |
| GAL-RUT | 0.487 | 0.366 | 1.820 | −0.206 | 0.427 | 0.121 | 0.778 | 1.607 | - | - |
| VAN-RUT | 0.479 | 0.423 | 0.947 | −0.675 | 0.451 | 0.057 | 0.786 | 2.825 | - | - |
| Compounds | pH | C (mM) | V (mV/s) | Epa1 (V) | Ipa1 (μA) | Epa2 (V) | Ipa2 (μA) |
|---|---|---|---|---|---|---|---|
| Cysteine | 3 | 2.5 | 100 | - | - | - | - |
| 50 | - | - | - | - | |||
| 5.0 | 100 | 0.487 | 0.216 | - | - | ||
| 50 | - | - | - | - | |||
| 7 | 2.5 | 100 | 0.891 | 0.990 | 1.847 | 22.034 | |
| 50 | 0.843 | 0.495 | 1.842 | 18.139 | |||
| 5.0 | 100 | 0.802 | 1.072 | 1.918 | 167.449 | ||
| 50 | 0.831 | 0.520 | 1.886 | 149.261 |
| Compounds | Epa1 (V) | Ipa1 (μA) | Epa2 (V) | Ipa2 (μA) | Epa3 (V) | Ipa3 (μA) |
|---|---|---|---|---|---|---|
| Individual Model solutions | ||||||
| Cysteine | 0.754 | 0.767 | - | - | 1.918 | 167.449 |
| Histidine | - | - | 1.482 | 22.617 | - | - |
| Tryptophan | 0.900 | 2.254 | - | - | - | - |
| Tyrosine | 0.778 | 1.481 | - | - | 1.983 | 201.152 |
| Binary model solutions 1 | ||||||
| CYS-HIS | 0.649 | 2.396 | 1.231 | 20.947 | 1.911 | 169.067 |
| CYS-TRP | 0.706 | 3.054 | - | - | 1.854 | 137.868 |
| HIS-TRP | 0.722 | 2.435 | 1.336 | 19.942 | - | - |
| TYR-CYS | 0.754 | 1.805 | - | - | 1.967 | 194.895 |
| TYR-HIS | 0.770 | 0.939 | 1.369 | 14.276 | - | - |
| TYR-TRP | 0.609 | 0.316 | 1.094 | 1.230 | - | - |
| Epa1 (V) 1 | Ipa1 (μA) | Epa2 (V) 1 | Ipa2 (μA) | Epa3 (V) 1 | Ipa3 (μA) | Epa4 (V) 1 | Ipa4 (μA) | |
|---|---|---|---|---|---|---|---|---|
| Individual Model solutions | ||||||||
| Gallic acid | 0.358 | 1.349 | 0.633 | 2.044 | - | - | - | - |
| Caffeic acid | 0.301 | 1.471 | - | - | - | - | - | - |
| Catechin | 0.334 | 0.723 | 0.681 | 1.371 | - | - | - | - |
| Quercetin 3-O-rutinoside | 0.277 | 0.682 | 0.867 | 1.555 | - | - | - | - |
| Cysteine | - | - | 0.802 | 1.072 | - | - | 1.918 | 167.449 |
| Histidine | - | - | - | - | 1.482 | 22.617 | - | - |
| Tryptophan | - | - | 0.900 | 2.254 | - | - | - | - |
| Tyrosine | - | - | 0.778 | 1.481 | - | - | 1.983 | 201.152 |
| Mixed Solutions 2 | ||||||||
| CYS-CAF | 0.261 | 1.402 | 0.697 | 3.312 | - | - | 1.911 | 170.227 |
| CYS-CAT | 0.228 | 1.117 | 0.665 | 1.968 | - | - | 1.911 | 157.796 |
| CYS-GAL | 0.301 | 1.288 | 0.722 | 2.129 | - | - | 1.902 | 90.454 |
| CYS-RUT | 0.309 | 0.676 | 0.924 | 3.101 | - | - | 1.967 | 166.534 |
| HIS-CAF | 0.253 | 0.896 | 1.288 | 16.786 | - | - | ||
| HIS-CAT | 0.212 | 0.868 | 0.592 | 1.450 | 1.377 | 23.887 | - | - |
| HIS-GAL | 0.358 | 1.039 | 0.665 | 1.571 | 1.344 | 20.235 | - | - |
| HIS-RUT | 0.285 | 0.905 | 0.916 | 3.132 | 1.417 | 24.368 | - | - |
| TRP-CAF | 0.220 | 1.271 | 0.697 | 3.312 | - | - | - | - |
| TRP-CAT | 0.228 | 0.631 | 0.722 | 2.639 | - | - | - | - |
| TRP-GAL | 0.269 | 0.811 | 0.714 | 3.039 | - | - | - | - |
| TRP-RUT | 0.317 | 0.403 | 0.714 | 2.451 | - | - | - | - |
| TYR-CAF | 0.342 | 0.756 | 0.786 | 1.100 | - | - | - | - |
| TYR-CAT | 0.253 | 0.536 | 0.673 | 0.998 | - | - | - | - |
| TYR-GAL | 0.358 | 1.202 | 0.746 | 2.090 | - | - | - | - |
| TYR-RUT | 0.301 | 0.447 | 0.770 | 1.293 | 0.932 | 2.179 | - | - |
| Solution 1 | Eon (V) | Ipa (μA) |
|---|---|---|
| Gallic acid | 0.325 | 3.962 |
| CIS-GAL | 0.115 | 1.277 |
| HIS-GAL | 0.123 | 1.025 |
| TRP-GAL | 0.123 | 0.920 |
| TYR-GAL | 0.123 | 1.194 |
| Caffeic acid | 0.155 | 1.378 |
| CIS-CAF | 0.147 | 1.402 |
| HIS-CAF | 0.161 | 0.896 |
| TRP-CAF | 0.139 | 1.270 |
| TYR-CAF | 0.171 | 0.752 |
| Catechine | 0.179 | 0.723 |
| CIS-CAT | 0.147 | 1.117 |
| HIS-CAT | 0.147 | 0.867 |
| TRP-CAT | 0.163 | 0.631 |
| TYR-CAT | 0.173 | 0.535 |
| Quercetin 3-O-rutinoside | 0.179 | 0.682 |
| CIS-RUT | 0.220 | 0.675 |
| HIS-RUT | 0.147 | 0.905 |
| TRP-RUT | 0.115 | 0.402 |
| TYR-RUT | 0.115 | 0.447 |
Disclaimer/Publisher’s Note: The statements, opinions and data contained in all publications are solely those of the individual author(s) and contributor(s) and not of MDPI and/or the editor(s). MDPI and/or the editor(s) disclaim responsibility for any injury to people or property resulting from any ideas, methods, instructions or products referred to in the content. |
© 2024 by the authors. Licensee MDPI, Basel, Switzerland. This article is an open access article distributed under the terms and conditions of the Creative Commons Attribution (CC BY) license (https://creativecommons.org/licenses/by/4.0/).
Share and Cite
Jara-Palacios, M.J.; Begines, E.; Heredia, F.J.; Escudero-Gilete, M.L.; Hernanz, D. Effectiveness of Cyclic Voltammetry in Evaluation of the Synergistic Effect of Phenolic and Amino Acids Compounds on Antioxidant Activity: Optimization of Electrochemical Parameters. Foods 2024, 13, 906. https://doi.org/10.3390/foods13060906
Jara-Palacios MJ, Begines E, Heredia FJ, Escudero-Gilete ML, Hernanz D. Effectiveness of Cyclic Voltammetry in Evaluation of the Synergistic Effect of Phenolic and Amino Acids Compounds on Antioxidant Activity: Optimization of Electrochemical Parameters. Foods. 2024; 13(6):906. https://doi.org/10.3390/foods13060906
Chicago/Turabian StyleJara-Palacios, María José, Emilio Begines, Francisco J. Heredia, María Luisa Escudero-Gilete, and Dolores Hernanz. 2024. "Effectiveness of Cyclic Voltammetry in Evaluation of the Synergistic Effect of Phenolic and Amino Acids Compounds on Antioxidant Activity: Optimization of Electrochemical Parameters" Foods 13, no. 6: 906. https://doi.org/10.3390/foods13060906
APA StyleJara-Palacios, M. J., Begines, E., Heredia, F. J., Escudero-Gilete, M. L., & Hernanz, D. (2024). Effectiveness of Cyclic Voltammetry in Evaluation of the Synergistic Effect of Phenolic and Amino Acids Compounds on Antioxidant Activity: Optimization of Electrochemical Parameters. Foods, 13(6), 906. https://doi.org/10.3390/foods13060906