Article

Metabolic Profiling and Stable Isotope Analysis of Wines: Pilot Study for Cross-Border Authentication

by
Marius Gheorghe Miricioiu
1,
Roxana Elena Ionete
1,
Diana Costinel
1,
Svetlana Simova
2,
Dessislava Gerginova
2 and
Oana Romina Botoran
1,*
1
ICSI Analytics Group, National Research and Development Institute of Cryogenic and Isotopic Technologies—ICSI Rm. Vâlcea, 4 Uzinei Street, 240050 Râmnicu Vâlcea, Romania
2
Bulgarian NMR Centre, Institute of Organic Chemistry with Centre of Phytochemistry, Bulgarian Academy of Sciences, “Acad G. Bonchev” Street, Bl. 9, 1113 Sofia, Bulgaria
*
Author to whom correspondence should be addressed.
Foods 2024, 13(21), 3372; https://doi.org/10.3390/foods13213372
Submission received: 27 September 2024 / Revised: 21 October 2024 / Accepted: 22 October 2024 / Published: 23 October 2024
(This article belongs to the Special Issue Advanced Research and Development of Carbohydrate from Foods)

Abstract

:
Globalization and free market dynamics have significantly impacted state economies, particularly in the wine industry. These forces have introduced greater diversity in wine products but have also heightened the risk of food fraud, especially in high-value commodities like wine. Due to its market value and the premium placed on quality, wine is frequently subject to adulteration. This issue is often addressed through regulatory trademarks on wine labels, such as Protected Designation of Origin (PDO) and Protected Geographic Indication (PGI). In this context, the metabolic profiles (organic acids, carbohydrates, and phenols) and stable isotope signatures (δ13C, δ18O, D/HI, and D/HII) of red and white wines from four agroclimatically similar regions were examined. The study explored how factors such as grape variety, harvest year, and geographical origin affect wine composition, with a particular focus on distinguishing samples from cross-border areas. Multivariate statistical analysis was used to assess the variability in wine composition and to identify distinct groups of samples. Preliminary results revealed that organic acids and volatile compounds were found in lower concentrations than carbohydrates but were significantly higher than phenols, with levels ranging between 1617 mg/L and 6258 mg/L. Carbohydrate content in the wines varied from 8285 mg/L to 14662 mg/L. Principal Component Analysis (PCA) indicated certain separation trends based on the variance in carbohydrates (e.g., fructose, glucose, galactose) and isotopic composition. However, Discriminant Analysis (DA) provided clear distinctions based on harvest year, variety, and geographical origin.

1. Introduction

The global economic impact of wine production and commerce is significant, far surpassing other commodities and drawing considerable attention from authorities worldwide. According to statistics compiled by the International Organization of Vine and Wine (OIV), global wine production in 2022 reached 262.1 million hectoliters, with a corresponding production of 77.3 million tons of fresh grapes. This represents a decrease from the 276.9 million hectoliters of wine produced in 2000, despite an increase in grape production from 64.1 million tons in the same year. This trend suggests a growing market demand for higher-quality wine, as the industry shifts focus toward producing more refined and valued products (https://www.oiv.int/what-we-do/global-report?oiv, accessed on 15 June 2024).
Wine production involves substantial costs and demands extensive expertise, as it is regarded as a luxury commodity in many markets, particularly in the globalized economy. Wine quality is heavily influenced by factors such as terroir, geographic origin, grape variety, and production methods. These elements are frequently emphasized on wine labels through trademarks like Protected Designation of Origin (PDO) and Protected Geographic Indication (PGI), which serve to indicate the product’s premium status and quality [1,2,3,4]. A consumer’s first interaction with a wine bottle is visual, primarily through its label. However, unlike other products, the quality of wine can only be fully assessed once it is tasted, making the label crucial in shaping consumer expectations. Unfortunately, wine counterfeiting is a widespread issue. Common fraudulent practices include misrepresenting geographical origins, selling wines without geographical protection as if they were from renowned regions. Other forms of fraud involve mislabeling grape varieties, where wines made from blends (especially reds like Cabernet Sauvignon or Merlot) are falsely marketed as single-variety wines. Additionally, there is misrepresentation of the vintage year and dilution of wine with water or lower-quality products [5,6,7,8,9]. These fraudulent practices not only deceive consumers but also alter the chemical composition and sensory characteristic of the wine, leading to significant economic gain for the perpetrators at the expense of consumer trust. This phenomenon has become increasingly common and poses a serious issue for both consumers and the legitimate wine industry [10].
Consequently, wine adulteration and undisclosed origins have become increasing concerns, impacting both consumer health and the market through unfair competition, leading to economic losses for traditional wine-producing countries. To address these challenges, various analytical methods have been employed, including isotope-ratio mass spectrometry (IRMS), nuclear magnetic resonance (NMR) for metabolomic profiling, SNIF-NMR for determining deuterium distribution in ethanol, inductively coupled plasma mass spectrometry (ICP-MS) for elemental analysis, ultra-high-performance liquid chromatography (UHPLC) for polyphenol composition, and gas chromatography coupled with mass spectrometry (GC-MS) to identify aroma components. These methods contribute, to varying degrees, to detecting unconventional winemaking practices or determining the wine’s origin [2,11,12,13,14]. Among these methods, the International Wine Office and the European Commission have officially endorsed SNIF-NMR and IRMS to monitor chaptalization, the practice of adding sugar to fermenting grape must to boost the final alcohol content (https://www.eurofins.com/food-and-feed-testing/food-testing-services/authenticity/snif-nmr-concept/, accessed on 15 June 2024). SNIF-NMR is effective because the distribution of deuterium in sugars differs between plants using different photosynthetic pathways (C3, C4, CAM), and the hydrogen isotope ratio (D/H)I of the methyl group in ethanol is indicative of the sugar’s botanical origin. Also, the deuterium abundance in water from the environment where the plant was grown varies by region, influencing the hydrogen (D/H)II of the methylene group of ethanol, which can provide potential information about its region’s climatic conditions [9,11]. Additionally, stable isotope analysis, particularly focusing on carbon-13 (δ13C) and oxygen-18 (δ18O), plays a crucial role in the authentication and geographic origin verification of wines [15,16,17,18,19,20]. The isotopic composition of biogenic materials, including wine, is significantly influenced by environmental conditions, which vary regionally and are reflected in the isotope ratios of the wine’s components. As with the D/H ratio, the δ13C and δ18O isotopic ratios in wine are influenced by several climatic and environmental factors. For instance, δ13C is positively correlated with temperature and negatively with precipitation during grape ripening. Similarly, δ18O values in wine water are affected by regional climatic parameters such as temperature, precipitation, humidity, and evapotranspiration. These factors contribute to region-specific δ18O values, making it possible to discriminate between wines from different geographic areas. Furthermore, the δ18O ratio is sensitive to altitude and can effectively differentiate wines from various subregions [21]. Also, the homonuclear and heteronuclear 2D NMR spectroscopy have a great implication in wine compound identification for further product authentication and quality control [22]. Furthermore, NMR-based metabolomics was used for wine differentiation according to their terroir, vintage, and variety [23,24,25,26]. There were found strong correlations between metabolites and climatic conditions, clay, and soil organic matter content [27].
Differentiating wines from vineyards located in cross-border regions is challenging due to the often similar environmental conditions in these areas [28,29]. Therefore, it is essential to develop reliable methods for verifying the declared geographic origin of wines. This may involve the use of emerging complementary techniques and chemometric analysis, which can also contribute to establishing databases for more precise identification and verification of geographic origin.
This study aims to assess the effectiveness of two analytical techniques—1H-NMR and IRMS (stable isotopes)—combined with multivariate statistical analysis, in overcoming the challenges posed by similar climatic conditions. The objective is to differentiate wines from four geographically close agroclimatic regions in the Drăgășani area of Romania, a region with a rich winemaking tradition, based on geographic origin, grape variety, and harvest year. This differentiation is essential for protecting certified, high-value wines from being substituted with cheaper, adulterated, or mislabeled products. Ensuring wine authenticity is crucial for meeting the expectations of both the industry and consumers, and can also contribute to establishing a wine as a symbol of national pride.

2. Materials and Methods

2.1. Sample Collection

Samples of eight different red and white wine varieties, including both international and local types—such as Merlot, Fetească Neagră, Sauvignon Blanc, Cabernet Sauvignon, Crâmpoșie, Negru de Drăgășani, Chardonnay, and Fetească Regală—were collected to differentiate them based on geographic origin, grape variety, and vintage. These wines were sourced directly from reputable producers, in their original bottles with labels indicating Protected Designation of Origin (PDO). The samples came from four distinct agroclimatic regions: Sâmburești, Drăgășani, Dobrușa, and Spârleni (Figure S1—Supplementary Materials), and were produced in various years (2019, 2020, 2021, and 2022). After collection, the samples were coded and stored in a refrigerator until chemical analysis. Detailed information about the selected study sites, grape varieties, and vintages is provided in Table 1.

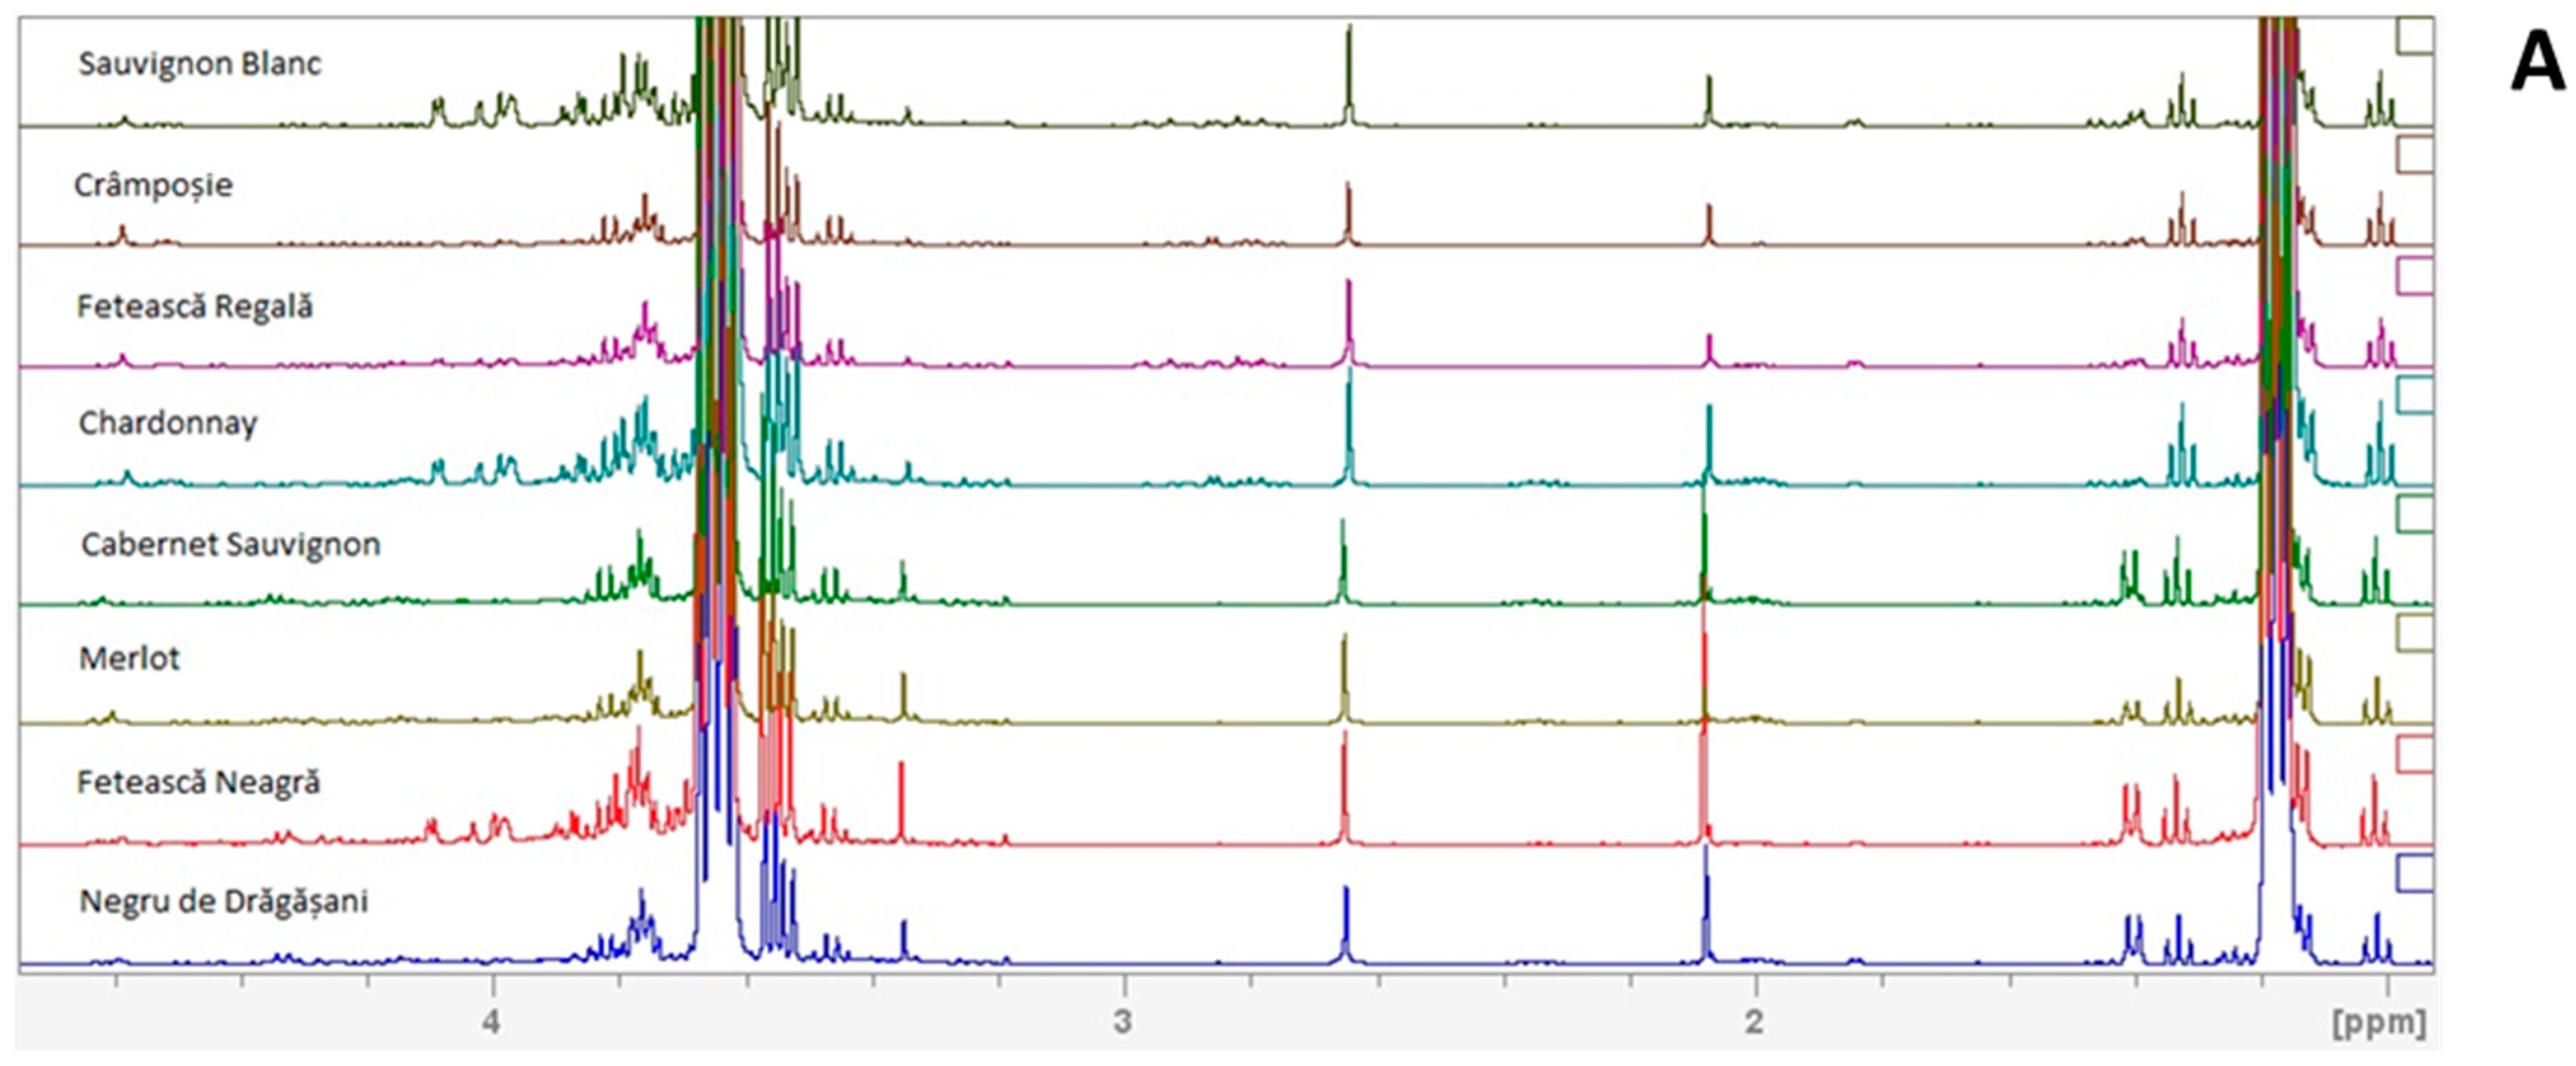
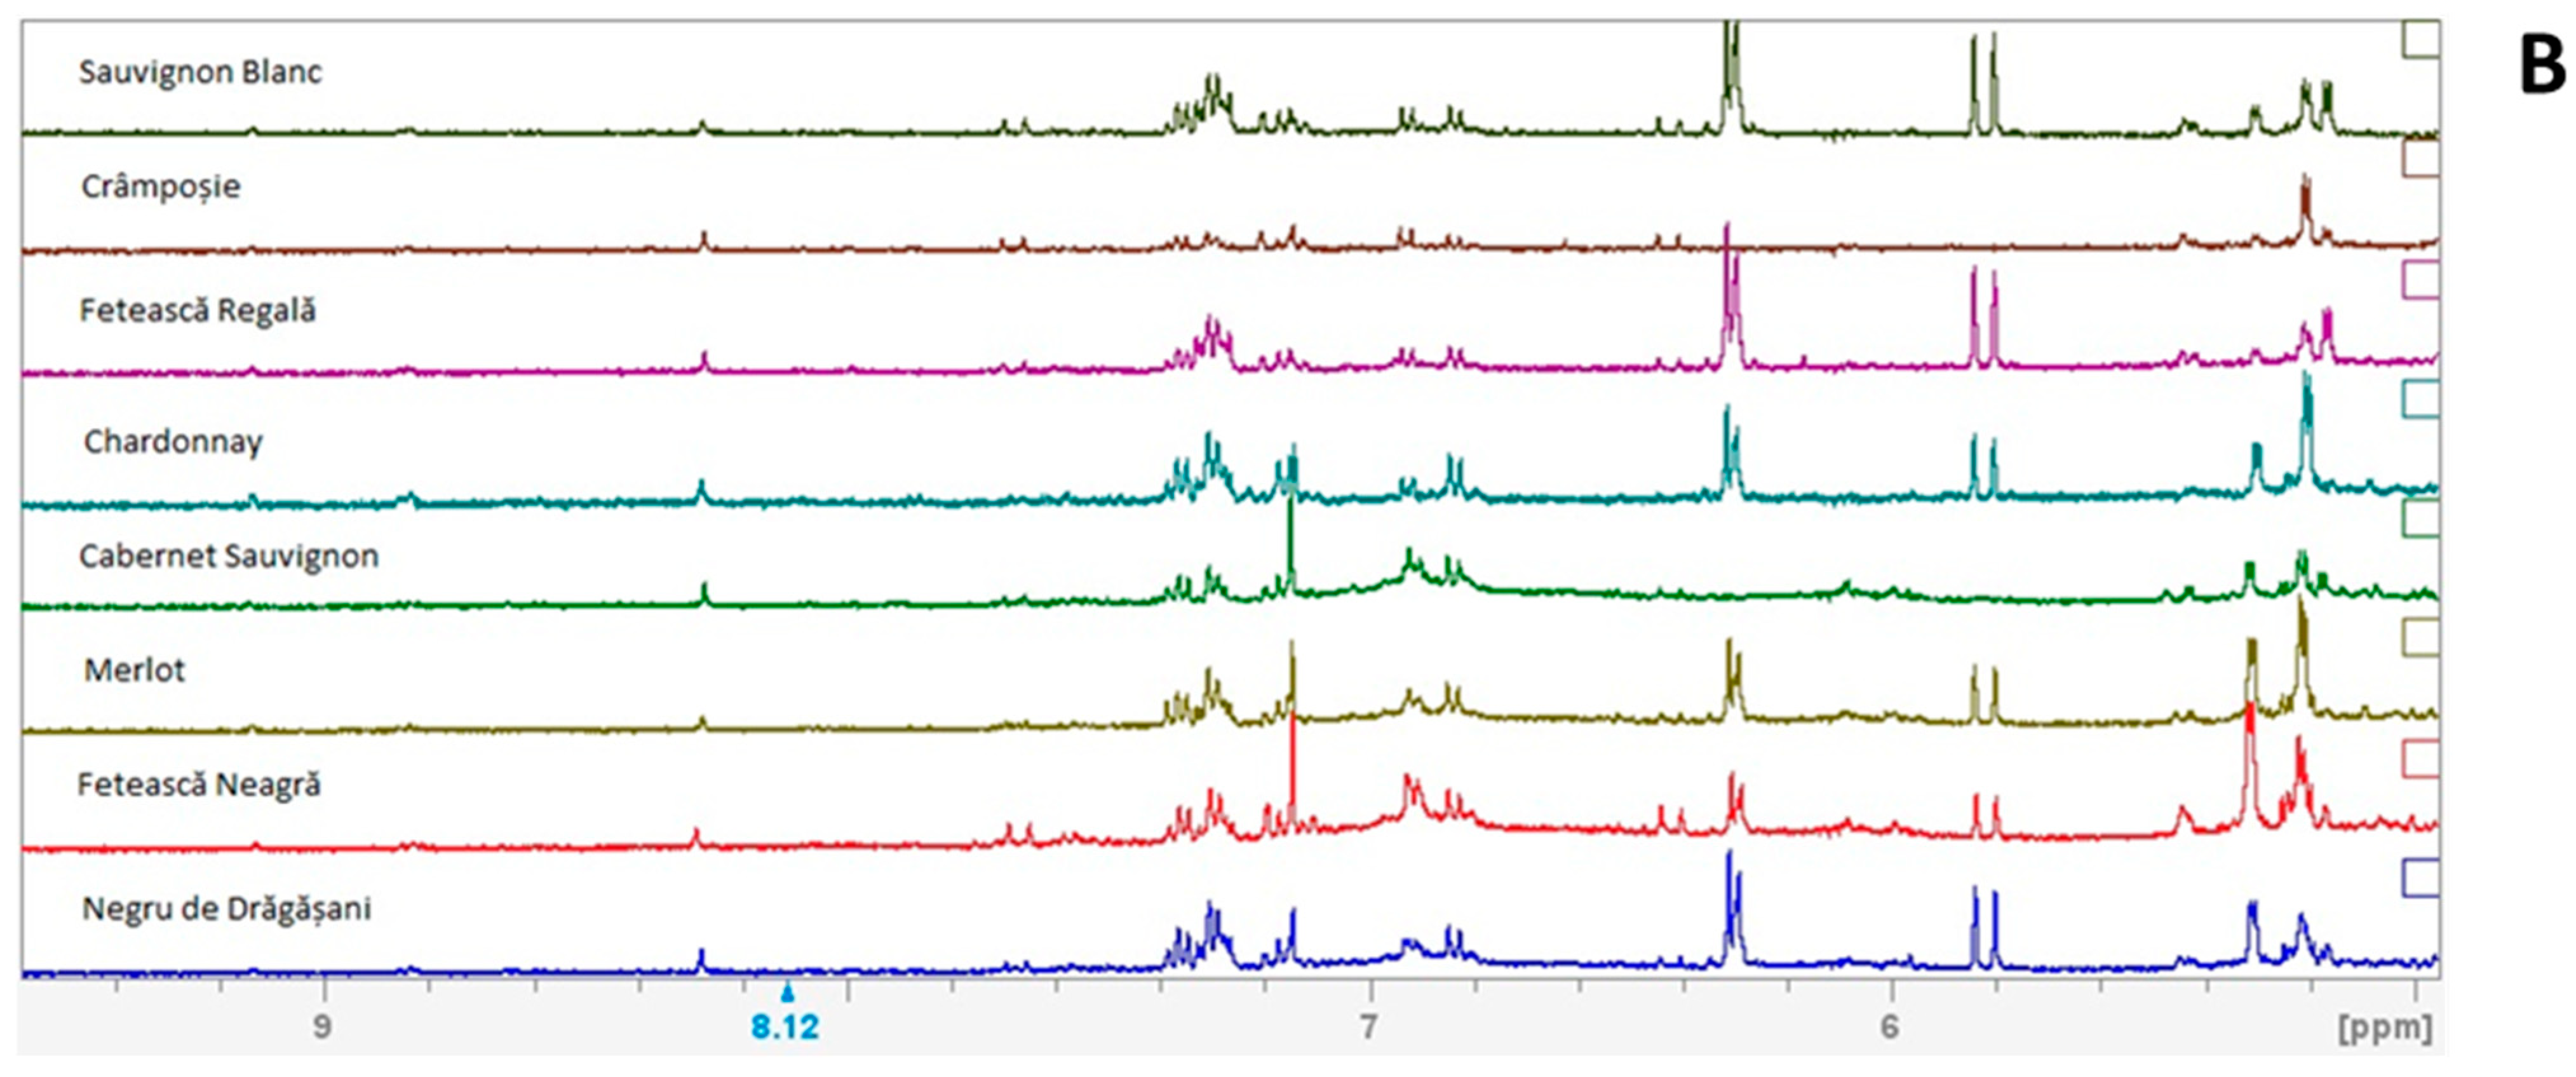
2.2. 1H NMR Metabolomic Profile

The protocol applied for the metabolite extraction for NMR investigation was based on different literature studies [30,31,32,33]. Earlier, a buffer solution was obtained by adding 2.75 g potassium phosphate (KH2PO4), 3.9 g sodium azide (NaN3, extra pure), 20 mg 3-(trimethylsilyl) tetradeutero propionic acid sodium salt (98%, TSP) internal standard, and deuterium oxide (D2O), up to 20 g of mixture. The prepared buffer solution was adjusted to a pH of 3.1 by using HCl (1N) and NaOH (1N). The internal standard has two roles: to calibrate the axes of the 1H-NMR spectrum and to quantify the metabolite concentration according to its signal by applying the equation from a literature study which was validated for quantitation of compounds in wine [34].
m x = M x M s t d × n s t d n x × A x A s t d × m s t d
where mx and mstd are the masses of the analyte and the standard (g), Mx and Mstd are the molecular weights of the analyte and the standard (g/mol), nx and nstd are the numbers of protons of the analyte signals and standard, Ax and Astd are the areas for the selected signals of the analyte and standard.
Thus, the wine samples were passed through PTFE membrane filters (0.45 µm, 25 mm diameter, Millipore, Burlington, MA, USA) and then 0.444 mL buffer solution was added to each 4 mL of filtered solution. The pH was adjusted to 3.1 by using the BTpH titration unit (Bruker France SAS, Wissembourg, France), in order to minimize the variation of the signal positions between the spectra [31]. All the samples were transferred in 5 mm NMR tubes, and the measurements were performed manually, without automation mode, at 300 ± 0.1 K with 4 dummy scans. 1H NMR spectra were obtained by using an Ascend 400 MHz Bruker spectrometer (Bruker France SAS, Wissembourg, France) equipped with a 5 mm BBO probe head. The pulse program with water presaturation used was (zgcppr) with 128 scans, 6.83 s acquisition time, 2 s relaxation delay, 64 K data points for fid size, and 4795.396 Hz spectral width. All spectra were manually phased and baseline-corrected and referenced to a TSP signal at 0 ppm. Because the focus is on the minor components of wine, the water signal was suppressed with a power level of 33 W, this value being considered optimum after performing several tests.

2.3. Determination of Relative Distribution of Deuterium

The D/HI and D/HII isotopic ratios in ethanol extracted from wine were determined following the OIV-MA-AS311-05 method, as outlined by the International Organization of Vine and Wine (OIV). This method involves the determination of deuterium distribution in ethanol derived from the fermentation of grape musts, concentrated grape musts, grape sugar (rectified concentrated grape musts), and wines using nuclear magnetic resonance (SNIF-NMR). Ethanol was obtained with an alcoholic strength of at least 92% w/w and a yield of 90% using an automated Cadiot column unit (ADCS Eurofins, Nantes, France). The deuterium–hydrogen (D/H) ratios on the methyl group (CH2DCH2OH, referred to as D/HI) and the methylene group (CH3CHDOH, referred to as D/HII) were measured using an SNIF probe head with a fluorine lock. Each sample underwent 6 replicates based on 200 scans. For quantification, N,N-Tetramethylurea (Institute for Reference Materials and Measurements, Geel, Belgium) was used as the internal standard, and hexafluorobenzene (Sigma-Aldrich, Darmstadt, Germany) was added as a solvent for the lock signal. To ensure quality control, some measurements were conducted using certified reference materials such as ERM-AE200a, ERM-AE200b, and ERM-AE200c provided by the Joint Research Centre, Institute for Reference Materials and Measurements (IRMM), Geel (Belgium).

2.4. Determination of Carbon and Oxygen Stable Isotope Ratios

The 13C/12C isotopic ratio was determined in ethanol obtained in the same manner as the D/HI and D/HII isotopic ratios, following the method specified in OIV-MA-AS312-06: Determination by Isotope Ratio Mass Spectrometry 13C/12C of Wine Ethanol or Ethanol Obtained Through the Fermentation of Musts, Concentrated Musts, or Grape Sugar (Resolution Oeno 17/2001). For this determination, 0.1 µL of ethanol was combusted in a Flash EA1112 HT elemental analyzer (Thermo Fisher Scientific, Bremen, Germany) and quantified using a Delta-V IRMS. The data were processed using Isodat 2.5 software. The 18O/16O isotopic ratio was measured in the water extracted from wine according to the method OIV-MA-AS2-12: Method for 18O/16O Isotope Ratio Determination of Water in Wines and Musts (Resolution OIV-Oeno 353/2009). The δ18O was measured using a continuous-flow isotope ratio mass spectrometer (CF-IRMS) Delta V Plus (Thermo, Bremen, Germany), coupled with a GasBench II isotopic equilibration module. The results were processed using Isodat 3.0 software. For each sample, 500 µL of extracted water was equilibrated for 20 h at 24 °C with a gas mixture containing 0.36% CO2 in helium. To ensure the validity of the results, working materials laboratory standards IA-R052, IA-R053, and IA-R054 (ISO Analytical Limited, Crewe, UK) were used.

2.5. Statistical Analysis

The large dataset of complex metabolomic profiles and stable isotope ratios can be irrelevant or could hide certain important information without applying suitable multivariate statistical analysis. Therefore, the one-way ANOVA was performed to evaluate the difference between the means and same variance between stable isotope ratios and metabolites at the p < 0.05 probability level with Tukey’s test. In addition, the same data were subjected to principal component analysis (PCA) and further to discriminant analysis (DA) to highlight the applicability of metabolites and their stable isotope signatures in classifying the red and white wine samples according to grape variety, vintage, and geographical origin, even if the provenience regions are agroclimatically close. Statistical analysis was performed by using Addinsoft XLSTAT software version 2014.5.03 (Addinsoft Inc., New York, NY, USA).

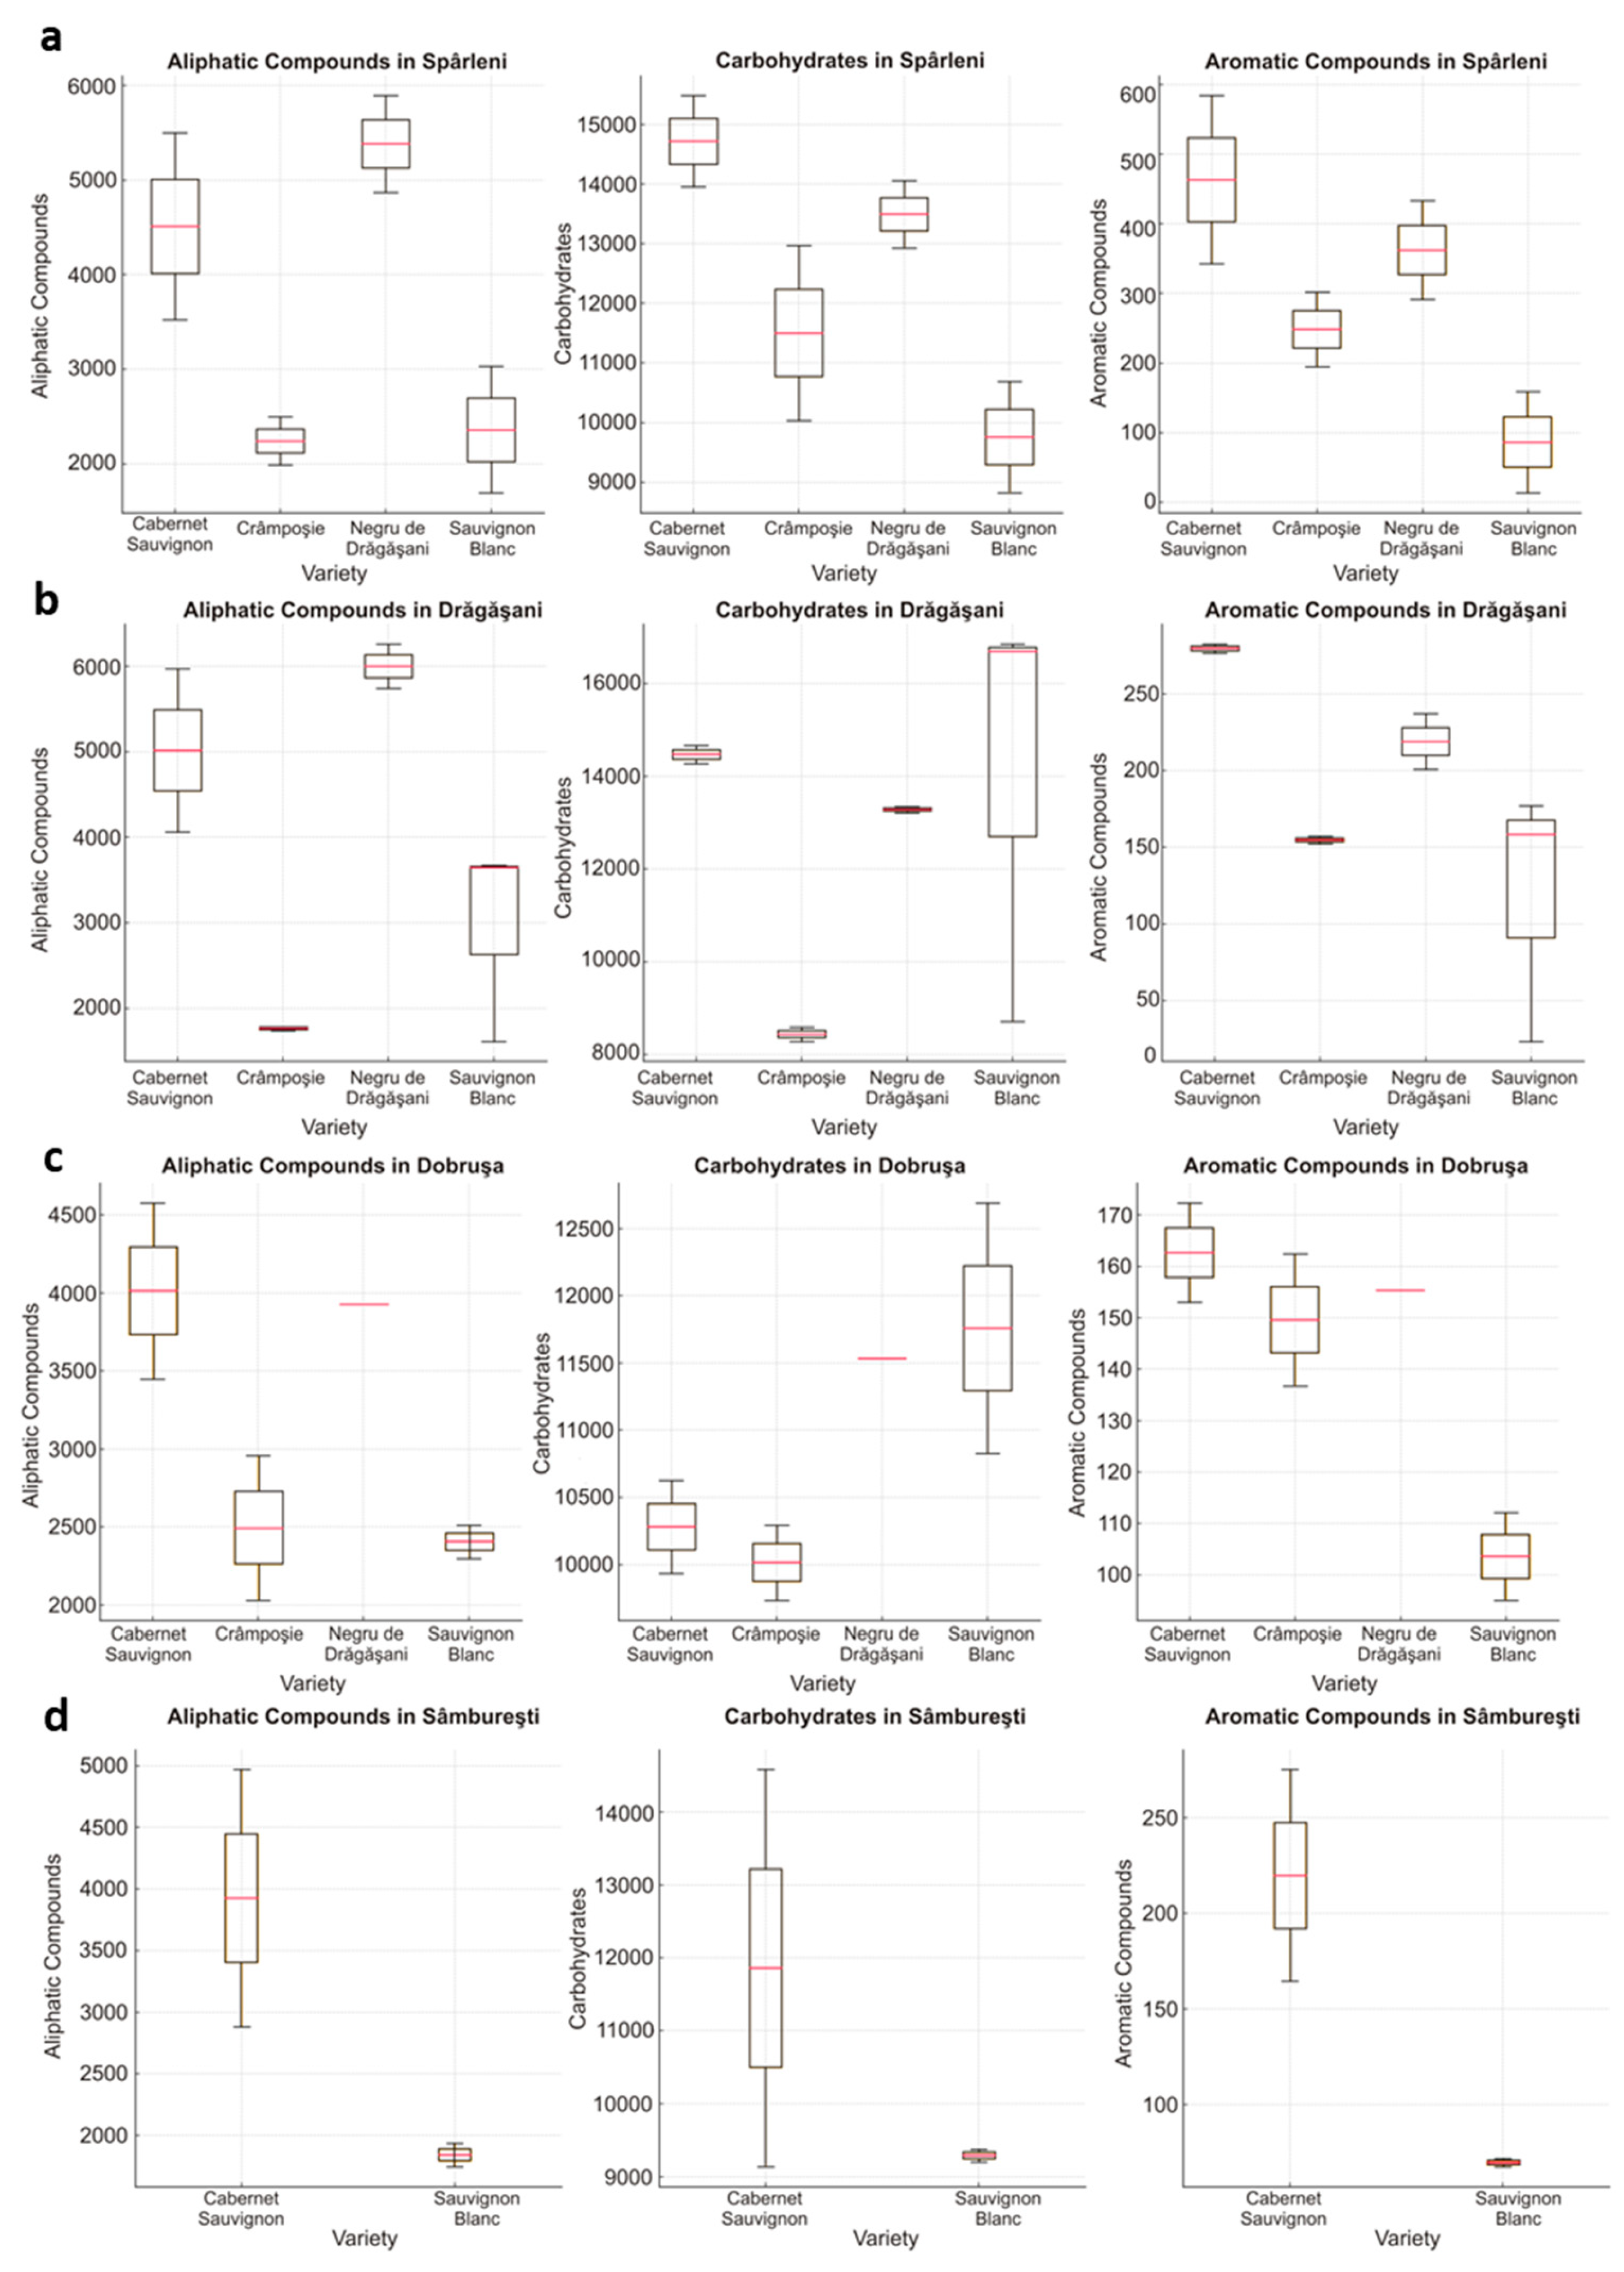
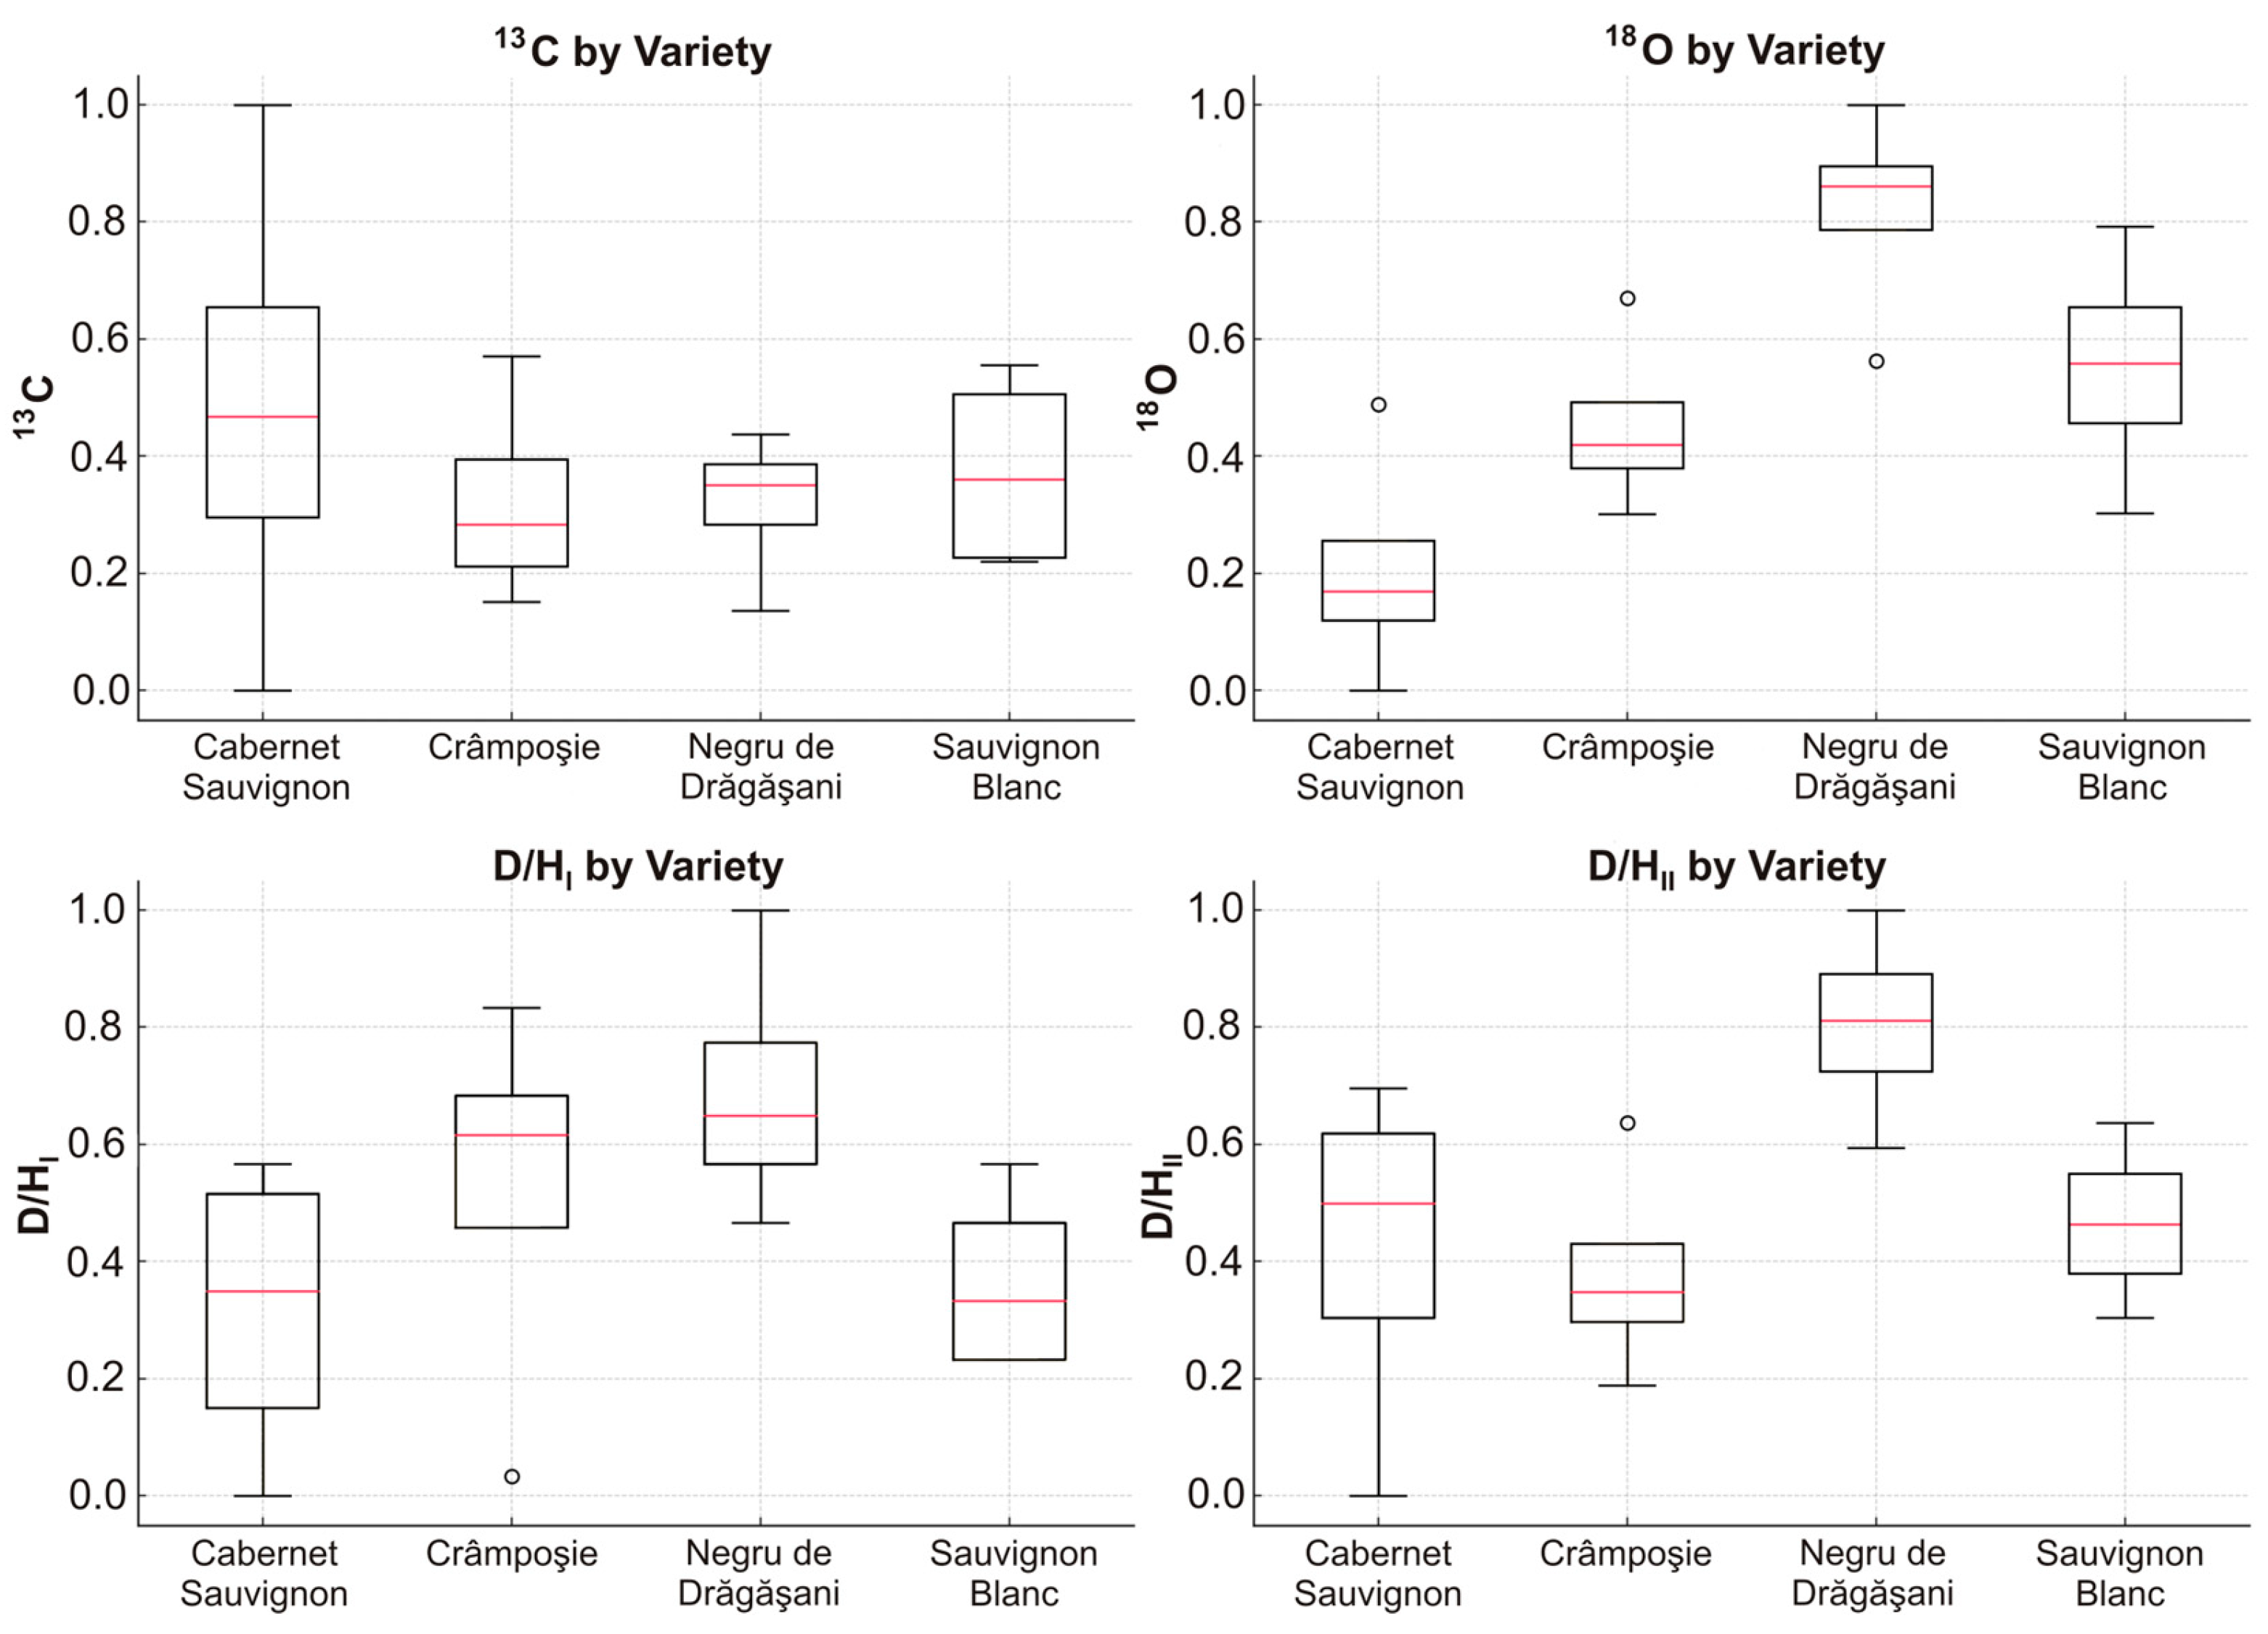
3. Results and Discussion

1H-NMR spectra were recorded to identify the metabolites in the wine samples, aiming to discriminate them based on variety, geographical origin, and harvest year. Figure 1 shows the typical 400 MHz proton NMR spectra with water suppression. Among the three spectral regions—aliphatic, carbohydrates, and aromatic—a total of 30 metabolites were identified. Their chemical shifts and multiplicities of the signals taken in consideration for quantification are presented in Table 2. Metabolite identification was made by consulting relevant literature studies [12,30,33,35,36,37,38,39,40] and the Biological Magnetic Resonance Data Bank (https://bmrb.io/, accessed on 15 June 2024). The quantified signal intensities were input into Microsoft Excel (Microsoft® Excel® 2016 MSO, version 2409, build 16.0.18025.20160) for further analysis.
It was remarkable that the peak signal with the highest intensity in the typical 1H-NMR wine spectrum was for ethanol; if the water had not been suppressed, these would be the main components of wine, but to differentiate the samples, minor components play a pivotal role. Generally, the spectra are dominated by organic acids (succinic acid, acetic acid, glycerol, 2,3-butanediol, lactic acid), amino acids (proline, alanine), carbohydrates (glucose, fructose), and phenols (caftaric acid, shikimic acid). The organic acids are the class of metabolites with the highest contribution to the stability, flavor, color, and balance of wine, these being present in both white and red wines [41]. Malic acid, for example, plays a crucial role in acidity, metabolizing during ripening. Also, acetic, citric, and succinic acids contribute significantly to the acidity and flavor profile of both red and white wines [42]. The amino acids belong to the organic acids class and add to the wine’s organoleptic properties by generating volatile aroma compounds—essential for achieving the desired acidification during winemaking [43,44,45,46,47]. Regarding the sugars, dry wines typically have them at residual levels, while sweet wines contain higher concentrations, because of their high concentration in ripe grape, constituted primarily by almost identical amounts of glucose and fructose and some sucrose. During the must fermentation, the glucose consumption starts immediately and at a faster rate; thus, the fructose proportion increases throughout the process [48]. But, in the final stages of fermentation, the ethanol concentration increases gradually with the low depletion of sugars and other nutrients [49].
A valuable by-product for certain wines that result in abundance at the beginning of yeast alcoholic fermentation is glycerol, which contributes to wine quality by giving textural properties and mouth-feel attributes. Polyphenols contribute to sensory characteristics and antioxidant activity of wines [50]. Among these, caftaric acid is a phenolic derivate present in high concentration in grape seeds and juice resulting from caffeic and tartaric acids [51]. Also, shikimic acid is a precursor for aromatic amino acid phenylalanine and tyrosine and is used to distinguish grape variety as a marker in fraud control, especially for Pinot Noir, Pinot Gris, and Pinot Blanc [52,53].
Figure 2 illustrates the distribution of metabolite classes across four grape varieties (Cabernet Sauvignon, Crâmpoșie, Negru de Drăgășani, and Sauvignon Blanc) cultivated in the investigated areas (Spârleni, Drăgășani, Dobrușa, and Sâmburești), since they are the most representative of their respective regions. It is important to note that achieving complete homogeneity across these regions was not possible due to variations in grape cultivation and production focus within each area. Therefore, the samples were chosen to reflect the typical varieties and styles produced in each region, ensuring that the unique characteristics of each terroir were represented.
Looking at the data, the Cabernet Sauvignon and Negru de Drăgășani varieties exhibited the highest concentrations of aliphatic compounds across the majority of regions. Specifically, the variance in aliphatic compounds was more pronounced in the Sâmburești and Dobrușa regions, suggesting greater regional heterogeneity in these two regions. For example, Cabernet Sauvignon in Sâmburești displayed aliphatic compound values ranging from 463.19 to 4575.92 mg/L, indicating a broad compositional spread compared to tighter distributions observed in other regions. Carbohydrate content demonstrated clear varietal and regional trends, with Cabernet Sauvignon exhibiting the highest levels across all regions and Sauvignon Blanc consistently presenting the lowest values. In Drăgășani and Spârleni, the distribution of carbohydrates was notably more constrained, particularly for Negru de Drăgășani and Crâmpoșie, where values such as 11,532.79 and 9733.60 mg/L respectively, demonstrated more consistent profiles across regions. For aromatic compounds, Cabernet Sauvignon consistently recorded higher levels compared to other varieties across all regions, with Sâmburești showing the most significant elevation, where Cabernet Sauvignon reached up to 463.19 mg/L. Conversely, Crâmpoșie and Sauvignon Blanc exhibited lower and more uniform levels of aromatic compounds, with tighter distributions across all regions, as evidenced by values such as 154.75 mg/L for Crâmpoșie in Drăgășani and 119.65 mg/L for Sauvignon Blanc. The observed variability in aliphatic compounds, carbohydrates, and aromatic compounds across regions and varieties underscores the complex interplay between genetic and environmental factors, which ultimately shape the organoleptic properties of the wines produced in these regions.
The concentration of organic acids and volatile compounds in the wines was lower than of carbohydrates but significantly higher than that of phenols, varying between 1617 mg/L (Sauvignon Blanc, Drăgășani) to 6258 mg/L (Negru de Drăgășani, Sâmburești). The carbohydrate content in wines ranged between 8285 mg/L (Crâmpoșie, Drăgășani) and 14,662 mg/L (Cabernet Sauvignon, Drăgășani), with an inverse relationship observed between carbohydrate content and the levels of organic acids and volatiles. The phenol content was very small compared to the rest of the organic compounds, ranging from 23 mg/L (Sauvignon Blanc, Drăgășani) to 583 mg/L (Cabernet Sauvignon, Spârleni), and the lowest values were found in white wines. These results are in agreement with the reports of other authors who examined the chemical composition of wines produced in different regions from various grape varieties [54,55,56]. Prior to must fermentation, the glucose and fructose concentrations are equal, but during this process, the glucose is preferentially converted by the yeast into alcohol and carbon dioxide, resulting in a higher concentration of fructose in wines [55].
Regarding the stable isotope fingerprints shown in Figure 3, it is notable that the largest range of δ13C values was observed in Cabernet Sauvignon, with the most depleted values recorded for samples from Spârleni and the most enriched for a sample from Sâmburești; these are the most geographically distant regions, presenting a difference of 0.9‰ between the mean values. Similarly, the most depleted δ18O value was found in Cabernet Sauvignon from Dobrușa, while the most enriched one was observed in Negru de Drăgășani from Sâmburești. For deuterium, the lowest values for both the methyl and methylene groups in ethanol were detected in Cabernet Sauvignon from Spârleni, with the highest values found in Negru de Drăgășani from Drăgășani. These extreme isotope values were observed exclusively in red wines. To enhance the clarity and interpretability of these findings, the data presented in Figure 3 were normalized. Normalized data often result in clearer and more interpretable visualizations, making trends and patterns more apparent. In this context, normalization allowed for a more straightforward comparison of the stable isotope variations across different wines and regions, highlighting the distinct geographical and varietal signatures with greater clarity. The observed trends suggest that grape variety plays a significant role in how isotopic signatures are expressed, reflecting both genetic and environmental factors. Cabernet Sauvignon consistently shows higher isotope values across all categories, potentially indicating that it grows in regions with more stress factors (e.g., drought or evaporation) or has particular physiological traits that enhance its isotopic signature. Negru de Drăgășani and Sauvignon Blanc varieties also display distinct isotope patterns, which might be related to their adaptation to specific climates or differences in water uptake efficiency.
For a closer examination of metabolites variance, specifically organic acids, carbohydrates, and phenols, across different wine varieties, ANOVA was applied. The color gradient applied follows a heatmap convention: red represents higher concentrations, while green represents lower concentrations, with yellow and orange indicating intermediate values. Letters next to the values indicate statistical significance groups based on a Tukey’s post hoc test. Values sharing the same letter within a column are not significantly different (p > 0.05), while values with different letters are statistically distinct.
Glycerol was identified as the most abundant metabolite in all wine samples, which is expected, given its normal concentration in dry wine as a by-product of alcoholic fermentation, followed by glucose, 2,3-butanediol, succinic acid, and fructose, while trigonelline, tyrosine, shikimic acid, sucrose, galactose, fumaric acid, formic acid, choline, GABA, alanine, and acetoin were present in lower quantities (Table 3). Glycerol production plays a crucial role in yeast metabolism, contributing to osmotic stress elimination and keeping the oxidation–reduction balance (https://www.decanter.com/learn/what-is-glycerol-ask-decanter-445840/, accessed on 15 June 2024). Also, 2,3-butanediol is a by-product fermentation derived from pyruvic acid, as acetoin, which exhibits neutral organoleptic properties [2]. Notable differences were in the case of malic and citric acids, which were undetectable in certain red wines, such as Merlot, Fetească Neagră, and Negru de Drăgășani, yet were present in high concentrations in white wines, in contrast to lactic acid. This finding can be explained by the fact that the malic acid is converted to lactic acid during malolactic fermentation, especially in red wines [55,57,58].
Regarding the harvest year (Table 4), the ANOVA statistical model revealed the same variance tendency for proline and galacturonic acid. Proline is an important amino acid, and its concentration in plants is strongly influenced by climatic conditions having an osmoprotective role. Also, galacturonic acid concentration increases in plants as a response to long-term drought stress, having an important role in oxidative damage [59].
In regard to regions (Table 5), there can be observed variance of sorbic acid, acetic acid, methanol, citric acid, glucose, galactose and galacturonic acid. From these, the most visible is for galacturonic acid which was also found in other studies as a potential marker for region due to the influence of grape origin on the glycosyl residue content from the wine oligosaccharides [60,61].
Building on the metabolite variance analysis, we further classified all wine samples according to harvest year, grape variety, and geographical origin using principal component analysis (PCA) and discriminant analysis (DA). This classification was crucial in understanding how these factors influence the chemical composition of the wines. For harvest year differentiation, a PCA model based on the identified and quantified metabolites and stable isotope ratios from all wine samples was generated. In the case of metabolites, the contribution from the total variance for the first 5 components, F1, F2, F3, F4, and F5, were 39.77%, 10.41%, 8.86%, 6.06%, and 5.44%, respectively. Figure 4 illustrates the PCA score plot derived from the first two principal components, which together explained 50.18% of the total variance in metabolites and 76.30% of the total variance in stable isotope ratios.
Analysis of the PCA score plot reveals a slight separation between wines produced in 2019 and those from 2020, primarily driven by variations in alanine and fructose, which are positively correlated with the second principal component (F2). This separation suggests that the metabolic profile of these wines is influenced by factors that vary between these two harvest years. In contrast, wines from the 2021 and 2022 harvests show only a tendency toward separation, indicating less pronounced differences in their metabolite compositions. The PCA based on stable isotope ratios provided a more distinct result, with a notable separation observed between the 2020 and 2021 vintages. This separation is largely attributed to variations in δ18O ratios, which are known to be strongly influenced by precipitation patterns. The significant differences in precipitation between these two years likely contributed to the observed isotopic distinctions, highlighting the sensitivity of stable isotope ratios to environmental conditions. These findings underscore the importance of considering both metabolite profiles and stable isotope ratios in wine classification, as they can reflect subtle, yet meaningful, differences related to vintage and climatic conditions.
Following the analysis of harvest year variations, Figure 5 illustrates the geographical origins of the wines as influenced by metabolites and stable isotope variations.
As in the case of harvest year, there can be observed a tendency of separation, particularly between wines from Dobrușa and Sâmburești, due to the variation in the signals of glycerol, GABA, and succinic acid, which are positively correlated to F1. Regarding the other two regions, Drăgășani and Spârleni, the PCA analysis did not reveal clear separation, indicating that the metabolic profiles of these regions are more closely aligned. However, the PCA based on stable isotopes revealed some separations between Sâmburești and Spârleni or Dobrușa due to δ13C and R relative distribution of deuterium. The samples from Drăgășani appear centrally on the PCA plot, reflecting the region’s geographic position relative to the others. This central placement also suggests that the isotopic composition of wines from Drăgășani, particularly in terms of deuterium and δ18O, is influenced by regional climatic factors such as precipitation, which tend to be more consistent across this region.
Building upon the previous analyses, the application of metabolomics allowed for a clear distinction between red and white wines. Figure 6 shows this separation, where Sauvignon Blanc, Cramposie, and Chardonnay wines are distinctly separated from Cabernet Sauvignon, Feteasca Neagra, Merlot, and Negru de Dragasani due to the variance in the malic acid and glucose, which were negatively correlated with F1 and galactose, galacturonic acid, choline, succinic acid, proline, and tyrosine, which were positively correlated with F1. In contrast, when analyzing stable isotope data, the samples did not exhibit a clear separation, suggesting that metabolomic profiling provides a more distinct grouping of wines by variety.
To further validate the findings from principal component analysis (PCA) and uncover additional correlations, the data set was subjected to discriminant analysis (DA). While PCA is an unsupervised technique commonly used to identify patterns and reduce dimensionality, leading to the discovery of distinct separations, DA is a supervised method designed to maximize the separation between predefined groups. In this case, DA provided a higher level of discrimination compared to PCA, particularly when assessing the wines by geographical origin. As shown in Figure 7, the first two discriminant functions (F1 and F2) explained 98.37% of the total variance, with 90.76% attributed to F1 and 7.61% to F2. A significant separation was observed between wines from Dobrușa and those from the other studied regions, driven primarily by the metabolites sorbic acid, arabinose, and tyrosine, which were positively correlated with F1. In addition, shikimic acid, glycerol, isobutanol, and choline further contributed to this differentiation, being positively correlated with F1 as well. It is well documented that the content of fatty acids, amino acids, organic acids, carbohydrates, and phenolic compounds in plants can be influenced by soil nutrient composition [62,63]. For instance, research has shown that nutrient deficiencies in soils can lead to a decrease in alanine, proline, and tyrosine levels in plants [62], which may account for some of the observed metabolite variations in the wines. This association between soil composition and metabolite profiles in wine has been explored in various studies, particularly through the use of NMR-based metabolomics. As highlighted by Bambina et al. [62], metabolomics has been widely used to classify wines according to their geographical origin, but also to variety, vintage, and winemaking techniques. Early research demonstrated that wines from different regions or countries could be clearly differentiated using NMR analysis [27,33]. However, later studies showed that even wines made from the same grape variety, when vinified in different regions, exhibited distinct metabolomic profiles [24,55], suggesting a strong environmental influence, particularly from soil. On a more localized scale, NMR-based metabolomics has also been effective in distinguishing wines within the same geographical area but under different regional trademarks [24,36,46,63,64,65]. For example, Mazzei et al. [24] classified an Italian wine obtained from same varieties of grapes collected from nearby soils with different pedological properties and marked variability in α-hydroxyisobutyrate, lactic acid, succinic acid, glycerol, α-fructose, and β-d-glucuronic acid.
Later, Bambina et al. (2023) [65] revealed the impact of soil chemical–physical parameters on the metabolic profile of wines by showing their correlation with gallic acid, 1-butanol, glycerol proline, threonine, citric acid, succinic acid, shikimic acid, 1-propanol, myo-inositol, choline, acetic acid, and trigonelline. This conclusion was further corroborated by subsequent studies, which continue to affirm the critical role of soil in shaping the chemical composition and distinctiveness of wines [62]. Further supporting this, the metabolites most commonly associated with geographical discrimination include proline, which is known to vary significantly depending on the region, along with alanine, leucine, threonine, and histidine [66,67]. Organic acids such as malic and citric acid, as well as fermentation-derived compounds like lactic acid and succinic acid, have also been found to vary regionally [24,68]. Additionally, metabolites such as 2,3-butanediol, phenethyl alcohol, and glycerol, all products of fermentation, frequently serve as markers of geographical origin [66,67,69]. Among the phenolic compounds, gallic acid has been particularly linked to differences between regions [33,67,70]. These findings reinforce the idea that metabolomics can effectively differentiate wines not only at the country or regional level but also within smaller, geographically close areas. When analyzing stable isotopes, a clear separation can be observed, particularly between Sâmburești and the other regions, due to δ13C, which was negatively correlated with F1. Further isotope analysis revealed that separation was more pronounced when considering both δ13C and D/HI, which are negatively correlated with F1, as well as the relative distribution of deuterium R and D/HII, which are positively correlated to F1. The samples from Drăgășani appeared centrally on the graph, reflecting not only the geographical position of this region relative to the others but also the influence of isotopes such as deuterium and δ18O, which are strongly affected by local precipitation and climatic conditions. This central placement suggests a more homogeneous isotopic signature for Drăgășani wines, likely due to the moderating environmental factors in the region.
Figure 8 reveals a contribution of 87.59% from the total of metabolite variance for the first two functions of the discriminant analysis, and the differentiation of the wine samples was achieved according to the 4 years of harvest (2019, 2020, 2021, and 2022). F1 has a contribution of 54.28%, followed by F2 with 33.32%, offering a good discrimination for the years 2019, 2020, and 2021.
The metabolites that showed significant variations in the wine samples are sucrose, malic acid, formic acid, myo-inositol, and 1-propanol, which correlated negatively with F1 and sorbic acid, glycerol, GABA, trigonelline, and fructose, with positive coefficient values. A clear separation was observed between the year 2022 and the other years based on the F2 factor. This distinction was influenced by compounds such as shikimic acid, proline, methanol, fumaric acid, galactose, galacturonic acid, and acetoin, which had negative coefficient values, while alanine, succinic acid, and citric acid had positive values. Similar findings have been reported by other researchers. For instance, in a study by Viggiani and Morelli [69], it was noted that proline levels increase with wine age, and succinic acid shows significant variation across wines from different years, making it useful for differentiating vintage. The same authors noted the possibility of using these metabolites for geographical origin discrimination. A different approach focused on differentiating the wines produced in different months revealed higher contents of glycerol, succinic acid, and 2,3-butanediol for products obtained in December, while proline and lactic acid were more concentrated in wines from July, demonstrating the influence of climatic conditions on metabolite content [71]. However, the study realized by Geană et al. [72] indicates a clear discrimination between wines from different years based on alanine and carbohydrates combined with certain anthocyanins and stable isotopes.
From the point of view of the harvest year (Figure 8), based on isotopic composition, in the 2019 samples, there was observed a slight tendency of separation from the 2021 samples due to the variable 18O, which is positively correlated with F1.
Regarding the variety (Figure 9), DA analysis revealed a clear separation between red and white wines, based on metabolite data, but there also can be observed a grouping of wines from the same classes, the two first factors summing to 79.11% of the total variance. The metabolites which are contributing to white and red wine separation are citric acid, malic acid, alanine, and glucose, with a negative correlation with F1, and proline, choline, GABA, succinic acid, and tyrosine, with a positive correlation. The separation tendency of white wines (Fetească Regală, Sauvignon Blanc, Crâmpoșie) can be attributed to 2,3-butanediol, galactose, and caftaric and galacturonic acids, which are negatively correlated with F2. Regarding the red wines (Cabernet Sauvignon, Negru de Drăgășani, Fetească Neagră, Merlot), the separation tendency is given by isopentanol and formic and shikimic acids correlated positively with F2.
The obtained results are in agreement with previous studies [23,25,39,63,73,74] focused on wines classification, where the efficiency of 1H NMR spectroscopy to be applied in discrimination the variety or in detecting different blends was demonstrated. Godelmann et al. [23] successfully classified different varieties of white and red wines, highlighting the importance of shikimic acid and 2,3-butanediol in prediction of grape variety. Beside these metabolites, also responsible for a high degree of prediction were methanol, lactic acid, citric acid, malic acid, succinic acid, acetic acid, fumaric acid, tartaric acid, 3-methylbutanediol, acetone, and alanine. From the results obtained through application of one- and two-dimensional NMR spectroscopy combined with the PLS-DA model, Papotti et al. [63] revealed a good discrimination based on metabolites present in the low-frequency spectral region, such as 2,3-butanediol, lactic acid, succinic acid, threonine, and malic acid.
Stable isotope ratios, while potentially useful in the majority of contexts related to food authenticity, played a similar role in distinguishing between wine samples in this study. Although stable isotope analysis can sometimes aid in varietal classification, its influence in this case was minimal, suggesting that other factors may be more important in distinguishing between wine varieties. The variety discrimination is an important issue taking into account that some wines resulting from blended grape varieties.
The results of this study demonstrate the effectiveness of integrating stable isotope analysis with NMR-based metabolomics for differentiating wines from geographically proximate, cross-border regions. Previous studies have primarily utilized multivariate statistical methods based on NMR data to classify wines based on their geographical origin, grape variety, and vintage. For example, over 90% classification accuracy was achieved for German wines, but challenges were encountered in distinguishing wines from adjacent regions where climatic conditions were similar [23]. Also, the separation in terms of variety and region of wines from continental areas of France, California, Australia, and Korea was achieved by using NMR spectroscopic analysis (due to some metabolites such as 2,3-butanediol, lactate, acetate, succinate, malate, glycerol, tartrate, glucose, and proline) [33]. Similarly, studies on Pinot Noir wines from Australia and New Zealand have demonstrated differentiation via ICP-MS combined with PCA, underscoring the efficacy of multivariate analysis for geographical wine classification [75]. Furthermore, the differentiation of wines (Cabernet Sauvignon, Blaufrankisch, Merlot, and Pinot Noir) from two geographical regions from Hungary was ascribed to different climate conditions [70]. From the point of view of variety, their results were in accordance with another study based on Czech wine investigation performed by Mascellani et al. [76]. However, these approaches generally focus on broader geographical distinctions, with limited ability to address the specific challenge posed by cross-border regions that share similar agroclimatic conditions. This pilot study builds upon these existing methods by addressing a central problem in the wine industry: the need for effective differentiation of wines from cross-border areas. The used approach incorporates stable isotope analysis alongside metabolomics to capture subtle, yet significant, variations influenced by environmental factors, even when those factors may be largely similar due to geographical proximity. This combination not only offers a more precise classification based on isotopic signatures (such as δ13C, δ18O, and deuterium ratios), but also enhances the discrimination potential by integrating metabolite profiles, including organic acids, carbohydrates, and phenols, that are unique to specific terroirs. Future research could expand upon these findings by incorporating additional agroclimatic data and examining a broader range of wine-producing regions to further validate and refine this approach.

4. Limitations and Future Directions

This study successfully applied 1H-NMR and IRMS techniques to differentiate wines from geographically close regions, contributing valuable insights into wine authentication. However, several limitations should be acknowledged. First, the study was restricted to a limited number of grape varieties and regional samples, which may affect the generalizability of the findings across a broader range of wine-producing areas. Future research should aim to include a more diverse set of wine samples, encompassing various regions and grape varieties, to enhance the robustness and applicability of these methods. Additionally, the study focused on stable isotope and metabolomic profiling, which, while effective, may not capture the full spectrum of regional and varietal characteristics influenced by other environmental factors, such as microclimatic variations and soil composition. Future studies could incorporate complementary analytical techniques, such as elemental analysis or the inclusion of pedoclimatic data, to provide a more comprehensive understanding of the terroir effects on wine composition.

5. Conclusions

This study underscores the potential of metabolomic profiling and stable isotope analysis as robust tools for cross-border wine authentication. By analyzing red and white wines from four agroclimatically similar regions, we identified significant differences in metabolite content and isotopic composition that facilitate the differentiation of wines by region, grape variety, and vintage. Malic and citric acids were particularly valuable in distinguishing white wines, as their absence in red wines serves as a marker to detect potential blending or dilution with white varieties. Principal component analysis (PCA) revealed patterns related to vintage and region, while discriminant analysis (DA) provided clearer distinctions based on variety, with metabolites such as 2,3-butanediol and shikimic acid being particularly informative. The integration of stable isotope analysis with metabolomics offers a potential approach for verifying the geographic origin of wines from closely situated regions, where climatic similarities may hinder traditional differentiation methods. This cross-border authentication is especially important for wine producers and regulatory authorities aiming to protect the integrity of region-specific wine profiles. By establishing distinct isotopic and chemical signatures, this study demonstrates the feasibility of accurately authenticating wines from neighboring areas, which is crucial for preventing mislabeling and safeguarding regional wine identities. These findings not only enhance our understanding of regional wine characteristics but also lay the foundation for developing a comprehensive database or predictive model to support consistent and reliable authentication practices. For wine producers, these techniques help maintain brand reputation and market differentiation, reinforcing the value associated with Protected Designation of Origin (PDO) and Protected Geographical Indication (PGI) labels. For regulatory bodies, they provide a practical solution for detecting and mitigating cross-border wine fraud, ensuring compliance with origin-related claims, and promoting consumer confidence in the accuracy of wine labeling on an international scale.

Supplementary Materials

The following supporting information can be downloaded at: https://www.mdpi.com/article/10.3390/foods13213372/s1, Figure S1: Investigated wine origin source https://www.onvpv.ro/ro/content/indicatii-geografice, accessed on 20 September 2024; Figure S2: The variables’ contribution in PCA for the differentiation of wine samples according to harvest year; Figure S3: The variables’ contribution in PCA for the differentiation of wine samples according to geographical origin; Figure S4: The variables’ contribution in PCA for the differentiation of wine samples according to grape variety.

Author Contributions

Conceptualization, M.G.M. and O.R.B.; Data curation, M.G.M.; Formal analysis, M.G.M., D.C. and D.G.; Funding acquisition, M.G.M.; Investigation, M.G.M., D.C., O.R.B. and D.G.; Methodology, M.G.M.; Resources, M.G.M. and O.R.B.; Software, O.R.B.; Supervision, R.E.I. and S.S.; Validation, O.R.B. and R.E.I.; Visualization, O.R.B. and D.G.; Writing—original draft, M.G.M.; Writing—review & editing, O.R.B., D.G. and R.E.I. All authors have read and agreed to the published version of the manuscript.

Funding

This work was carried out through the Core Program within the National Research Development and Innovation Plan 2022-2027, carried out with the support of MCID, grant 20N/2023, project no. PN 23 15 03 01.

Institutional Review Board Statement

Not applicable.

Informed Consent Statement

Not applicable.

Data Availability Statement

The original contributions presented in the study are included in the article/Supplementary Materials, further inquiries can be directed to the corresponding author.

Acknowledgments

This research was funded through the Core Program within the National Research Development and Innovation Plan 2022-2027, carried out with the support of MCID, grant 20N/2023, project PN 23 15 03 01 “The implementation of integrated isotopic-chemical-nuclear analytical methodologies for the authentication of traditional Romanian food products”, Sectorial Plan-ADER 2026, Project ADER 17.1.2–“Research on the development of sustainable technologies for obtaining and utilizing innovative ingredients and food products to nutritionally balance the modern consumer’s diet” financed by the Ministry of Agriculture and Rural Development—Romania and project Establishment and operationalization of a Competence Center for Soil Health and Food Safety—CeSoH, Contract no.: 760005/2022, specific project no.5, with the title: Improving soil conservation and resilience by boosting biodiversity and functional security of organic food products, Code 2, financed through PNRR-III-C9-2022—I5 (PNRR-National Recovery and Resilience Plan, C9 Support for the private sector, research, development and innovation, I5 Establishment and operationalization of Competence Centers).

Conflicts of Interest

The authors declare no conflicts of interest.

References

  1. Horacek, M.; Nieuwoudt, H.; Bauer, F.F.; Bagheri, B.; Setati, M.E. Differentiation of Geographic Origin of South African Wines from Austrian Wines by IRMS and SNIF-NMR. Foods 2023, 12, 1175. [Google Scholar] [CrossRef] [PubMed]
  2. Khakimov, B.; Bakhytkyzy, I.; Fauhl-Hassek, C.; Engelsen, S.B. Non-Volatile Molecular Composition and Discrimination of Single Grape White Wines of Chardonnay, Riesling, Sauvignon Blanc and Silvaner Using Untargeted GC-MS Analysis. Food Chem. 2022, 369, 130878. [Google Scholar] [CrossRef] [PubMed]
  3. Alañón, M.E.; Pérez-Coello, M.S.; Marina, M.L. Wine Science in the Metabolomics Era. TrAC Trends Anal. Chem. 2015, 74, 1–20. [Google Scholar] [CrossRef]
  4. Barisan, L.; Galletto, L. How Do Sparkling Wine Producers Adopt a Sub-Appellation? Evidence from an Exploratory Study on Heroic Prosecco Superiore Rive. Wine Econ. Policy 2021, 10, 45–59. [Google Scholar] [CrossRef]
  5. Sun, X.; Zhang, F.; Gutiérrez-Gamboa, G.; Ge, Q.; Xu, P.; Zhang, Q.; Fang, Y.; Ma, T. Real Wine or Not? Protecting Wine with Traceability and Authenticity for Consumers: Chemical and Technical Basis, Technique Applications, Challenge, and Perspectives. Crit. Rev. Food Sci. Nutr. 2022, 62, 6783–6808. [Google Scholar] [CrossRef]
  6. Gougeon, L.; Da Costa, G.; Richard, T.; Guyon, F. Wine Authenticity by Quantitative 1H NMR versus Multitechnique Analysis: A Case Study. Food Anal. Methods 2019, 12, 956–965. [Google Scholar] [CrossRef]
  7. Dordevic, N.; Camin, F.; Marianella, R.M.; Postma, G.J.; Buydens, L.M.C.; Wehrens, R. Detecting the Addition of Sugar and Water to Wine: Detecting the Addition of Sugar and Water to Wine. Aust. J. Grape Wine Res. 2013, 19, 324–330. [Google Scholar] [CrossRef]
  8. Geana, E.I.; Popescu, R.; Costinel, D.; Dinca, O.R.; Stefanescu, I.; Ionete, R.E.; Bala, C. Verifying the Red Wines Adulteration through Isotopic and Chromatographic Investigations Coupled with Multivariate Statistic Interpretation of the Data. Food Control 2016, 62, 1–9. [Google Scholar] [CrossRef]
  9. Košir, I.J.; Kocjančič, M.; Ogrinc, N.; Kidrič, J. Use of SNIF-NMR and IRMS in Combination with Chemometric Methods for the Determination of Chaptalisation and Geographical Origin of Wines (the Example of Slovenian Wines). Anal. Chim. Acta 2001, 429, 195–206. [Google Scholar] [CrossRef]
  10. Holmberg, L. Wine Fraud. Int. J. Wine Res. 2010, 2, 105–113. [Google Scholar] [CrossRef]
  11. Viskić, M.; Bandić, L.M.; Korenika, A.-M.J.; Jeromel, A. NMR in the Service of Wine Differentiation. Foods 2021, 10, 120. [Google Scholar] [CrossRef] [PubMed]
  12. Aru, V.; Sørensen, K.; Khakimov, B.; Toldam-Andersen, T.; Balling Engelsen, S. Cool-Climate Red Wines—Chemical Composition and Comparison of Two Protocols for 1H–NMR Analysis. Molecules 2018, 23, 160. [Google Scholar] [CrossRef] [PubMed]
  13. Cuadros-Inostroza, A.; Giavalisco, P.; Hummel, J.; Eckardt, A.; Willmitzer, L.; Peña-Cortés, H. Discrimination of Wine Attributes by Metabolome Analysis. Anal. Chem. 2010, 82, 3573–3580. [Google Scholar] [CrossRef]
  14. Skogerson, K.; Runnebaum, R.; Wohlgemuth, G.; De Ropp, J.; Heymann, H.; Fiehn, O. Comparison of Gas Chromatography-Coupled Time-of-Flight Mass Spectrometry and 1H Nuclear Magnetic Resonance Spectroscopy Metabolite Identification in White Wines from a Sensory Study Investigating Wine Body. J. Agric. Food Chem. 2009, 57, 6899–6907. [Google Scholar] [CrossRef]
  15. Akamatsu, F.; Shimizu, H.; Hayashi, S.; Kamada, A.; Igi, Y.; Koyama, K.; Yamada, O.; Goto-Yamamoto, N. Chemometric Approaches for Determining the Geographical Origin of Japanese Chardonnay Wines Using Oxygen Stable Isotope and Multi-Element Analyses. Food Chem. 2022, 371, 131113. [Google Scholar] [CrossRef]
  16. Camin, F.; Dordevic, N.; Wehrens, R.; Neteler, M.; Delucchi, L.; Postma, G.; Buydens, L. Climatic and Geographical Dependence of the H, C and O Stable Isotope Ratios of Italian Wine. Anal. Chim. Acta 2015, 853, 384–390. [Google Scholar] [CrossRef]
  17. Dinca, O.R.; Ionete, R.E.; Costinel, D.; Geana, I.E.; Popescu, R.; Stefanescu, I.; Radu, G.L. Regional and Vintage Discrimination of Romanian Wines Based on Elemental and Isotopic Fingerprinting. Food Anal. Methods 2016, 9, 2406–2417. [Google Scholar] [CrossRef]
  18. Fan, S.; Zhong, Q.; Gao, H.; Wang, D.; Li, G.; Huang, Z. Elemental Profile and Oxygen Isotope Ratio (δ18O) for Verifying the Geographical Origin of Chinese Wines. J. Food Drug Anal. 2018, 26, 1033–1044. [Google Scholar] [CrossRef]
  19. Raco, B.; Dotsika, E.; Poutoukis, D.; Battaglini, R.; Chantzi, P. O–H–C Isotope Ratio Determination in Wine in Order to Be Used as a Fingerprint of Its Regional Origin. Food Chem. 2015, 168, 588–594. [Google Scholar] [CrossRef]
  20. Coelho, I.; Matos, A.S.; Epova, E.N.; Barre, J.; Cellier, R.; Ogrinc, N.; Castanheira, I.; Bordado, J.; Donard, O.F.X. Multi-Element and Multi-Isotopic Profiles of Port and Douro Wines as Tracers for Authenticity. J. Food Compos. Anal. 2023, 115, 104988. [Google Scholar] [CrossRef]
  21. Horacek, M.; Ogrinc, N.; Magdas, D.A.; Wunderlin, D.; Sucur, S.; Maras, V.; Misurovic, A.; Eder, R.; Čuš, F.; Wyhlidal, S.; et al. Isotope Analysis (13C, 18O) of Wine from Central and Eastern Europe and Argentina, 2008 and 2009 Vintages: Differentiation of Origin, Environmental Indications, and Variations Within Countries. Front. Sustain. Food Syst. 2021, 5, 638941. [Google Scholar] [CrossRef]
  22. Valls Fonayet, J.; Loupit, G.; Richard, T. MS- and NMR-Metabolomic Tools for the Discrimination of Wines: Applications for Authenticity. In Advances in Botanical Research; Elsevier: Amsterdam, The Netherlands, 2021; Volume 98, pp. 297–357. ISBN 978-0-12-821688-0. [Google Scholar]
  23. Godelmann, R.; Fang, F.; Humpfer, E.; Schütz, B.; Bansbach, M.; Schäfer, H.; Spraul, M. Targeted and Nontargeted Wine Analysis by 1H NMR Spectroscopy Combined with Multivariate Statistical Analysis. Differentiation of Important Parameters: Grape Variety, Geographical Origin, Year of Vintage. J. Agric. Food Chem. 2013, 61, 5610–5619. [Google Scholar] [CrossRef] [PubMed]
  24. Mazzei, P.; Francesca, N.; Moschetti, G.; Piccolo, A. NMR Spectroscopy Evaluation of Direct Relationship between Soils and Molecular Composition of Red Wines from Aglianico Grapes. Anal. Chim. Acta 2010, 673, 167–172. [Google Scholar] [CrossRef] [PubMed]
  25. Anastasiadi, M.; Zira, A.; Magiatis, P.; Haroutounian, S.A.; Skaltsounis, A.L.; Mikros, E. 1H NMR-Based Metabonomics for the Classification of Greek Wines According to Variety, Region, and Vintage. Comparison with HPLC Data. J. Agric. Food Chem. 2009, 57, 11067–11074. [Google Scholar] [CrossRef] [PubMed]
  26. Lee, J.-E.; Hwang, G.-S.; Van Den Berg, F.; Lee, C.-H.; Hong, Y.-S. Evidence of Vintage Effects on Grape Wines Using 1H NMR-Based Metabolomic Study. Anal. Chim. Acta 2009, 648, 71–76. [Google Scholar] [CrossRef]
  27. Pereira, G.E.; Gaudillere, J.-P.; van Leeuwen, C.; Maucourt, M.; Deborde, C.; Moing, A.; Rolin, D. 1H-NMR Metabolic Profiling of Wines from Three Cultivars, Three Soil Types and Two Contrasting Vintages. IVES Conf. Ser. Terroir 2006, 1, 402–406. [Google Scholar]
  28. Leder, R.; Petric, I.V.; Jusup, J.; Banović, M. Geographical Discrimination of Croatian Wines by Stable Isotope Ratios and Multielemental Composition Analysis. Front. Nutr. 2021, 8, 625613. [Google Scholar] [CrossRef]
  29. Horacek, M.; Hola, M.; Tobolkova, B.; Kolar, K.; Vaculovic, T.; Mikes, O.; Marosanovic, B.; Philipp, C.; Lojovic, M.; Polovka, M.; et al. Investigation of Geographic Origin of Wine from Border Regions: Results from Investigation of Two Vintages. BIO Web Conf. 2019, 15, 02039. [Google Scholar] [CrossRef]
  30. Gerginova, D.; Simova, S. Chemical Profiling of Wines Produced in Bulgaria and Distinction from International Grape Varieties. ACS Omega 2023, 8, 18702–18713. [Google Scholar] [CrossRef]
  31. Solovyev, P.A.; Fauhl-Hassek, C.; Riedl, J.; Esslinger, S.; Bontempo, L.; Camin, F. NMR Spectroscopy in Wine Authentication: An Official Control Perspective. Compr. Rev. Food Sci. Food Saf. 2021, 20, 2040–2062. [Google Scholar] [CrossRef]
  32. Esslinger, S.; Fauhl-Hassek, C.; Wittkowski, R. Authentication of Wine by 1H-NMR Spectroscopy: Opportunities and Challenges. In ACS Symposium Series; Ebeler, S.B., Sacks, G., Vidal, S., Winterhalter, P., Eds.; American Chemical Society: Washington, DC, USA, 2015; Volume 1203, pp. 85–108. ISBN 978-0-8412-3010-1. [Google Scholar]
  33. Son, H.-S.; Kim, K.M.; Van Den Berg, F.; Hwang, G.-S.; Park, W.-M.; Lee, C.-H.; Hong, Y.-S. 1H Nuclear Magnetic Resonance-Based Metabolomic Characterization of Wines by Grape Varieties and Production Areas. J. Agric. Food Chem. 2008, 56, 8007–8016. [Google Scholar] [CrossRef] [PubMed]
  34. Godelmann, R.; Kost, C.; Patz, C.-D.; Ristow, R.; Wachter, H. Quantitation of Compounds in Wine Using 1H NMR Spectroscopy: Description of the Method and Collaborative Study. J. AOAC Int. 2016, 99, 1295–1304. [Google Scholar] [CrossRef] [PubMed]
  35. Hu, B.; Cao, Y.; Zhu, J.; Xu, W.; Wu, W. Analysis of Metabolites in Chardonnay Dry White Wine with Various Inactive Yeasts by 1H NMR Spectroscopy Combined with Pattern Recognition Analysis. AMB Express 2019, 9, 1–14. [Google Scholar] [CrossRef] [PubMed]
  36. Le Mao, I.; Martin-Pernier, J.; Bautista, C.; Lacampagne, S.; Richard, T.; Da Costa, G. 1H-NMR Metabolomics as a Tool for Winemaking Monitoring. Molecules 2021, 26, 6771. [Google Scholar] [CrossRef]
  37. Pereira, G.E.; Gaudillere, J.-P.; Van Leeuwen, C.; Hilbert, G.; Lavialle, O.; Maucourt, M.; Deborde, C.; Moing, A.; Rolin, D. 1H NMR and Chemometrics to Characterize Mature Grape Berries in Four Wine-Growing Areas in Bordeaux, France. J. Agric. Food Chem. 2005, 53, 6382–6389. [Google Scholar] [CrossRef]
  38. Hanganu, A.; Todasca, M.-C.; Chira, N.-A.; Rosca, S. Influence of Common and Selected Yeasts on Wine Composition Studied Using 1H-NMR Spectroscopy. Rev. Chim. 2011, 62, 689–692. [Google Scholar]
  39. Fan, S.; Zhong, Q.; Fauhl-Hassek, C.; Pfister, M.K.-H.; Horn, B.; Huang, Z. Classification of Chinese Wine Varieties Using 1H NMR Spectroscopy Combined with Multivariate Statistical Analysis. Food Control 2018, 88, 113–122. [Google Scholar] [CrossRef]
  40. García-Aguilera, M.E.; Delgado-Altamirano, R.; Villalón, N.; Ruiz-Terán, F.; García-Garnica, M.M.; Ocaña-Ríos, I.; Rodríguez De San Miguel, E.; Esturau-Escofet, N. Study of the Stability of Wine Samples for 1H-NMR Metabolomic Profile Analysis through Chemometrics Methods. Molecules 2023, 28, 5962. [Google Scholar] [CrossRef]
  41. Snow, L.; Trass, M.; Klein, M.; Orlowicz, S.; Rivera, B. Fast and Robust Analysis of Organic Acids from Wine Using HPLC-UV. U.S. Patent 6,162,362, 19 December 2000. [Google Scholar]
  42. Jackson, R.S. Wine Science: Principles and Applications, 3rd ed.; Elsevier: Amsterdam, The Netherlands; Heidelberg, Germany, 2008; ISBN 978-0-12-373646-8. [Google Scholar]
  43. Palomino-Vasco, M.; Acedo-Valenzuela, M.I.; Rodríguez-Cáceres, M.I.; Mora-Díez, N. Monitoring Winemaking Process Using Tyrosine Influence in the Excitation-Emission Matrices of Wine. Food Chem. 2021, 344, 128721. [Google Scholar] [CrossRef]
  44. Robles, A.; Fabjanowicz, M.; Chmiel, T.; Płotka-Wasylka, J. Determination and Identification of Organic Acids in Wine Samples. Problems and Challenges. TrAC Trends Anal. Chem. 2019, 120, 115630. [Google Scholar] [CrossRef]
  45. Valdés, M.E.; Talaverano, M.I.; Moreno, D.; Prieto, M.H.; Mancha, L.A.; Uriarte, D.; Vilanova, M. Effect of the Timing of Water Deficit on the Must Amino Acid Profile of Tempranillo Grapes Grown under the Semiarid Conditions of SW Spain. Food Chem. 2019, 292, 24–31. [Google Scholar] [CrossRef] [PubMed]
  46. Petropoulos, S.; Metafa, M.; Kotseridis, Y.; Paraskevopoulos, I.; Kallithraka, S. Amino Acid Content of Agiorgitiko (Vitis vinifera L. cv.) Grape Cultivar Grown in Representative Regions of Nemea. Eur. Food Res. Technol. 2018, 244, 2041–2050. [Google Scholar] [CrossRef]
  47. Callejón, R.M.; Troncoso, A.M.; Morales, M.L. Determination of Amino Acids in Grape-Derived Products: A Review. Talanta 2010, 81, 1143–1152. [Google Scholar] [CrossRef]
  48. Rodicio, R.; Heinisch, J.J. Carbohydrate Metabolism in Wine Yeasts. In Biology of Microorganisms on Grapes, in Must and in Wine; König, H., Unden, G., Fröhlich, J., Eds.; Springer International Publishing: Cham, Switzerland, 2017; pp. 189–213. ISBN 978-3-319-60020-8. [Google Scholar]
  49. Bauer, F.F. Yeast Stress Response and Fermentation Efficiency: How to Survive the Making of Wine—A Review. Afr. J. Enol. Vitic. 2000, 21, 27–51. [Google Scholar] [CrossRef]
  50. Buljeta, I.; Pichler, A.; Šimunović, J.; Kopjar, M. Beneficial Effects of Red Wine Polyphenols on Human Health: Comprehensive Review. Curr. Issues Mol. Biol. 2023, 45, 782–798. [Google Scholar] [CrossRef]
  51. Koriem, K.M.M. Caftaric Acid: An Overview on Its Structure, Daily Consumption, Bioavailability and Pharmacological Effects. Biointerface Res. Appl. Chem. 2020, 10, 5616–5623. [Google Scholar] [CrossRef]
  52. Román, T.; Nicolini, G.; Barp, L.; Malacarne, M.; Tait, F.; Larcher, R. Shikimic Acid Concentration in White Wines Produced with Different Processing Protocols from Fungus-Resistant Grapes Growing in the Alps. VITIS-J. Grapevine Res. 2018, 57, 41–46. [Google Scholar] [CrossRef]
  53. Kumar, N.; Goel, N. Phenolic Acids: Natural Versatile Molecules with Promising Therapeutic Applications. Biotechnol. Rep. 2019, 24, e00370. [Google Scholar] [CrossRef]
  54. Cibrario, A.; Perello, M.C.; Miot-Sertier, C.; Riquier, L.; De Revel, G.; Ballestra, P.; Dols-Lafargue, M. Carbohydrate Composition of Red Wines during Early Aging and Incidence on Spoilage by Brettanomyces bruxellensis. Food Microbiol. 2020, 92, 103577. [Google Scholar] [CrossRef]
  55. Jakabová, S.; Fikselová, M.; Mendelová, A.; Ševčík, M.; Jakab, I.; Aláčová, Z.; Kolačkovská, J.; Ivanova-Petropulos, V. Chemical Composition of White Wines Produced from Different Grape Varieties and Wine Regions in Slovakia. Appl. Sci. 2021, 11, 11059. [Google Scholar] [CrossRef]
  56. Scettri, A.; Baroldi, I.; Allari, L.; Bolognini, L.; Guardini, K.; Schievano, E. NMR Sugar-Profile in Genuine Grape Must. Food Chem. 2024, 451, 139374. [Google Scholar] [CrossRef] [PubMed]
  57. Jégou, S.; Hoang, D.A.; Salmon, T.; Williams, P.; Oluwa, S.; Vrigneau, C.; Doco, T.; Marchal, R. Effect of Grape Juice Press Fractioning on Polysaccharide and Oligosaccharide Compositions of Pinot Meunier and Chardonnay Champagne Base Wines. Food Chem. 2017, 232, 49–59. [Google Scholar] [CrossRef]
  58. Márquez, K.; Contreras, D.; Salgado, P.; Mardones, C. Production of Hydroxyl Radicals and Their Relationship with Phenolic Compounds in White Wines. Food Chem. 2019, 271, 80–86. [Google Scholar] [CrossRef]
  59. Khan, N.; Ali, S.; Zandi, P.; Mehmood, A.; Ullah, S.; Ikram, M.; Ismail, I.; Shahid, M.A.; Babar, M.A. Role of Sugars, Amino Acids and Organic Acids in Improving Plant Abiotic Stress Tolerance. Pak. J. Bot. 2020, 52, 355–363. [Google Scholar] [CrossRef]
  60. Apolinar-Valiente, R.; Williams, P.; Doco, T. Recent Advances in the Knowledge of Wine Oligosaccharides. Food Chem. 2021, 342, 128330. [Google Scholar] [CrossRef]
  61. Apolinar-Valiente, R.; Williams, P.; Mazerolles, G.; Romero-Cascales, I.; Gómez-Plaza, E.; López-Roca, J.M.; Ros-García, J.M.; Doco, T. Effect of Enzyme Additions on the Oligosaccharide Composition of Monastrell Red Wines from Four Different Wine-Growing Origins in Spain. Food Chem. 2014, 156, 151–159. [Google Scholar] [CrossRef]
  62. Bambina, P.; Spinella, A.; Lo Papa, G.; Chillura Martino, D.F.; Lo Meo, P.; Cinquanta, L.; Conte, P. 1H-NMR Spectroscopy Coupled with Chemometrics to Classify Wines According to Different Grape Varieties and Different Terroirs. Agriculture 2024, 14, 749. [Google Scholar] [CrossRef]
  63. Papotti, G.; Bertelli, D.; Graziosi, R.; Silvestri, M.; Bertacchini, L.; Durante, C.; Plessi, M. Application of One- and Two-Dimensional NMR Spectroscopy for the Characterization of Protected Designation of Origin Lambrusco Wines of Modena. J. Agric. Food Chem. 2013, 61, 1741–1746. [Google Scholar] [CrossRef]
  64. Gougeon, L.; Da Costa, G.; Guyon, F.; Richard, T. 1H NMR Metabolomics Applied to Bordeaux Red Wines. Food Chem. 2019, 301, 125257. [Google Scholar] [CrossRef]
  65. Bambina, P.; Spinella, A.; Lo Papa, G.; Chillura Martino, D.F.; Lo Meo, P.; Corona, O.; Cinquanta, L.; Conte, P. 1H NMR-Based Metabolomics to Assess the Impact of Soil Type on the Chemical Composition of Nero d’Avola Red Wines. J. Agric. Food Chem. 2023, 71, 5823–5835. [Google Scholar] [CrossRef]
  66. Duley, G. The Impact of Temperature on “Pinot Noir” Berry and Wine Quality in a Steeply Sloping Cool Climate Vineyard in South Australia. VITIS-J. Grapevine Res. 2021, 60, 169–178. [Google Scholar] [CrossRef]
  67. Gougeon, L.; Da Costa, G.; Le Mao, I.; Ma, W.; Teissedre, P.-L.; Guyon, F.; Richard, T. Wine Analysis and Authenticity Using 1H-NMR Metabolomics Data: Application to Chinese Wines. Food Anal. Methods 2018, 11, 3425–3434. [Google Scholar] [CrossRef]
  68. Son, H.-S.; Hwang, G.-S.; Park, W.-M.; Hong, Y.-S.; Lee, C.-H. Metabolomic Characterization of Malolactic Fermentation and Fermentative Behaviors of Wine Yeasts in Grape Wine. J. Agric. Food Chem. 2009, 57, 4801–4809. [Google Scholar] [CrossRef] [PubMed]
  69. Viggiani, L.; Morelli, M.A.C. Characterization of Wines by Nuclear Magnetic Resonance: A Work Study on Wines from the Basilicata Region in Italy. J. Agric. Food Chem. 2008, 56, 8273–8279. [Google Scholar] [CrossRef]
  70. Nyitrainé Sárdy, Á.D.; Ladányi, M.; Varga, Z.; Szövényi, Á.P.; Matolcsi, R. The Effect of Grapevine Variety and Wine Region on the Primer Parameters of Wine Based on 1H NMR-Spectroscopy and Machine Learning Methods. Diversity 2022, 14, 74. [Google Scholar] [CrossRef]
  71. Alves Filho, E.G.; Silva, L.M.A.; Ribeiro, P.R.V.; De Brito, E.S.; Zocolo, G.J.; Souza-Leão, P.C.; Marques, A.T.B.; Quintela, A.L.; Larsen, F.H.; Canuto, K.M. 1H NMR and LC-MS-Based Metabolomic Approach for Evaluation of the Seasonality and Viticultural Practices in Wines from São Francisco River Valley, a Brazilian Semi-Arid Region. Food Chem. 2019, 289, 558–567. [Google Scholar] [CrossRef]
  72. Geana, E.I.; Popescu, R.; Costinel, D.; Dinca, O.R.; Ionete, R.E.; Stefanescu, I.; Artem, V.; Bala, C. Classification of Red Wines Using Suitable Markers Coupled with Multivariate Statistic Analysis. Food Chem. 2016, 192, 1015–1024. [Google Scholar] [CrossRef]
  73. Ali, K.; Maltese, F.; Toepfer, R.; Choi, Y.H.; Verpoorte, R. Metabolic Characterization of Palatinate German White Wines According to Sensory Attributes, Varieties, and Vintages Using NMR Spectroscopy and Multivariate Data Analyses. J. Biomol. NMR 2011, 49, 255–266. [Google Scholar] [CrossRef]
  74. Le Mao, I.; Da Costa, G.; Richard, T. 1H-NMR Metabolomics for Wine Screening and Analysis. Oeno One 2023, 57, 15–31. [Google Scholar] [CrossRef]
  75. Duley, G.; Dujourdy, L.; Klein, S.; Werwein, A.; Spartz, C.; Gougeon, R.D.; Taylor, D.K. Regionality in Australian Pinot Noir Wines: A Study on the Use of NMR and ICP-MS on Commercial Wines. Food Chem. 2021, 340, 127906. [Google Scholar] [CrossRef]
  76. Mascellani, A.; Hoca, G.; Babisz, M.; Krska, P.; Kloucek, P.; Havlik, J. 1H NMR Chemometric Models for Classification of Czech Wine Type and Variety. Food Chem. 2021, 339, 127852. [Google Scholar] [CrossRef]
Figure 1. Typical 400 MHz 1H-NMR spectra from each sampled variety of wine (Sauvignon Blanc, Crâmpoșie, Fetească Regală, Chardonnay, Cabernet Sauvignon, Merlot, Fetească Neagră, and Negru de Drăgășani): (A) aliphatic and carbohydrate regions and (B) aromatic region.
Foods 13 03372 g001aFoods 13 03372 g001b
Figure 2. Distribution of wine compositional data (aliphatic compounds, carbohydrates, and aromatic compounds) for the selected varieties (Cabernet Sauvignon, Crâmpoșie, Negru de Drăgășani, and Sauvignon Blanc) across the (a) Spârleni, (b) Drăgășani, (c) Dobrușa, and (d) Sâmburești regions.
Foods 13 03372 g002
Figure 3. Distribution of isotope normalized values (δ13C, δ18O, D/HI, and D/HII), for the selected varieties (Cabernet Sauvignon, Crâmpoșie, Negru de Drăgășani, and Sauvignon Blanc)—the spread, median values, and any potential outliers are visualized.
Foods 13 03372 g003
Figure 4. PCA comparing analysis based on (A) metabolite content and (B) stable isotope ratios for the differentiation of wine samples according to the harvest year.
Foods 13 03372 g004
Figure 5. PCA comparing analysis based on (A) metabolite content and (B) stable isotope ratios for the differentiation of wine samples according to geographical origin.
Foods 13 03372 g005
Figure 6. PCA comparing analysis based on (A) metabolite content and (B) stable isotope ratios for the differentiation of wine samples according to grape variety.
Foods 13 03372 g006
Figure 7. Discrimination of wines’ geographical origin based on (A) metabolites and (B) stable isotope ratios.
Foods 13 03372 g007
Figure 8. Discrimination of wines’ harvest year based on (A) metabolites and (B) stable isotope ratios.
Foods 13 03372 g008
Figure 9. Discrimination of grape variety based on (A) metabolites and (B) stable isotope ratios.
Foods 13 03372 g009
Table 1. The wine samples considered for this study.
Crt. No.Grape VarietyLabel Quality IndicatorTypeColourSiteVintage
1Cabernet SauvignonPDODryredDobrușa2019
2Negru de DrăgășaniPDODryred2020
3Cabernet SauvignonPDODryred2021
4Sauvignon BlancPDOSemi-Drywhite2021
5CrâmpoșiePDODrywhite2021
6Sauvignon BlancPDOSemi-Drywhite2022
7CrâmpoșiePDODrywhite2022
8Sauvignon BlancPDOSemi-DrywhiteDrăgășani2022
9Negru de DrăgășaniPDODryred2020
10Cabernet SauvignonPDODryred2019
11CrâmpoșiePDODrywhite2021
12Sauvignon BlancPDOSemi-Drywhite2021
13Negru de DrăgășaniPDODryred2019
14CrâmpoșiePDODrywhite2019
15Fetească Regală PDODrywhite2019
16Fetească Regală PDODrywhite2020
17Sauvignon BlancPDOSemi-Drywhite2020
18Cabernet SauvignonPDODryred2021
19Merlot PDOSemi-DryredSâmburești2020
20Fetească NeagrăPDODryred2020
21Sauvignon BlancPDOSemi-Drywhite2020
22Cabernet SauvignonPDODryred2020
23Cabernet SauvignonPDODryred2021
24Sauvignon BlancPDOSemi-Drywhite2021
25Fetească NeagrăPDODryred2021
26MerlotPDOSemi-Dryred2021
27MerlotPDOSemi-Dryred2021
28Cabernet SauvignonPDODryred2021
29Cabernet SauvignonPDODryred2021
30Sauvignon BlancPDOSemi-DrywhiteSpârleni2019
31ChardonnayPDODrywhite2019
32Negru de DrăgășaniPDODryred2019
33CrâmpoșiePDODrywhite2020
34ChardonnayPDODrywhite2020
35Negru de DrăgășaniPDODryred2020
36Cabernet SauvignonPDODryred2020
37Fetească NeagrăPDODryred2020
38Cabernet SauvignonPDODryred2021
39CrâmpoșiePDODrywhite2021
40Sauvignon BlancPDOSemi-Drywhite2021
Table 2. The chemical shifts and the multiplicity of the signals 1H-NMR appropriate to quantified metabolites.
Crt. No.MetaboliteAbbreviationChemical Shift [ppm]Multiplicity
12,3-ButanediolBd1.132d
2Lactic acidLA1.407d
3AlanineAla1.467d
41-PropanolPrOH1.540m
5isoPentanoliPentOH1.652m
6isoButanoliBuOH1.729m
7Sorbic acidSorbA1.841d
8Acetic acidAcA2.082s
9AcetoinAcet2.215s
10GABAGABA2.269t
11ProlinePro2.352m
12Succinic acidSA2.653s
13Malic acidMalA2.895dd
14Citric acidCitA2.963d
15CholineCho3.189s
16MethanolMeOH3.350s
17GlycerolGlycOH3.549dd
18FructoseF3.980m
19myo-InositolmyoIn4.046t
20ArabinoseAra4.497d
21GlucoseG4.606 (β)d
5.214 (α)d
22GalactoseGal5.248d
23Galacturonic acidGalA5.313d
24SucroseSu5.430d
25Caftaric acidCaftA6.422d
26Fumaric acidFumA6.628s
27Shikimic acidShA6.807m
28TyrosineTyr6.840d
29Formic acidFoA8.278s
30TrigonellineTri9.142s
Signal multiplicity: s—singlet; d—doublet; dd—doublet of doublets; t—triplet; m—multiplet.
Table 3. Metabolite concentration mean in wines obtained from different grape varieties.
BdLAAlaPrOHiPentOHiBuOHSorbAAcAAcetGABAProSAChoMeOHFumA
Merlot826.1 a619.7 bc39.9 a42.5 a205.3 a88.6 a179.1 a303 abc16.4 a11.7 ab718.3 a1035.9 a32.8 a191.6 a1.5 a
Fetească Neagra810.6 a923.8 ab33.6 a53.4 a135.7 a60.6 ab134.9 a683.5 a7.2 bc9.5 ab324.2 b809.7 a29.5 ab184.5 a2.0 a
Negru de Drăgășani664.6 ab1300 a42.4 a65.8 a256.8 a83.8 a83.6 a615.7 ab8.4 b9.1 ab559.3 a1045.3 a35.8 a161.7 ab0.6 a
Cabernet Sauvignon495.1bc788.5 b33.3 a56.7 a241.7 a65.2 ab74.0 a400 abc10.9 ab12.6 a597.4 a978.1 a34.8 a139.2 b1.1 a
Feteasca Regala548.0 bc74.2 c52.8 a46.9 a233.0 a35.9 b176.7 a165.1 c1.2 c8.3 ab177.1 b849.7 a17.8 bc26.2 c2.1 a
Sauvignon Blanc465.6 bc198.3 c46.9 a41.0 a202.1 a41.8 b79.7 a241.5 bc0.9 c8.1 b184.2 b761.1 a14.7 c32.9 c1.1 a
Chardonnay428.0 c83.6 c47.7 a34.8 a157.6 a37.3 b43.8 a229.3 bc0.6 c6.0 b285.3 b647.5 a14.8 c45.0 c0.0 a
Crâmpoșie343.4 c209.4 c48.6 a37.1 a178.3 a29.6 b47.2 a187.5 bc0.4 c5.5 b199.4 b712.8 a16.2 c23.1 c1.4 a
FoAMalACitAGlycOHFmyoInAraβ-Gα-GGalGalASuCaftAShATyrTri
Merlot11.1 a0.0 c0.0 c11,579ab219.2 a295 bcd181.1 ab1083 ab278.5 a48.8 ab473.4 a55.7 a98.1 ab16.0 a55.6 abc16.9 ab
Fetească Neagra11.3 a0.0 c0.0 c12,134 a893.8 a351 abc129.1 bc566.4 ab221.3 a53.2 a480.5 a35.1 a147.5 a45.1 a67.9 a19.2 a
Negru de Drăgășani16.3 a0.0 c0.0 c11,248 abc323.5 a430.3 ab107.7 bc301.6 b103.9 a41.5 ab396.3 a63.5 a135.7 a52.1 a61.3 ab14.3 ab
Cabernet Sauvignon12.3 a433.3 bc85.2 c10,707 abc509.1 a494.1 a71.8 cd538.9 b161.1 a34.6 bc284.3 b30.2 a94.1 ab111.8 a59.1 ab16.2 ab
Feteasca Regala16.8 a1445 ab1036.0 a9450 abc681.0 a160.5 cd296.3 a1404 ab66.0 a10.0 d45.4 c33.8 a92.2 ab17.5 a39 abcd13.3 ab
Sauvignon Blanc10.6 a1478 ab596.7 b8566 abc757.0 a227.1 cd42.3 cd1501.3 a314.3 a16.5 d86.6 c28.8 a55.2 b7.1 a24.7 d10.3
Chardonny13.2 a2181.6a407.0 bc8130 bc651.5 a297 bcd99.3 bcd699.4 ab208.5 a22.0 cd126.3 c22.7 a23.5 b28.1 a31.7 bcd18.8 a
Crâmpoșie10.3 a1301 ab432.7 b7788 c826.0 a160.1 d18.8 d831.5 ab267.2 a15.0 d57.0 c21.9 a121.1 a26.1 a27.1 cd9.8 b
Table 4. Metabolite concentration mean in wines with different vintage.
BdLAAlaPrOHiPentOHiBuOHSorbAAcAAcetGABAProSAChoMeOHFumA
2019512.2 a616.2 a39.3 b58.6 a222.9 a61.9 a52.3 a374.2 a3.5 a6.5 a343.7 a838.6 a25.7 a91.8 a0.5 ab
2020577.2 a678.8 a43.2 b44.8 a196.8 a57.7 a123.4 a423.7 a6.8 a9.8 a416.2 a913.5 a24.8 a106.0 a0.8 ab
2021496.2 a429.6 a37.4 b47.1 a206.5 a49.6 a71.3 a274.9 a6.2 a9.5 a381.6 a771.1 a24.6 a93.7 a2.4 a
2022507.0 a279.3 a71.1 a40.1 a226.9 a37.1 a88.7 a316.8 a1.1 a11.0 a214.8 a1022.2 a20.1 a36.2 a0.0 b
FoAMalACitAGlycOHFmyoInAraβ-Gα-GGalGalASuCaftAShATyrTri
201914.9 a997.6 ab380.9 a9412.6 a444.6 a393.2 a82.2 a668.3 a162.5 a27.6 a185.5 a60.1 a87.9 a23.6 a50.9 a11.9 a
202011.5 ab383.2 b266.1 a10,645 a866.3 a290.9 a114.3 a667.7 a182.3 a31.4 a269.3 a30.7 b106.4 a44.1 a49.8 a16.0 a
202111.2 b1015 ab218.7 a9018.8 a418.3 a312.3 a61.1 a1188.5 a288.3 a29.2 a223.2 a24.0 b90.0 a64.0 a37.7 a12.3 a
202213.8 ab1891.8 a728.7 a9837.2 a996.2 a226.7 a69.9 a972.5 a198.3 a12.3 a74.8 a30.4 b89.6 a14.1 a25.8 a15.3 a
Table 5. Metabolite concentration mean in wines obtained from different areas.
BdLAAlaPrOHiPentOHiBuOHSorbAAcAAcetGABAProSAChoMeOHFumA
Sâmburești589.6 a544.0 a36.0 a42.8 a159.4 b55.2 a155.5 a258.4 a8.6 a9.6 a486.4 a719.1 a25.3 a133.1 a2.2 a
Spârleni561.3 a618.7 a42.9 a50.0 a219.2 ab53.2 a57.3 b429.9 a4.1 a9.5 a308.5 a884.4 a25.1 a100.9 a0.7 a
Drăgășani485.8 a496.9 a43.4 a48.8 a259.3 a62.8 a120.4 a366.4 a3.8 a8.4 a353.3 a967.7 a24.9 a77.2 a0.3 a
Dobrușa476.6 a507.5 a48.1 a50.4 a166.6 b40.3 a2.2 b314.0 a6.0 a8.5 a370.5 a792.5 a22.0 a59.0 a2.1 a
FoAMalACitAGlycOHFmyoInAraβ-Gα-GGalGalASuCaftAShATyrTri
Sâmburești10.2 a467 a92.8 b941 a266 b341 a110 a108 ab279 a40.9 a330 a33.2 ab77.5 a37.3 a48.4 a15.1 a
Spârleni12.0 a1039 a206.6 b10,328 a948.3 a310.8 a71.0 a438.0 b267.5 a30.5 ab2725 ab24.5 b123.7 a78.0 a46.1 a14.7 a
Drăgășani13.5 a824.7 a587.4 a10,150 a790 ab291 a111.2 a923 ab146.4 a19.2 b150.5 b48.1 a88.9 a32.0 a47.2 a12.4 a
Dobrușa13.0 a1085 a294 ab8548 a286 ab330.8 a37.0 a1255 a175.4 a24.2 ab118.1 b30.7 ab80.7 a17.9 a29.5 a12.7 a
Disclaimer/Publisher’s Note: The statements, opinions and data contained in all publications are solely those of the individual author(s) and contributor(s) and not of MDPI and/or the editor(s). MDPI and/or the editor(s) disclaim responsibility for any injury to people or property resulting from any ideas, methods, instructions or products referred to in the content.

