Article

The Use of Fluorescence Spectrometry Combined with Statistical Tools to Determine the Botanical Origin of Honeys

by
Aleksandra Wilczyńska
* and
Natalia Żak
Department of Quality Management, Gdynia Maritime University, ul. Morska 81-87, 81-225 Gdynia, Poland
*
Author to whom correspondence should be addressed.
Foods 2024, 13(20), 3303; https://doi.org/10.3390/foods13203303
Submission received: 29 August 2024 / Revised: 30 September 2024 / Accepted: 15 October 2024 / Published: 18 October 2024
(This article belongs to the Special Issue Quality Evaluation of Bee Products—Volume II)

Abstract

:
At a time when the botanical origin of honey is being increasingly falsified, there is a need to find a quick, cheap and simple method of identifying its origin. Therefore, the aim of our work was to show that fluorescence spectrometry, together with statistical analysis, can be such a method. In total, 108 representative samples with 10 different botanic origins (9 unifloral and 1 multifloral), obtained in 2020–2022 from local apiaries, were analyzed. The fluorescence spectra of those samples were determined using a F-7000 Hitachi fluorescence spectrophotometer, Tokyo, Japan. It is shown that each honey variety produces a unique emission spectrum, which allows for the determination of its botanical origin. Taking into account the difficulties in analyzing these spectra, it was found that the most information regarding botanical differences and their identification is provided by synchronous cross-sections of these spectra obtained at Δλ = 100 nm. In addition, this analysis was supported by discriminant and canonical analysis, which allowed for the creation of mathematical models, allowing for the correct classification of each type of honey (except dandelion) with an accuracy of over 80%. The application of the method is universal (in accordance with the methodology described in this paper), but its use requires the creation of fluorescence spectral matrices (EEG) characteristic of a given geographical and botanical origin.

1. Introduction

According to its definition, honey is a product produced by honeybees, Apis mellifera, from nectar or honeydew and occupies a special place in the human diet [1]. Its role in human nutrition is due to its rich taste and nutritional effects on the human body. The health-promoting properties of honey are closely related to its chemical composition, which depends mainly on the botanical origin of the honey (honey variety) [2,3]. Honey comes in many different varieties, depending on the source of the nectar honey (nectar and honeydew honey), the botanical origin and the geographical location [3]. The classification of nectar honey into a given variety depends on the plant pollen that is dominant. For example, in Central Europe, the most common varieties of honey are rapeseed, lime, dandelion, goldenrod, buckwheat and honeydew (from honeydew from deciduous and coniferous trees), as well as less common ones, such as phacelia, raspberry and clover. In other geographical zones, eucalyptus, chestnut, rose, lavender, orange and other honeys characteristic of the vegetation occurring in a given geographical zone are found. Honey in which no pollen predominates is classified as multifloral. Each of these honeys, depending on the variety, production method and origin, will have different properties.
The specific taste and health-promoting properties of honey contribute to its high price. The desire to increase profits encourages producers or traders to adulterate honey. Adulteration is carried out, for example, by mixing honeys of different varieties, mislabeling them, adding sugar syrups, repeatedly heating honeys, and other processes used intentionally by producers [4]. However, recently, the most frequent fraud has been the mislabeling of the botanical origin of honeys [5]. In order to verify the quality of honeys and confirm their authenticity, a number of research methods are used. Mandatory methods for assessing the quality of honeys are usually described in legal acts. In Poland, this is the Regulation of the Minister of Agriculture and Rural Development, from 29 May 2015, amending the regulation on detailed requirements for the commercial quality of honey (Journal of Laws 2015, item 850). The only method recommended in legal acts to determine the botanical origin of honeys is pollen analysis. However, both in Poland and around the world, other, non-standard methods for assessing honey quality parameters are used, which can be used to determine not only the elementary chemical composition of individual honeys, but also the biological activity of honeys and their components [5,6,7,8,9,10,11,12]. As a result of the analysis of the literature on the assessment of the quality and authenticity of honeys, it was found that it is impossible to indicate repeatable, characteristic parameters, the value of which would allow for the unambiguous determination of the affiliation of a given sample of a specific honey variety. Various methods that have been used so far require not only financial outlays and time, but also confirmation of the accuracy of their result with alternative measurements. In many countries, compounds characteristic of a specific honey variety are sought, or the chemical profiles of a specific class of natural products are created (so-called “fingerprints” of individual honey varieties), but the results of these works are still unsatisfactory [4,5,12,13,14,15]. It can therefore be assumed that taking action to develop a reliable, fast and cheap method of assessing the quality and authenticity of honey will also allow for the detection and prevention of adulterated or lower-quality honey being introduced into circulation.
The use of excitation–emission matrices (EEMs) is one of two commonly used methods for measuring fluorescence spectra in the field of food safety and quality [16,17].
Although fluorescence spectroscopy techniques are widely used in the field of food quality and safety, they still have some limitations [18]. For example, Ruof et al. have been conducting research on the use of fluorescence-based methods for assessing the quality and identification of honey varieties for many years [19,20,21].
This study focused on refining the method and measurement conditions, as well as statistical tools for data analysis. The assumed effect of this study is a methodology, the application of which is to be a universal tool used on a wider scale. Creating fluorescence spectral matrices for honeys of various botanical origins will streamline the identification process, reduce the measurement time, and above all reduce the amount of reagents used and the costs incurred. Additionally, these tests are non-destructive with a high level of precision, sensitivity and repeatability of measurement performance. The preparation of the sample for testing does not require major expenditures. Therefore, the methodology can also be implemented to assess the quality of other parameters, such as the degree of filtration, honey aging, its overheating or its storage in improper conditions [22,23,24].
Therefore, the aim of our work was to demonstrate that fluorescence spectrometry can be such a method. Fluorescence is one of the physical techniques that is widely used for food authentication. Fluorescence spectra and images may both be considered unique sample fingerprints. This analytical technique is non-destructive, rapid and sensitive, especially when combined with multivariate analysis tools such as principal component analysis, parallel factor analysis and factorial discriminant analysis [25,26]. Numerous studies indicate that it can be used to mark the authenticity of olive oils, other edible oils, wines, spices, fish products and other foods [27,28,29,30,31,32]. In recent years, there have been many reports about using spectroscopic techniques to analyze honey as an alternative to time-consuming conventional methods. Fluorescence spectroscopy was used, among others, to determine the quality and authenticity of honey, but also to detect various contaminants or adulterants [33,34,35,36,37,38,39]. However, many of these reports show that determining the botanical origin of honey based only on fluorescence spectra is impossible. Therefore, we decided to demonstrate that such identification is possible both on the basis of 3D and synchronous spectra, but above all on the basis of differences in the fluorescence intensity of honeys of different varieties in the entire emission band, at a specified Δλ = 100 nm.

2. Materials and Methods

In total, 108 honey samples of 10 different botanical origins (multifloral: 14, honeydew: 12, acacia: 8, honeydew coniferous: 8, nectar honeydew: 8, rape: 13, phacelia: 9, lime: 14, buckwheat: 13, dandelion: 10, heather: 9) were analyzed to evaluate their fluorescence spectra. The honeys, provided by a local beekeepers’ association from the Pomeranian province, were harvested in 2020–2022. Until the analyses were performed, the tested samples were stored in tightly closed individual packages—250 mL glass jars with a “Twist off” closure, at a temperature of 16 to 20 °C.
Fluorescence spectra were determined by a method patented by Gębala and Przybyłowski [40,41].
Excitation–emission matrices, EEMs, were acquired by a series of emission scans measured over a range of excitation wavelengths to create a fluorescence contour map.
The tests were performed using a set consisting of the following:
  • A Hitachi F-7000 fluorescence spectrophotometer, Tokyo, Japan;
  • A specially constructed adapter for measuring fluorescence intensity measured from the sample surface to change its traditional measurement range.
Figure 1 shows how the energy of the light beam reappears and re-emits at lower quanta after being reflected from the surface of the tested sample.
The sample surface is exposed to excitation radiation and the reflective geometry allows us to eliminate the effects of the internal filter associated with the high absorbance of the sample—the weakening of fluorescence intensity is due to the excitation absorbance and the emitted radial radiation.
Dimensional fluorescence spectra were measured at room temperature and in daylight. Honey samples were condensed (temp. 40 °C) and pipetted into 0.5 mL quartz cuvettes before measurement. Fluorescence spectra were obtained by recording emission spectra (from 220 to 560 nm with 10 nm steps) corresponding to excitation wavelengths in the range from 200 to 450 nm (with 5 nm steps) and automatically normalized to the excitation intensity of the instrument. The voltage used to determine the sensitivity of the excitation and emission measurements was equal to 600 V. The difference between the wavelength of fluorescent light (γF) and the wavelength of excitation light (γw) was preferentially 100 nm [40,41]. In order to reduce scattering effects and compare the honey samples studied, the fluorescence spectra were normalized by reducing the area under each spectrum to the value of 1 [22].
All analyses were performed in triplicate. The final results are presented as a set of numerical data in the form of contour maps (excitation emission (EEM)) and the synchronous cross-sections of these spectra were obtained at Δλ = 100 nm for honey samples.

Statistical Analysis

To determine the botanical origin on the shape of the spectra, a discriminant analysis was performed. The analysis was performed using the Statistica 13.3 multivariate discriminant analysis package.
This article uses discriminant analysis, which is a set of statistical methods for multidimensional data analysis. Its main goal is to decide which independent variables affect the classification of the described dependent variables. The classical discriminant analysis used in this study allows us to build a forecast model of group membership. This model is created on the basis of a discriminant function that provides the best distinction between groups. The sample of observations used to generate the function is known. It is an extremely effective tool used for classification issues and data exploration. Its advantage is a high level of effectiveness for homogeneous data, while its disadvantage is a lack of effectiveness on non-homogeneous data.
This analysis was aimed at confirming the hypothesis that the identification of honey varieties is possible based on fluorescence spectra. It was therefore checked whether the compared varieties differed in terms of the value of the mean fluorescence intensity within the entire emission band or in part of it at Δλ 60 nm, 80 nm and 100 nm. However, attempts to perform calculations at Δλ 60 nm and 80 nm did not produce results that provided statistically significant information. Then, appropriate canonical discriminant functions were constructed. Statistical hypotheses were verified at a significance level of p = 0.05.

3. Results

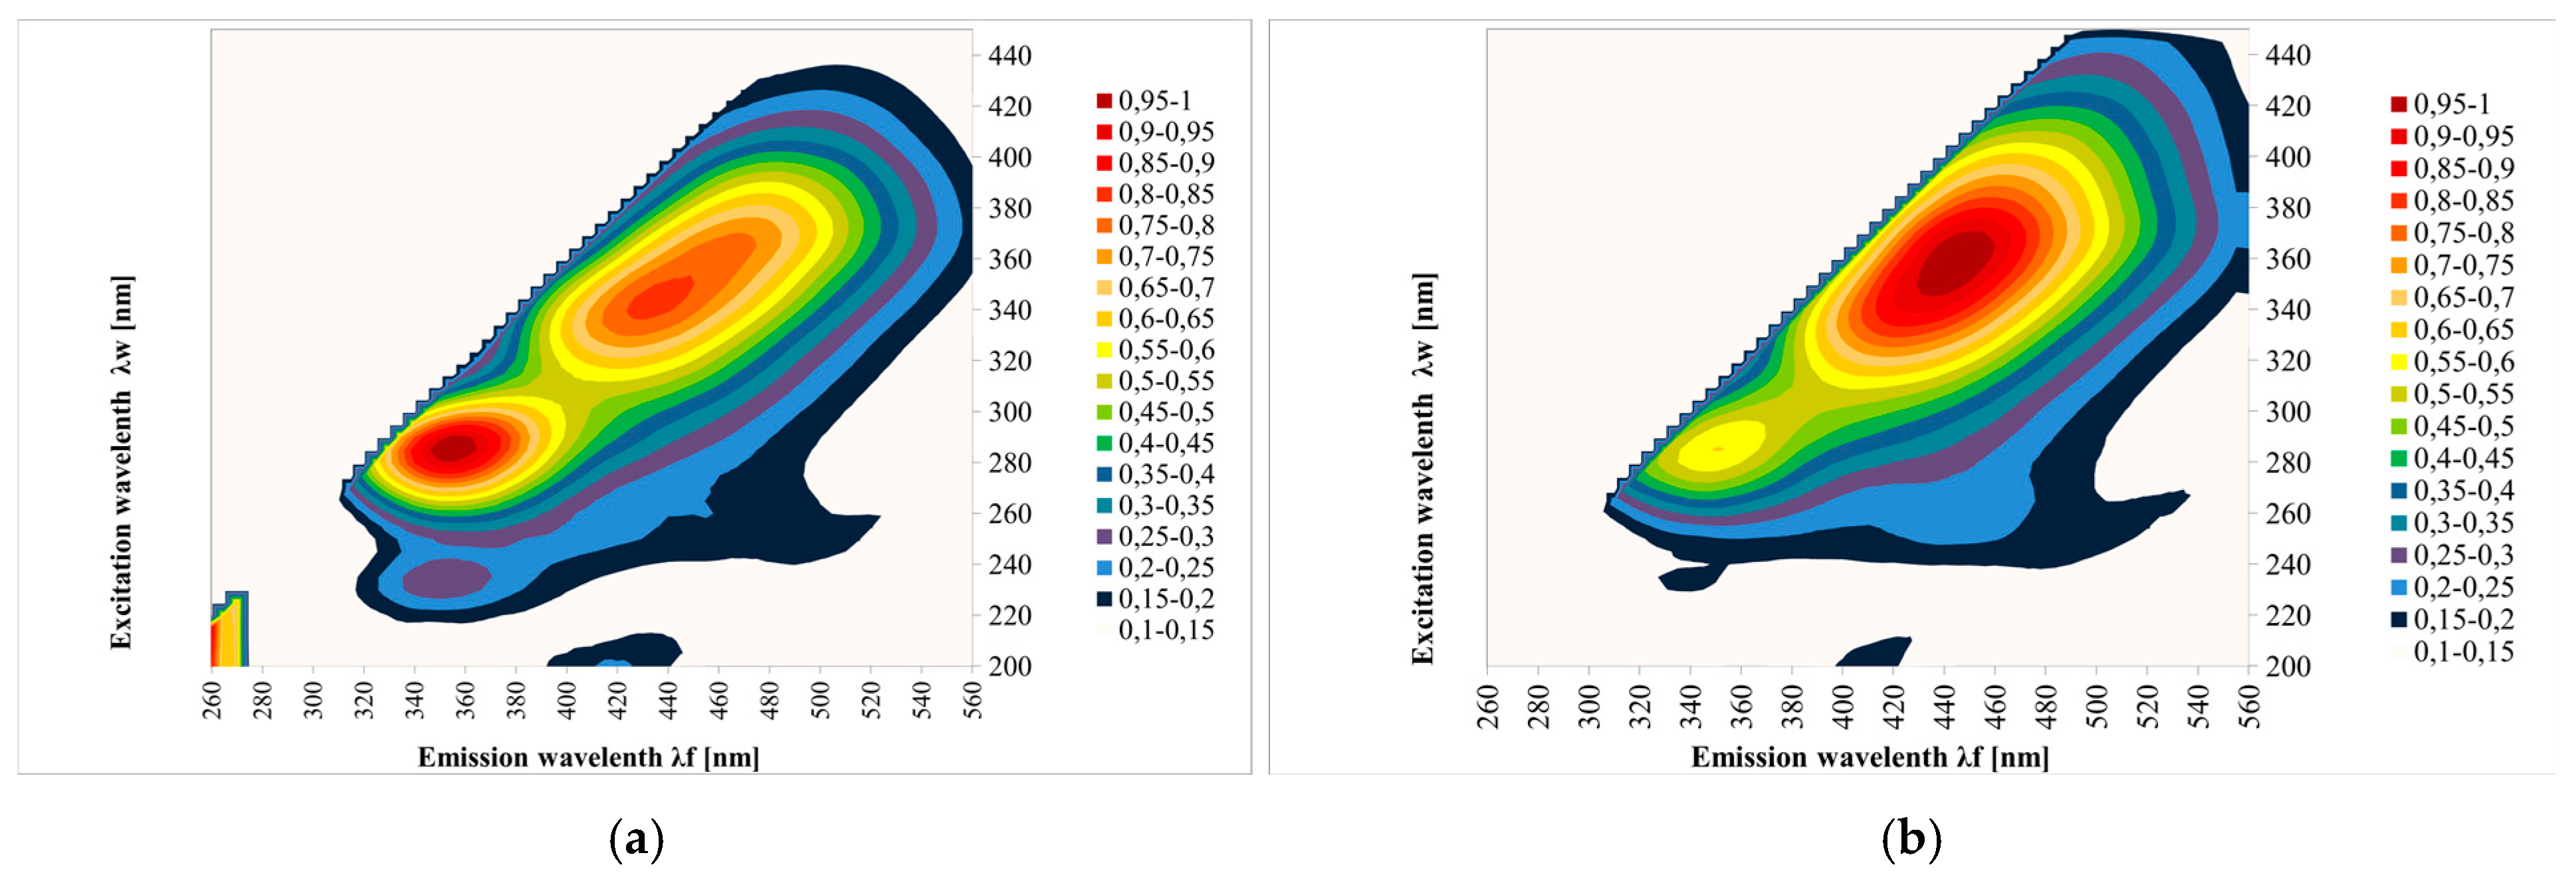
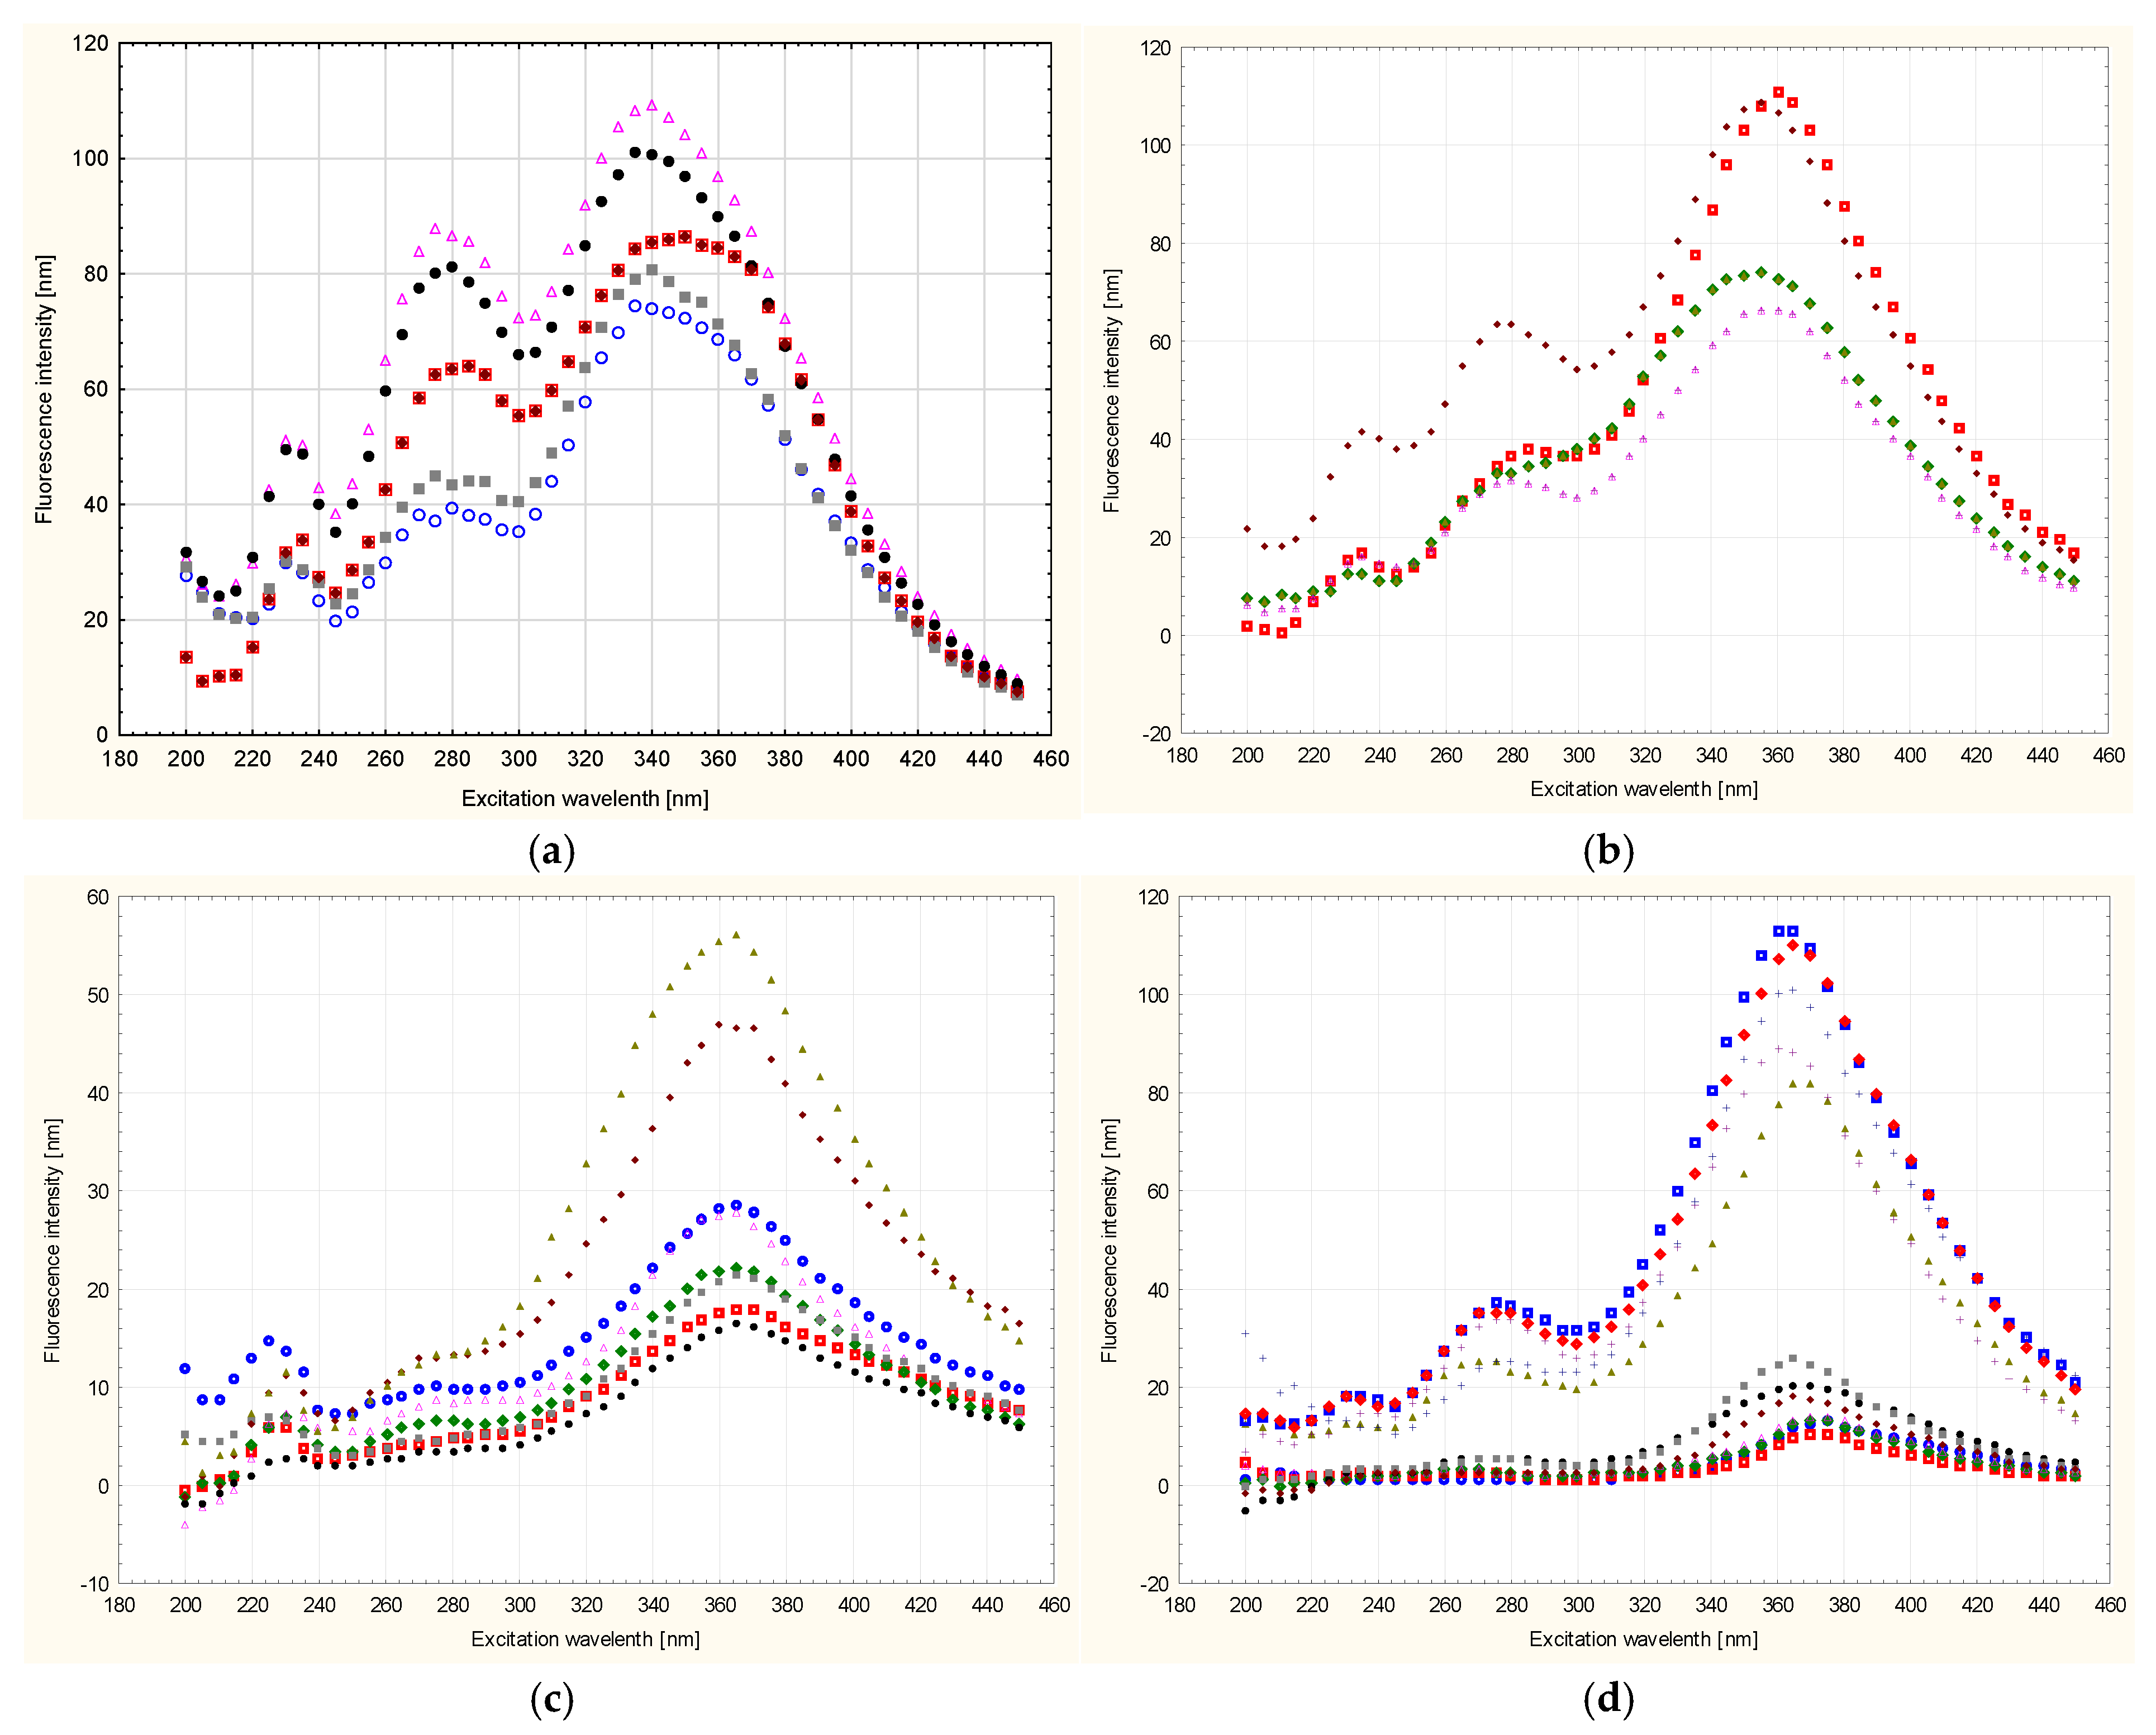
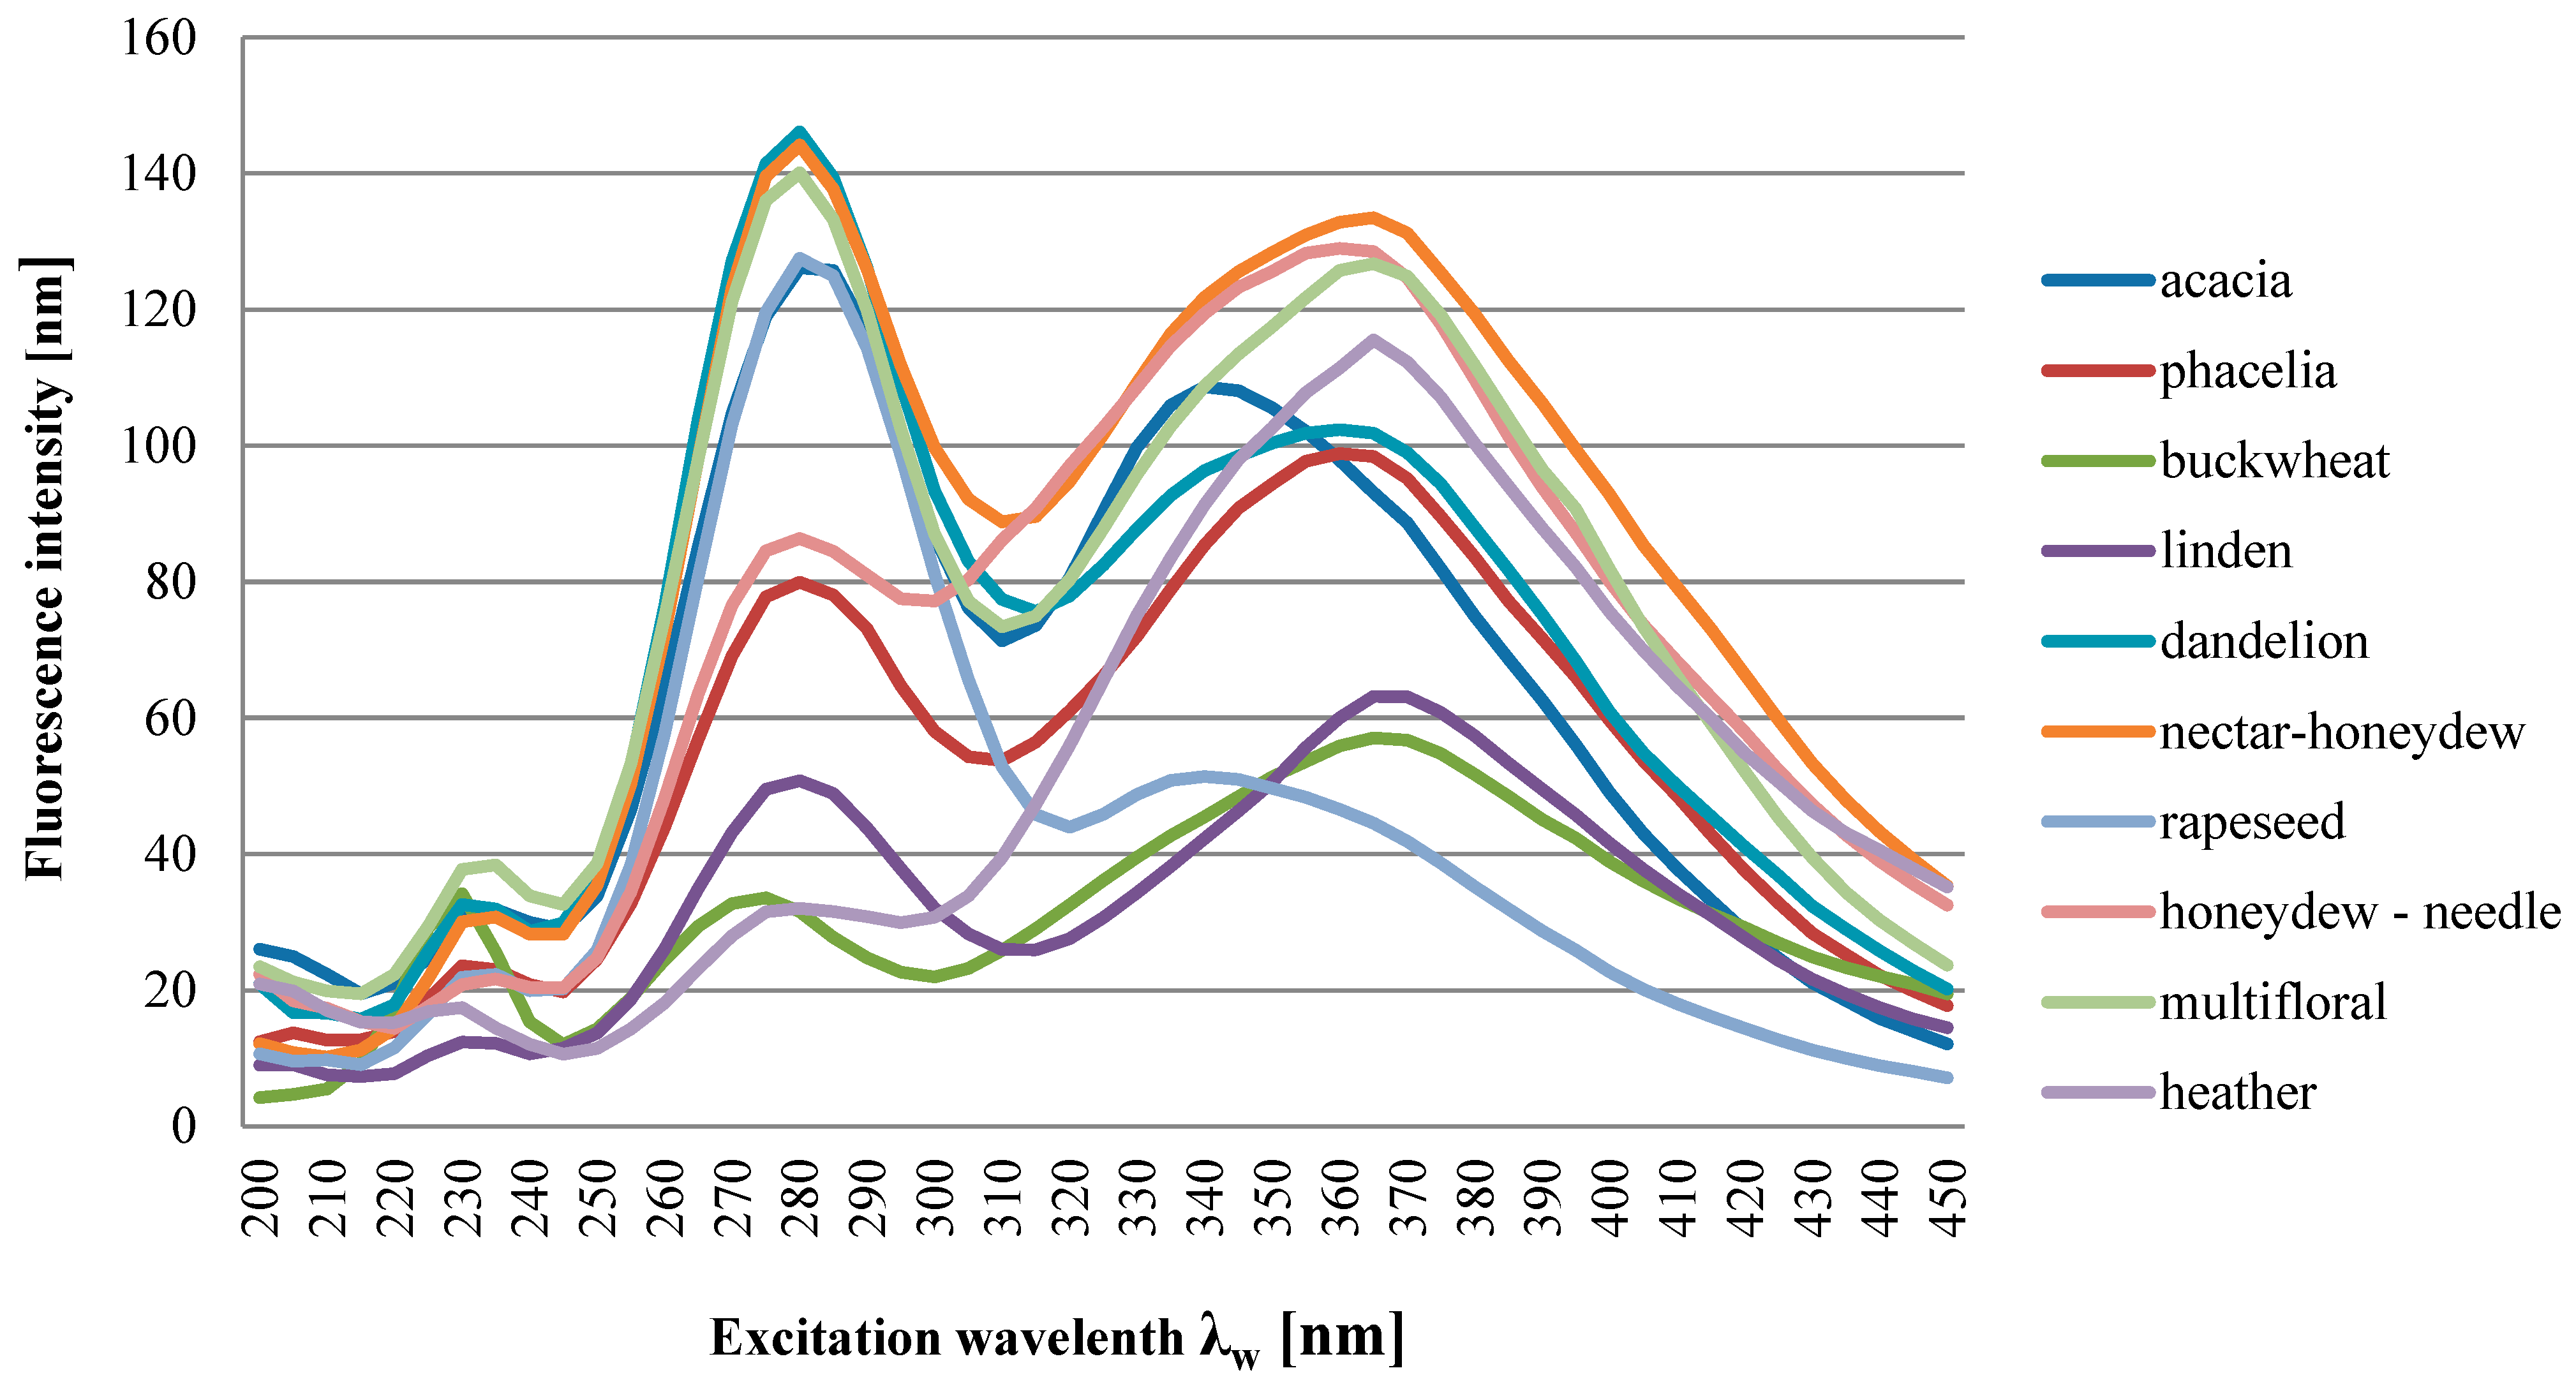
3.1. Analysis of Spectra

The emission spectra (excitation: 200–450 nm; emission: 260–560 nm) considered in this investigation allowed for the study of the fluorescence of the honey samples. The complete fluorescence spectra of different botanical origins of honey are characterized by a spectral region of high emission intensity, originating from fluorophores such as phenolic compounds and aromatic amino acids [26].
Figure 2 shows the EEM spectra measured for the tested honeys. The results show contour maps for 108 samples of different honey types: multifloral, acacia, honeydew coniferous, nectar honeydew, rape, phacelia, lime, buckwheat, dandelion and heather. The fluorescence measurement of the sample surface was performed three times.

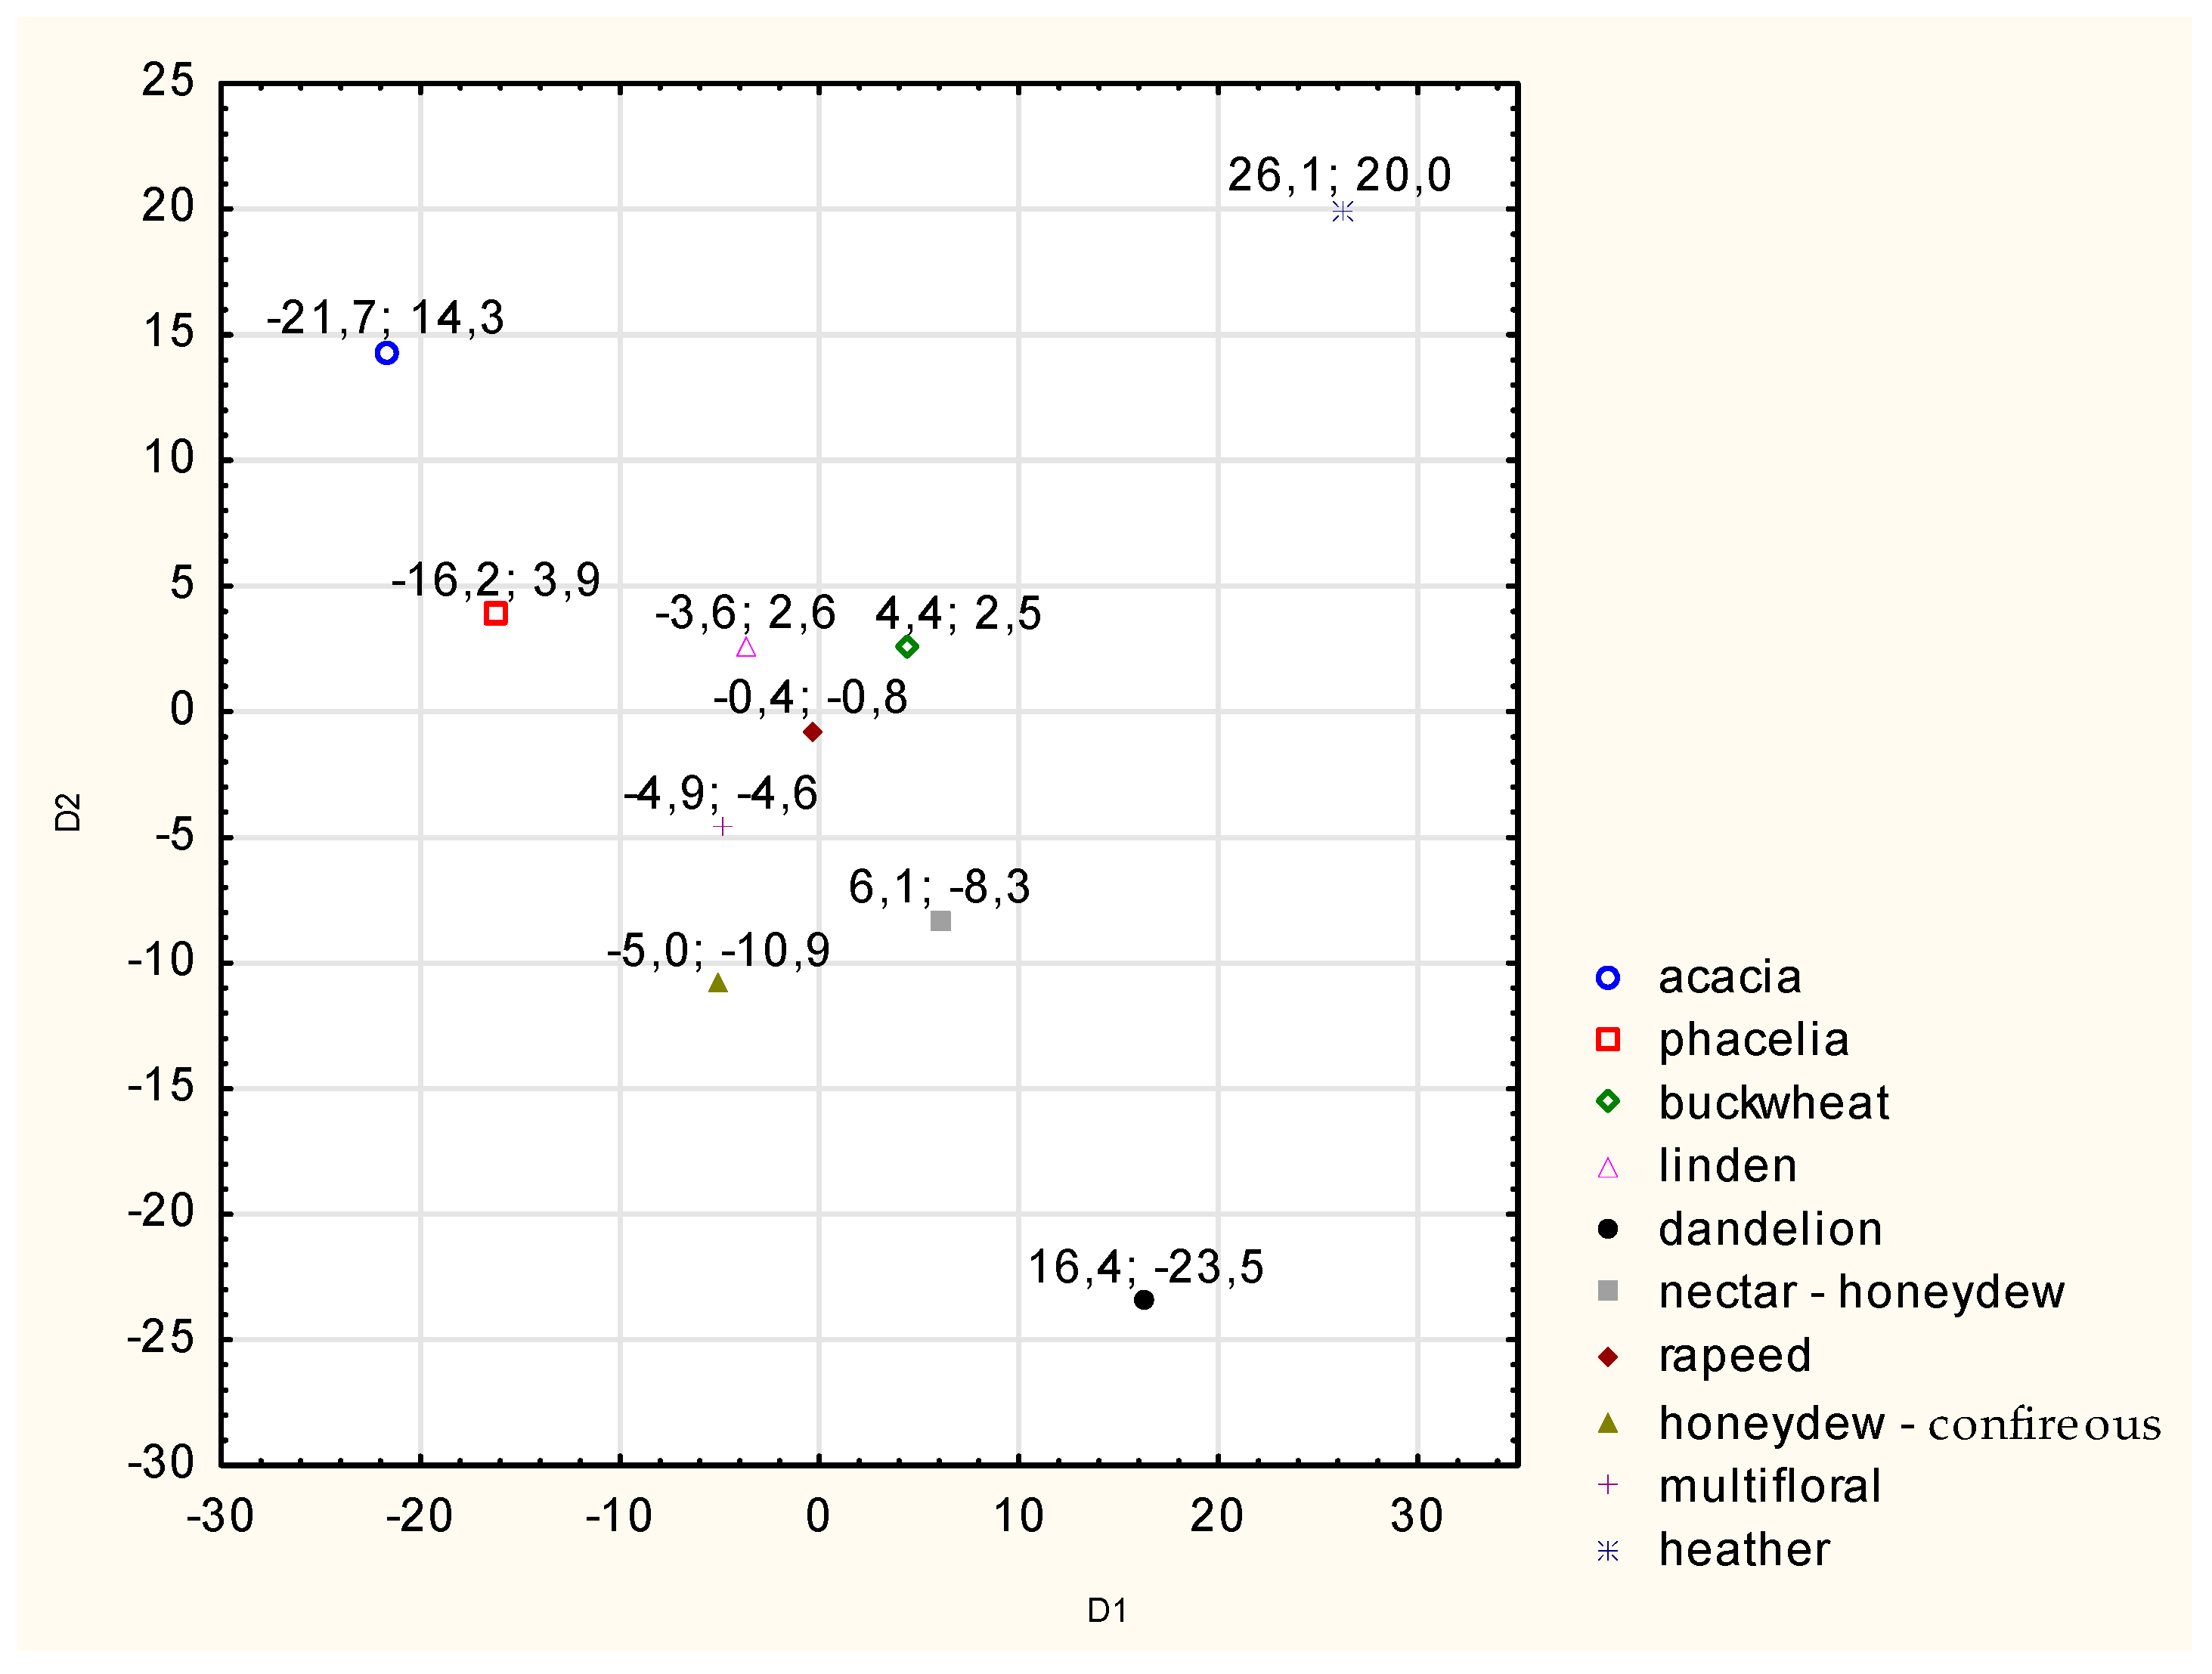
3.2. Discrimination of Honeys by Mathematical Method

In the next part, a discriminant analysis was performed to confirm the hypothesis that the identification of honey varieties is possible based on fluorescence spectra. It was therefore checked whether the compared varieties differ in terms of the value of the average fluorescence intensity within the entire emission band or in part of it at Δλ 100 nm. Then, appropriate canonical discriminant functions were constructed.
Based on the analysis of the constructed classification matrices, that the following was found:
-
The selection of any model covering only a part of the emission band does not allow us to obtain a 100% correct classification of all honey samples;
-
After introducing all of the measurement points of the emission band into the model, a 100% qualification of varietal honeys was obtained at Δλ 100 nm within the entire emission band (Table 1).
The parameters of the measurements of the excitation waves of honeys for Δλ = 100 nm of different botanical origins were different. This allowed for the discrimination of the studied population of honeys by variety, which was statistically confirmed by the Wilks lambda test (F = 3.91, p = 0.0000001), assuming a test probability value of p ≤ 0.05. This means that based on the measurement of the fluorescence intensity of honeys, their botanical identification was achieved in the case of 80.0% of the tested samples (the identification of dandelion honey may be difficult because it is located in the center of the coordinate system and close to three other varieties).
The main stage of the discriminant analysis was performed using the standard method. The canonical analysis performed next allowed for the calculation of raw coefficient values (F1 and F2) of the discriminant function for the first two roots and the construction of canonical discriminant functions.
The canonical analysis included also the calculation of the coefficients of canonical variables (D1 and D2) and their average values (Table 2).
The canonical analysis performed allowed for a graphical presentation of the results of the calculations of the canonical mean values (Figure 3). It illustrates the position of individual honey varieties in a two-coordinate system (canonical variables).
Table 3 shows the outline of the spreadsheet file that can be used to calculate the values of two canonical variates—D1 and D2.
Using the above model, it is possible to identify all ten honey varieties using fluorescence spectra for Δ = 100 nm. To do this, you should do the following:
  • Calculate the D1 and D2 values according to the scheme presented in Table 3;
  • Compare their values with the values given in Table 2, which contains the values of the mean canonical variables.
Based on the analysis carried out, taking into account the difficult identification and analysis of the spectra, it was found that the greatest essence of information concerning botanical differences and their identification is contained in the synchronous sections of these spectra obtained at Δλ = 100 nm, which are shown in Figure 4 and Figure 5. It can also be seen that the spectra of all tested honeys in a given variety group were characterized by the presence of emission bands of different intensities, but the same locations of the excitation wavelength Δλw for the maximum level of fluorescence intensity. Figure 4 shows the tested honeys, taking into account each of the tested samples in the variety group. Each sample was marked with a different marker in order to show the deviations of the fluorescence measurements in the variety group.
The spectra of all the honeys tested, depending on their botanical origin, were characterized by the presence of individual emission bands of different intensities. Additionally, the bands were distinguished by different locations of the excitation wavelength Δλw for the maximum level of fluorescence intensity at Δλ = 100 nm (Figure 5). It can be stated that in eight varieties, there were three excitations at different excitation wavelengths Δλw, which is also presented in more detail in Table 4. In the heather and honeydew–conifer varieties, there are two excitations at different excitation wavelengths Δλw, 235 nm and 360 nm for honeydew–conifer honeys and 370 nm for heather honeys. All the honey varieties tested had a visible tendency to increase the intensity of the shortwave emission excitation band at the level of 235 nm and 240 nm (phacelia). Another increase in intensity in the intermediate-range bands was found in eight varieties:
  • Emission excitation: 280 nm (honey: acacia, buckwheat, lime, rapeseed, multifloral);
  • Emission excitation: 285 nm (honey: phacelia, dandelion, nectar–honeydew).
The next increase in intensity in the bands in the long-wave spectral range (excitation of emission from 340 nm to 370 nm occurred in all ten varieties tested).
In our analysis, the synchronous spectrum of buckwheat and lime honey (Δλ = 100 nm) was characterized by a visible tendency to demonstrate three emission excitations, 235 nm, 280 nm and 370 nm, with different fluorescence emission intensities.

4. Discussion

It can be argued that the results of the use of fluorescence spectrometry in the form of total fluorescence spectra depend on the botanical origin of the honey, and this was confirmed by the studies presented by Ruoff et al. [19,20,21], Gębala [40], Gębala and Przybyłowski [41], Dramićanin et al. [39] and our former studies [22]. These authors also indicated small differences in fluorescence intensity in the tested group of varietal honeys. Gębala and Przybyłowski grouped the spectral features of Polish botanical honeys, taking into account the levels of excitation fluorescence intensity as indicators characteristic of varietal honeys found in Poland [40]. Pari et al. grouped samples of honeys of Italian origin into subsections of honeys of different botanical origins. The grouping was based on similar spectral features. The authors also point to the main components, the so-called fluorophores, which are responsible for the fluorescence emission of the honeys studied [33]. In 2014, Nikolova’s team attempted to compare the spectral characteristics of honeys adulterated by the addition of sweeteners. The results obtained indicated that the study of fluorescence spectra opens up the possibility of distinguishing honey samples with added artificial sweeteners from natural ones [42]. In our previous studies, we attempted to demonstrate that fluorescence spectra can be used to indicate the degree of overheating of honey [23]. We also obtained confirmation that honey filtration does not affect the classification of honey spectra of various botanical origins [22]. According to the study conducted by Dramićanin et al. [39], the differences in the fluorescence of natural and adulterated honey samples are extremely significant in five spectral regions due to the differences in the concentrations and local environments of aromatic amino acids, phenolic compounds, furosine and hydroxymethylfurfural. This was also confirmed by statistical tests and PCA. According to these authors, by quantifying the fluorescence responses and subjecting them to a statistical classification technique, for example, LDA, it is possible to detect adulterated honey with 100% accuracy. Such accuracy suggests that fluorescence excitation emission spectroscopy may be a promising method for low-level honey adulteration, which will be the subject of our future work.

5. Conclusions

In our study, 108 pure honey samples from 10 different botanical origins have been analyzed using fluorescence emission. We have shown that each honey variety is characterized by a unique total spectrum, enabling the classification of their botanical origin. However, taking into account the difficulties in analyzing these spectra, it was found that the most information regarding botanical differences and their identification is provided by synchronous cross-sections of these spectra obtained at Δλ = 100 nm. Additionally, discriminant analysis showed that it was possible to identify most of the tested honey varieties; the identification of dandelion honey will be problematic.

Author Contributions

Conceptualization, A.W. and N.Ż.; methodology, A.W. and N.Ż.; formal analysis, A.W. and N.Ż.; data curation, N.Ż.; writing—original draft preparation, N.Ż. and A.W.; writing—review and editing, A.W.; supervision, A.W. All authors have read and agreed to the published version of the manuscript.

Funding

The authors acknowledge the financial support of Gdynia Maritime University (projects: WZNJ/2024/PZ/01, WZNJ/2024/PI/01).

Data Availability Statement

The original contributions presented in the study are included in the article, further inquiries can be directed to the corresponding author.

Conflicts of Interest

The authors declare no conflict of interest.

References

  1. Directive2014/63/EU of the European Parliament and of the Council of 15 May 2014 amending Council Directive 2001/110/EC Relating to Honey. Available online: https://eur-lex.europa.eu/legal-content/EN/TXT/?uri=celex%3A32014L0063 (accessed on 14 October 2024).
  2. Escuredo, O.; Rodríguez-Flores, M.S.; Rojo-Martínez, S.; Seijo, M.C. Contribution to the Chromatic Characterization of Unifloral Honeys from Galicia (NW Spain). Foods 2019, 8, 233. [Google Scholar] [CrossRef]
  3. Bogdanov, S. Honey as Nutrient and Functional Food: A Review. Book of Honey (Chapter 8). Available online: https://freethebees.ch/wp-content/uploads/2020/06/HoneyNutrientFunctional.pdf (accessed on 14 October 2024).
  4. Biswas, A.; Chaudchari, S. Exploring the role of NIR spectroscopy in quantifying and verifying honey authenticity: A review. Food Chem. 2024, 445, 138712. [Google Scholar] [CrossRef]
  5. Quintanilla-López, J.E.; Lebrón-Aguilar, R.; Soria, A.C. Volatile fingerprinting by solid-phase microextraction mass spectrometry for rapid classification of honey botanical source. LWT 2022, 169, 114017. [Google Scholar] [CrossRef]
  6. Biswas, A.; Naresh, K.S.; Jaygadkar, S.S.; Chaudhari, S.R. Enabling honey quality and authenticity with NMR and LC-IRMS based platform. Food Chem. 2023, 416, 135825–135838. [Google Scholar] [CrossRef]
  7. Bodor, R.; Kovacs, Z.; Benedek, C.; Hitka, G.; Behling, H. Origin identification of hungarian honey using melissopalynology, physicochemical analysis, and near infrared spectroscopy. Molecules 2021, 26, 7274. [Google Scholar] [CrossRef]
  8. Da Silva, P.M.; Gauche, C.; Gonzaga, L.V.; Costa, A.C.O.; Fett, R. Honey: Chemical composition, stability and authenticity. Food Chem. 2016, 196, 309–323. [Google Scholar] [CrossRef]
  9. Dong, H.; Xiao, K.; Xian, Y.; Wu, Y. Authenticity determination of honeys with non-extractable proteins by means of elemental analyzer (EA) and liquid chromatography (LC) coupled to isotope ratio mass spectroscopy (IRMS). Food Chem. 2018, 240, 717–724. [Google Scholar] [CrossRef]
  10. Gan, Z.; Yang, Y.; Li, J.; Wen, X.; Zhu, M.; Jiang, Y.; Ni, Y. Using sensor and spectral analysis to classify botanical origin and determine adulteration of raw honey. J. Food Eng. 2016, 178, 151–158. [Google Scholar] [CrossRef]
  11. Machado, A.M.; Miguel, M.G.; Vilas-Boas, M.; Figueiredo, A.C. Honey Volatiles as a Fingerprint for Botanical Origin—A Review on their Occurrence on Monofloral Honeys. Molecules 2020, 25, 374. [Google Scholar] [CrossRef]
  12. Żak, N.; Wilczyńska, A. The Importance of Testing the Quality and Authenticity of Food Products: The Example of Honey. Foods 2023, 12, 3210. [Google Scholar] [CrossRef]
  13. Zhang, X.-H.; Gu, H.-W.; Liu, R.-J.; Qing, X.-D.; Nie, J.-F. A comprehensive review of the current trends and recent advancements on the authenticity of honey. Food Chem. 2023, 19, 100850. [Google Scholar] [CrossRef]
  14. Tsagkaris, A.S.; Koulis, G.A.; Danezis, G.P.; Martakos, I.; Dasenaki, M.; Georgiou, C.A.; Thomaidis, N.S. Honey authenticity: Analytical techniques, state of the art and challenges. RSC Adv. 2021, 11, 11273–11294. [Google Scholar] [CrossRef]
  15. Guzelmeric, E.; Ciftci, I.; Yuksel, P.I.; Yesilada, E. Importance of chromatographic and spectrophotometric methods in determining authenticity, classification and bioactivity of honey. LWT 2020, 132, 109921. [Google Scholar] [CrossRef]
  16. Antônio, D.C.; de Assis, D.C.S.; Botelho, B.G.; Sena, M.M. Detection of adulterations in a valuable Brazilian honey by using spectrofluorimetry and multiway classification. Food Chem. 2022, 370, 131064. [Google Scholar] [CrossRef]
  17. Rahman, M.M.; Bui, M.V.; Shibata, M.; Nakazawa, N.; Rithu, M.N.A.; Yamashita, H.; Sadayasu, K.; Tsuchiyama, K.; Nakauchi, S.; Hagiwara, T.; et al. Rapid noninvasive monitoring of freshness variation in frozen shrimp using multidimensional fluorescence imaging coupled with chemometrics. Talanta 2021, 224, 121871. [Google Scholar] [CrossRef]
  18. Gu, H.; Huang, X.; Chen, Q.; Sun, Y.; Lv, R. A feasibility study for rapid evaluation of emulsion oxidation using synchronous fluorescence spectroscopy coupled with chemometrics. Spectrochim. Acta Part A Mol. Biomol. Spectrosc. 2022, 265, 120337. [Google Scholar] [CrossRef]
  19. Ruoff, K.; Iglesias, M.T.; Luginbühl, W.; Bosset, J.O.; Bogdanov, S.; Amado, R. Quantitative analysis of physical and chemical measurands in honey by mid-infrared spectrometry. Eur. Food Res. Technol. 2005, 223, 22–29. [Google Scholar] [CrossRef]
  20. Ruoff, K.; Karoui, R.; Dufour, E.; Luginbühl, W.; Bosset, J.O.; Bogdanov, S.; Amadò, R. Authentication of the botanical origin of honey by front-face fluorescence spectroscopy, a preliminary study. J. Agric. Food Chem. 2005, 53, 1343–1347. [Google Scholar] [CrossRef]
  21. Ruoff, K.; Luginbühl, W.; Künzli, R.; Bogdanov, S.; Bosset, J.O.; von der Ohe, K.; von der Ohe, W.; Amadò, R. Authentication of the botanical and geographical origin of honey by front-face fluorescence spectroscopy. J. Agric. Food Chem. 2006, 54, 6858–6866. [Google Scholar] [CrossRef]
  22. Wilczyńska, A.; Żak, N. The Use of Fluorescence Spectrometry to Determine the Botanical Origin of Filtered Honeys. Molecules 2020, 25, 1350. [Google Scholar] [CrossRef]
  23. Żak, N.; Wilczyńska, A.; Przybyłowski, P. The use of fluorescence spectroscopy to assess the degree of overheating of honey. Folia Pomer. Univ. Technol. Stetin. Agric. Aliment. Pisc. Zootech. 2018, 340, 131–142. [Google Scholar] [CrossRef]
  24. Gu, H.; Hu, L.; Dong, Y.; Chen, Q.; Wei, Z.; Lv, R. Evolving trends in fluorescence spectroscopy techniques for food quality and safety: A review. J. Food Comp. Anal. 2024, 131, 106212. [Google Scholar] [CrossRef]
  25. Dankowska, A. Advances in Fluorescence Emission Spectroscopy for Food Authenticity Testing. In Woodhead Publishing Series in Food Science, Technology and Nutrition, Advances in Food Authenticity Testing; Gerard, D., Ed.; Woodhead Publishing: Sawston, UK, 2016; pp. 117–145. [Google Scholar] [CrossRef]
  26. Sikorska, E.; Khmelinskii, I.; Sikorski, M. Fluorescence spectroscopy and imaging instruments for food quality evaluation. In Woodhead Publishing Series in Food Science, Technology and Nutrition, Evaluation Technologies for Food Quality; Jian, Z., Xichang, W., Eds.; Woodhead Publishing: Sawston, UK, 2019; pp. 491–533. [Google Scholar] [CrossRef]
  27. Hassoun, A.; Sahar, A.; Lakhal, L.; Aït-Kaddour, A. Fluorescence spectroscopy as a rapid and non-destructive method for monitoring quality and authenticity of fish and meat products: Impact of different preservation conditions. LWT 2019, 103, 279–292. [Google Scholar] [CrossRef]
  28. Wu, Q.; Geng, T.; Yan, M.-L.; Peng, Z.-X.; Chen, Y.; Lv, Y.; Yin, X.-L.; Gu, H.-W. Geographical origin traceability and authenticity detection of Chinese red wines based on excitation-emission matrix fluorescence spectroscopy and chemometric methods. J. Food Comp. Anal. 2024, 125, 105763. [Google Scholar] [CrossRef]
  29. Durán Merás, I.; Domínguez Manzano, J.; Airado Rodríguez, D.; Muñoz de la Peña, A. Detection and quantification of extra virgin olive oil adulteration by means of autofluorescence excitation-emission profiles combined with multi-way classification. Talanta 2018, 178, 751–762. [Google Scholar] [CrossRef]
  30. Ríos-Reina, R.; Ocaña, J.A.; Azcarate, S.M.; Pérez-Bernal, J.L.; Villar-Navarro, M.; Callejón, R.M. Excitation-emission fluorescence as a tool to assess the presence of grape-must caramel in PDO wine vinegars. Food Chem. 2019, 287, 115–125. [Google Scholar] [CrossRef]
  31. Fang, H.; Wang, T.; Chen, L.; Wang, X.-Z.; Wu, H.-L.; Chen, Y.; Yu, R.-Q. Rapid authenticity identification of high-quality Wuyi Rock tea by multidimensional fluorescence spectroscopy coupled with chemometrics. J. Food Comp. Anal. 2024, 135, 106632. [Google Scholar] [CrossRef]
  32. Yuan, Y.-Y.; Wang, S.-T.; Wang, J.-Z.; Cheng, Q.; Wu, X.-J.; Kong, D.-M. Rapid detection of the authenticity and adulteration of sesame oil using excitation-emission matrix fluorescence and chemometric methods. Food Contr. 2020, 112, 107145. [Google Scholar] [CrossRef]
  33. Nikolova, K.; Eftimov, T.; Aladjadjiyan, A. Fluorescence Spectroscopy as Method for Quality Control of Honey. Adv. Res. 2014, 2, 95–108. [Google Scholar] [CrossRef]
  34. Hao, S.; Li, J.; Liu, X.; Yuan, J.; Yuan, W.; Tian, Y.; Xuan, H. Authentication of acacia honey using fluorescence spectroscopy. Food Contr. 2021, 130, 108327. [Google Scholar] [CrossRef]
  35. Chen, Q.; Qi, S.; Li, H.; Han, X.; Ouyang, Q.; Zhao, Q. Determination of rice syrup adulterant concentration in honey using three-dimensional fluorescence spectra and multivariate calibrations. Spectrochim. Acta Part A Mol. Biomol. Spectrosc. 2014, 131, 177–182. [Google Scholar] [CrossRef]
  36. Santana, J.E.G.; Coutinho, H.D.M.; da Costa, J.G.M.; Menezes, J.M.C.; Pereira Teixeira, R.N. Fluorescent characteristics of bee honey constituents: A brief review. Food Chem. 2021, 362, 130174. [Google Scholar] [CrossRef]
  37. Lastra-Mejías, M.; Torreblanca-Zanca, A.; Aroca-Santos, R.; Cancilla, J.C.; Izquierdo, J.G.; Torrecilla, J.S. Characterization of an array of honeys of different types and botanical origins through fluorescence emission based on LEDs. Talanta 2018, 185, 196–202. [Google Scholar] [CrossRef]
  38. Sergiel, I.; Pohl, P.; Biesaga, M.; Mironczyk, A. Suitability of three-dimensional synchronous fluorescence spectroscopy for fingerprint analysis of honey samples with reference to their phenolic profiles. Food Chem. 2014, 145, 319–326. [Google Scholar] [CrossRef]
  39. Dramićanin, T.; Lenhardt Acković, L.; Zeković, I.; Dramićanin, M.D. Detection of Adulterated Honey by Fluorescence Excitation-Emission Matrices. J. Spectrosc. 2018, 2018, 8395212. [Google Scholar] [CrossRef]
  40. Gębala, S. Measurements of solution fluorescence–A new concept. Opt. Appl. 2009, 39, 391–399. [Google Scholar]
  41. Gębala, S.; Przybyłowski, P. Sposób Identyfikacji Odmian Miodu. Polska Patent 214784, 15 March 2010. [Google Scholar]
  42. Parri, E.; Santinami, G.; Domenici, V. Front-Face Fluorescence of Honey of Different Botanic Origin: A Case Study from Tuscany (Italy). Appl. Sci. 2020, 10, 1776. [Google Scholar] [CrossRef]
Figure 1. Scheme of surface fluorescence measurement. Source: (adapted from: [40,41]).
Foods 13 03303 g001
Figure 2. Excitation emission (EEM) spectra of different botanical origins of honey; (a)—acacia, (b)—phacelia, (c)—buckwheat, (d)—linden, (e)—dandelion, (f)—nectar–honeydew, (g)—rapeseed, (h)—honeydew–coniferous, (i)—multifloral, (j)—heather. Source: own research.
Foods 13 03303 g002aFoods 13 03303 g002b
Figure 3. Analysis of the fluorescence intensity of honeys of different varieties in the entire emission band at Δλ = 100 nm—canonical variate averages. Source: own research.
Foods 13 03303 g003
Figure 4. Synchronous fluorescence spectrum of honeys of different botanical origin at Δλ = 100 nm with each sample marked in the species group; (a)—acacia, (b)—phacelia, (c)—buckwheat, (d)—linden, (e)—dandelion, (f)—nectar–honeydew, (g)—rapeseed, (h)—honeydew–coniferous, (i)—multiflora, (j)—heather. Different colors shown in the figure indicate separate samples. Source: own research.
Foods 13 03303 g004aFoods 13 03303 g004b
Figure 5. Synchronous fluorescence spectrum for varietal honeys at Δλ = 100 nm (mean value). Source: own research.
Foods 13 03303 g005
Table 1. Honey variety classification matrix at Δλ 100 nm in the entire emission band.
Honey% Correct ClassificationAcaciaPhaceliaBuckwheatLindenDandelionNectar–HoneydewRapeseedHoneydew–ConfireousMultifloralHeather
acacia1006000000000
phacelia1000600000000
buckwheat1000080000000
linden10000012000000
dandelion1000000600000
Nectar–honeydew1000000050000
rapeseed10000000010000
Honeydew–needle1000000000600
multifloral10000000000140
heather1000000000008
Source: own research.
Table 2. Analysis of fluorescence intensity in the entire emission band at Δλ = 100 nm—averages of canonical variables.
Canonical VariablesHoney
AcaciaPhaceliaBuckwheatLindenDandelionNectar–HoneydewRapeseedHoneydew–ConfireousMultifloralHeather
Averages of Canonical Variates
D1−21.71−16.194.434−3.64416.386.091−0.367−4.99−4.90126.144
D214.33.882.542.564−23.47−8.336−0.778−10.86−4.60719.975
Source: own research.
Table 3. Analysis of the fluorescence intensity of honeys of different varieties in the entire emission band at Δλ = 100 nm—scheme for calculating the value D1 and D2.
Emission BandFluorescence IntensityF1 (Discriminant Function Coefficients)Square 1× Fluorescence IntensityF2 (Discriminant Function Coefficients)Square 2× Fluorescence Intensity
Free term-−3.664−3.6642.6772.677
200.000 −0.502 0.079
205.000 −0.717 −0.577
210.000 1.398 0.927
215.000 −1.146 −1.452
220.000 1.239 1.299
225.000 1.425 0.840
230.000 0.824 −0.461
235.000 −2.946 −2.929
240.000 −0.666 4.322
245.000 3.522 −1.546
250.000 −0.464 0.131
255.000 −1.920 −0.054
260.000 −0.696 −2.729
265.000 −2.201 2.347
270.000 1.950 1.718
275.000 0.763 −3.293
280.000 2.151 1.787
285.000 −1.074 0.707
290.000 0.056 −0.231
295.000 −3.589 −2.249
300.000 1.211 −0.335
305.000 2.889 3.227
310.000 −1.094 −1.092
315.000 −1.987 −2.966
320.000 −0.798 0.206
325.000 4.240 1.035
330.000 −0.729 4.727
335.000 −1.849 −3.363
340.000 1.717 −1.704
345.000 1.834 4.251
350.000 −3.414 −2.002
355.000 −4.152 −2.765
360.000 4.684 1.588
365.000 −0.456 0.161
370.000 6.187 3.346
375.000 −4.361 −5.826
380.000 −4.968 2.121
385.000 5.438 3.984
390.000 −2.449 −3.884
395.000 0.741 3.593
400.000 −5.072 −4.049
405.000 4.449 −0.149
410.000 2.754 2.695
415.000 −6.915 −0.923
420.000 2.698 −1.150
425.000 3.570 −0.825
430.000 −1.298 2.171
435.000 4.690 −4.005
440.000 −1.523 0.744
445.000 −8.798 −0.297
450.000 5.980 3.072
TOTAL = D1 TOTAL = D2
Source: own research.
Table 4. Comparison of excitation wavelengths Δλw for the maximum fluorescence intensity of honeys of different botanical origin at Δλ = 100 nm—average.
Botanical Origin of HoneyExcitation Wavelength Δλw for Maximum Fluorescence Intensity of Varietal Honeys [nm]
I ExcitationII ExcitationIII Excitation
acacia235280340
phacelia240285360
buckwheat235280370
linden235280370
dandelion235285365
nectar–honeydew235285360
rapeseed235280340
honeydew–needle235absence360
multifloral235280365
heather235absence370
Source: own research.
Disclaimer/Publisher’s Note: The statements, opinions and data contained in all publications are solely those of the individual author(s) and contributor(s) and not of MDPI and/or the editor(s). MDPI and/or the editor(s) disclaim responsibility for any injury to people or property resulting from any ideas, methods, instructions or products referred to in the content.

