
Enzyme Cascade Amplification-Based Immunoassay Using Alkaline Phosphatase-Linked Single-Chain Variable Fragment Fusion Tracer and MnO2 Nanosheets for Detection of Deoxynivalenol in Corn Samples

Abstract
1. Introduction
2. Materials and Methods
2.1. Material and Reagents
2.2. Expression, Purification, and Characterization of the scFv-ALP Fusion Tracer
2.3. Synthesis and Characterization of MnO2 Nanosheets
2.4. Enzyme Cascade Amplification-Based Immunoassay for DON
2.5. Selectivity of the ECAIA for DON
2.6. Sample Analysis and Validation
3. Results and Discussion
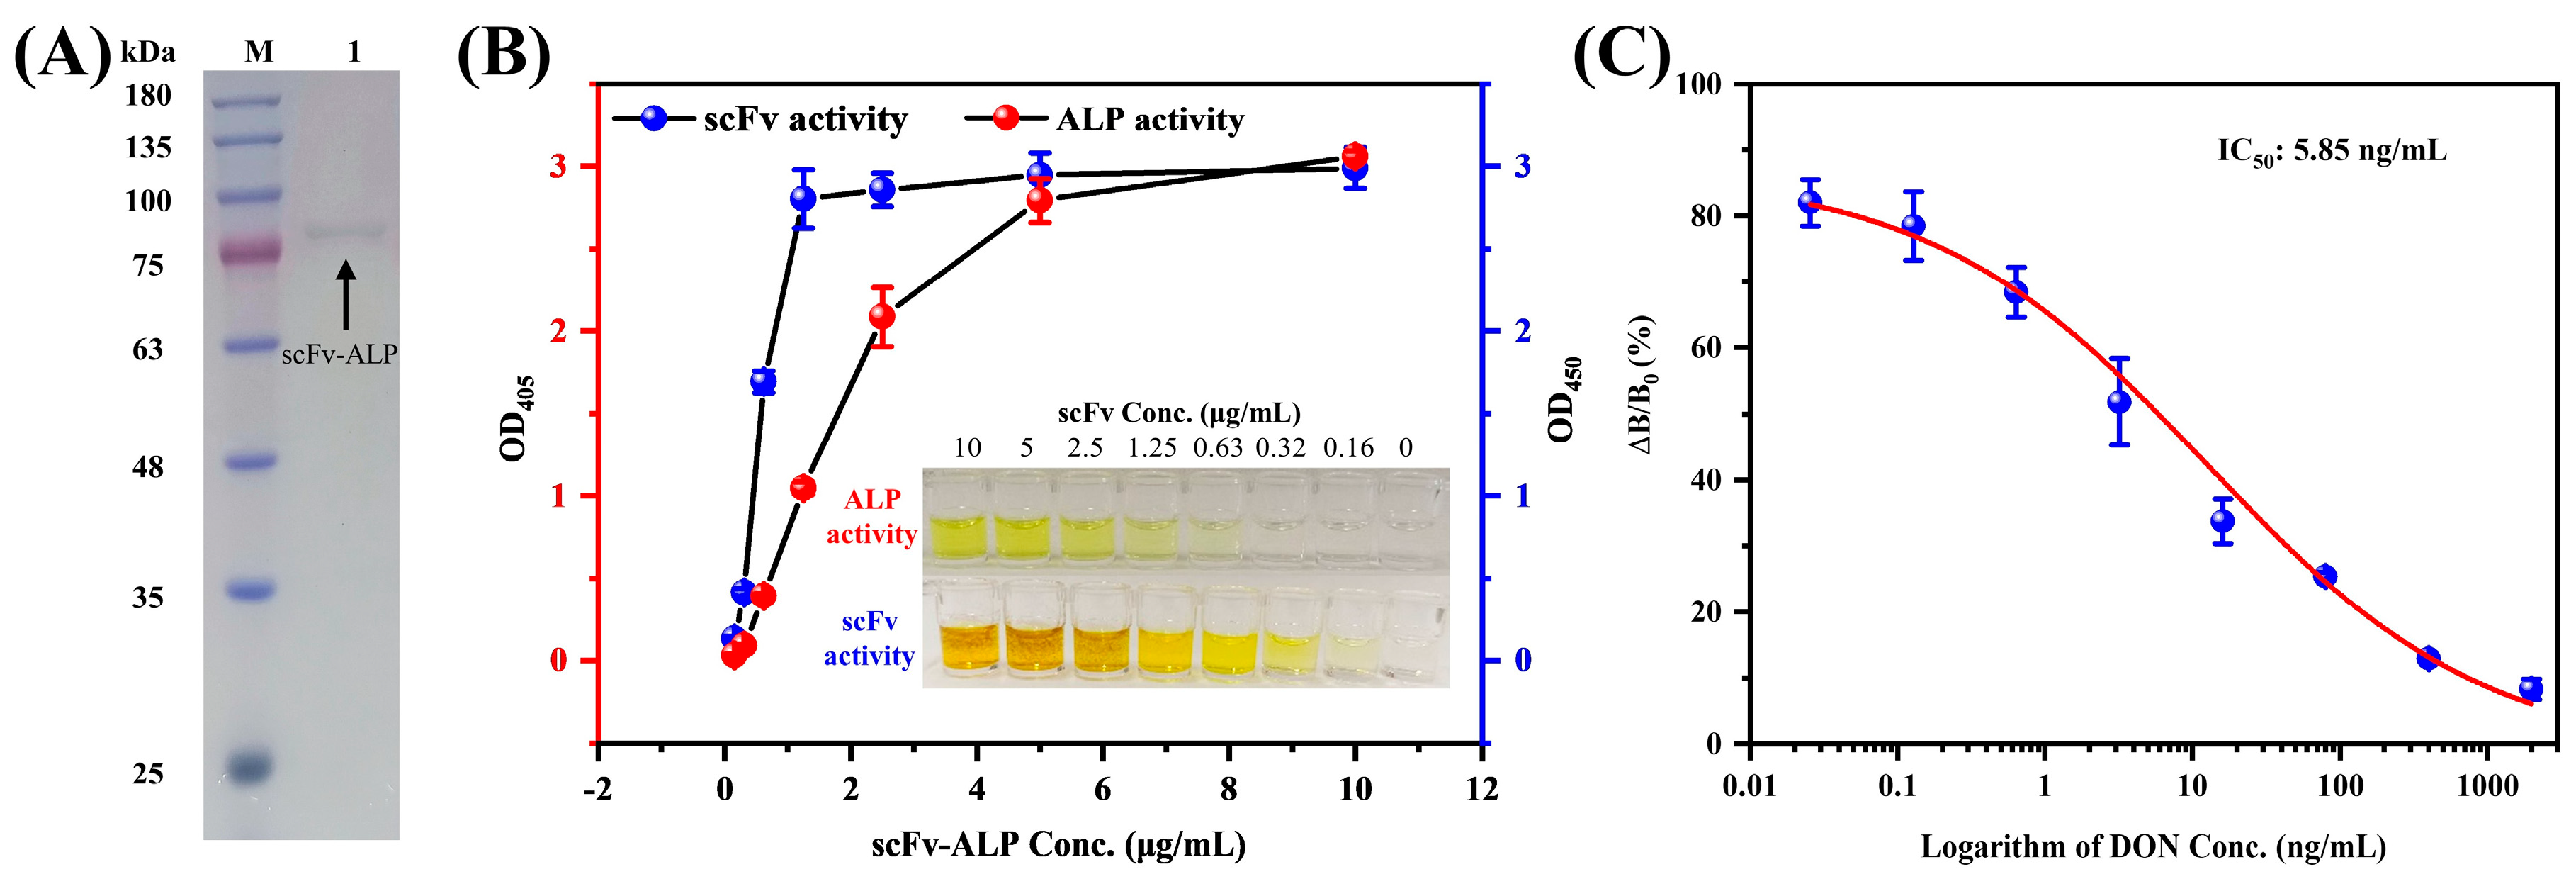
3.1. Expression, Purification, and Characterization of the scFv-ALP
3.2. Characterization of MnO2 Nanosheets
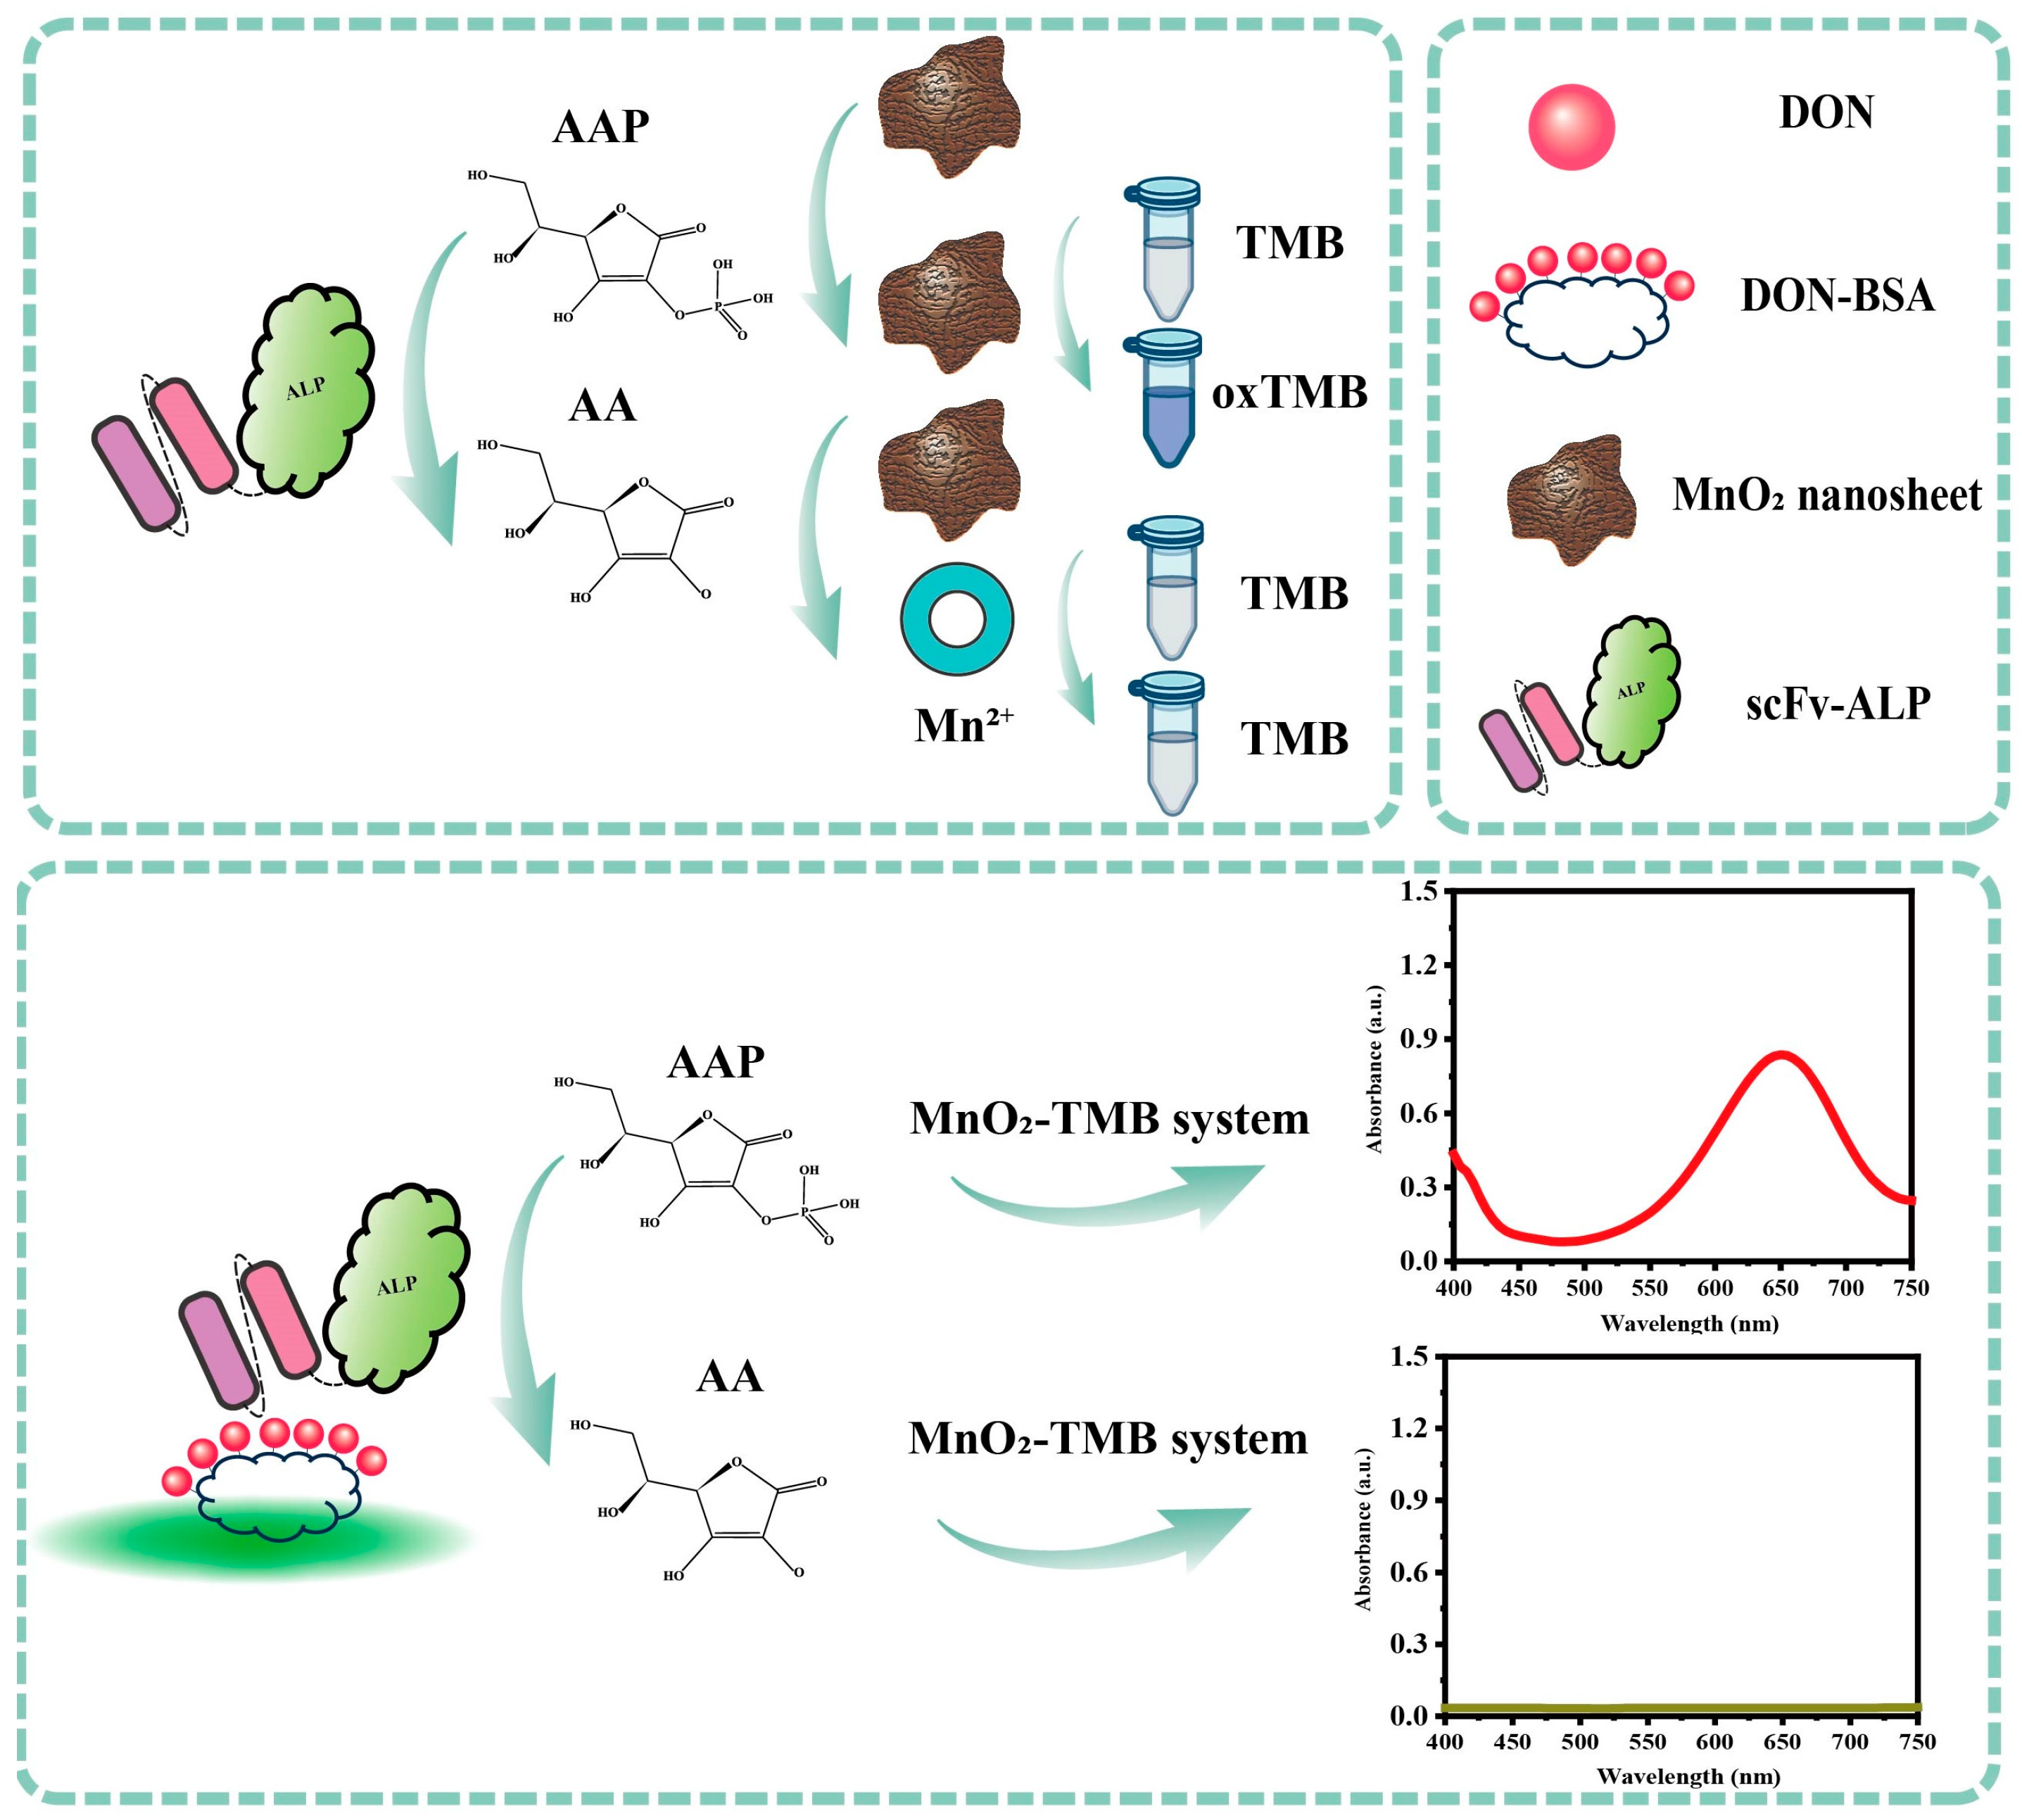
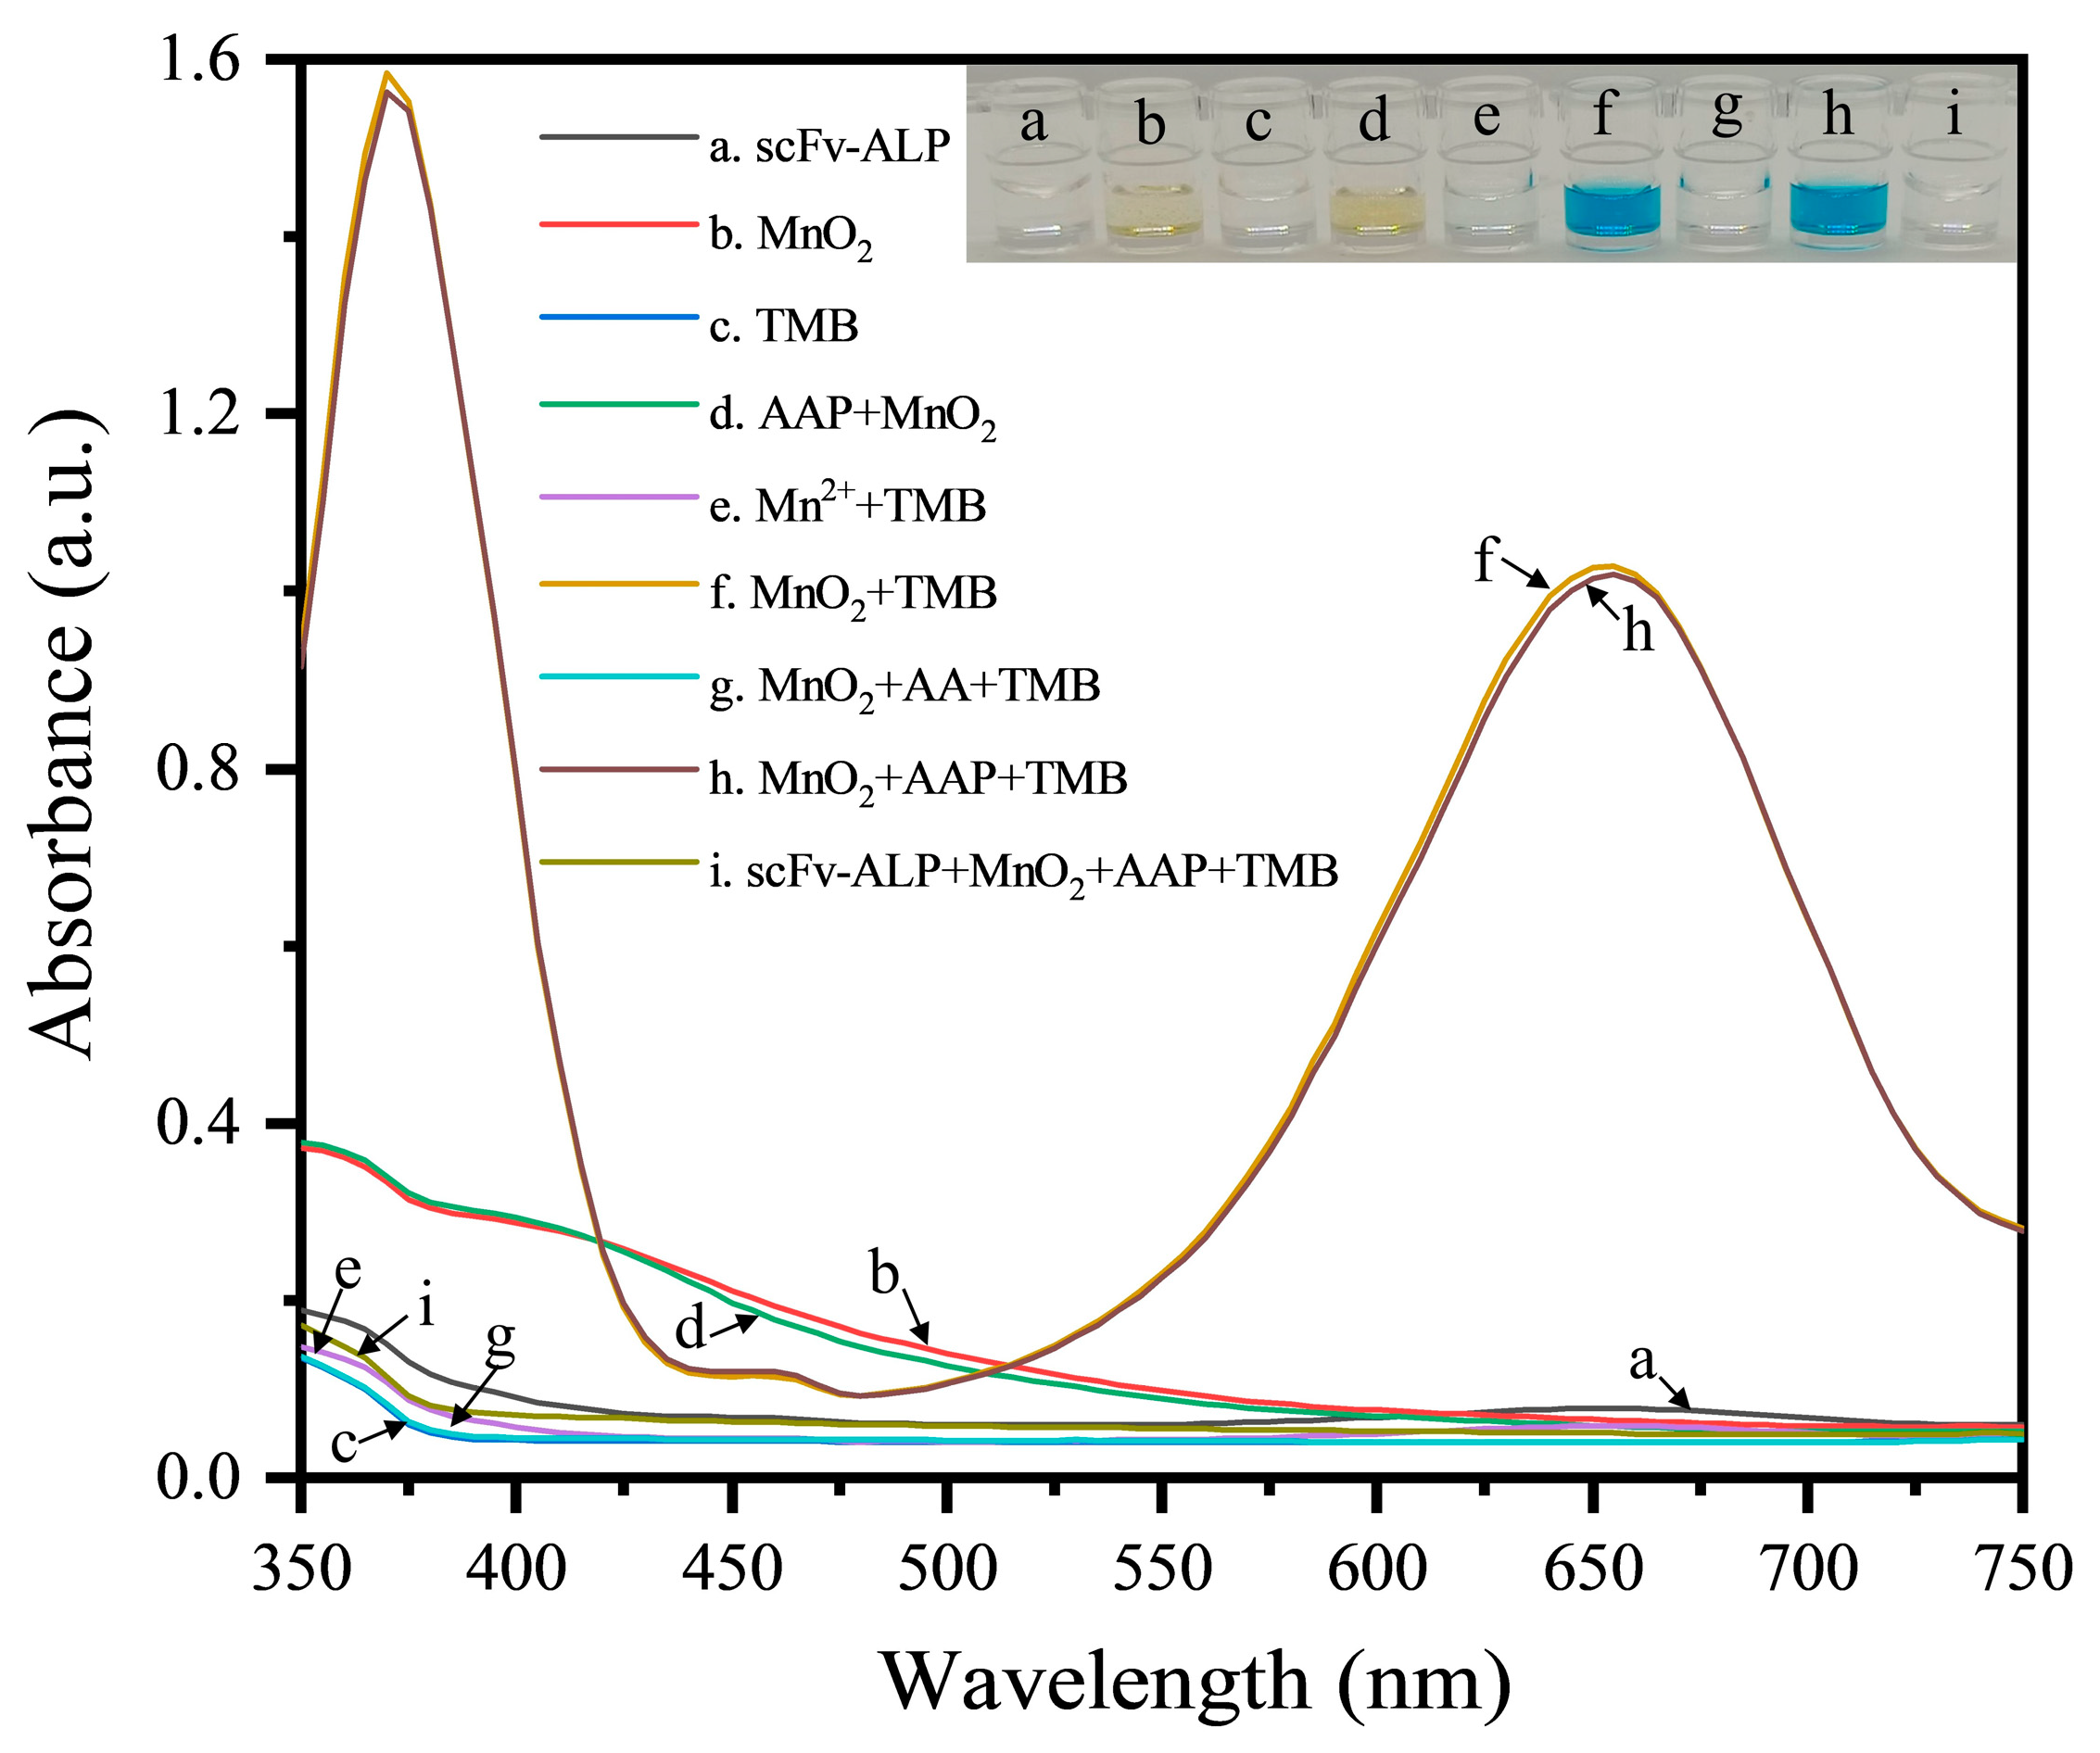
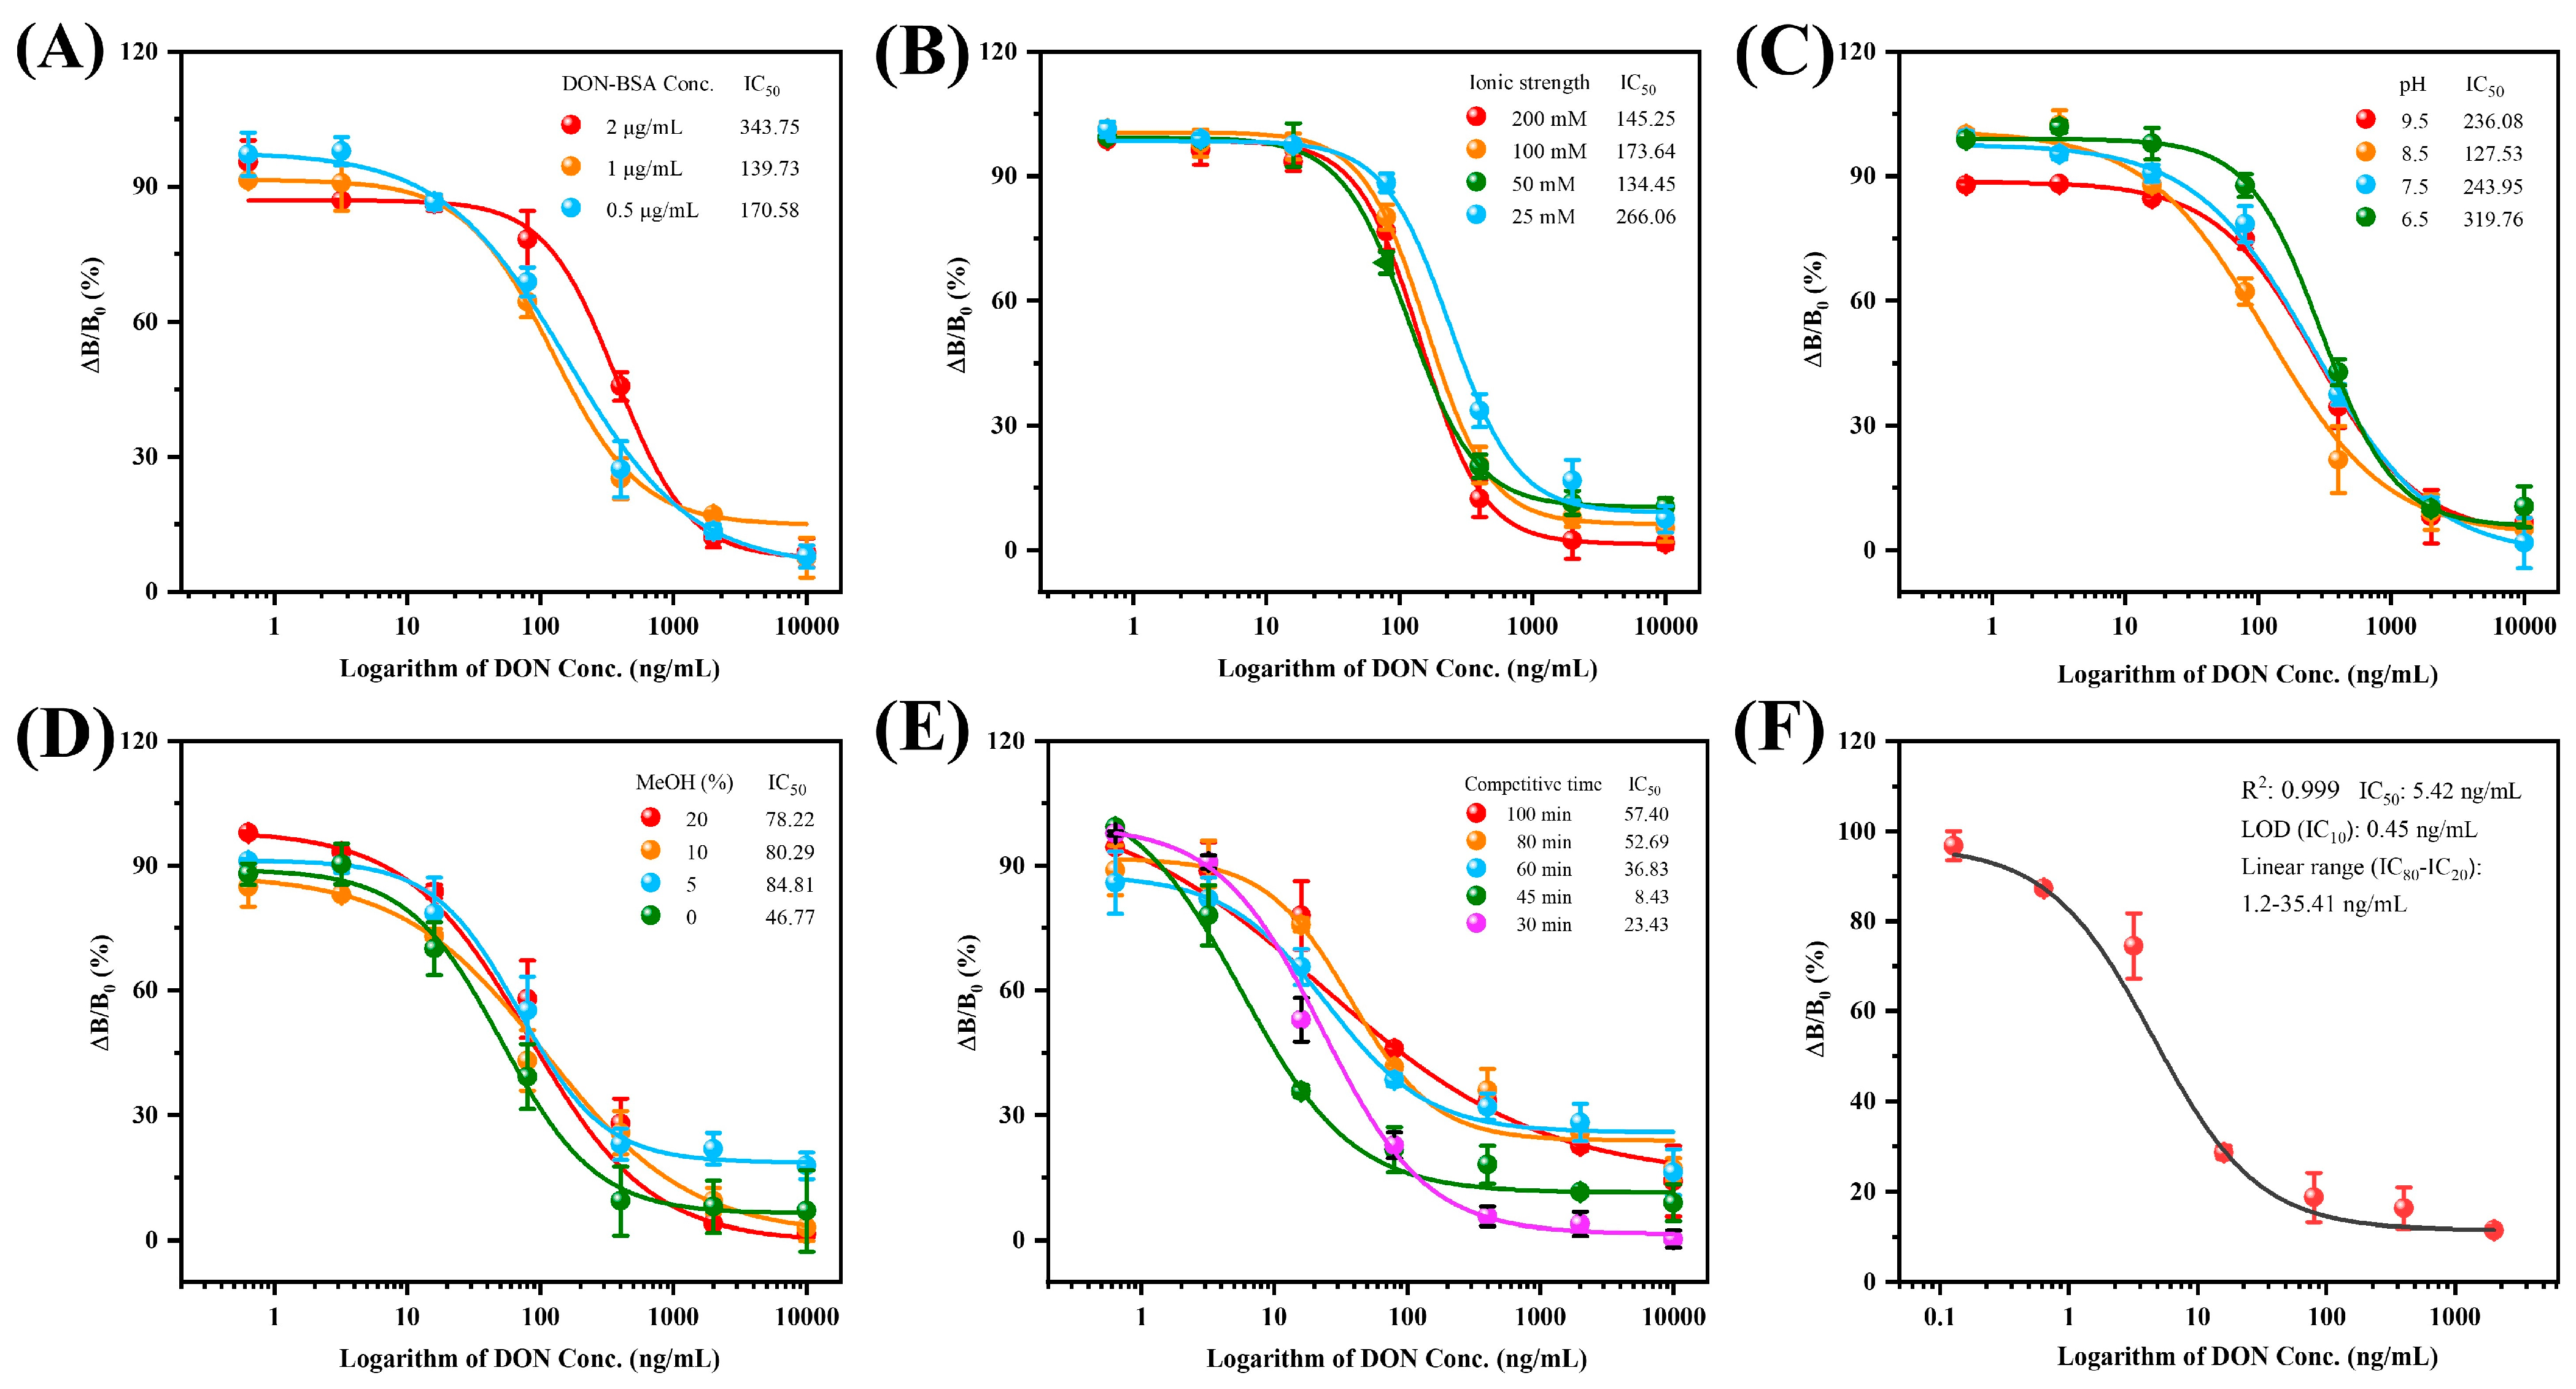
3.3. Feasibility Analysis and Optimization of the Nanozyme Sensing System for the scFv-ALP
3.4. ECAIA for Detecting DON
3.5. Selectivity of the ECAIA
3.6. Sample Analysis and Validation
4. Conclusions
Supplementary Materials
Author Contributions
Funding
Institutional Review Board Statement
Informed Consent Statement
Data Availability Statement
Conflicts of Interest
References
- Sumarah, M.W. The Deoxynivalenol Challenge. J. Agric. Food Chem. 2022, 70, 9619–9624. [Google Scholar] [CrossRef] [PubMed]
- Gab-Allah, M.A.; Tahoun, I.F.; Yamani, R.N.; Rend, E.A.; Shehata, A.B. Natural occurrence of deoxynivalenol, nivalenol and deoxynivalenol-3-glucoside in cereal-derived products from Egypt. Food Control 2022, 137, 108974–108982. [Google Scholar] [CrossRef]
- Hou, S.; Ma, J.; Cheng, Y.; Wang, H.; Sun, J.; Yan, Y. The toxicity mechanisms of DON to humans and animals and potential biological treatment strategies. Crit. Rev. Food Sci. Nutr. 2023, 63, 790–812. [Google Scholar] [CrossRef] [PubMed]
- Wu, Q.; Wang, X.; Nepovimova, E.; Miron, A.; Liu, Q.; Wang, Y.; Su, D.; Yang, H.; Li, L.; Kuca, K. Trichothecenes: Immunomodulatory effects, mechanisms, and anti-cancer potential. Arch. Toxicol. 2017, 91, 3737–3785. [Google Scholar] [CrossRef] [PubMed]
- Chen, C.; Turna, N.S.; Wu, F. Risk assessment of dietary deoxynivalenol exposure in wheat products worldwide: Are new codex DON guidelines adequately protective? Trends Food Sci. Technol. 2019, 89, 11–25. [Google Scholar] [CrossRef]
- Vidal, A.; Sanchis, V.; Ramos, A.J.; Marín, S. The fate of deoxynivalenol through wheat processing to food products. Curr. Opin. Food Sci. 2016, 11, 34–39. [Google Scholar] [CrossRef]
- Moez, E.; Noel, D.; Brice, S.; Benjamin, G.; Pascaline, A.; Didier, M. Aptamer assisted ultrafiltration cleanup with high performance liquid chromatography-fluorescence detector for the determination of OTA in green coffee. Food Chem. 2020, 310, 125851–125856. [Google Scholar] [CrossRef] [PubMed]
- Dina, O.; Aset, M.; Marat, B.; Aray, Z.; Bulat, K. Chromatographic determination of pesticides in soil: Current trends in analysis and sample preparation. Trends Environ. Anal. Chem. 2022, 35, e00175–e00191. [Google Scholar]
- Li, Y.; Chen, A.; Mao, X.; Sun, M.; Yang, S.; Li, J.; You, Y.; Wu, Y.; Jiang, G. Multiple antibodied based immunoaffinity columns preparation for the simultaneous analysis of deoxynivalenol and T-2 toxin in cereals by liquid chromatography tandem mass spectrometry. Food Chem. 2020, 337, 127802–127807. [Google Scholar] [CrossRef] [PubMed]
- Xu, Y.; Yang, H.; Huang, Z.; Li, Y.; He, Q.; Tu, Z.; Ji, Y.; Ren, W. A peptide/maltose-binding protein fusion protein used to replace the traditional antigen for immunological detection of deoxynivalenol in food and feed. Food Chem. 2018, 268, 242–248. [Google Scholar] [CrossRef] [PubMed]
- Yuan, Z.; Dai, H.; Liu, X.; Duan, S.; Shen, Y.; Zhang, Q.; Shu, Z.; Xiao, A.; Wang, J. An electrochemical immunosensor based on prussian blue@zeolitic imidazolate framework-8 nanocomposites probe for the detection of deoxynivalenol in grain products. Food Chem. 2022, 405, 134842–134850. [Google Scholar] [CrossRef] [PubMed]
- Zou, W.; Shi, R.; Wang, G.; Zhao, Z.; Zhao, F.; Yang, Z. Rapid and sensitive noncompetitive immunoassay for detection of aflatoxin B1 based on anti-immune complex peptide. Food Chem. 2022, 393, 133317–133323. [Google Scholar] [CrossRef] [PubMed]
- Hou, S.; Ma, J.; Cheng, Y.; Wang, H.; Sun, J.; Yan, Y. Quantum dot nanobead-based fluorescent immunochromatographic assay for simultaneous quantitative detection of fumonisin B1, dexyonivalenol, and zearalenone in grains. Food Control 2020, 117, 107331–107339. [Google Scholar] [CrossRef]
- Goryacheva, O.A.; Beloglazova, N.V.; Goryacheva, I.Y.; De Saeger, S. Homogenous FRET-based fluorescent immunoassay for deoxynivalenol detection by controlling the distance of donor-acceptor couple. Talanta 2021, 225, 121973–121980. [Google Scholar] [CrossRef] [PubMed]
- Su, B.; Zhang, Z.; Sun, Z.; Tang, Z.; Xie, X.; Chen, Q.; Cao, H.; Yu, X.; Xu, Y.; Liu, X.; et al. Fluonanobody-based nanosensor via fluorescence resonance energy transfer for ultrasensitive detection of ochratoxin A. J. Hazard. Mater. 2022, 422, 126838–126847. [Google Scholar] [CrossRef] [PubMed]
- Feng, J.; Xue, Y.; Wang, X.; Song, Q.; Wang, B.; Ren, X.; Zhang, L.; Liu, Z. Sensitive, simultaneous and quantitative detection of deoxynivalenol and fumonisin B(1) in the water environment using lateral flow immunoassay integrated with smartphone. Sci. Total Environ. 2022, 834, 155354–155361. [Google Scholar] [CrossRef] [PubMed]
- Liu, Z.; Hua, Q.; Wang, J.; Liang, Z.; Li, J.; Wu, J.; Shen, X.; Lei, H.; Li, X. A smartphone-based dual detection mode device integrated with two lateral flow immunoassays for multiplex mycotoxins in cereals. Biosens. Bioelectron. 2020, 158, 112178–112185. [Google Scholar] [CrossRef] [PubMed]
- Jiang, Q.; Wu, J.; Yao, K.; Yin, Y.; Gong, M.M.; Yang, C.; Lin, F. Paper-Based Microfluidic Device (DON-Chip) for Rapid and Low-Cost Deoxynivalenol Quantification in Food, Feed, and Feed Ingredients. ACS Sens. 2019, 4, 3072–3079. [Google Scholar] [CrossRef] [PubMed]
- Soares, R.R.G.; Santos, D.R.; Chu, V.; Azevedo, A.M.; Aires-Barros, M.R.; Conde, J.P. A point-of-use microfluidic device with integrated photodetector array for immunoassay multiplexing: Detection of a panel of mycotoxins in multiple samples. Biosens. Bioelectron. 2016, 87, 823–831. [Google Scholar] [PubMed]
- Cui, X.; Vasylieva, N.; Wu, P.; Barnych, B.; Yang, J.; Shen, D.; He, Q.; Gee, S.J.; Zhao, S.; Hammock, B.D. Development of an Indirect Competitive Enzyme-Linked Immunosorbent Assay for Glycocholic Acid Based on Chicken Single-Chain Variable Fragment Antibodies. Anal. Chem. 2017, 89, 11091–11097. [Google Scholar] [PubMed]
- Zhao, F.; Shi, R.; Liu, R.; Tian, Y.; Yang, Z. Application of phage-display developed antibody and antigen substitutes in immunoassays for small molecule contaminants analysis: A mini-review. Food Chem. 2021, 339, 128084–128092. [Google Scholar] [CrossRef] [PubMed]
- Liu, C.; Lin, H.; Cao, L.; Wang, K.; Sui, J. Characterization, specific recognition, and the performance in fish matrix of a shark-derived single-domain antibody against enrofloxacin. Talanta 2023, 265, 124852–124858. [Google Scholar] [CrossRef] [PubMed]
- Dong, J.; Li, Z.; Wang, Y.; Jin, M.; Shen, Y.; Xu, Z.; Abd El-Aty, A.M.; Gee, S.J.; Hammock, B.D.; Sun, Y.; et al. Generation of functional single-chain fragment variable from hybridoma and development of chemiluminescence enzyme immunoassay for determination of total malachite green in tilapia fish. Food Chem. 2021, 337, 127780–127786. [Google Scholar] [CrossRef] [PubMed]
- Lu, X.; Ye, Y.; Wang, Y.; Xu, J.; Sun, J.; Ji, J.; Zhang, Y.; Sun, X. Rapid generation of high-quality recombinant antibodies using an Expi293F expression system for a 17 beta-estradiol immunoassay. J. Hazard. Mater. 2023, 451, 131126–131134. [Google Scholar] [CrossRef] [PubMed]
- Li, L.; Wu, S.; Si, Y.; Li, H.; Yin, X.; Peng, D. Single-chain fragment variable produced by phage display technology: Construction, selection, mutation, expression, and recent applications in food safety. Compr. Rev. Food Sci. Food Saf. 2022, 21, 4354–4377. [Google Scholar] [CrossRef] [PubMed]
- Sandomenico, A.; Sivaccumar, J.P.; Ruvo, M. Evolution of Escherichia coli Expression System in Produc. Int. J. Mol. Sci. 2020, 21, 6324–6362. [Google Scholar] [CrossRef] [PubMed]
- Satheeshkumar, P.K. Expression of Single Chain Variable Fragment (scFv) Molecules in Plants: A Comprehensive Update. Mol. Biotechnol. 2020, 62, 151–167. [Google Scholar] [CrossRef]
- Ahmad, Z.A.; Yeap, S.K.; Ali, A.M.; Ho, W.Y.; Alitheen, N.B.M.; Hamid, M. scFv antibody: Principles and clinical application. Clin. Dev. Immunol. 2012, 2012, 980250–980264. [Google Scholar] [CrossRef]
- Suurs, F.V.; Lub-de Hooge, M.N.; de Vries, E.G.E.; de Groot, D.J.A. A review of bispecific antibodies and antibody constructs in oncology and clinical challenges. Pharmacol. Ther. 2019, 201, 103–119. [Google Scholar] [CrossRef] [PubMed]
- Dou, L.; Pan, Y.; Ma, M.; Zhang, S.; Shen, J.; Wang, Z.; Yu, W. Antibody engineering-driven controllable chemiluminescence resonance energy transfer for immunoassay with tunable dynamic range. Anal. Chim. Acta 2021, 1152, 338231–338238. [Google Scholar] [CrossRef]
- Oyama, H.; Kiguchi, Y.; Morita, I.; Miyashita, T.; Ichimura, A.; Miyaoka, H.; Izumi, A.; Terasawa, S.; Osumi, N.; Tanaka, H.; et al. NanoLuc luciferase as a suitable fusion partner of recombinant antibody fragments for developing sensitive luminescent immunoassays. Anal. Chim. Acta 2021, 1161, 238180–238193. [Google Scholar] [CrossRef] [PubMed]
- Shu, R.; Liu, S.; Huang, L.; Li, Y.; Sun, J.; Zhang, D.; Zhu, M.-Q.; Wang, J. Enzyme-Mimetic nano-immunosensors for amplified detection of food hazards: Recent advances and future trends. Biosens. Bioelectron. 2022, 217, 114577–114593. [Google Scholar] [CrossRef] [PubMed]
- Wang, Y.; Xianyu, Y. Nanobody and Nanozyme-Enabled Immunoassays with Enhanced Specificity and Sensitivity. Small Methods 2022, 6, e2101576–e2101599. [Google Scholar] [CrossRef] [PubMed]
- Gao, L.; Zhuang, J.; Nie, L.; Zhang, J.; Zhang, Y.; Gu, N.; Wang, T.; Feng, J.; Yang, D.; Perrett, S.; et al. Intrinsic peroxidase-like activity of ferromagnetic nanoparticles. Nat. Nanotechnol. 2007, 2, 577–583. [Google Scholar] [CrossRef] [PubMed]
- Wang, H.; Wan, K.; Shi, X. Recent Advances in Nanozyme Research. Adv. Mater. 2018, 31, 1805368–1805377. [Google Scholar] [CrossRef] [PubMed]
- Liu, J.; Meng, L.; Fei, Z.; Dyson, P.J.; Jing, X.; Liu, X. MnO2 nanosheets as an artificial enzyme to mimic oxidase for rapid and sensitive detection of glutathione. Biosens. Bioelectron. 2016, 90, 69–74. [Google Scholar] [CrossRef] [PubMed]
- Na, W.; Li, N.; Xingguang, S. Enzymatic growth of single-layer MnO2 nanosheets in situ: Application to detect alkaline phosphatase and ascorbic acid in the presence of sulfanilic acid functionalized graphene quantum dots. Sens. Actuators B Chem. 2018, 274, 172–179. [Google Scholar] [CrossRef]
- Wen, L.; Huang, Y.; Sun, Z.; Shi, S.; Xie, X.; He, Z.; Liu, X. Development of alkaline phosphatase-linked single-chain variable fragment fusion proteins for one-step immunodetection of deoxynivalenol in cereals. Anal. Bioanal. Chem. 2024, 416, 2929–2939. [Google Scholar] [CrossRef] [PubMed]
- Yang, X.; Sun, Z.; He, Z.; Xie, X.; Liu, X. Combination of nanobody and peptidomimetic to develop novel immunoassay platforms for detecting ochratoxin A in cereals. Food Chem. 2023, 429, 137018–137025. [Google Scholar] [CrossRef] [PubMed]
- Xie, X.; He, Z.; Qu, C.; Sun, Z.; Cao, H.; Liu, X. Nanobody/NanoBiT system-mediated bioluminescence immunosensor for one-step homogeneous detection of trace ochratoxin A in food. J. Hazard. Mater. 2022, 437, 129435–129446. [Google Scholar] [CrossRef] [PubMed]
- Su, B.; Xu, H.; Xie, G.; Chen, Q.; Sun, Z.; Cao, H.; Liu, X. Generation of a nanobody-alkaline phosphatase fusion and its application in an enzyme cascade-amplified immunoassay for colorimetric detection of alpha fetoprotein in human serum. Spectrochim. Acta A 2021, 262, 120088–120095. [Google Scholar] [CrossRef] [PubMed]
- China Food and Drug Administration. China National Standard No. GB5009.111-2016; Ministry of Health of P. R. China: Beijing, China, 2016. [Google Scholar]
- Lettieri, S.; Avitabile, A.; Della Ventura, B.; Funari, R.; Ambrosio, A.; Maddalena, P.; Valadan, M.; Velotta, R.; Altucci, C. Nano- and femtosecond UV laser pulses to immobilize biomolecules onto surfaces with preferential orientation. Appl. Phys. A 2014, 117, 185–190. [Google Scholar] [CrossRef]
- Guo, R.; Ji, Y.; Chen, J.; Ye, J.; Ni, B.; Li, L.; Yang, Y. Multicolor Visual Detection of Deoxynivalenol in Grain Based on Magnetic Immunoassay and Enzymatic Etching of Plasmonic Gold Nanobipyramids. Toxins 2023, 15, 351–361. [Google Scholar] [CrossRef] [PubMed]
- Hong, F.; Chen, R.; Lu, P.; Li, L.; Xiao, R.; Chen, Y.; Yang, H. A universal, portable, and ultra-sensitive pipet immunoassay platform for deoxynivalenol detection based on dopamine self-polymerization-mediated bioconjugation and signal amplification. J. Hazard. Mater. 2022, 436, 129257–129265. [Google Scholar] [CrossRef] [PubMed]
- Qiu, Y.L.; He, Q.H.; Xu, Y.; Bhunia, A.K.; Tu, Z.; Chen, B.; Liu, Y.Y. Deoxynivalenol-mimic nanobody isolated from a naive phage display nanobody library and its application in immunoassay. Anal. Chim. Acta 2015, 887, 201–208. [Google Scholar] [CrossRef] [PubMed]


| Analyte | Chemical Structure | IC50 | CR (%) |
|---|---|---|---|
| DON | 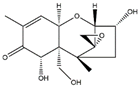 | 5.62 | 100 |
| OTA | 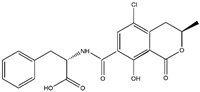 | >1200 | <0.01 |
| AFB1 |  | >1200 | <0.01 |
| FB1 | 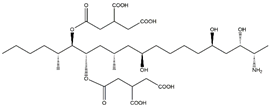 | >1200 | <0.01 |
| ZEN |  | >1200 | <0.01 |
| Test | Spiked DON (μg/kg) | Mean ± SD (μg/kg) | Recovery (%) | RSD (%) |
|---|---|---|---|---|
| Intra-assay (n = 3) a | 200 | 236.54 ± 6.67 | 118.3 | 2.8 |
| 400 | 384.71 ± 19.32 | 96.2 | 5 | |
| 800 | 711.27 ± 36.78 | 88.9 | 5.2 | |
| Inter-assay (n = 3) b | 200 | 218.34 ± 22.43 | 109.2 | 10.3 |
| 400 | 320.46 ± 23.96 | 80.1 | 7.5 | |
| 800 | 699.76 ± 24.62 | 87.5 | 3.5 |
Disclaimer/Publisher’s Note: The statements, opinions and data contained in all publications are solely those of the individual author(s) and contributor(s) and not of MDPI and/or the editor(s). MDPI and/or the editor(s) disclaim responsibility for any injury to people or property resulting from any ideas, methods, instructions or products referred to in the content. |
© 2024 by the authors. Licensee MDPI, Basel, Switzerland. This article is an open access article distributed under the terms and conditions of the Creative Commons Attribution (CC BY) license (https://creativecommons.org/licenses/by/4.0/).
Share and Cite
Xie, G.; Mao, F.; Huang, Y.; Wen, L.; Sun, Z.; He, Z.; Liu, X. Enzyme Cascade Amplification-Based Immunoassay Using Alkaline Phosphatase-Linked Single-Chain Variable Fragment Fusion Tracer and MnO2 Nanosheets for Detection of Deoxynivalenol in Corn Samples. Foods 2024, 13, 2009. https://doi.org/10.3390/foods13132009
Xie G, Mao F, Huang Y, Wen L, Sun Z, He Z, Liu X. Enzyme Cascade Amplification-Based Immunoassay Using Alkaline Phosphatase-Linked Single-Chain Variable Fragment Fusion Tracer and MnO2 Nanosheets for Detection of Deoxynivalenol in Corn Samples. Foods. 2024; 13(13):2009. https://doi.org/10.3390/foods13132009
Chicago/Turabian StyleXie, Guifang, Fujing Mao, Yirui Huang, Li Wen, Zhichang Sun, Zhenyun He, and Xing Liu. 2024. "Enzyme Cascade Amplification-Based Immunoassay Using Alkaline Phosphatase-Linked Single-Chain Variable Fragment Fusion Tracer and MnO2 Nanosheets for Detection of Deoxynivalenol in Corn Samples" Foods 13, no. 13: 2009. https://doi.org/10.3390/foods13132009
APA StyleXie, G., Mao, F., Huang, Y., Wen, L., Sun, Z., He, Z., & Liu, X. (2024). Enzyme Cascade Amplification-Based Immunoassay Using Alkaline Phosphatase-Linked Single-Chain Variable Fragment Fusion Tracer and MnO2 Nanosheets for Detection of Deoxynivalenol in Corn Samples. Foods, 13(13), 2009. https://doi.org/10.3390/foods13132009