Abstract
Free amino acids (AAs) formed in fermented meat products are important nitrogen sources for the survival and metabolism of contaminating fungi. These AAs are mainly regulated by the TORC1-Tap42 signaling pathway. Fusarium spp., a common contaminant of fermented products, is a potential threat to food safety. Therefore, there is an urgent need to clarify the effect of different AAs on Fusarium spp. growth and metabolism. This study investigated the effect of 18 AAs on Fusarium oxysporum (Fo17) growth, sporulation, T-2 toxin (T-2) synthesis and Tri5 expression through Tap42 gene regulation. Co-immunoprecipitation and Q Exactive LC-MS/MS methods were used to detect the interacting protein of Tap42 during specific AA treatment. Tap42 positively regulated L-His, L-Ile and L-Tyr absorption for Fo17 colony growth. Acidic (L-Asp, L-Glu) and sulfur-containing (L-Cys, L-Met) AAs significantly inhibited the Fo17 growth which was not regulated by Tap42. The L-Ile and L-Pro addition significantly activated the sporulation of ΔFoTap42. L-His and L-Ser inhibited the sporulation of ΔFoTap42. In T-2 synthesis, ΔFoTap42 was increased in GYM medium, but was markedly inhibited in L-Asp and L-Glu addition groups. Dose–response experiments showed that 10–70 mg/mL of neutral AA (L-Thr) and alkaline AA (L-His) significantly increased the T-2 production and Tri5 expression of Fo17, but Tri5 expression was not activated in ΔFoTap42. Inhibition of T-2 synthesis and Tri5 expression were observed in Fo17 following the addition of 30–70 mg/mL L-Asp. KEGG enrichment pathway analysis demonstrated that interacting proteins of Tap42 were from glycerophospholipid metabolism, pentose phosphate pathway, glyoxylate and dicarboxylate metabolism, glycolysis and gluconeogenesis, and were related to the MAPK and Hippo signaling pathways. This study enhanced our understanding of AA regulation in fermented foods and its effect on Fusarium growth and metabolism, and provided insight into potential ways to control fungal contamination in high-protein fermented foods.
1. Introduction
Fermented meat (sausage, bacon, ham) and fermented dried aquatic (dried/smoked fish, dried shrimp) products are two types of flavor foods, processed under natural or control drying conditions. Flavor formation occurs through a series of biochemical and physical changes and depends on microorganism fermentation and/or endogenous enzyme action [1,2,3]. During fermentation, a number of aromatic substances, such as free amino acids (AAs), aldehydes, alcohols, acids, heterocyclic compounds and nucleotides, can be formed which impart a unique flavor to the food [4,5,6,7]. Due to lower water activity (aw) and higher salinity, fermented dry/semi-dry products can be stored for a long time with minimal microbial reproduction. However, unpackaged fermented products are at risk of contamination by environmental and suspended microorganisms in the air, including fungi, which adhere easily to the product surface. During long-term storage, protein breakdown in food forms free AAs to provide nutrients for fungal growth and metabolism. In addition, some fungal contaminants such as Penicillium spp., Aspergillus spp., Fusarium spp. and Candida spp. can utilize AAs to grow at aw < 0.9 [8,9] and contaminate fermented food [10,11]. Among the common contaminated fungi, Fusarium spp. are plant pathogenic fungi which generally infect high-carbon crops such as grain, corn, soybean and wheat to produce mycotoxins such as T-2 toxin (T-2), HT-2 toxin (HT-2), deoxynivalenol (DON) and 15-acetyl deoxynivalenol (15Ac-DON) [12,13,14]. Among these, T-2 is highly toxic and causes weight loss [15], neurological disorders [16], immunosuppression [17], bone marrow damage [18] and cutaneous toxicity [19]. The Tri5 gene plays an important role as the initiator of T-2 synthesis [20]. Several studies have reported that Fusarium contamination in dried/smoked fish and fermented meat products sold at markets poses a potential threat to consumer health [10,21,22,23,24]. Proteins in meat products are degraded to AAs during long-term storage due to microbial growth. Rabie et al. (2014) reported a reduction in free AA concentration in horse and beef sausage during 28-day storage period due to contaminating microorganism metabolism [25]. Although protein degradation into free AAs such as aspartic acid (L-Asp), glutamic acid (L-Glu) and alanine (L-Ala) can enhance the unique flavor of fermented products, long storage periods can lead to excessive proteolysis, resulting in the accumulation of free AAs, which provide conducive conditions for Fusarium growth and the production of spores and mycotoxins. Furthermore, fermented meat products can degrade into more than 22 AAs, including threonine, serine, glutamine, lysine, tyrosine and histidine. These AAs can be classified into acidic-, alkaline-, neutral and sulfur-containing AAs. Regulatory mechanism of each AA on fungal metabolism vary between species. At present, few studies have reported the effects of amino acid on Fusarium sp. growth and metabolism [26]. To understand the metabolic mechanism of Fusarium sp. on AAs, it is important to determine how fungi utilize different nutrients in high-protein fermented foods.
The target of rapamycin (TOR) protein is a key regulator of eukaryotic growth and a class of evolutionarily conserved serine/threonine (Ser/Thr) protein kinase [27]. The TORC1 signaling pathway includes two parts: (1) upstream activation pathway of TORC1, consisting of GTPases Gln and Gtr [28] regulated by Gln3 [29] and Gtr1/Gtr2 [30], respectively, allowing fungi to respond to AAs, stress and other environmental signals; (2) two branches of the downstream pathway, controlled by Sch9 and Tap42, which regulate fungal growth and metabolism, respectively [31], including protein translation, ribosomal synthesis, gene transcription, protein degradation and autophagy [32]. Most studies on the regulation of AAs on fungal growth and metabolism have examined the TORC1 signaling pathway [33].
A complete response system was investigated in Saccharomyces cerevisiae under a limited nitrogen condition [34]. Tap42-dependent phosphorylation occurs when the TOR signal is activated, promoting the interaction between Tap42 and phosphatase. When the external nutrient conditions are unfavorable, phosphatase isolated from Tap42 and many downstream targets of the TOR signaling pathway, such as Npr1, Ure2 and Gln3, are dephosphorylated to regulate metabolism [35]. Therefore, Tap42 is an important metabolic regulator used by fungi to respond to external AAs and control Fusarium metabolism.
The aim of this study was to elucidate the role of 18 AAs as nitrogen sources for Fusarium spp. growth (colony morphology) and metabolism (sporulation, toxin production, Tr5 expression) regulated by the Tap42 gene. Co-immunoprecipitation was used to capture the interacting proteins of Tap42 following exposure to specific AAs. This provides an experimental basis for controlling fungal contamination in fermented meat products from an AA perspective.
2. Materials and Methods
2.1. Chemicals and Experimental Strains
Biological reagents (≥99%) L-Aspartic acid (L-Asp), L-Glutamic acid (L-Glu), L-Serine (L-Ser), Glycine (Gly), L-Histidine (L-His), L-Threonine (L-Thr), L-Arginine (L-Arg), L-Proline (L-Pro), L-Alanine (L-Ala), L-Tyrosine (L-Tyr), L-Valine (L-Val), L-Methionine (L-Met), L-Cysteine (L-Cys), L-Isoleucine (L-Ile), L-Leucine (L-Leu), L-Tryptophan (L-Try), L-Phenylalanine (L-Phe) and L-Lysine (L-Lys) were purchased from Ruiyong Biological Technology (Shanghai, China). T-2 toxin standard was purchased from Enzo Life Science (Farmingdale, NY, USA). Chromatographic-grade reagents (≥99%) methanol, ethyl acetate, acetonitrile and formic acid were purchased from Sigma-Aldrich (Shanghai, China). Kanamycin, dithiothreitol (DTT), isopropyl-beta-D-thiogalactopyranoside (IPTG), and 1-(p-Toluenesulfonyl) imidazole (C10H10N2O2 S) were purchased from Xiya Chemical Technology (Qingdao, China). IP lysis, 1× loading buffer and trypsin were obtained from Sangon Biotech (Shanghai, China). Disodium hydrogen phosphate, sodium chloride, iodoacetamide, ammonium bicarbonate, ammonium dihydrogen phosphate, potassium chloride, magnesium sulfate heptahydrate, dipotassium hydrogen phosphate, ferrous sulfate heptahydrate and ammonium bicarbonate were purchased from Xilong Science (Shantou, China).
Wild-type Fusarium oxysporum (Fo17, GDMCC 60824, isolated from dried fish) has a strong T-2 toxin synthesis ability. Gene deletion strain ΔFoTap42 and complement strain ΔFoTap42-C were obtained by the double-crossover homologous recombination method (in a preliminary experiment). Top10 Escherichia coli and Rossetta (DE3) competent cells were purchased from Kamede Biological (Tianjin, China).
2.2. Colony Growth Analysis
A dextrose agar medium (20 g glucose, 20 g agar 0.1 g chloramphenicol) containing 5 mg/mL each of 18 AAs was prepared. For the control group, PDA medium was used without AA addition. The wild-type Fo17, ΔFoTap42 and ΔFoTap42-C were inoculated into a AA dextrose agar medium with a 5 mm mycelium disk, cultured for 7 d at 28 °C. The colony’s morphology was observed and photographed.
2.3. Sporulation Capacity Analysis
A 1L Czapek dox agar (CDA) liquid medium (nitrogen (N) source removed, containing 1 g K2HPO4, 0.5 g KCl, 0.5 g MgSO4·7H2O, 0.01 g FeSO4·7H2O, 30 g saccharose) containing 10 mg/mL each of 18 AAs were prepared. The control group used a CDA liquid medium with an original nitrogen source and without AA addition. The wild-type Fo17, ΔFoTap42 and ΔFoTap42-C were inoculated into the CDA medium with a 5 mm mycelium disk, followed by shaking at 120 rpm/min at 28 °C for 7 d. Next, spores in cultured solution were dispersed with a 84-1A magnetic agitator (Sile, Shanghai, China) at a speed of 500 rpm/min and filtered with three layers of gauze. The 50 μL filtrate was transferred to a blood cell-counting plate to calculate the number of spores using a CX23 optical microscope (Puch, Shanghai, China).
2.4. T-2 Toxin-Producing Ability Analysis
A 1L GYM liquid medium (N source removed, containing 0.2 g KCl, 0.2 g MgSO4·7H2O, 10 g glucose, 5 g yeast extract, 1 mL 0.005 g/L CuSO4·5H2O, 1 mL 0.01 g/L ZnSO4·7H2O) containing 5 mg/mL each of 18 AAs were prepared. The control group used a GYM liquid medium with original N source and without AA addition. A 1 mL GYM solution was added into a 2 mL centrifuge tube. Next, wild-type Fo17, ΔFoTap42 and ΔFoTap42-C were inoculated into the GYM medium with two 5 mm mycelium disks and cultured at 28 °C for 14 d. After culturing, the solution was centrifuged (Xiangyi, Changsha, China) at 5000 rpm for 10 min, the supernatant was collected, 1 mL ethyl acetate was added and the solution was mixed using a XW-80A vortex (Fudi, Fuzhou, China) for 5 min. The supernatant was collected and dried at 60 °C in N. Next, 1 mL 30% methanol was added to redissolve it; then, it was filtered with a 0.22 μm filter and T-2 was detected by LC-MS/MS.
Toxin analysis was performed on a Thermo Scientific Surveyor HPLC (Thermofisher, Waltham, MA, USA)system which comprised a Surveyor MS Pump Plus, an on-line degasser and a Surveyor Autosampler Plus coupled with a Thermo TSQ Quantum Access tandem mass spectrometer equipped with an electrospray ionization (ESI) source (Thermofisher, Waltham, MA, USA). The separation was performed at 35 °C using a Hypersil GOLD column (5 μm, 100 mm × 2.1 mm) (Thermofisher, Waltham, MA, USA) at a flow rate of 0.25 mL/min. The mobile phase consisted of methanol (A) and water containing 5 mM ammonium acetate 0.1% formic acid (B), with a gradient elution program as follows: 0 min 30% A, 3.0 min 90% A, 5 min 90% A and 3 min 30% MS/MS detection was carried out using a triple quadruple mass spectrometer coupled with an electrospray ionization source operating in positive (ESI+) mode (Shimadzu, Kyoto, Japan). The ionization source parameters were set as follows: spray voltage, 4500 V; sheath gas pressure, 35 au; ion sweep gas pressure, 0 au; auxiliary gas pressure, 15 au; capillary temperature, 350 °C; tube lens offset, 118 V; skimmer offset, 0; collision energy, 1.5 eV; and collision pressure, 1.5 mTorr.
2.5. T-2 Synthesis and Tri5 Expression Dose-Response Relationship Analysis
The 50 mL GYM liquid medium (N source removed) containing 10, 30, 50 or 70 mg/mL of L-Thr, L-His and L-Asp was prepared, and the F. oxysporum Fo17, ΔFoTap42 and ΔFoTap42-C were inoculated into a 1 mL GYM medium with a 5 mm mycelium disk. Next, the samples were cultured at 28 °C and centrifuged at 120 rpm/min for 14 days. Then, the culture solution was treated as explained in Section 2.4, and T-2 was detected by LC-MS/MS.
The 25–50 mg (dry weight) cultured mycelia of Fo17, ΔFoTap42 and ΔFoTap42-C were weighed and ground into powder with liquid N. Total RNA was extracted using a Spin Column Fungal Total RNA Purification Kit (Sangon Biotech, Shanghai, China). Purity and concentration were determined by a nucleic acid quantitative analyzer (Thermofisher, Waltham, MA, USA). A StarScript II First-strand cDNA Synthesis Kit (Genstar, Beijing, China) was used to transcribe RNA into cDNA. The HATri/F (5-CAGATGGAGAACtGGATGGT-3) and HATri/R (5-GCACAAGTGCCACGTGAC-3) were used as primer pairs, and the β-Tubulin/F (TTCCCCCGTCTCCACTTCTT) and β-Tubulin/R (GACGAGATCGTTCATGTTG) were used as the internal control gene primers. The reaction system of the qRT-PCR mixture was prepared as a 10 μL reaction (containing 5 μL 2× SYBR Green Supermix, 0.4 μL of each pair of primers (10 μM), 0.2 μL ROX Reference Dye, 1.0 μL cDNA and 3.0 μL PCR-certified water). The amplification reaction cycling procedure was as follows: 5 min at 95 °C, followed by 40 PCR cycles of 10 s at 95 °C for denaturation and 30 s at 60 °C for annealing and elongation. The melting curve analysis consisted of 3 s at 60 °C, followed by heating up to 95 °C with a ramp rate of 1 °C/3 s. If the melting curves showed a clear single peak, it meant the primers were specific. The experiment was conducted for each sample in triplicate. Based on the PCR reaction’s CT value, Tri5 expression was analyzed by the 2−ΔΔCt method.
2.6. TORC1-Tap42 Interacting Protein Analysis
2.6.1. Construction of Tap42 Expression Vector
Based on the NCBI website (https://www.ncbi.nlm.nih.gov/, accessed on 27 May 2022) for the Tap42 sequence and related protein sequence, analyzed the protein signal peptide to obtain the corresponding base sequence. The Tap42 template was synthesized by chemical synthesis and cloned into a pET-28a(+) (3228 bp) expression vector by the BamHI-XhoI double enzyme digestion method. The constructed expression vector was transformed into a Top10 E. coli clone, coated on an agar plate (containing 30 μg/mL kanamycin) and cultured overnight at 37 °C. A single cloned strain with the correct sequence was selected. A 100 μL sample of Rossetta (DE3) competent cells was mixed with 10 μL pET28a(+)-TAP42 plasmid, bathed in ice for 30 min, quickly heated at 42 °C for 90 s and placed in an ice bath for 5 min. The solution was coated on LB medium (containing 50 μg/mL kanamycin) and cultured at 37 °C for 14 h. Monoclones were selected for the induction culture. The cloned strain was cultured at 37 °C for 200 mL until the OD 600 was 0.6–0.8. IPTG was added to the medium for induction at 16 °C for 24 h and centrifuged at 5000 rpm for 5 min. The supernatant was filtered by a 0.22 μm filter and then enriched by Ni column affinity chromatography.
2.6.2. Protein Purification by Ni Column Affinity Chromatography
A binding buffer (0.02 M Na2HPO4, 0.5 M NaCl, pH = 7.4) was used to balance the Ni column, with a flow rate of 3 mL/min. The supernatant, collected in Section 2.6.1, was purified using a AKTA purifier (Explorer 10, Cytiva, Sweden). After sample loading, in order to remove the impurities, the Ni column was washed with buffer (0.02 M NaH2PO4, pH = 7.4, 0.5 M NaCl, 20 mM 1-(p-Toluenesulfonyl) imidazole) until the UV signal returned to the baseline. Elusion buffer (0.02 M Na2HPO4, 0.5 M NaCl, 500 mM 1-(p-Toluenesulfonyl)imidazole, pH = 7.4) was used to wash the Ni column until the sample was eluted. The samples were collected for SDS-PAGE expression.
2.6.3. Co-Immunoprecipitation Analysis
(1) Sample treatment: The cultured mycelia were washed with precooled 0.01 M PBS 3 times and centrifuged at 12,000 rpm for 1 min each time to collect the mycelia. Liquid N was used to grind it into a powder; then, it was redissolved in 1 mL IP lysis, centrifuged at 12,000 rpm for 2 min to collect the supernatant and, finally, collected on ice. (2) Next, we prepared 100 μL Ni beads in triplicate, centrifuged them at 12,000 rpm and 4 °C for 1 min and removed the supernatant. Then, we added 800 μL IP lysate, centrifuged it at 12,000 rpm and 4 °C for 1 min and removed the supernatant. This step was repeated 3 times, and the final supernatant was resuspended in 200 μL IP lysate. (3) The 10 μg of Tap42 protein was prepared by adding it into the solution and incubating at 4 °C for 60 min, followed by dividing the solution into one tube. The sample supernatant prepared in step (1) was added to the tube, incubated at 4 °C for 1 h and centrifuged at 2000 rpm at 4 °C for 1 min to remove the supernatant. Next, 1.6 mL IP lysate was added and centrifuged at 2000 rpm 4 °C for 1 min to remove the supernatant. This step was repeated five times. (4) A 30 μL sample of 1× loading buffer was added into the sample tube and boiled at 100 °C for 10 min. Next, the sample was stored at −80 °C for further studies.
2.6.4. Sodium Dodecyl Sulfate-Polyacrylamide Gel Electrophoresis (SDS-PAGE)
The samples (from procedure Section 2.6.3) were defrosted and centrifuged at 12,000 rpm at 4 °C for 10 min. The supernatant was mixed with one volume of load buffer (187.5 mM Tris (pH 6.8), 6% SDS, 30% glycerol and 15% β-mercaptoethanol) and heated at 98 °C for 5 min to completely denature the proteins (as sample solutions for SDS-PAGE). Polyacrylamide gels (6%) were prepared in Bio-Rad chambers (separation gel: 2.5 μL (acrylamide 30%, bisacrylamide 0.8%), 1.5 μL Tris-HCl (1.5 M pH 8.8), 52.5 μL 10% SDS, 955 μL distilled water, 150 μL PSA, and 7.5 μL TEMED; stacking gel: 312 μL (acrylamide 30%, bisacrylamide 0.8%), 450 μL Tris-HCl (0.5 M pH 6.8), 1.0 μL distilled water, 50 μL PSA and 4.0 μL TEMED). The electrophoresis chamber was filled with running buffer (1.44% glycine, 0.3% Tris, and 0.1% SDS). Next, the sample solutions (10 μL) and 10 μL of protein marker were loaded onto the gel. Gel electrophoresis was performed at a constant voltage of 50 V until the sample reached the separation gel, at which point the voltage was increased to 100 V. The gels were stained with a Protein Stain Q Kit (Sangon Biotech, Shanghai, China). Gel images were processed using the Image lab Software (version 6.01, BioRad, Hercules, CA, USA), adjusting the gamma setting to improve the contrast.
2.6.5. LC-MS/MS Analysis of Tap42 Interacting Proteins
The electrophoretic target band was cut, transferred into a 50 mL centrifuge tube and rinsed twice with ultrapure water; then, a mixture of 25 mM NH4HCO3 and 50% acetonitrile was added to decolorize for 30 min. To the extracted discolored solution, a dehydrated solution 1 of 50% acetonitrile was added and let stand for 30 min; then, it was sucked out and the dehydrated solution 2 of absolute ethyl alcohol was added and let stand for 30 min. The target band was freeze-dried in a vacuum (Xiangyi, Changsha, China) at −20 °C for 2 h to obtain a lyophilized gel block, 50 μL reductive solution 1 was added (10 mM DTT, 25 mM NH4HCO3) and it was left to stand in a bath at 57 °C for 1 h. Next, the solution was removed, 50 μL reductive solution 2 was added (50 mm iodoacetamide, 25 mM NH4HCO3), it was placed at room temperature (RT) for 30 min and then the solution was removed. For 10 min, 10% ethyl alcohol was added and the solution was removed. Then, the dehydrated solution 1 was added for 30 min, it was removed and the dehydrated solution 2 was added for 30 min. The dehydrating solution 2 was removed and 10 μL enzymatic hydrolysate was added (25 mM NH4HCO3 containing 0.02 μg/μL trypsin) to hydrolyze overnight at 37 °C. Next, the solution was centrifuged at 12,000 rpm for 2 min to obtain the supernatant for protein analysis. A Thermofisher QE Orbitrap high field electrostatic field orbital trap mass spectrometer (Thermofisher, Waltham, MA, USA) was used to detect the interacting proteins. The first-order spectrum scanning range was 350–1600 m/z; the second-order mass spectrometry mode was CID (Elite). A new protein library was constructed using the theoretical amylase sequence. The main search parameters were as follows: (1) immobilization modification: carbomimomethyl on Cys; (2) variable modification: oxidation on Met, acetylation on protein N-terminal; (3) allowable error of parent ion of peptide: 10 ppm; (4) allowable error of fragment ion: 0.6 Da.
2.7. Statistical Analysis
All experiments were conducted three times in parallel. The data were expressed as mean ± standard deviation (SD) and statistically analyzed by IBM SPSS statistics software (Version 26.0, BioRad, Hercules, CA, USA). Significant differences between the control and the treated fish were determined by one-way analysis of variance (ANOVA), followed by the Tukey’s test to compare the control and treatment group values. A p-value of <0.05 was considered significant.
3. Results and Discussion
3.1. Effects of AAs on Colony Growth of F. oxysporum Regulated by Tap42
Rapamycin-sensitive TORC1 protein kinase is an important component of a conserved signal-cascading mechanism which controls cellular absorption and the response of AAs to regulate fungal growth, metabolism and pathogenicity [36]. The Tap42 gene is the key regulator to absorb and metabolize AAs for fungi. The effects of AAs on the colony morphology of Fo17, ΔFoTap42 and ΔFoTap42-C are shown in Figure 1. On PDA medium, Fo17 grew normally with several aerial hyphae, while ΔFoTap42 grew relatively slowly with fewer aerial hyphae. Colony morphology recovered to normal conditions following Tap42 supplementation. The L-His, L-Leu, L-Pro, L-Thr and L-Tyr additions as nitrogen sources significantly activated the growth of Fo17, with larger hyphal diameters but fewer mycelia in the 7-d culture. The colony was significantly smaller in ΔFoTap42, especially in the L-Try and L-Tyr media. This may be because the Tap42 target-regulated the absorption of L-Try and L-Tyr, while a lack of Tap42 decreased the response of the TORC1 pathway, which resulted in growth inhibition. In the L-Val medium, the colony of ΔFoTap42 was smaller, with radial mycelia, but recovered to the normal level in ΔFoTap42-C. Sulfur-containing (L-Cys, L-Met) and acidic (L-Asp, L-Glu) AAs significantly inhibited the growth of Fo17, ΔFoTap42 and ΔFoTap42-C, which indicated that the absorption of these two AAs was not regulated by Tap42. Supplementation with L-Cys and L-Met resulted in less mycelial growth, while L-Asp and L-Glu caused thicker hemispherical mycelia. These results are in accordance with Shiobara et al. [26], who reported an inhibitory effect of L-Met and L-Cys on Fusarium grainei growth. Hence, S-containing AAs can be used as mycotoxin antidotes [37] and fungal inhibitors [38] because the sulfhydryl groups prevent normal fungal growth and metabolism. The L-Asp and L-Glu were not conducive to Fo17 and ΔFoTap42 growth, possibly because acidic AAs significantly decreased the pH of the medium. F. oxysporum Fo17 prefers growth at pH > 6 (unpublished data).
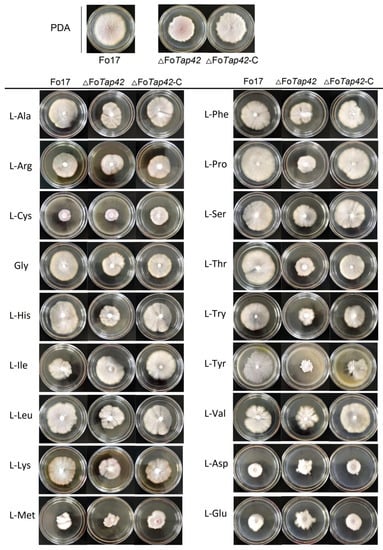
Figure 1.
Colony morphology of wild-type F. oxysporum Fo17, ΔFoTap42 and ΔFoTap42-C in dextrose agar medium, supplemented with 18 amino acids cultured for 7 d at 28 °C (n = 3). Control was cultured in the PDA medium.
3.2. Effect of AAs on Spore Production and T-2 Synthesis of F. oxysporum Regulated by Tap42
The spore production and T-2 synthesis of F. oxysporum Fo17, ΔFoTap42 and ΔFoTap42-C were significantly different and regulated by AAs (Table 1). Compared to the control group (CDA medium), the spore production of Fo17 in the L-Arg, L-Lys, L-Met, L-Phe and L-Pro groups were significantly elevated (p < 0.05), especially in the L-Lys group (22.30 × 10⁵ CFU/L, p < 0.05), but were decreased in the L-Asp, L-Cys, L-Gly, L-Leu, L-Thr, L-Try and L-Val groups, with values ranging from 3.14–7.50 × 10⁵ CFU/L. Following Tap42 deletion, the spore production of ΔFoTap42 significantly decreased (p < 0.05) in most groups with added AAs. In contrast, L-Arg, L-Ile, L-Lys, L-Met, L-Phe and L-Pro addition significantly increased (p < 0.05) the spore production of Fo17. This was most evident in the L-Ile- and L-Pro-added groups, especially the ΔFoTap42, with values ranging from 35.80–36.26 × 10⁵ CFU/L. Non-polar AAs such as L-Ile and L-Pro are generally hydrophobic, which is not conducive for the absorption of pathomycetes such as Fusarium sp.; thus, the speed of fungal growth and spore production is limited [39]. The spore production of Fusarium sp. Was positively regulated by Tap42 in both the control and most AA-added groups, except L-Asp, Gly, L-Thr and L-Val. Alfatah et al. [40] reported that, in a nutrient-dependent developmental state, Tap42-Sit4-Rrd1/Rrd2 signaled for the regulation of spore germination, while Tap42 deletion inhibited the TORC1 pathway and blocked spore germination. Therefore, a lack of Tap42 leads to inactivation of a part of TORC1 function, as well as an inability to respond to glucose and other exogenous AAs, resulting in reduced sporulation.

Table 1.
Effects of 18 amino acids as nitrogen sources in T-2 toxin and spore production by F. oxysporum Fo17, ΔFoTap42 and ΔFoTap42-C.
The T-2 toxin production of Fo17 was 22.86 ng/mL in the control group (GYM medium), which increased in ΔFoTap42 (30.82 ng/mL). When supplemented with Tap42, the T-2 production returned to normal. Contrary to the spore production capacity, this result indicated that a lack of the Tap42 gene can induce T-2 synthesis of F. oxysporum. Targeted gene deletion has a significant effect on fungal metabolism, and sometimes will specifically activate other metabolism pathways. He et al. [1] reported that inactivation of TORC1-Tap42 leads to autophagy in yeast. The addition of neutral AAs, such as L-Ile, L-Leu and L-Ser, increased T-2 production of Fo17, with values reaching up to 28.49, 27.07 and 29.61 ng/mL, respectively. Similarly, L-Phe, L-Pro and L-Cys significantly activated (p < 0.05) the T-2 production in Fo17, with values up to 30.49, 30.95 and 33.64 ng/mL, respectively (p < 0.05). However, acidic AAs L-Asp and L-Glu, as N sources, significantly decreased (p < 0.05) the T-2 toxin-production in Fo17 to 14.87 and 12.64 ng/mL, respectively (p < 0.05). After Tap42 deletion, the T-2 production was significantly decreased (p < 0.05) to 6.68 and 2.09 ng/mL. Thus, acidic AAs were not conducive to F. oxysporum growth and secondary metabolism, and sporulation was the main path to survival. However, the inhibition of toxin production does not mean toxicity reduction. When pathogenic fungi are exposed to pH stress, AAs are used for biotransformation and to drive environmental alkalinization for growth. Candida albicans uses AAs as the sole N source to raise the environmental pH from 4 to neutral within 6–8 h, which is another critical pathogenicity trait [41].
Compared with Fo17, the T-2-producing capacity of ΔFoTap42 was significantly increased (p < 0.05) by L-His and L-Val addition, which indicates that Tap42 negatively regulates L-His and L-Val absorption. The L-Asp and L-Glu addition significantly inhibited the T-2 synthesis by ΔFoTap42 to only 6.68 and 2.09 ng T-2/mL, respectively (p < 0.05). L-Ala, L-Arg, L-Cys, Gly, L-Leu, L-Pro, L-Ser, L-Thr and L-Try addition as N sources also reduced the T-2 production by ΔFoTap42, which may be due to a lack of AA absorption and metabolism by the corresponding pathway gene (Tap42), resulting in a decline in T-2 production. A similar result was reported by Phasha et al. [42], who similarly demonstrated that the Ras2 gene can control growth and toxin synthesis of F. circinatum though encoding mitogen-activated protein kinase.
As shown in Figure 2, heat map analysis showed the effect patterns of AAs on sporulation and T-2 production by Fo17, ΔFoTap42 and ΔFoTap42-C. During sporulation, L-Ile and L-Pro groups clustered closely together, showing significantly activated (p < 0.05) spore production of ΔFoTap42, but a reduction in ΔFoTap42-C, which indicates that Tap42 negatively regulated L-Ile and L-Pro absorption and, thereby, affected the F. oxysporum spore formation. In contrast, in the L-His and L-Ser groups, the spore production of ΔFoTap42 was lower than in Fo17 and ΔFoTap42-C, meaning that Tap42 positively activated L-His and L-Ser absorption in F. oxysporum. When a lack of a regulated gene markedly reduces spore production, it indicates a decrease in reproductive dispersal capacity. The L-Ala group clustered with the control group means that L-Ala addition did not significantly affect the spore production of Fo17, ΔFoTap42 or ΔFoTap42-C (Figure 2A). L-Asp and L-Glu addition inhibited T-2 production by Fo17, and a lack of Tap42 significantly inhibited the T-2 production (<20 ng/mL). This is because acidic AAs negatively regulated the pathogenicity of Fusarium spp.. The L-His, L-Val, L-Lys and L-Met groups clustered together, and the T-2 production was significantly increased when Tap42 was lacking (Figure 2B).
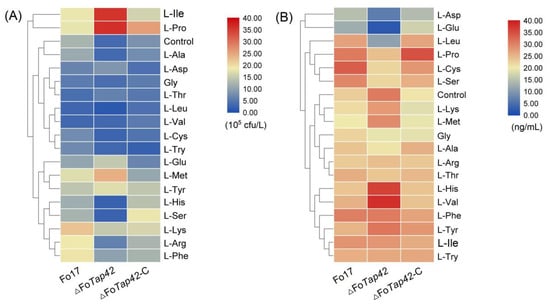
Figure 2.
Changed patterns of sporation (A) and T-2 synthesis (B) by F. oxysporum Fo17, ΔFoTap42 and ΔFoTap42-C exposed to 18 amino acids as nitrogen sources (n = 3). Control was cultured in CDA and GYM media.
3.3. Dose-Effect Relationship between L-Thr, L-His and L-Asp on T-2 Toxin Synthesis by F. oxysporum Regulated by Tap42
Tri5 is the initiating gene of trichothecene synthesis, and plays an important role in Fusarium spp. pathogenicity [43]. In this study, neutral (L-Thr), basic (L-His) and acidic (L-Asp) AAs were selected to assess the effect on T-2 synthesis and Tri5 expression. Increasing L-Thr in the GYM medium significantly activated the T-2 production of Fo17, ΔFoTap42 and ΔFoTap42-C (p < 0.05) with the concentrations of T-2 at 70 mg/mL L-Thr, 13.86, 16.87 and 13.85 ng/mL, respectively. Compared with the control group, a significant increase (p < 0.05) in Tri5’s expression of Fo17 was observed in the 50–70 mg/mL L-Thr groups. ΔFoTap42 showed a marked activation of Tri5 expression in the 10–70 mg/mL L-Thr groups. When complemented with the Tap42 gene, the Tri5 expression was significantly increased (p < 0.05), but only in the 70 mg/mL L-Thr group (Figure 3A). Similarly, 10–70 mg/mL L-His addition significantly increased (p < 0.05) the T-2 production of Fo17, ΔFoTap42 and ΔFoTap42-C, with the T-2 concentrations reaching 33.03, 31.66 and 32.75 ng/mL, respectively, in the 70 mg/mL L-His added group. However, the Tri5 expression of Fo17 increased, but the increase in amplitude of ΔFoTap42 and ΔFoTap42-C were lower than in Fo17 (Figure 3B). In the L-His group, higher T-2 production and lower Tri5 expression were observed in ΔFoTap42, which may due to the lack of the TORC1-Tap42 gene, thus reducing the sensitivity to L-His and, therefore, reducing Tri5 signal transduction. However, T-2 synthesis is not only regulated by Tri5. Multiple trichothecene synthetic gene clusters, such as three P450 oxygenase genes, Tri4, Tri11 and Tri13 [44]; esterase gene Tri8 [45]; and acetyltransferase genes Tri3 and Tri7 [46] also affect T-2 synthesis. Conversely, 10 mg/mL L-Asp addition significantly increased (p < 0.05) T-2 production and Tri5 expression, while L-Asp addition gradually reduced T-2 production and Tri5 expression in Fo17, ΔFoTap42 and ΔFoTap42-C, which indicated that a low dosage of L-Asp led to a significant increase in the growth and T-2 production of F. oxysporum, whereas a high dosage reduced this effect. An inhibitory effect of Tri5 expression was detected in ΔFoTap42 following the addition of 70 mg/mL L-Asp. Thus, acidic AA L-Asp showed a significant reduction in Fusarium sp. growth and metabolism at a relatively high dose (Figure 3C). The inhibitory effect of L-Asp has been well-studied and applied for fungal inhibition in food products. Bitu et al. [47] used L-Asp combined with Th (IV) and Zr (IV) ions to synthesize new peroxo complexes, and demonstrated high antibacterial activity in Aspergillusflavus, Penicillium sp., Candida sp. and Aspergillus niger. Thus, based on its excellent antifungal properties, L-Asp can be used as an additive in the development of natural preservatives.
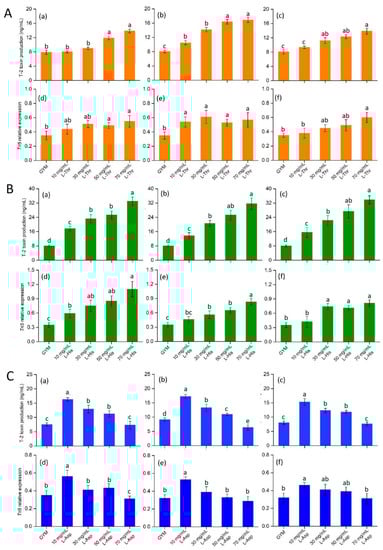
Figure 3.
Effects of L-Threonine (L-Thr) (A), L-Histidine (L-His) (B) and L-Aspartic acid (L-Asp) (C) on T-2 toxin production and Tri5 expression of different strains (n = 3), cultured at 28 °C for 14 d. The control was cultured in GYM medium. (a)–(c): T-2 toxin production of wild-type Fo17, ΔFoTap42 and ΔFoTap42-C; (d)–(f): Tri5 expression of wild-type Fo17, ΔFoTap42 and ΔFoTap42-C. Different letters “a–d” in the same plot indicate significant differences (p < 0.05).
3.4. L-Thr, L-His and L-Asp Activated Tap42 Interacting Proteins and Metabolic Pathways
A Tap42 expression vector was constructed using BamHi-XhoI restriction enzyme digestion. Two bands (3359 bp and 5192 bp) were observed in the pET-28a (+) plasmid vector after PCR amplification, indicating that the target gene, Tap42, was cloned into the expression vector (Figure 4A). Through comparative analysis, the pET28a(+)-Tap42 expression vector was found to be ~140 kDa. E. oil was transformed with the correctly identified positive clone plasmid, and single bacterial colonies were selected for induction expression. The results of SDS-PAGE electrophoresis are shown in Figure 4B. The recombinant strain induced by IPTG showed a fusion protein, pET28a(+)-Tap42, with a target band of ~140 kDa (electrophoretic band 2–4), but not the non-induced strain (electrophoretic band 1). A purified protein (~140 kDa) was obtained after washing and eluting the protein (electrophoretic band 3) (Figure 4C). Based on SDS-PAGE, no significant interacting proteins of Fo17 were detected in the GYM medium (electrophoretic band 1). In the L-His group, clear protein bands were detected at ~10 and 39–43 kDa (electrophoretic band 2). In the L-Thr group, as well, clear protein bands were evident at ~10, 27 and 39–52 kDa (electrophoretic band 3). In the L-Asp group, bands were found at ~10, 27 and 39–52 kDa (electrophoretic band 4) (Figure 4D).
Figure 4.
(A) PCR amplification analysis of a plasmid digested by the XbaI-XhoI enzyme. A1: plasmid; A2: XbaI-XhoI digestion plasmid; M: DNA marker. (B) Prokaryotic expression of pET28a(+)-Tap42 fusion protein. B1: protein not induced by IPTG, B2-B4: clone 1–3 protein induced by IPTG. (C) Purification of pET28a(+)-Tap42 fusion protein. M: marker; C1: unpurified protein; C2: washed protein; C3: eluted protein; M: molecular protein marker. (D) Co-immunoprecipitation products of Tap42 protein identified by SDS-PAGE. D1: GYM control group, D2: L-Histidine (L-His)-treated group, D3: L-Threonine (L-Thr)-treated group; D4: L-Aspartic acid (L-Asp)-treated group, M: molecular protein marker.
By Q Exactive LC-MS/MS analysis, 172, 201 and 89 potential interacting proteins of Tap42 were detected in the L-Thr, L-His and L-Asp treatment groups, respectively. A total of 86 interacting proteins co-existed in the three treatment groups. In the L-Thr and L-His groups, 84 similar interacting proteins were detected. However, only 1 and 2 interacting proteins from the L-Thr and L-His groups were similar to those observed in the L-Asp group (Figure 5). Based on mass analysis, the common potential interacting proteins with Tap42 treatment after L-Thr, L-His and L-Asp treatments were mostly DNA topoisomerase 2, glyceraldehyde-3-phosphate dehydrogenase 2, heat shock 70 kDa protein, elongation factor 1-alpha, actin, plasma membrane ATPase, enolase, transaldolase and ATP-dependent RNA helicase and citrate synthase (Table 2). Comparative analysis showed that the L-His and L-Asp groups specifically activated the ribosome-associated molecular chaperone SSB1, regulated by SSB1, and phosphoglycerate kinase regulated by pgkA, respectively. In the L-Thr and L-His groups, pyruvate decarboxylase regulated by pdcA was markedly activated. L-His specifically activated the Tubulin alpha-B chain regulated by tba-2 (Table 3). DNA topoisomerases were the enzymes mostly responsible for the encapsulation of double-helix DNA and the transcription of proteins, and were shown to play an important role in the growth and metabolism of fungi [48]. Candida albicans and Aspergillus niger have high levels of both type I and type II topoisomerases, and increase pathogenicity by converting cellular proteins [49]. Therefore, the inhibition of DNA topoisomerases activity is also an important target of antifungal drugs [50]. Glyceraldehyde 3-phosphate dehydrogenase is an enzymatic protein highly related to the catalyzation of oxidation (dehydrogenation) and phosphorylation of glyceraldehyde 3-phosphate to generate 1, 3-diphosphate glyceric acid, which is the central link to the glycolytic pathway and, hence, plays an important role in glycometabolism [43]. In addition, Tap42-related enolase and pyruvate decarboxylase are important enzymes in the glycolytic pathway, and play important roles in maintaining cell wall protection and fungal pathogenicity [51]. The interaction of Tap42 with these enzymatic proteins cultured in GYM medium indicates that the growth and metabolism of Fusarium firstly utilize glucose through the glycolytic pathway to acquire energy.
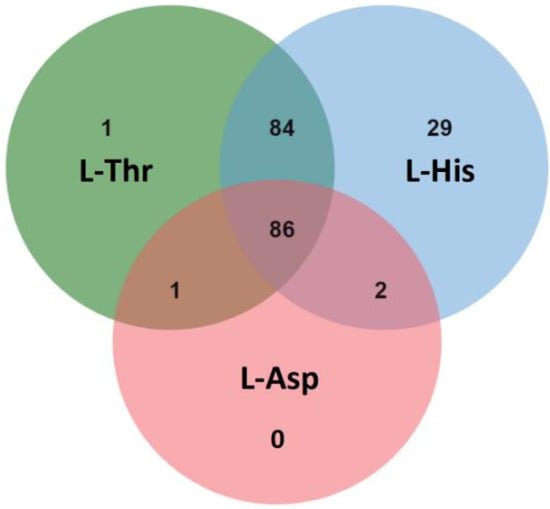
Figure 5.
The common and specific numbers of potential Tap42-interacting proteins in F. oxysporum following L-threonine (L-Thr), L-Histidine (L-His) and L-Aspartic acid (L-Asp) treatments (n = 3).
Table 2.
Common potential interacting proteins of the Tap42 immunoprecipitation products treated by L-Thr, L-His and L-Asp, identified by mass spectrometry.
Table 3.
Proteins of F. oxysporum potentially interacting with Tap42, activated by specific amino acids.
According to KEGG enrichment analysis, Tap42-interacting proteins were mostly derived from metabolism, genetic information processing, cellular processes and environmental information processing. Most of the interacting proteins came from the metabolic pathways, mainly from glycerophospholipid metabolism, pentose phosphate pathway, glyoxylate and dicarboxylate metabolism, glycolysis, gluconeogenesis, methane metabolism and glutathione metabolism. The related secondary metabolic pathways were galactose metabolism, fatty acid biosynthesis, fatty acid degradation, steroid biosynthesis, phenylalanine metabolism, one carbon pool by folate, citrate cycle, TCA cycle and oxidative phosphorylation (Figure 6).
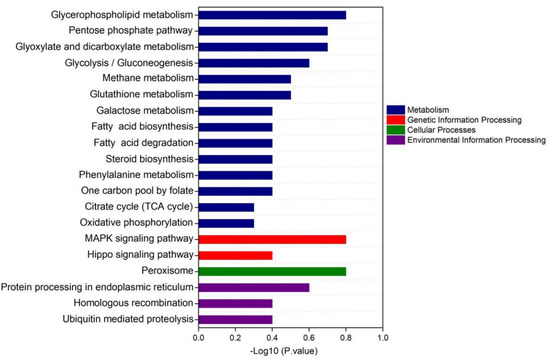
Figure 6.
The KEGG enrichment analysis of the signaling pathway of Tap42, potentially interacting with proteins of F. oxysporum Fo17 cultured with L−threonine (L−Thr), L−Histidine (L−His) and L−Aspartic acid (L−Asp) (n = 3).
KEGG enrichment analysis showed that the proteins potentially interacting with Tap42 were from the mitogen-activated protein kinase (MAPK) signaling pathway and Hippo signaling pathway. The MAPK signaling pathway is composed of mitogen-activated protein kinase, which is involved in the intracellular signal regulation system and can be activated by different extracellular stimuli, such as cytokine neurotransmitter hormones, cell stress and cell adhesion [52,53]. Many reports have shown that the MAPK pathway is significantly associated with the regulation of the TORC1 pathway [54]. The Hippo signaling pathway mainly inhibits cell growth and regulates cell proliferation, apoptosis and stem cell self-renewal [55]. Recent studies have shown that the Hippo signaling pathway is closely related to cancer genesis, tissue regeneration and stem cell function regulation [56]. Identification of the associated signaling pathway provides a theoretical basis for the further exploration of the interaction network of Fusarium pathogenicity when exposed to different amino acid conditions, and also provides important information for the further control of fungal contamination in high-protein fermented foods.
4. Conclusions
Exposure to free AAs (as N sources) showed a significant effect on the growth and metabolism of F. oxysporum regulated by Tap42. The absorption of L-Ile and L-Tyr was regulated by Tap42. Acidic (L-Asp, L-Glu) and S-containing (L-Cys, L-Met) AAs were not conducive to F. oxysporum growth, and were not regulated by Tap42. The addition of L-Ile and L-Pro activated sporulation in ΔFoTap42, but this was negatively regulated by Tap42, while L-His and L-Ser inhibited sporulation in ΔFoTap42, which was positively regulated by Tap42. Acidic AA showed a remarkable inhibitory effect on T-2 toxin production positively regulated by Tap42. Neutral (L-Thr) and alkaline (L-His) AAs significantly activated the T-2 synthesis and Tri5 expression of Fusarium, while L-Asp showed an inhibitory effect at relatively high doses. The co-immunoprecipitation analysis showed that the interacting proteins of Tap42 were activated by L-The, L-His and L-Asp control metabolism; genetic information processing; cellular processes and environmental information processing. L-Asp inhibited the effects on Fusarium spp. growth and metabolism, and, thus, could be used as an inhibitor to further control fungal contamination in fermented foods.
Author Contributions
Conceptualization, formal analysis and writing—original draft, Y.D.; supervision, project administration and formal analysis, R.W.; validation, Y.Z.; funding acquisition, J.L.; editing and supervision, R.G. All authors have read and agreed to the published version of the manuscript.
Funding
This research was funded by the National Science Foundation of China (32202134; 32201929), China Postdoctoral Science Foundation (2022M712625) and 2021 and 2022 Chongqing Postdoctoral Special Funding Project.
Data Availability Statement
All related data and methods are presented in this paper. Additional inquiries should be addressed to the corresponding author.
Conflicts of Interest
The authors declare no conflict of interest.
References
- He, C.; Yorimitsu, T.; Klionsky, D.J.; Wang, K. Tap42-associated protein phosphatase type 2A negatively regulates induction of autophagy. Autophagy 2009, 5, 616–624. [Google Scholar]
- Wang, Y.B.; Li, F.; Chen, J.; Sun, Z.H.; Wang, F.F.; Wang, C.; Fu, L.L. High-throughput sequencing-based characterization of the predominant microbial community associated with characteristic flavor formation in Jinhua Ham. Food Microbiol. 2021, 94, 103643. [Google Scholar] [CrossRef] [PubMed]
- Zhao, Y.; Wang, Y.Q.; Li, C.S.; Li, L.H.; Yang, X.Q.; Wu, Y.Y.; Chen, S.J.; Zhao, Y.Q. Novel insight into physicochemical and flavor formation in naturally fermented tilapia sausage based on microbial metabolic network. Food Res. Int. 2021, 141, 110122. [Google Scholar] [CrossRef] [PubMed]
- Gallego, M.; Mora, L.; Escudero, E.; Toldr, F. Bioactive peptides and free amino acids profiles in different types of European dry-fermented sausages. Int. J. Food Microbiol. 2018, 276, 71–78. [Google Scholar] [CrossRef] [PubMed]
- Shi, Y.A.; Li, X.; Huang, A.X. A metabolomics-based approach investigates volatile flavor formation and characteristic compounds of the dahe black pig dry-cured ham. Meat Sci. 2019, 158, 107904. [Google Scholar] [CrossRef] [PubMed]
- Wu, K.; Xie, J.H.; Wang, Q.Q.; Ling, M.J.; Wu, J.Z. Effect of Monascus fermentation on aroma patterns of semi-dried grass carp. Food Nutr. Sci. 2019, 10, 923–936. [Google Scholar]
- Yang, D.D.; He, Z.Y.; Gao, D.M.; Qin, F.; Deng, S.L.; Wang, P.; Xu, X.L.; Chen, J.; Zeng, M.M. Effects of smoking or baking procedures during sausage processing on the formation of heterocyclic amines measured using UPLC-MS/MS. Food Chem. 2019, 276, 195–201. [Google Scholar] [CrossRef] [PubMed]
- Adekoya, I.; Obadina, A.; Phoku, J.; Nwinyi, O.; Njobeh, P. Contamination of fermented foods in Nigeria with fungi. LWT-Food Sci. Technol. 2017, 86, 76–84. [Google Scholar] [CrossRef]
- Meftah, S.; Abid, S.; Dias, T.; Rodrigues, P. Effect of dry-sausage starter culture and endogenous yeasts on Aspergillus westerdijkiae and Penicillium nordicum growth and OTA production. LWT-Food Sci. Technol. 2018, 87, 250–258. [Google Scholar] [CrossRef]
- Adeyeye, S.A.O.; Yildiz, F. Quality and safety assessment of sun dried meat product (kundi) from Ibadan, Oyo state, Nigeria. Cogent Food Agr. 2016, 2, 1209074. [Google Scholar] [CrossRef]
- Wen, R.X.; Li, X.A.; Han, G.; Chen, Q.; Kong, B.H. Fungal community succession and volatile compound dynamics in Harbin dry sausage during fermentation. Food Microbiol. 2021, 99, 103764. [Google Scholar] [CrossRef] [PubMed]
- Cendoya, C.; Chiotta, M.L.; Zachetti, V.; Chulze, S.N.; Ramirez, M.L. Fumonisins and fumonisin-producing Fusarium occurrence in wheat and wheat by products: A review. J. Cereal Sci. 2018, 80, 158–166. [Google Scholar] [CrossRef]
- Nathanail, A.V.; Varga, E.; Meng-Reiterer, J.; Bueschl, C.; Michlmayr, H.; Malachova, A.; Fruhmann, P.; Jestoi, M.; Peltonen, K.; Adam, G.; et al. Metabolism of the Fusarium mycotoxins T-2 toxin and HT-2 toxin in wheat. J. Agric. Food Chem. 2015, 63, 7862–7872. [Google Scholar] [CrossRef]
- Gilbert, J.; Clear, R.M.; Ward, T.J.; Gaba, D.; Tekauz, A.; Turkington, T.K.; Woods, S.M.; Nowicki, T.; O’Donnell, K. Relative aggressiveness and production of 3- or 15-acetyl deoxynivalenol and deoxynivalenol by Fusarium graminearum in spring wheat. Can. J. Plant Pathol. 2010, 32, 146–152. [Google Scholar] [CrossRef]
- Chaudhari, M.; Jayaraj, R.; Santhosh, S.R.; Rao, P.V.L. Oxidative damage and gene expression profile of antioxidant enzymes after T-2 toxin exposure in mice. J. Biochem. Mol. Toxic. 2009, 23, 212–221. [Google Scholar] [CrossRef]
- Guo, P.; Liu, A.M.; Huang, D.Y.; Wu, Q.H.; Fatima, Z.; Tao, Y.F.; Cheng, G.Y.; Wang, X.; Yuan, Z.H. Brain damage and neurological symptoms induced by T-2 toxin in rat brain. Toxicol. Lett. 2018, 286, 96–107. [Google Scholar] [CrossRef]
- Agrawal, M.; Bhaskar, A.S.B.; Rao, P.V.L. Involvement of mitogen-activated protein kinase pathway in T-2 toxin-induced cell cycle alteration and apoptosis in human neuroblastoma cells. Mol. Neurobiol. 2015, 51, 1379–1394. [Google Scholar] [CrossRef] [PubMed]
- Velazco, V.; Faifer, G.C.; Godoy, H.M. Differential effects of T-2 toxin on bone marrow and spleen erythropoiesis in mice. Food Chem. Toxicol. 1996, 34, 371–375. [Google Scholar] [CrossRef]
- Agrawal, M.; Yadav, P.; Lomash, V.; Bhaskar, A.S.B.; Rao, L.P.V. T-2 toxin induced skin inflammation and cutaneous injury in mice. Toxicology 2012, 302, 255–265. [Google Scholar] [CrossRef] [PubMed]
- Alexander, N.J.; Proctora, R.H.; McCormicka, S.P. Genes, gene clusters, and biosynthesis of trichothecenes and fumonisins in Fusarium. Toxin Rev. 2009, 28, 198–215. [Google Scholar] [CrossRef]
- Adebayo-Tayo, B.C.; Onilude, A.A.; Ukpe, G.P. Mycoflora of smoke-dried fishes sold in Uyo, Eastern Nigeria. World J. Agric. Sci. 2008, 4, 346–350. [Google Scholar]
- Ayeloja, A.A.; George, F.O.A.; Jimoh, W.A.; Shittu, M.O. Microbial load on smoked fish commonly traded in Ibadan, Oyo State, Nigeria. J. Appl. Sci. Environ. Manag. 2018, 22, 493–497. [Google Scholar] [CrossRef]
- Fafioye, O.O.; Efuntoye, M.O.; Osho, A. Studies on the fungal infestation of five traditionally smoke-driedfreshwater fish in Ago-Iwoye, Nigeria. Mycopathologia 2001, 154, 177–179. [Google Scholar] [CrossRef] [PubMed]
- Fagbohun, E.D.; Lawal, O.U. Aflatoxins investigation and mycobiota of selected marketed smoked - dried fish samples in Ado-Ekiti, Nigeria and their environmental Health implications. Brit. Microbiol. Res. J. 2015, 7, 126–132. [Google Scholar] [CrossRef]
- Rabie, M.A.; Peres, C.; Malcata, F.X. Evolution of amino acids and biogenic amines throughout storage in sausages made of horse, beef and turkey meats. Meat Sci. 2014, 96, 82–87. [Google Scholar] [CrossRef]
- Shiobara, T.; Nakajima, Y.; Maeda, K.; Akasaka, M.; Kitou, Y.; Kanamaru, K.; Ohsato, S.; Kobayashi, T.; Nishiuchi, T.; Kimura, M. Identification of amino acids negatively affecting Fusarium trichothecene biosynthesis. Antonie Leeuwenhoek 2019, 111, 471–478. [Google Scholar] [CrossRef]
- Lushchak, O.; Strilbytska, O.; Piskovatska, V.; Storey, K.B.; Koliada, A.; Vaiserman, A. The role of the TOR pathway in mediating the link between nutrition and longevity. Mech. Ageing Dev. 2017, 164, 127–138. [Google Scholar] [CrossRef]
- Tanigawa, M.; Maeda, T. An in vitro TORC1 kinase assay that recapitulates the Gtr-independent glutamine-responsive TORC1 activation mechanism on yeast vacuoles. Mol. Cell. Biol. 2017, 37, e00075-17. [Google Scholar] [CrossRef]
- Rai, R.; Tate, J.J.; Cooper, T.G. gln3 mutations dissociate responses to nitrogen limitation (nitrogen catabolite repression) and rapamycin inhibition of TorC1. J. Biol. Chem. 2013, 288, 2789–2804. [Google Scholar] [CrossRef]
- Valbuena, N.; Guan, K.L.; Moreno, S. The Vam6 and Gtr1-Gtr2 pathway activates TORC1 in response to amino acids in fission yeast. J. Cell Sci. 2012, 125, 1920–1928. [Google Scholar] [CrossRef]
- Ajeet, S.; Daipayan, C.; Avinash, G.; Ramesh, C.M.; Amitabha, C. TORC1-signalling is down-regulated in Saccharomyces cerevisiae hsp30Δ cells by SNF1-dependent mechanisms. Yeast 2018, 35, 653–667. [Google Scholar]
- Molinet, J.; Salinas, F.; Guillamón, J.M.; Martínez, C. GTR1 affects bitrogen consumption and TORC1 activity in Saccharomyces cerevisiae under fermentation conditions. Front Genet. 2020, 11, 519. [Google Scholar] [CrossRef] [PubMed]
- Chen, X.H.; Wang, G.Q.; Zhang, Y.; Dayhoff-Brannigan, M.; Diny, N.L.; Zhao, M.J.; He, G.; Sing, C.N.; Metz, K.A.; Stolp, Z.D.; et al. Whi2 is a conserved negative regulator of TORC1 in response to low amino acids. PLoS Genet. 2018, 14, e1007592. [Google Scholar] [CrossRef]
- Li, J.M.; Yan, G.H.; Liu, S.C.; Jiang, T.; Zhong, M.M.; Yuan, W.J.; Chen, S.X.; Zheng, Y.; Jiang, Y.; Jiang, Y. Target of rapamycin complex 1 and Tap42-associated phosphatases are required for sensing changes in nitrogen conditions in the yeast Saccharomyces cerevisiae. Mol. Microbiol. 2017, 106, 938–948. [Google Scholar] [CrossRef] [PubMed]
- Morrissette, V.A.; Rolfes, R.J. The intersection between stress responses and inositol pyrophosphates in Saccharomyces cerevisiae. Currr. Genet. 2020, 66, 901–910. [Google Scholar] [CrossRef]
- Ma, N.; Ma, Y.; Nakashima, A.; Kikkawa, U.; Furuyashiki, T. The loss of Lam2 and Npr2-Npr3 diminishes the vacuolar localization of Gtr1-Gtr2 and disinhibits TORC1 activity in fission yeast. PLoS ONE 2016, 11, e0156239. [Google Scholar] [CrossRef]
- Paimard, G.; Mohammadi, R.; Bahrami, R.; Khosravi -Darani, K.; Sarlak, Z.; Rouhi, M. Detoxification of patulin from juice simulator and apple juice via cross-linked Se-chitosan/L-cysteine nanoparticles. LWT-Food Sci. Technol. 2021, 143, 111146. [Google Scholar] [CrossRef]
- Galgóczy, L.; Yap, A.; Marx, F. Cysteine-rich antifungal proteins from filamentous fungi are promising bioactive natural compounds in anti-candida therapy. Isr. J. Chem. 2019, 59, 360–370. [Google Scholar] [CrossRef]
- Garbe, E.; Vylkova, S. Role of amino acid metabolism in the virulence of human pathogenic fungi. Curr. Clin. Microbiol. 2019, 6, 108–119. [Google Scholar] [CrossRef]
- Alfatah, M.; Wong, J.H.; Krishnan, V.G.; Lee, Y.C.; Sin, Q.F.; Goh, C.J.H.; Kong, K.W.; Hoon, S.; Arumugam, P. TORC1 regulates the transcriptional response to glucose and developmental cycle via the Tap42-Sit4-Rrd1/2 pathway in Saccharomyces cerevisiae. BioRxiv 2019, 62, 115–120. [Google Scholar] [CrossRef]
- Vylkova, S.; Carman, A.J.; Danhof, H.A.; Collette, J.R.; Zhou, H.; Lorenz, M.C. The fungal pathogen Candida albicans autoinduces hyphal morphogenesis by raising extracellular pH. MBio 2011, 2, e00055-11. [Google Scholar] [CrossRef] [PubMed]
- Phasha, M.M.; Wingfield, M.J.; Wingfield, B.D.; Coetzee, M.P.A.; Hallen-Adams, H.; Fru, F.; Swalarsk-Parry, B.S.; Yilmaz, N.; Duong, T.A.; Steenkamp, E.T. Ras2 is important for growth and pathogenicity in Fusarium circinatum. Fungal Genet. Biol. 2021, 150, 103541. [Google Scholar] [CrossRef] [PubMed]
- Tästensen, J.B.; Schönheit, P. Two distinct glyceraldehyde -3-phosphate dehydrogenases in glycolysis and gluconeogenesis in the archaeon Haloferax volcanii. FEBS Lett. 2018, 592, 1524–1534. [Google Scholar] [CrossRef]
- Hohn, T.M.; Desjardins, A.E.; McCormick, S.P. The Tri4 gene of Fusarium sporotrichioides encodes a cytochrome P450 monooxygenase involved in trichothecene biosynthesis. Mol. Gen. Genet. 1995, 248, 95–102. [Google Scholar] [CrossRef] [PubMed]
- McCormick, S.P.; Alexander, N.J. Fusarium Tri8 encodes a trichothecene C-3 esterase. Appl. Environ. Microbiol. 2002, 68, 2959–2964. [Google Scholar] [CrossRef]
- McCormick, S.P.; Hohn, T.M.; Desjardins, A.E. Isolation and characterization of Tri3, a gene encoding 15-O-acetyltransferase from Fusarium sporotrichioides. Appl. Environ. Microbiol. 1996, 62, 353–359. [Google Scholar] [CrossRef]
- Bitu, M.N.A.; Hossain, M.S.; Islam, A.N.; Islam, M.S.; Kudrat-E.-Zahan, M. Peroxo complexes of Th(IV) and Zr(IV) ions containing aspartic acid and amine bases as potential biological agents. Russ. J. Gen. Chem. 2020, 90, 1553–1557. [Google Scholar] [CrossRef]
- Riccio, A.A.; Schellenberg, M.J.; Williams, R.S. Molecular mechanisms of topoisomerase 2 DNA-protein crosslink resolution. Cell. Mol. Life Sci. 2020, 77, 81–91. [Google Scholar] [CrossRef]
- Shen, L.L.; Baranowski, J.; Fostel, J.; Montgomery, D.A.; Lartey, P.A. DNA topoisomerases from pathogenic fungi: Targets for the discovery of antifungal drugs. Antimicrob. Agents Chemother. 1992, 36, 2778–2784. [Google Scholar] [CrossRef] [PubMed]
- Fostel, J.; Montgomery, D. Identification of the aminocatechol A-3253 as an in vitro poison of DNA topoisomerase I from Candida albicans. Antimicrob. Agents Chemother. 1995, 39, 586–592. [Google Scholar] [CrossRef]
- Karkowska-Kuleta, J.; Satala, D.; Bochenska, O.; Rapala-Kozik, M.; Kozik, A. Moonlighting proteins are variably exposed at the cell surfaces of Candida glabrata, Candida parapsilosis and Candida tropicalis under certain growth conditions. BMC Microbiol. 2019, 19, 149. [Google Scholar] [CrossRef] [PubMed]
- Hu, Q.L.; Wang, H.; He, C.; Jin, Y.X.; Fu, Z.W. Polystyrene nanoparticles trigger the activation of p38 MAPK and apoptosis via inducing oxidative stress in zebrafish and macrophage cells. Environ. Pollut. 2021, 269, 116075. [Google Scholar] [CrossRef] [PubMed]
- Wu, J.; Ibtisham, F.; Niu, Y.F.; Wang, Z.; Li, G.H.; Zhao, Y.; Nawab, A.; Xiao, M.; An, L.L. Curcumin inhibits heat-induced oxidative stress by activating the MAPK-Nrf2 / ARE signaling pathway in chicken fibroblasts cells. J. Therm. Biol. 2019, 79, 112–119. [Google Scholar] [CrossRef] [PubMed]
- Madrid, M.; Vzquez-Marn, B.; Franco, A.; Soto, T.; Vicente-Soler, J.; Gacto, M.; Cansado, J. Multiple crosstalk between TOR and the cell integrity MAPK signaling pathway in fission yeast. Sci. Rep. 2016, 6, 37515. [Google Scholar] [CrossRef] [PubMed]
- Li, N.; Tong, X.; Zeng, J.; Meng, G.; Sun, F.Z.; Hu, H.; Song, J.B.; Lu, C.; Dai, F.Y. Hippo pathway regulates somatic development and cell proliferation of silkworm. Genomics 2019, 111, 391–397. [Google Scholar] [CrossRef] [PubMed]
- Park, J.H.; Shin, J.E.; Park, H.W. The role of Hippo pathway in cancer stem cell biology. Mol. Cells 2018, 41, 83–89. [Google Scholar]
Disclaimer/Publisher’s Note: The statements, opinions and data contained in all publications are solely those of the individual author(s) and contributor(s) and not of MDPI and/or the editor(s). MDPI and/or the editor(s) disclaim responsibility for any injury to people or property resulting from any ideas, methods, instructions or products referred to in the content. |
© 2023 by the authors. Licensee MDPI, Basel, Switzerland. This article is an open access article distributed under the terms and conditions of the Creative Commons Attribution (CC BY) license (https://creativecommons.org/licenses/by/4.0/).