Article

bglG Regulates the Heterogeneity Driven by the Acid Tolerance Response in Lacticaseibacillus paracasei L9

1
College of Food Science and Nutritional Engineering, China Agricultural University, Beijing 100083, China
2
Key Laboratory of Functional Dairy, Department of Nutrition and Health, China Agricultural University, Beijing 100193, China
3
Research Center for Probiotics, China Agricultural University, Sanhe 065200, China
*
Author to whom correspondence should be addressed.
These authors contribute equally in this work.
Foods 2023, 12(21), 3971; https://doi.org/10.3390/foods12213971
Submission received: 9 September 2023 / Revised: 24 October 2023 / Accepted: 28 October 2023 / Published: 30 October 2023

Abstract

:
The acid tolerance of lactic acid bacteria is crucial for their fermentation and probiotic functions. Acid adaption significantly enhances the acid tolerance of strains, and the phenotypic heterogeneity driven by the acid tolerance response (ATR) contributes to this process by providing a selective advantage in harsh environments. The mechanism of heterogeneity under the ATR is not yet clear, but individual gene expression differences are recognized as the cause. In this study, we observed four heterogeneous subpopulations (viable, injured, dead, and unstained) of Lacticaseibacillus paracasei L9 (L9) induced by acid adaption (pH 5.0, 40 min) using flow cytometry. The viable subpopulation represented a significantly superior acid tolerance to the injured subpopulation or total population. Different subpopulations were sorted and transcriptomic analysis was performed. Five genes were found to be upregulated in the viable subpopulation and downregulated in the injured subpopulation, and bglG (LPL9_RS14735) was identified as having a key role in this process. Using salicin (glucoside)-inducing gene expression and gene insertion mutagenesis, we verified that bglG regulated the heterogeneity of the acid stress response and that the relevant mechanisms might be related to activating hsp20. This study provides new evidence for the mechanism of the ATR and may contribute to the theoretical basis of improving the acid tolerance of Lacticaseibacillus paracasei L9.

1. Introduction

Microbial heterogeneity can be interpreted as phenotypic differences within a clonal, genetically identical population. It is a universal characteristic of living organisms [1]. The emergence of heterogeneous drug-resistant bacteria in clinical medicine is very common. For example, heteroresistant vancomycin-intermediate Staphylococcus aureus (hVISA, the hVISA strain is composed of subpopulations having different levels of vancomycin resistance), tigecycline heteroresistant Acinetobacter baumannii (AB), etc., have been widely reported [2,3]. Thus, clarifying the heterogeneity for the microbe stress tolerance and the elimination of pathogenic bacteria is important.
In many cases, heterogeneity can provide a selective advantage during environmental changes and stress. The formation mechanism of heterogeneity is not fully understood. Three models of population heterogeneity have been proposed thus far: biological (intrinsic) and environmental (extrinsic) models and a combined model [4,5]. Intrinsic heterogeneity can often arise due to cell cycle states, age distribution, or the stochasticity of gene expression and metabolic reactions [6]. For example, different cells may have different sizes and different numbers of key components, such as RNA polymerase, ribosomes, and small-molecule effectors [7]. Furthermore, the intrinsic stochasticity of gene expression leads to cell-to-cell fluctuations in mRNA molecules and key proteins [8,9,10]. This stochasticity is also known as the “noise” of cells [11]. The source of environment-driven heterogeneity is fluctuations in the environment. Following an environmental change, some individual transcriptional profiles are needed for survival in the new environment, which alters the spectrum of phenotypic members present within the population. Such behaviour may serve as a strategy and is essential for population growth and survival [12]. The fluctuations of gene expression programs are considered to cause phenotypic heterogeneity in clonal microbial populations.
Lactic acid bacteria (LAB) are commonly used in industrial production as food and beneficial supplements. However, acid stress is the main factor affecting the fermentation ability and activity of LAB. Heterogeneity is also found in LAB in response to environmental stress. Zhao et al. [13] studied the heterogeneity of Lactobacillus brevis exposed to beer compounds, finding an increased proportion of injured subpopulations, while the proportion of viable subpopulations decreased with increasing stress time. Papadimitriou et al. [14] obtained similar findings using Streptococcus macedonicus cells. Interestingly, the recovery of three subpopulations by single-cell sorting revealed that the viable subpopulation (cFDA+/PI−) exhibited the highest recovery (95 formed colonies out of 100 cells sorted), followed by the injured subpopulation (84/100), while no cell could recover from a dead subpopulation [14]. The heterogeneity found in Lacticaseibacillus casei [15], Lactococcus lactis [16], and Lactobacillus spp. [17] when exposed to the acid stress response may be explained as follows: (i) The distribution of subpopulations varies with Ph. (ii) There are significant differences in the culturability and acid tolerance between subpopulations. Among them, the viable subpopulation performed best, followed by the injured subpopulation, while the cell membrane and metabolic activity were somewhat damaged. (iii) Different subpopulations influence the acid tolerance of the whole population. However, the mechanism of heterogeneity induced by the acid tolerance response (ATR) is still not fully understood, and a theoretical basis for industrial production using heterogeneity to improve strain tolerance is lacking.
Lacticaseibacillus paracasei L9 is an aerotolerant Gram-positive bacterium belonging to the homofermentative lactic acid bacteria isolated from healthy people. Lacticaseibacillus paracasei L9 has been proven to modulate immunity and improve the intestinal barrier [18]. It has been industrialized and applied in products such as fermented milk and lactobacillus beverages. Previous studies have shown that the ATR can significantly improve the acid tolerance of the strain [19]. In this study, heterogeneous subpopulations of Lacticaseibacillus paracasei L9 were investigated after the ATR. Then, transcriptomic analysis was performed for the subpopulations, and the possible target genes regulating heterogeneity were analysed and verified. Finally, we determined the possible regulatory mechanism of heterogeneity regulation. This study will provide new evidence for the mechanism of the ATR and contribute to the theoretical basis of improving the acid tolerance of Lacticaseibacillus paracasei L9.

2. Materials and Methods

2.1. Bacterial Strains, Plasmids, and Growth Conditions

The bacterial strains and plasmids used in this study are listed in Table S1. Lacticaseibacillus paracasei L9 was cultured in de Man–Rogosa–Sharpe (formula: peptone 10.0 g/L, beef extract 10.0 g/L, yeast extract powder 5.0 g/L, glucose 20 g/L, sodium acetate 5.0 g/L, ammonium citrate dibasic 2.0 g/L, K2HPO4·3H2O 2.0 g/L, MgSO4·7H2O 0.58 g/L, MnSO4·H2O 0.25 g/L, and tween 80 1.0 mL/L) medium with an initial pH between 6.4 and 6.6 at 37 °C. Colony-forming units (CFU) were counted after plating on MRS agar medium and incubation for 48 h at 37 °C. Escherichia coli (E. coli) was grown aerobically at 37 °C in Luria–Bertani (LB) medium with shaking. For selection, media were supplemented with antibiotics at the following concentrations: 5 μg/mL erythromycin (Solarbio, Bejing, China) in MRS for the Lacticaseibacillus paracasei L9 mutant and 100 μg/mL ampicillin (Solarbio, Beijing, China) in LB for E. coli DH5α. DL-lactic acid (Sigma, St. Louis, MO, USA) was added to adjust the pH (pH 6.5, pH 5.5, pH 5.0, pH 4.5, pH 3.5) of MRS. To investigate the influence of salicin on cell viability under acid stress, 25% glucose in MRS medium was replaced with an equal weight of salicin (Solarbio, Beijing, China). All results were obtained from three independent experiments.

2.2. Acid Adaption and Acid Challenge

Next, the impact of preincubation at different pH values on the survival ratio at the acid challenge (pH 3.5, 90 min) was tested. The exponential cells (OD600nm = 0.6, 1.2 mL) were harvested by centrifugation (12,000× g, 5 min, 4 °C) and resuspended in isovolumetric MRS adjusted to pH 6.5, pH 5.5, pH 5.0, or pH 4.5 at 37 °C for 40 min. Subsequently, those acid-adapted cells were collected and incubated in MRS adjusted to pH 3.5 at 37 °C for 90 min (acid challenge). Plate count measured viable counts on MRS agar medium. Survival rates were calculated by dividing the number of CFU per milliliter after incubation at pH 3.5 by the number of cfu per milliliter after resuspension at pH 6.5 using the following formula:
Survival   rate = c f u * m L 1   a t   p H   3.5 ,   90   m i n c f u * m L 1   a t   p H   6.5 ,   90   m i n

2.3. Fluorescence Labelling and FCM Analysis

Cells were stained with two fluorescent dyes, SYTO13 (Invitrogen, S7575, Carlsbad, CA, USA) and propidium iodide (PI, Invitrogen, P3566, Carlsbad, CA, USA), as previously reported with slight modifications [20]. Samples from cultures were harvested by centrifugation (12,000× g, 5 min, 4 °C) and washed twice in phosphate-buffered saline (PBS, pH 7.4, sterile). Then, the cells in PBS were stained with SYTO13 at a final concentration of 1.5 μM for 15 min in the dark at 37 °C and then stained with 8.7 μM PI.
Gates in the flow cytometry (FCM) dot plots were established according to control samples: exponential cells (OD600nm = 0.6) without any dyes; heat-killed cells treated at 121 °C for 15 min just with PI; exponentially growing cells with just SYTO13; and mixtures containing exponential and heat-killed cells (1:1) stained by PI and SYTO13.
Flow cytometry measurements were performed using a FACSCalibur (Becton Dickinson, Franklin Lakes, NJ, USA). Green fluorescence from SYTO13-stained cells was collected on the FL1 channel (530 ± 15 nm), whereas PI fluorescence was registered on the FL3 channel (>650 nm). For each analysis, 30,000 microspheres were acquired. The raw data were analysed with FlowJo v10 (Becton Dickinson, Franklin Lakes, NJ, USA). The results were obtained from three independent experiments.

2.4. Intracellular ATP Content

The intracellular ATP content was analysed according to the ATP Assay Kit (Beyotime, S0026, Beijing, China) following the manufacturer’s instructions. Luminance was measured by a microplate reader (Tecan, Infinite 200 PRO, Mnnedorf, Switzerland). Emitted light was linearly related to ATP concentration. Data were normalized to the control group and expressed as a percentage of control levels.

2.5. Transcriptomics

The exponential cells, cells after acid adaption, and different subpopulation cells (FCM-Viable, FCM-Injured, FCM-Total) were collected. Three independent biological replicates were performed in this study. Total RNA isolation was performed with TRIzol reagent (Invitrogen, Carlsbad, CA, USA) according to the manufacturer’s instructions. For RNA sample preparation, 3 μg RNA per sample was used as input material. Sequencing libraries were generated using the NEBNext Ultra Directional RNA Library Prep Kit for Illumina (NEB, Beverly, MA, USA) following the manufacturer’s recommendations, and index codes were added to attribute sequences. Library fragments were then purified using the AMPure XP system (Beckman Coulter, Beverly, MA, USA) to preferentially select cDNA fragments 150–200 bp in length. Size-selected and adaptor-ligated cDNA was then treated with 3 μL USER Enzyme (NEB, Beverly, MA, USA) at 37 °C for 15 min followed by 5 min at 95 °C. PCR was then performed using Phusion High-Fidelity DNA polymerase with universal PCR primers and Index (X) Primer. Finally, products were purified (AMPure XP system), and library quality was assessed on the Agilent Bioanalyzer 2100 system. The clustering of the index-coded samples was performed on a cBot Cluster Generation System using TruSeq PE Cluster Kit v3-cBot-HS (Illumina) according to the manufacturer’s instructions. After cluster generation, the library preparations were sequenced on an Illumina HiSeq platform, and paired-end reads were generated.
Raw data (raw reads) in fastq format were first processed through in-house Perl scripts. All sequenced reads were then aligned to the genome of Lacticaseibacillus paracasei L9. HTSeq v0.6.1 was used to count the read numbers mapped to each gene. Next, differential expression analysis of the two groups was performed using the DESeq R package (1.18.0). The resulting p-values were adjusted using Benjamini and Hochberg’s approach for controlling the false discovery rate. Genes with an adjusted p-value < 0.05 found by DESeq were considered differentially expressed.
All the raw transcriptomic data have been uploaded to NCBI (https://www.ncbi.nlm.nih.gov/sra, accessed on 3 February 2023) in BioProject (Accession No. PRJNA926023 and PRJNA921824).

2.6. Quantitative Real-Time PCR

RNA extraction was performed as described above. cDNA samples were obtained by reverse transcription of RNA samples with 5×All-in-One RT MasterMix (ABM, Vancouver, BC, Canada). Then, quantitative real-time PCR was performed using cDNA samples as templates. The primers of selected genes were designed based on the Lacticaseibacillus paracasei L9 genome using Primer-blast software (using Primer3 v4.1.0 and BLAST) in the online NCBI blast database and synthesized by Sangon Biotech, Shanghai, China. The primer pairs 16 s-F and 16 s-R, Q-bglB-F and Q-bglB-R, and Q-bglG-F and Q-bglG-R are listed in Table S2. The reaction system of PCR was 20 μL:10 μL SYBR Green I real-time PCR Master Mix (Takara, Tokyo, Japanese), 1 μL cDNA template, 8 μL DNAse/RNAse-free water (Sigma, ST, Louis, MO, USA), 0.5 μL forwards primers and reverse primers. Real-time PCR was carried out with a Techne Quantica real-time PCR detection system (Techne, Minneapolis, MN, USA) under the following conditions: step 1: denaturation at 95 °C for 30 s; step 2: 40 cycles of 95 °C for 10 s and 60 °C for 30 s. Each reaction was performed in triplicate. The 16S rRNA gene was used as the internal reference gene [21].

2.7. DNA Manipulation Techniques

Chromosomal DNA from Lacticaseibacillus paracasei L9 was extracted using TIANamp Bacteria DNA Kit according to the manufacturer’s instructions (Tiangen, Beijing, China) [22]. Lysis of Lacticaseibacillus paracasei L9 was performed by adding 30 mg/mL lysozyme dissolved in TES buffer (50 mM Tris-HCl, 1 mM EDTA, 25% sucrose; pH 8.0) and incubating the suspension at 37 °C for 1 h. Miniprep plasmid isolation from E. coli was performed using the Plasmid Mini Kit I (OMEGA Biotek, Doraville, GA, USA). PCR was carried out using Q5 High-Fidelity DNA Polymerase (NEB, Beverly, MA, USA). The primers used in PCRs of the plasmid were M13/pUC sequencing primer, which is a universal primer of pUC19. Restriction endonuclease digestions were conducted according to the supplier’s instructions (Takara, Tokyo, Japan). DNA ligation was performed using the T4 DNA Ligation Kit (Thermo Fisher Scientific, Waltham, MA, USA). Plasmids were introduced into E. coli DH5α using standard heat shock transformation (Tiangen, Beijing, China). Plasmids were introduced into Lacticaseibacillus paracasei L9 using electroporation. DNA sequencing was performed with the BigDye Terminator cycle sequencing kit (Sangon, Beijing, China), and the results were further analysed with SnapGene (Dotmatics, England, UK).

2.8. Insertional Inactivation of bglG

To study the role of bglG in the acid tolerance response of Lacticaseibacillus paracasei L9, the bglG mutant of Lacticaseibacillus paracasei L9 was obtained by single crossover homologous recombination. An 890 bp internal region of bglG was chosen as a homologous sequence and amplified using the primer pair bglG-F and bglG-R. The resulting PCR product was restriction enzyme digested and ligated into the corresponding restriction sites of the suicide plasmid pUC19e. The recombinant plasmid, i.e., pUCbglG, was then introduced into L. paracasei L9 by electroporation, and the recombinant strain was cultivated on MRS solid medium containing erythromycin. As pUCbglG could not replicate in Lacticaseibacillus paracasei L9, the erythromycin selection pressure resulted in the integration of the plasmid into the bglG gene region of the genome. The resulting mutant was named L9bglG. To confirm the integration of pUCbglG into the correct genome locus, PCR was performed with forwards primer T-bglG-F and reverse primer Em-R, which were designed according to the DNA sequence of the erythromycin resistance gene (GenBank Accession No. KM017875.1) and the downstream sequence of bglG, respectively. To maintain this type of mutation, antibiotics are needed in mutant strain activation. However, there is no antibiotic added when cultivating the working strain for proper control. The inserted gene can remain stable for 5 generations according to the PCR and sequencing results. The results are shown in Figure S1.

2.9. Statistical Analysis

The results are presented as the means ± standard errors of the means (SEM). Statistical differences were evaluated using one-way analysis of variance (ANOVA) or Student’s t-test at a significance threshold of 0.05. All of the data analyses were conducted using IBM SPSS Statistics v24 software (IBM, Armonk, NY, USA).

3. Results

3.1. Acid Tolerance Response of Lacticaseibacillus paracasei L9

We first tested the effect of different preincubation pH values on the survival of cells and found a pH range (5–5.5) that did not significantly affect the survival of Lacticaseibacillus paracasei L9 (Figure 1A). Then, the acid challenge (pH 3.5, 90 min) was performed after acid preincubation. The preincubation of Lacticaseibacillus paracasei L9 at pH 5.0 resulted in the highest survival rate in the acid challenge (18.1 ± 0.4%, Figure 1B). These results demonstrated that the acid tolerance response (ATR) could be triggered by transient exposure to a range of sublethal pH values. Thus, acid adaption (pH 5.0, 40 min) was used in subsequent experiments to characterize the ATR.

3.2. Heterogeneity Driven by the ATR of Lacticaseibacillus paracasei L9

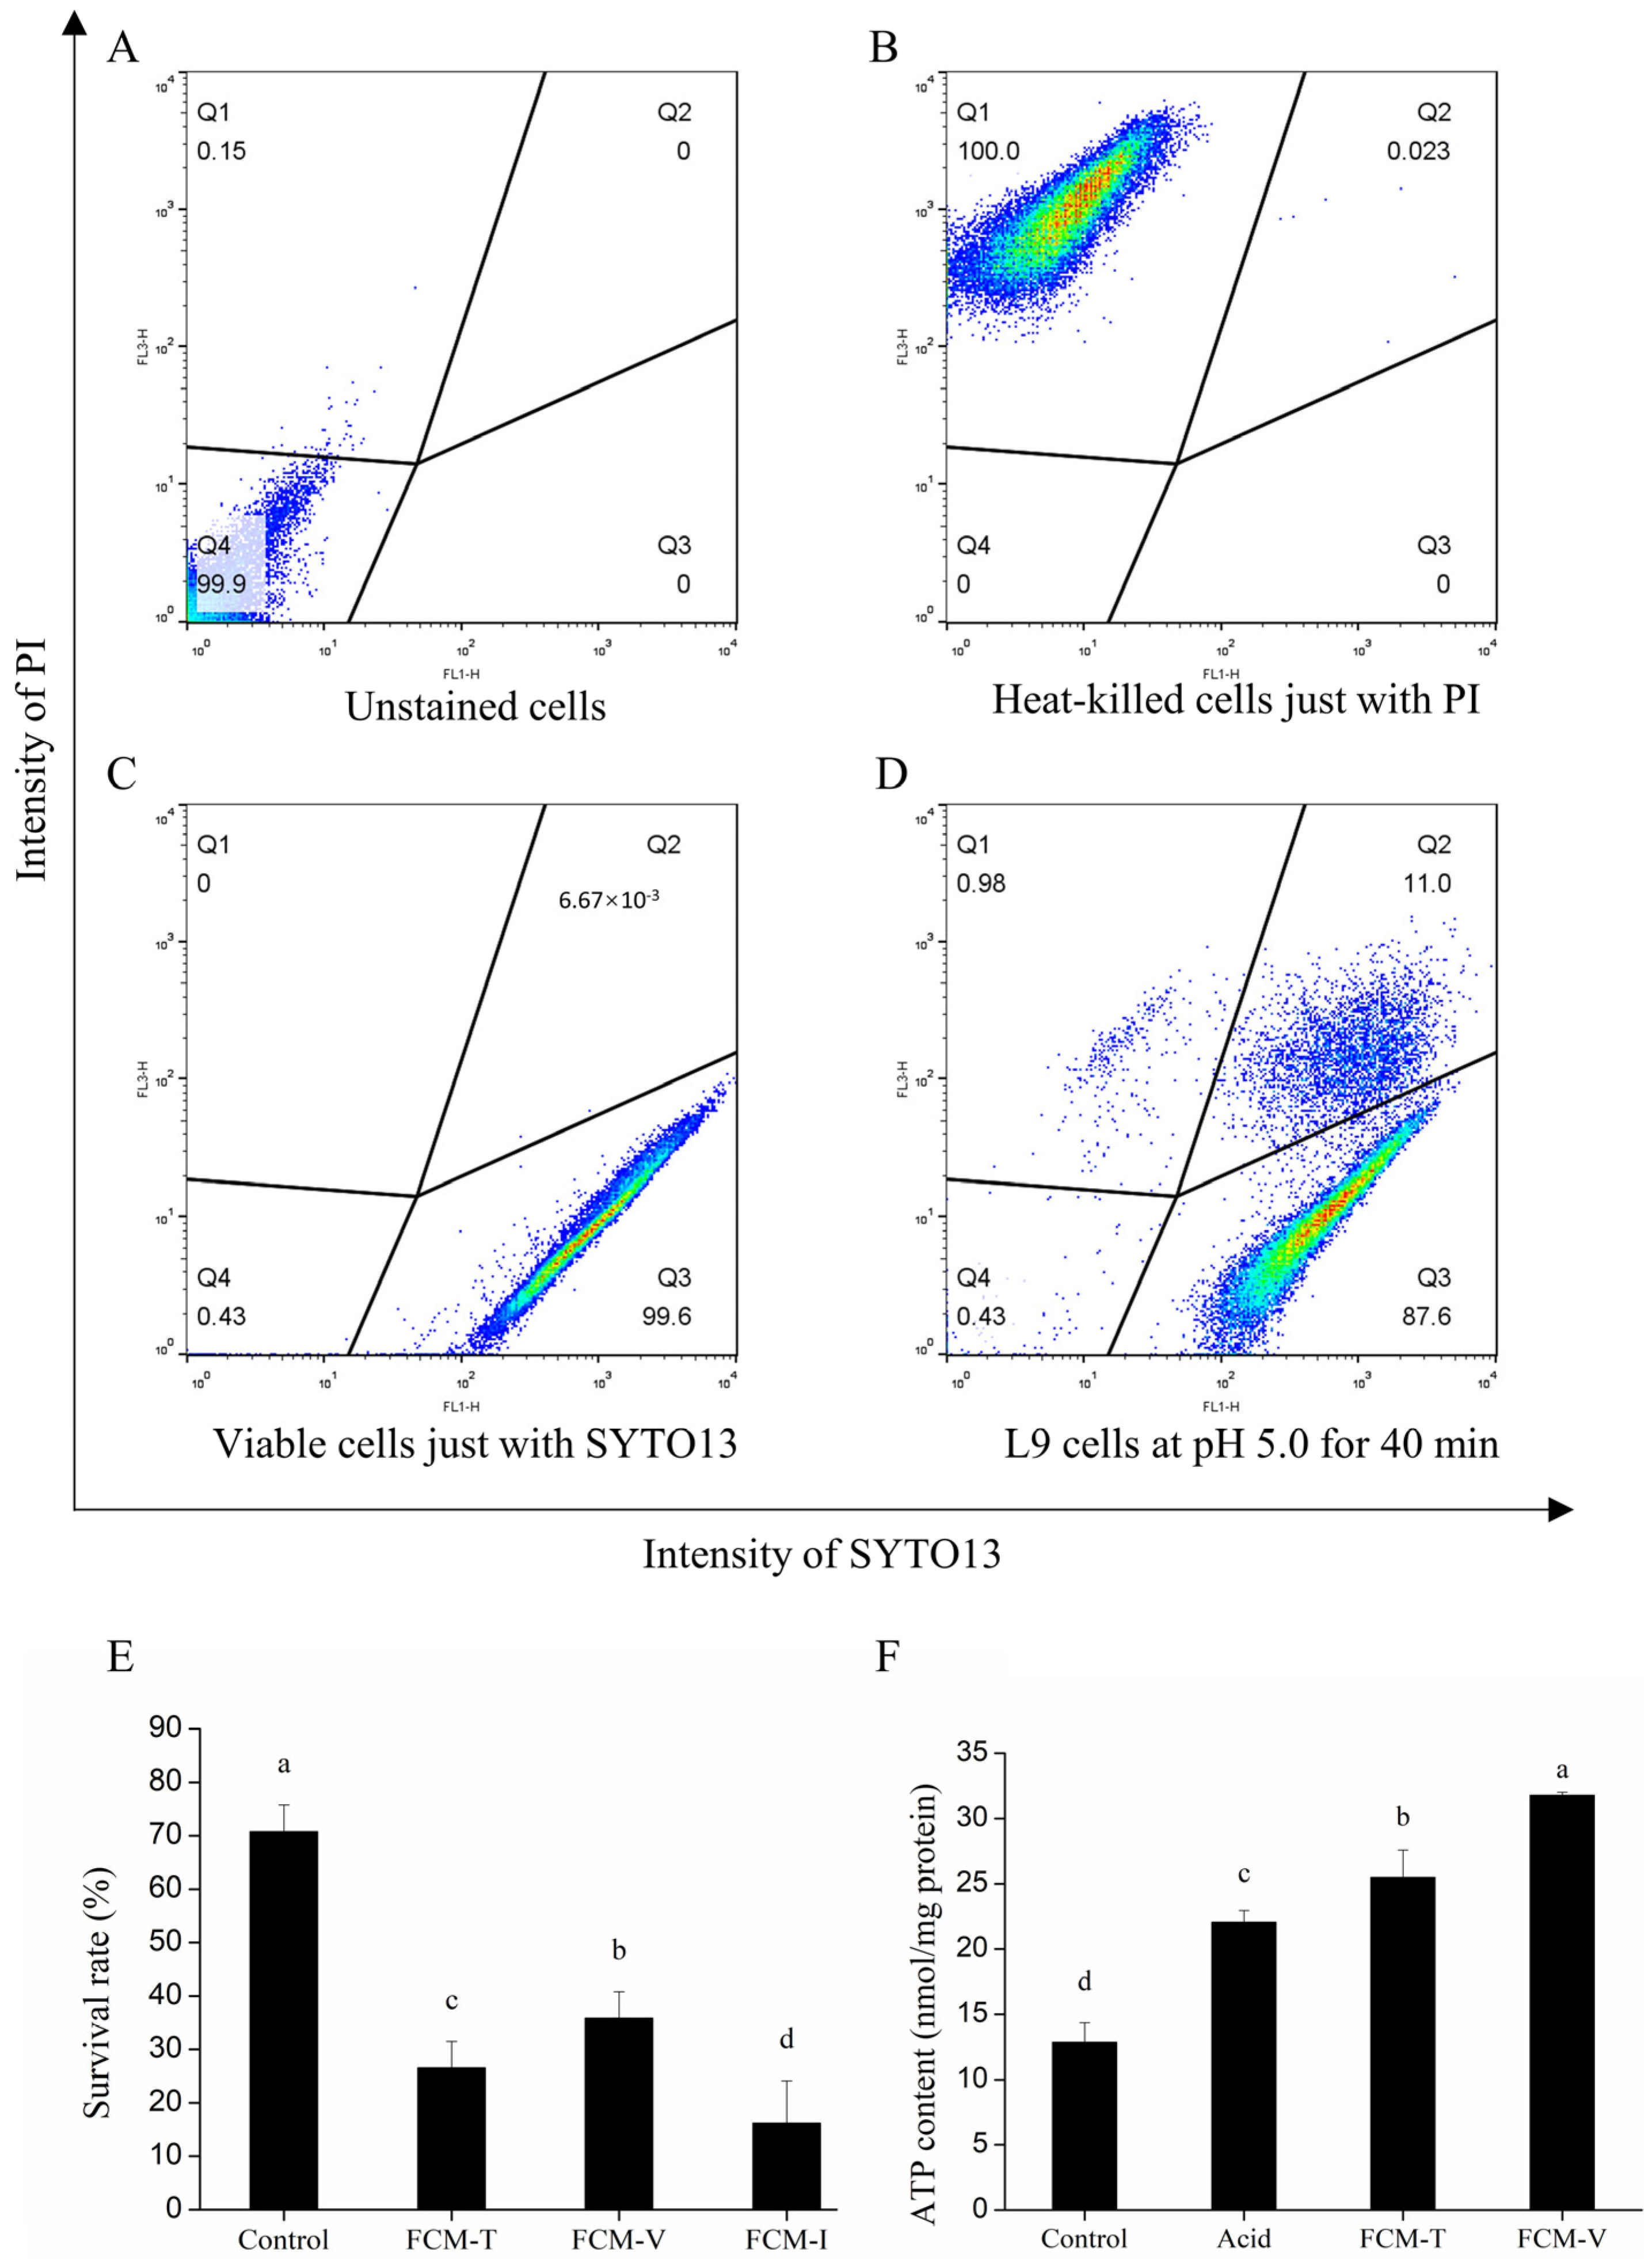
The heterogeneity of Lacticaseibacillus paracasei L9 cells adapted at pH 5.0 for 40 min was analysed by flow cytometry staining with SYTO13 and propidium iodide (PI). SYTO13 and PI dyes are often used to assess viability by characterizing the integrity of cell membranes. When cells are simultaneously exposed to SYTO13 and PI, dead cells are usually PI+ and SYTO13−, while viable cells are usually PI− and SYTO13+. As shown in Figure 2A–C, unstained Lacticaseibacillus paracasei L9 live cells, heat-killed cells single-stained with PI, and live cells single-stained with SYTO 13 were used as control cells to divide different gates.
The ATR heterogeneity of Lacticaseibacillus paracasei L9 cells after acid adaption was observed, among which the subpopulation of viable cells was 87.1% ± 0.7%, and the subpopulation of injured cells was 11.5 ± 0.6% (Figure 2D and Figure S2). The total population (FCM-T), viable cells (FCM-V), and injured cells (FCM-I) were sorted and collected by flow cytometry sorting. Interestingly, the cells from different subpopulations showed diversity in acid tolerance when exposed to pH 3.5 for 20 min (Figure 2E). The viable subpopulation (FCM-V) showed the highest survival rate compared with the total population (FCM-T) and injured subpopulation (FCM-I), which revealed that the ATR in the viable subpopulation was significantly stronger than that in other subpopulations. Similarly, the intracellular ATP content of viable cells (FCM-V) was significantly higher than that in the total population (FCM-T), which might contribute to ATR (Figure 2F). These strategies are beneficial to Lacticaseibacillus paracasei L9 cells as they help them to survive better in a low-pH environment. The results suggest that Lacticaseibacillus paracasei L9 appears significantly heterogeneous after the ATR and that viable subpopulations have a greater impact on the improvement in acid tolerance.

3.3. Transcriptomic Changes in the ATR in Different Subpopulations

Regulation of gene expression was considered the main reason for microbial heterogeneity. To investigate genes involved in the heterogeneity of the ATR, differential gene expression among subpopulations was identified by RNA-Seq. The correlation of gene expression levels between three independent biological replicates was shown by the Pearson correlation coefficient and PCA (Figure S3). According to Figure 3, 17 genes related to the viable subpopulation and the injured subpopulation were obtained. Compared with samples without acid adaption, 5 genes were upregulated in the viable subpopulation but downregulated in the injured subpopulation, and 12 genes were downregulated in the viable subpopulation but upregulated in the injured subpopulation (Table 1). According to their putative functions, these genes could be involved in carbohydrate metabolism, nucleotide metabolism, translation processes, amino acid metabolism, stress response, etc.
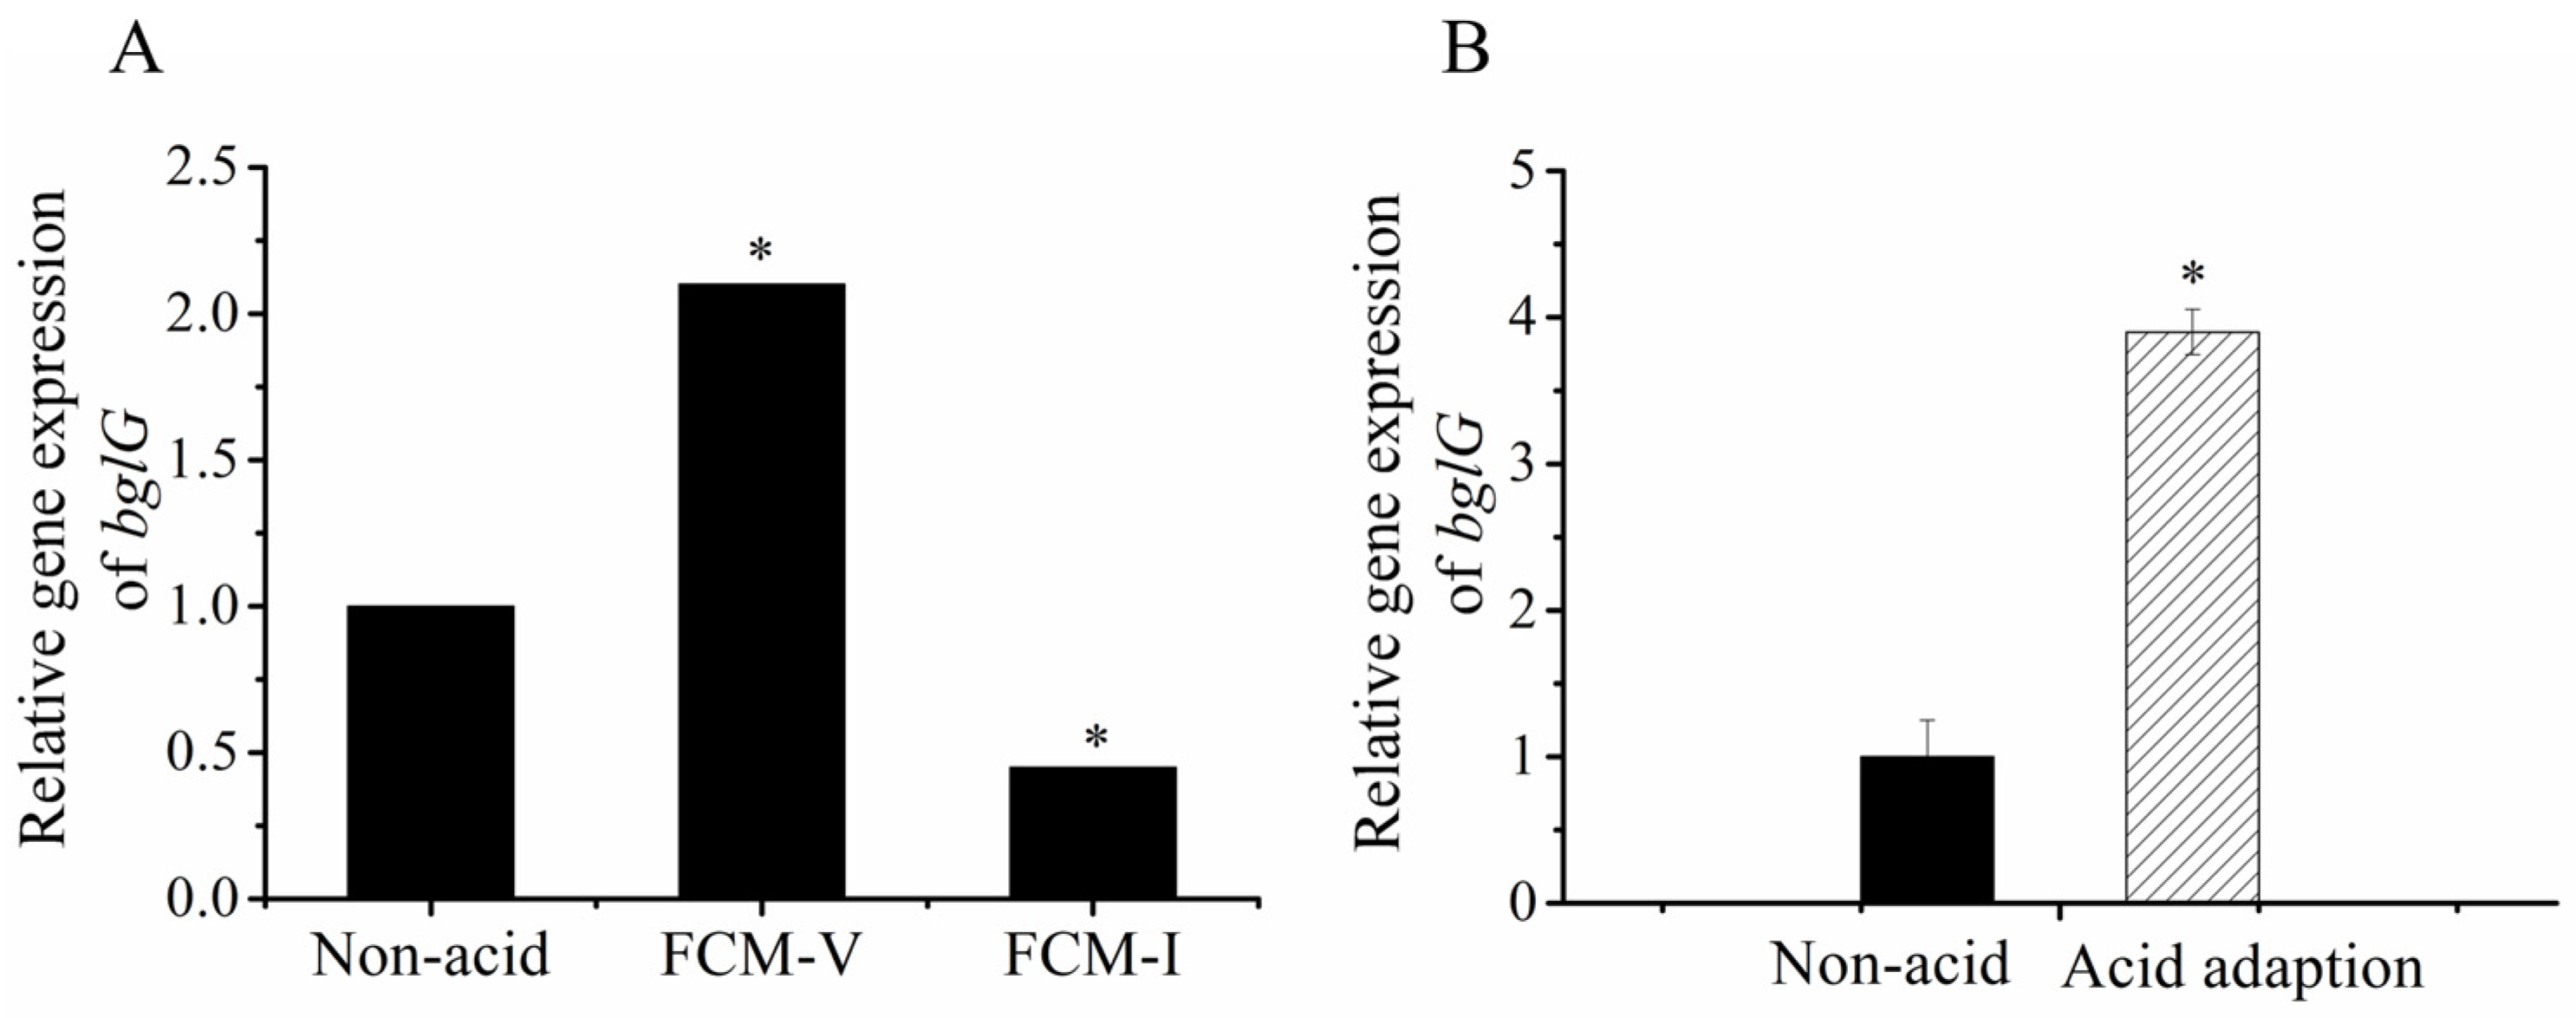
It is worth noting that bglG (LPL9_RS14735), which encodes an anti-transcription terminator protein, was upregulated by 2.1-fold in the viable subpopulation and downregulated by 0.45-fold in the injured cell subpopulation (Table 1; Figure 4A). bglG is a structural gene of the bgl operon responsible for the translocation and hydrolysis of β-glucosides, such as salicin and arbutin [23,24,25]. The protein encoded by bglG has an antitermination effect [26,27,28]. Meanwhile, gene2284 (PTS beta-glucoside transporter subunit IIBCA) also has the same expression trend, indicating that β-glucoside’s metabolism might be involved in heterogeneous subpopulations (Table 1) [29]. In addition to bglG, the bgl operon contains bglF and bglB [30,31,32].
To further investigate the role of bglG in the ATR of Lacticaseibacillus paracasei L9, transcriptome data of bglG by RNA-Seq were verified by quantitative real-time polymerase chain reaction (qRT‒PCR). The gene expression of bglG was significantly upregulated after an acid adaption by 3.9-fold (Figure 4B).

3.4. Salicin Increases Acid Tolerance in Lacticaseibacillus paracasei L9

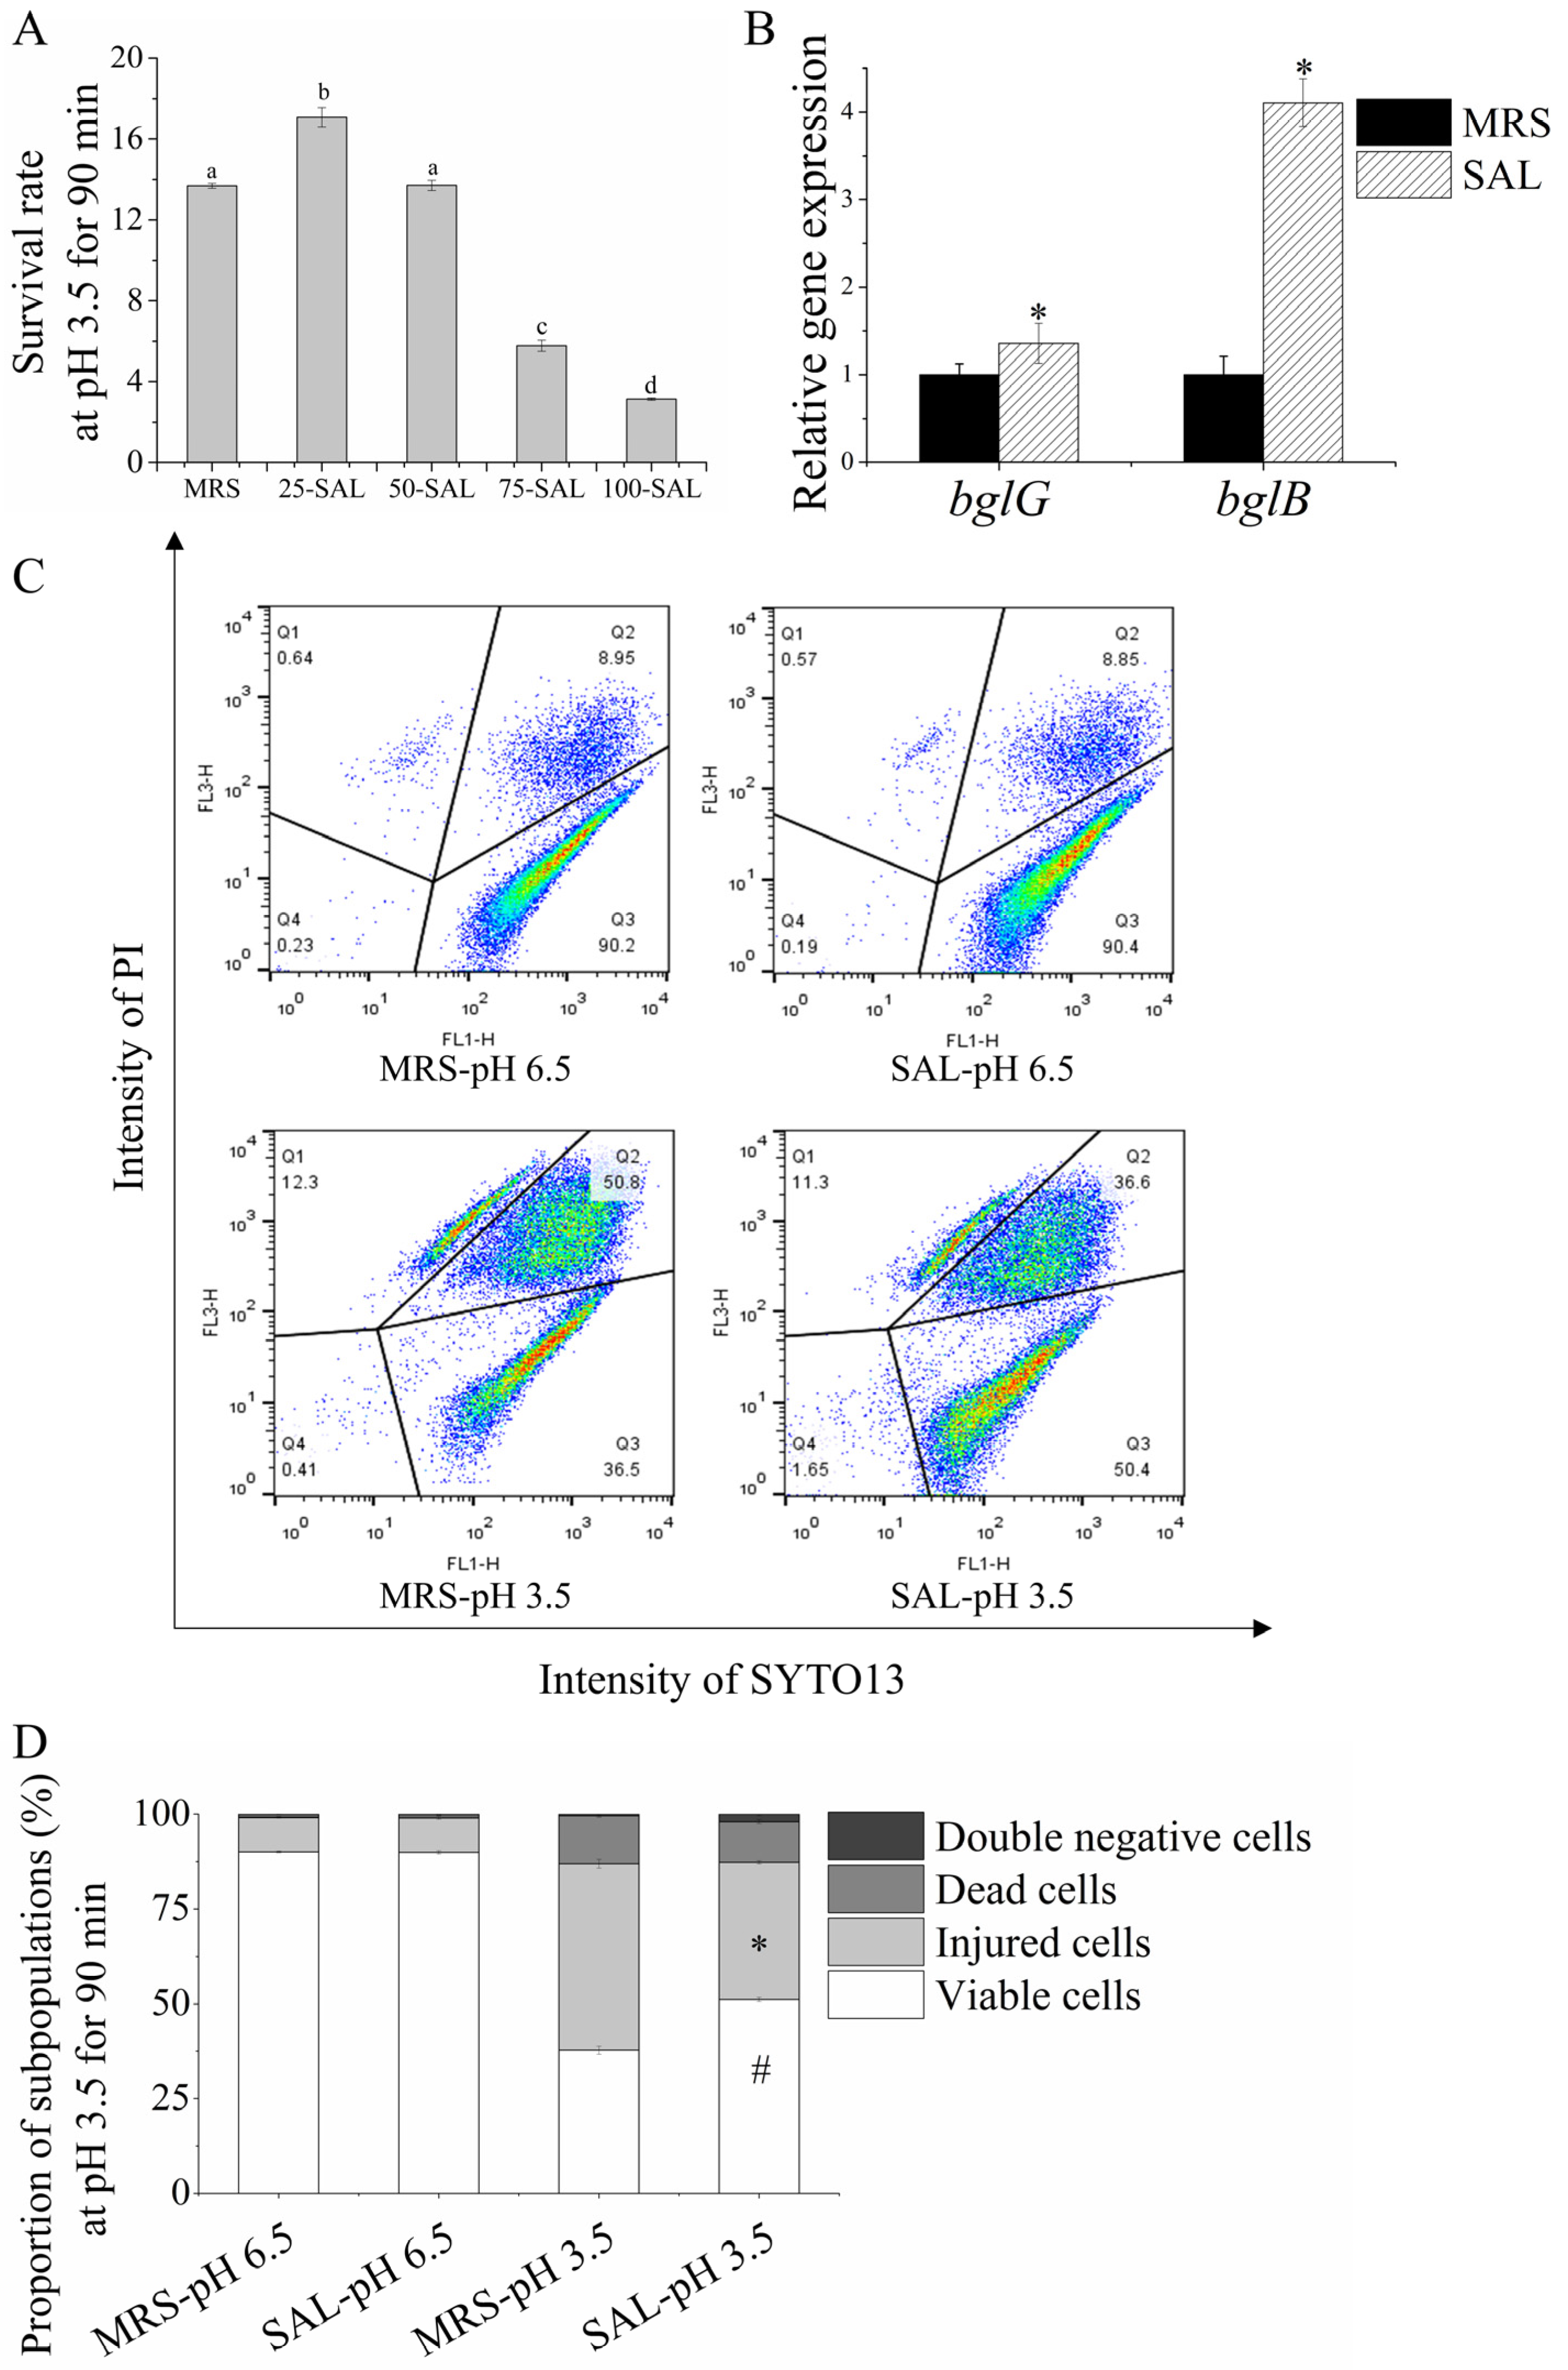
Salicin, a common kind of β-glucoside, was used to activate the bgl operon (bglG) and verify its impact on the subpopulation under acid stress. By replacing glucose with salicin in different proportions in the MRS medium, the survival rates of Lacticaseibacillus paracasei L9 to an acid challenge (pH 3.5, 90 min) were evaluated. Salicin was used to replace 25% glucose in the MRS medium due to it having the highest survival rate. The survival rate of the 25% salicin group was 17.1 ± 0.5%, which was significantly higher than that of the MRS group (13.7 ± 0.1%) (Figure 5A). The gene expression of bglG and bglB (the gene in the bgl operon) of Lacticaseibacillus paracasei L9 was increased when exposed to salicin, with bglG upregulated by 1.36-fold and bglB upregulated by 4.1-fold (Figure 5B).
By FCM, the proportion of viable subpopulations in the SAL group was 51.1 ± 0.6% after the acid challenge, which was significantly higher than that in the MRS group (37.7 ± 1.1%); the proportion of injured subpopulations in the SAL group was significantly reduced to 36.2% ± 0.4% compared with that in the MRS group (49.2 ± 1.2%) (Figure 5C,D). These results demonstrated that salicin induces the expression of bglG in Lacticaseibacillus paracasei L9, reducing the injured subpopulation and improving resistance during the acid challenge.

3.5. bglG Participates in the ATR Heterogeneity of Lacticaseibacillus paracasei L9

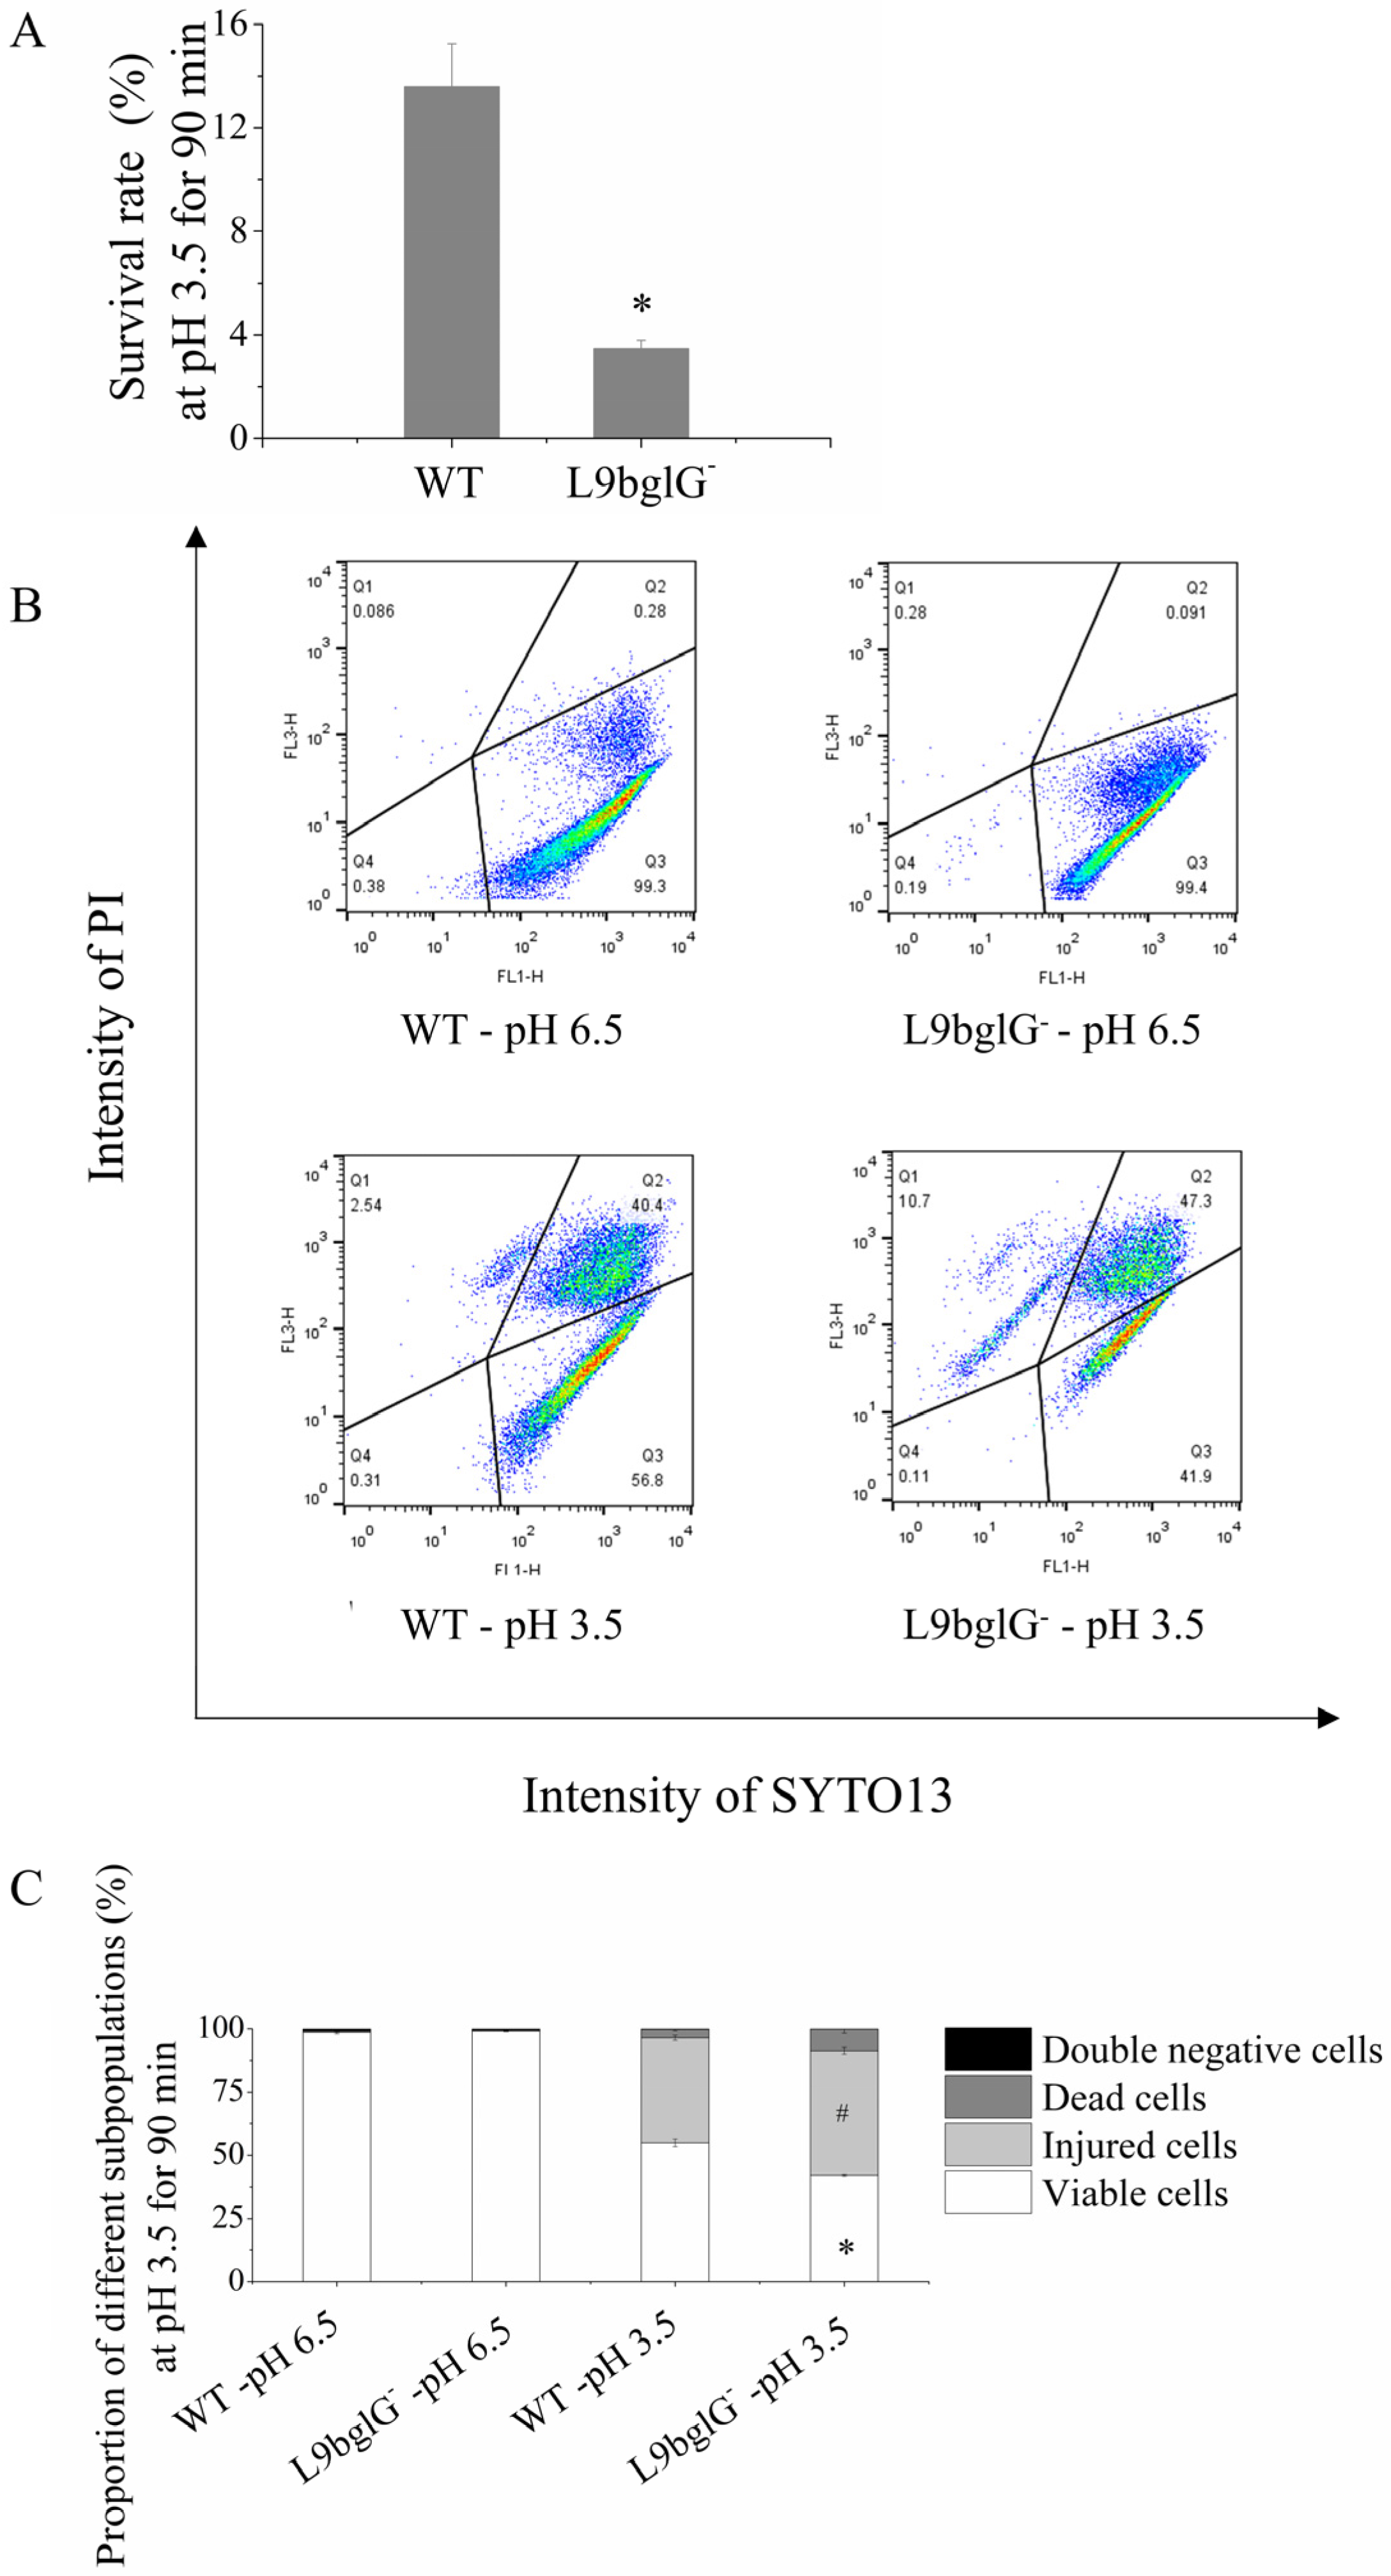
To further investigate the function of bglG in the heterogeneity of ATR in L9, a bglG mutant strain (L9bglG-) was constructed via insertion inactivation. The survival rates of L9bglG at pH 3.5 for 90 min sharply declined compared with those of the wild-type strain (WT). The survival rate of L9bglG- was 3.5 ± 0.3%, which was 10.1% lower than that of the WT (Figure 6A). By FCM, a decrease in FCM-V and an increase in FCM-I in L9bglG after the acid challenge were observed. The viable subpopulation in L9bglG- was reduced to 42.2 ± 0.4% compared with the WT (55.0 ± 1.5%). The FCM-I proportion in L9bglG was increased by 7.7% compared with that in WT (Figure 6B,C). These results revealed that the mutant strains were more seriously damaged during the acid challenge and that bglG may have important roles in the heterogeneity of the ATR. We supposed that bglG not only encoded the anti-transcriptional terminator and regulated the expression of bgl operon to enhance the utilization of β-glucoside but also regulated other downstream genes to participate in the heterogeneity of the ATR in Lacticaseibacillus paracasei L9.

3.6. Potential Genes Regulated by bglG in Acid Responses

To further investigate downstream genes regulated by bglG, gene expression among different subpopulations after the acid challenge (pH 3.5, 90 min) was identified by RNA-Seq. The correlation of gene expression levels between three independent biological replicates was analysed using the Pearson correlation coefficient (Figure S4B).
Differential genes among different subpopulations were analysed according to the process shown in Figure S4A. A total of 152 genes showed opposite regulation trends in L9bglG- and L9-WT after the acid challenge (pH 3.5, 90 min), among which 52 genes were upregulated in L9-WT but not in L9bglG-, and 100 genes were downregulated in L9-WT but not in L9bglG. In STEP 4 in Figure S4A, a similar transcriptome analysis after the acid challenge in the SAL group was conducted, and two gene groups were identified.
Finally, we compared the results of STEP 4 with those of STEP 3, shown in Figure S4A, to obtain the real downstream genes related to bglG. A total of 29 genes were upregulated after the acid challenge in SAL and WT but not in L9bglG-, and 5 had a more severe upregulation in SAL (Table 2). In addition, 79 genes were downregulated in SAL and WT but not in L9bglG, and 48 were obviously downregulated in SAL (Table S3). Among the five upregulated genes, LPL9_RS03660, described as an Hsp20/alpha-crystallin family protein, showed the highest fold upregulation Log2FC (SAL_ACID/SAL), followed by LPL9_RS05270 encoding a type II secretion system F family protein; LPL9_RS08570, related to a hypothetical protein, LPL9_RS10845, described as a MarR family transcriptional regulator; and rpsB, supposed to express the 30S ribosomal protein S2.

4. Discussion

In this study, we observed a heterogeneous subpopulation of Lacticaseibacillus paracasei L9 after acid adaption (pH 5.0, 40 min) by FCM. Different subpopulations showed varying survival rates after exposing cells to acid stress, while viable cells (FCM-V) represented a higher survival rate than injured cells (FCM-I) or the total population. Transcriptome analysis revealed that bglG in the bgl operon (β-glucosidase) was upregulated in FCM-V cells but downregulated in FCM-I cells. Using β-glucoside (salicin) induction and gene mutants, we confirmed that bglG could regulate the heterogeneity of ATR in Lacticaseibacillus paracasei L9. Five genes, including hsp20, might be involved in the regulation of ATR heterogeneity by bglG. To the best of our knowledge, this is the first study reporting on the mechanism of heterogeneity under the ATR in lactic acid bacteria.
Heterogeneity is an effective strategy for microorganisms to fight environmental changes. Diversity within a population can greatly benefit the group, especially when the population experiences sudden changes. In the present study, we found that the acid resistance of Lacticaseibacillus paracasei L9 increased after acid adaption (pH 5.0, 40 min), and there was no significant difference in bacterial number under plate culture but different subpopulations appeared. Similarly, Zhao et al. [13] found that the percentages of injured and dead cells increased, while viable cells decreased in Lactobacillus brevis with increasing stress time when exposed to beer compounds. Similar results were found in Lactococcus lactis during pH-controlled fermentation [16] and Lactobacillus spp. when pH changed [17]. At the same time, we detected that the survival rate of the total population (FCM-T) was between the FCM-V and FCM-I subpopulations, which confirmed that the acid resistance of the total population was a comprehensive reflection of different subpopulations. There is limited research on the subpopulations and tolerances in LAB. Subpopulations differed in metabolic activity: the injured and dead cells were revealed as nonproducing lactic acid cells in Lacticaseibacillus casei [15]. Remarkably, exposure to pH 5.0 resulted in the existence of “injured” cells, which could partly recover by plate culturing but with lower metabolic activity [14,17]. The results indicate the overestimation of the acid tolerance of strains in ordinary analysis. Similar results were also observed in Lactobacillus brevis under beer stress, and “viable” cells showed stronger tolerance [13,14]. Research on the mechanism of heterogeneity formation in lactic acid bacteria is still limited, especially the process of heterogeneity formation under environmental pressure. In addition to LAB, heterogeneous subpopulations of pathogenic bacteria were also found to be resistant to antibiotics in Mycobacterium tuberculosis cells [33,34]. This study showed that the distribution of subpopulations determined the acid tolerance of Lacticaseibacillus paracasei L9, suggesting that the acid tolerance of the strain could be improved by increasing the viable subpopulation and reducing injured subpopulation.
Heterogeneity is an inherent characteristic of microorganisms. However, the mechanism of its formation in LAB is not fully understood. The differences in gene expression in heterogeneous subpopulations driven by stochastic fluctuations or environmental changes were considered an important mechanism. Qi et al. [35] observed obvious gene expression heterogeneity between single cells in biofilm and planktonic culture in Desulfovibrio vulgaris by single-cell qRT‒PCR analysis. In the present study, different subpopulations of Lacticaseibacillus paracasei L9 were sorted by FCM, and RNA-Seq was used to analyse the differences in gene expression among subpopulations. A total of 17 genes were significantly changed in acid-derived subpopulations. LPL9_RS10760 (PTS beta-glucoside transporter subunit IIBCA), LPL9_RS14735 (BglG family transcriptional antiterminator), and LPL9_RS00305 (ABC transporter permease) were all related to glucoside metabolism and upregulated in the viable subpopulation. These results all point to the bgl operon. Therefore, this study focused on the role of the bgl operon in subpopulation regulation. Some tolerance-related proteins in the viable subpopulations, such as LPL9_RS14325 and LPL9_RS03660, had decreased expression, indicating that the gene expression in the subpopulations was different from that in the population. In addition, gene 59 (transcriptive regulator), with the lowest expression, may have been suppressed in the viable subpopulation, but its function needs to be studied in the future. Interestingly, after acid adaption (pH 5.0, 40 min), the bglG expression of the β-glucosidase operon was significantly upregulated in the viable cells (FCM-V) but also downregulated in the injured cells (FCM-I). Using β-glucoside (salicin)-induced bgl operon (bglG) gene expression, the proportion of FCM-V increased significantly, and FCM-I decreased with improved acid tolerance of the strain. Using the bglG- mutant, the proportion of FCM-V decreased significantly, with the acid tolerance of L9bglG- declining. These results confirmed that bglG has an important role in the ATR heterogeneity of Lacticaseibacillus paracasei L9. We found that target genes regulate the ATR heterogeneity of LAB, providing new evidence and methods for acid tolerance regulation in LAB.
The bglG in the bgl operon has a key role in regulating the ATR heterogeneity of Lacticaseibacillus paracasei L9. There is little research on the environmental tolerance of bgl in microorganisms, and currently, only its structure and function have been demonstrated in E. coli. There are few reports that bgl directly affects the tolerance of bacteria. The bgl operon is recognized in the process of utilizing the β-glucosides, such as salicin. In E. coli, the bgl operon comprises three structural genes, bglG, bglF, and bglB, and a regulatory region bglR. bglG encodes an antiterminator. bglF encodes a PTS permease and a negative regulator of the bgl operon, while bglB encodes a phospho-β-glucosidase [27]. During evolution, the bgl operon remained silent in E. coli, but there was no accumulation of inactivation mutations [28]. One explanation for the organism retaining this recessive gene was that although the gene was silent under laboratory conditions, it could be expressed under specific conditions, providing selective advantages for the organism [27]. Therefore, it is speculated that the bgl operon might be involved in the regulation of other cellular functions [23,31,36]. However, no direct evidence suggested that bgl was related to the heterogeneity or ATR of microorganisms. Madan et al. found that the bgl operon of E. coli confers a growth advantage in the stationary phase (GASP), which indicated that wild-type E. coli retaining the bgl operon might have an evolutionary advantage [37]. Harwani et al. discovered that the bgl operon had an indirect regulatory effect on the downstream oppA-encoding oligonucleotide peptide transporter subunits [38]. OppA assists in transporting small peptide segments, enabling potential nutrient absorption and giving E. coli bgl+ strain growth advantages in the stationary phase. In addition to its role in β-glucoside catabolism, the bgl operon also regulates other downstream target genes, forming a selective advantage for organisms. Houman et al. proposed that bglG could combine with the RAT sequence and regulate the transcription of downstream target genes with similar RAT sequences [39]. Gulati et al. found that bglG could affect gene expression by stabilizing the mRNA [40]. In this study, using mutants and salicin induction, we first verified that bglG regulated the ATR heterogeneity of Lacticaseibacillus paracasei L9, which may be related to bgl-target downstream gene expression.
bglG could improve the tolerance of individual cells by regulating their downstream genes. The PTS system may increase different sugar utilization functions and regulate tolerance-related genes to improve environmental tolerance. LPL9_RS03660, encoding an Hsp20/alpha-crystallin family protein, may be involved. The heat shock protein Hsp20 is a family of heat shock proteins synthesized in response to heat or other environmental stresses that act as protein chaperones that can protect other proteins against denaturation and aggregation [41]. We did observe a decrease in gene expression of Hsp20 protein (LPL9_RS03660) in the FCM-V subgroup, while an increase in gene expression of this protein was observed in the FCM-I subgroup. However, we also observed a significant upregulation of Hsp20 protein-encoding gene expression in the total population (FCM-T) of the L9 strain after acid adaption. In subsequent studies, we found that the gene expression of Hsp20 protein in the total population was significantly upregulated after treatment with sublethal acid (acid challenge). The expression level was further slightly upregulated after salicin-induced bglG, while this effect was weakened after bglG deletion. This indicates that Hsp20 may be regulated by BglG. The gene expression levels of Hsp20 in different subpopulations cannot be simply statistically analysed. Heterogeneity within bacterial populations showed different trends from the averaging effect of bulk measurements and could be different from the binary logic imposed by traditional culture-based techniques [14]. Hsp20 has been partially reported in the environmental stress response of lactic acid bacteria, such as Bifidobacterium breve [42], Lactobacillus paracasei [43], and Lactobacillus acetotolerans [44]. It might be associated with early translation and trafficking of stored mRNAs during the exponential phase [44]. However, further research is needed on the role of Hsp20 in the heterogeneity of the ATR. In addition, the MarR (multiple antibiotic resistance repressor) family transcriptional regulator encoded by the gene LPL9_RS10845 regulates antibiotic resistance within a group of pathogens and is related to controlling the oxidative stress response and biofilm formation [41,45]. The results suggested that in addition to the use of salicin, bglG also regulated other downstream target genes encoding Hsp20 and MarR family transcriptional regulators, which are associated with the environmental stress response of microbes. The relationship between the bgl operon and subpopulations and how the bgl operon could regulate its downstream genes need to be further studied at the single-cell level. Meanwhile, gene annotation in Lacticaseibacillus paracasei L9 indicated that bglG is also the homeotic gene of mannitol-specific transcription activator (mtlR). The insertion inactivation of bglG possibly results in polarity and affects the transcription of its downstream genes (mtlF, encoding mannitol-specific IIBC components, LPL9_RS14730; mtlD, encoding mannitol-1-phosphate 5-dehydrogenase, LPL9_RS14725), which might be related to the metabolism of mannitol [21]. Future research needs to further elucidate the relationship between bglG and its downstream genes, as well as its role in the heterogeneity of ATR.

5. Conclusions

This study found that acid adaption-induced ATR significantly improved the acid tolerance of Lacticaseibacillus paracasei L9 at the population level. More importantly, we observed that the ATR induced heterogeneous subpopulations of Lacticaseibacillus paracasei L9, with the live subpopulation having the highest acid tolerance, and the acid tolerance of the total population was a manifestation of the subpopulations. Furthermore, we found for the first time at the microbial subpopulation level that bglG plays a crucial role in the ATR heterogeneity of Lacticaseibacillus paracasei L9, and its downstream regulation of hsp20 may be an important regulatory mechanism. This research confirmed that gene expression fluctuations can cause heterogeneity in environmental stress tolerance in lactic acid bacteria, and by locating and regulating genes related to heterogeneity, a new perspective was proposed to improve the stress tolerance of strains.

Supplementary Materials

The following supporting information can be downloaded at: https://www.mdpi.com/article/10.3390/foods12213971/s1, Figure S1: Insertional inactivation of bglG; Figure S2: Proportions of subpopulations induced by acid tolerance response of L. paracasei L9; Figure S3: Pearson correlation and principal component analysis between samples of RNA-Sequencing; Figure S4: The analysis method of differential genes in ATR of L. paracasei L9 using RNA-Seq; Table S1: Bacterial strains and plasmids; Table S2: Primers used in PCR; Table S3: 48 genes down-regulated in SAL & WT but not in L9bglG-, had seriously downregulation in SAL. Table S4: A total of 17 genes showed different regulatory trends between FCM-V subpopulation and FCM-I subpopulation and classified by COG Category.

Author Contributions

Z.S.: writing—original draft, validation, formal analysis, investigation, and visualization. L.L.: data curation, visualization, formal analysis, and writing—original draft. Z.Z.: methodology and resources. J.L.: methodology and data curation. L.C.: methodology and data curation. Y.H.: resources and methodology. L.Z.: conceptualization, writing—review and editing, resources, supervision, and data curation. All authors have read and agreed to the published version of the manuscript.

Funding

This study was supported by the National Natural Science Foundation of China (32072196), the National Key Research and Development Program of China (2022YFF1100103), and the “111 Project” from the Education Ministry of China (No. B18053). The funding sources were not involved in the study design, data collection and interpretation, or the decision to submit the work for publication.

Data Availability Statement

All the transcriptomics raw data have been uploaded to NCBI (https://www.ncbi.nlm.nih.gov/sra, accessed on 3 February 2023) in BioProject (Accession No. PRJNA926023 and PRJNA921824).

Acknowledgments

The authors thank Tong Zhao for their help in FCM analysis. The authors also thank Fazheng Ren, Pinglan Li, Xueying Mao, Ming Zhang, Shaoyang Ge, Hongliang Li, Huiyuan Guo, and Hao Zhang for their support in the research and manuscript preparing.

Conflicts of Interest

The authors declare no conflict of interest.

References

  1. Magdanova, L.A.; Golyasnaya, N.V. Heterogeneity as an adaptive trait of microbial populations. Microbiology 2013, 82, 1–10. [Google Scholar] [CrossRef]
  2. Gazel, D.; Erinmez, M.; Büyüktaş Manay, A.; Zer, Y. Investigation of heteroresistant vancomycin intermediate Staphylococcus aureus among MRSA isolates. J. Infect. Dev. Countr. 2021, 15, 89–94. [Google Scholar] [CrossRef] [PubMed]
  3. Jo, J.; Ko, K.S. Tigecycline heteroresistance and resistance mechanism in clinical isolates of Acinetobacter baumannii. Microbiol. Spectr. 2021, 9, e101021. [Google Scholar] [CrossRef]
  4. Davis, K.M.; Isberg, R.R. Defining heterogeneity within bacterial populations via single cell approaches. Bioessays 2016, 38, 782–790. [Google Scholar] [CrossRef] [PubMed]
  5. González-Cabaleiro, R.; Mitchell, A.M.; Smith, W.; Wipat, A.; Ofiţeru, I.D. Heterogeneity in pure microbial systems: Experimental measurements and modeling. Front. Microbiol. 2017, 8, 1813. [Google Scholar] [CrossRef] [PubMed]
  6. Carlquist, M.; Fernandes, R.L.; Helmark, S.; Heins, A.; Lundin, L.; Sørensen, S.J.; Gernaey, K.V.; Lantz, A.E. Physiological heterogeneities in microbial populations and implications for physical stress tolerance. Microb. Cell Fact. 2012, 11, 94. [Google Scholar] [CrossRef]
  7. Lidstrom, M.E.; Konopka, M.C. The role of physiological heterogeneity in microbial population behavior. Nat. Chem. Biol. 2010, 6, 705–712. [Google Scholar] [CrossRef] [PubMed]
  8. Ackermann, M. A functional perspective on phenotypic heterogeneity in microorganisms. Nat. Rev. Microbiol. 2015, 13, 497–508. [Google Scholar] [CrossRef]
  9. Dewachter, L.; Fauvart, M.; Michiels, J. Bacterial heterogeneity and antibiotic survival: Understanding and combatting persistence and heteroresistance. Mol. Cell 2019, 76, 255–267. [Google Scholar] [CrossRef]
  10. Rainey, P.B.; Beaumont, H.J.; Ferguson, G.C.; Gallie, J.; Kost, C.; Libby, E.; Zhang, X.X. The evolutionary emergence of stochastic phenotype switching in bacteria. Microb. Cell Fact. 2011, 10 (Suppl. 1), S14. [Google Scholar] [CrossRef]
  11. Newman, J.R.S.; Ghaemmaghami, S.; Ihmels, J.; Breslow, D.K.; Noble, M.; DeRisi, J.L.; Weissman, J.S. Single-cell proteomic analysis of S. cerevisiae reveals the architecture of biological noise. Nature 2006, 441, 840–846. [Google Scholar] [CrossRef] [PubMed]
  12. Kuchina, A.; Brettner, L.M.; Paleologu, L.; Roco, C.M.; Rosenberg, A.B.; Carignano, A.; Kibler, R.; Hirano, M.; Depaolo, R.W.; Seelig, G. Microbial single-cell RNA sequencing by split-pool barcoding. Science 2021, 371, eaba5257. [Google Scholar] [CrossRef] [PubMed]
  13. Zhao, Y.; Knøchel, S.; Siegumfeldt, H. Heterogeneity between and within strains of Lactobacillus brevis exposed to beer compounds. Front. Microbiol. 2017, 8, 239. [Google Scholar] [CrossRef] [PubMed]
  14. Papadimitriou, K.; Pratsinis, H.; Nebe-von-Caron, G.; Kletsas, D.; Tsakalidou, E. Rapid assessment of the physiological status of Streptococcus macedonicus by flow cytometry and fluorescence probes. Int. J. Food Microbiol. 2006, 111, 197–205. [Google Scholar] [CrossRef] [PubMed]
  15. Alonso, S.; Herrero, M.; Rendueles, M.; Díaz, M. Physiological heterogeneity in Lactobacillus casei fermentations on residual yoghurt whey. Process Biochem. 2014, 49, 732–739. [Google Scholar] [CrossRef]
  16. Hansen, G.; Johansen, C.L.; Marten, G.; Wilmes, J.; Jespersen, L.; Arneborg, N. Influence of extracellular pH on growth, viability, cell size, acidification activity, and intracellular pH of Lactococcus lactis in batch fermentations. Appl. Microbiol. Biot. 2016, 100, 5965–5976. [Google Scholar] [CrossRef]
  17. Olszewska, M.A.; Kocot, A.M.; Laniewska-Trokenheim, L. Physiological functions at single-cell level of Lactobacillus spp. isolated from traditionally fermented cabbage in response to different pH conditions. J. Biotechnol. 2015, 200, 19–26. [Google Scholar] [CrossRef]
  18. Yang, J.; Ren, F.; Zhang, H.; Jiang, L.; Hao, Y.; Luo, X. Induction of regulatory dendritic cells by Lactobacillus paracasei L9 prevents allergic sensitization to bovine β-lactoglobulin in mice. J. Microbiol. Biotechnol. 2015, 25, 1687–1696. [Google Scholar] [CrossRef]
  19. Zhai, Z.; Douillard, F.P.; An, H.; Wang, G.; Guo, X.; Luo, Y.; Hao, Y. Proteomic characterization of the acid tolerance response in Lactobacillus delbrueckii subsp. bulgaricus CAUH1 and functional identification of a novel acid stress-related transcriptional regulator Ldb0677. Environ. Microbiol. 2014, 16, 1524–1537. [Google Scholar] [CrossRef]
  20. Kristensen, L.S.; Siegumfeldt, H.; Larsen, N.; Jespersen, L. Diversity in NaCl tolerance of Lactococcus lactis strains from DL-starter cultures for production of semi-hard cheeses. Int. Dairy. J. 2020, 105, 104673. [Google Scholar] [CrossRef]
  21. Fu, H.; Yang, L.; Zhang, H.; Wang, J. Deciphering of the mannitol metabolism pathway in Clostridium tyrobutyricum ATCC 25755 by comparative transcriptome analysis. Appl. Biochem. Biotechnol. 2023, 195, 1072–1084. [Google Scholar] [CrossRef] [PubMed]
  22. Wang, H.; Pu, Y.; Li, J.Y.; Yin, X.; Liao, Y.H. Isolation and identification of lactic acid bacteria from mud of Baijiu and comparison of fermented volatile flavor compounds. J. Food Sci. Technol. 2020, 38, 26–35. [Google Scholar]
  23. Mukerji, M.; Mahadevan, S. Cryptic genes: Evolutionary puzzles. J. Genet. 1997, 76, 147–159. [Google Scholar] [CrossRef]
  24. Prasad, I.; Schaefler, S. Regulation of the beta-glucoside system in Escherchia coli K-12. J. Bacteriol. 1974, 120, 638–650. [Google Scholar] [CrossRef] [PubMed]
  25. Raghunand, T.R.; Mahadevan, S. Mutational analysis of β-glucoside utilization in Klebsiella aerogenes: Evidence for the presence of multiple genetic systems. J. Genet. 2004, 83, 285–289. [Google Scholar] [CrossRef]
  26. Dole, S.; Kühn, S.; Schnetz, K. Post-transcriptional enhancement of Escherichia coli bgl operon silencing by limitation of BglG-mediated antitermination at low transcription rates. Mol. Microbiol. 2002, 43, 217–226. [Google Scholar] [CrossRef]
  27. Harwani, D. Regulation of gene expression: Cryptic beta-glucoside (bgl) operon of Escherichia coli as a paradigm. Braz. J. Microbiol. 2014, 45, 1139–1144. [Google Scholar] [CrossRef] [PubMed]
  28. Madan, R.; Moorthy, S.; Mahadevan, S. Enhanced expression of the bgl operon of Escherichia coli in the stationary phase. FEMS Microbiol. Lett. 2008, 288, 131–139. [Google Scholar] [CrossRef]
  29. Fox, C.F.; Wilson, G. The role of a phosphoenolpyruvate-dependent kinase system in beta-glucoside catabolism in Escherichia coli. Proc. Natl. Acad. Sci. USA 1968, 59, 988–995. [Google Scholar] [CrossRef]
  30. Dole, S.; Klingen, Y.; Nagarajavel, V.; Schnetz, K. The protease Lon and the RNA-binding protein Hfq reduce silencing of the Escherichia coli bgl operon by H-NS. J. Bacteriol. 2004, 2708–2716. [Google Scholar] [CrossRef]
  31. Mukerji, M.; Mahadevan, S. Characterization of the negative elements involved in silencing the bgl operon of Escherichia coli: Possible roles for DNA gyrase, H-NS, and CRP-cAMP in regulation. Mol. Microbiol. 1997, 24, 617–627. [Google Scholar] [CrossRef] [PubMed]
  32. Ohta, T.; Ueguchi, C.; Mizuno, T. rpoS function is essential for bgl silencing caused by C-terminally truncated H-NS in Escherichia coli. J. Bacteriol. 1999, 181, 6278–6283. [Google Scholar] [CrossRef]
  33. Comas, I.; Borrell, S.; Roetzer, A.; Rose, G.; Malla, B.; Kato-Maeda, M.; Galagan, J.; Niemann, S.; Gagneux, S. Whole-genome sequencing of rifampicin-resistant Mycobacterium tuberculosis strains identifies compensatory mutations in RNA polymerase genes. Nat. Genet. 2012, 44, 106–110. [Google Scholar] [CrossRef] [PubMed]
  34. Eilertson, B.; Maruri, F.; Blackman, A.; Herrera, M.; Samuels, D.C.; Sterling, T.R. High proportion of heteroresistance in gyrA and gyrB in fluoroquinolone-resistant Mycobacterium tuberculosis clinical isolates. Antimicrob. Agents Chemother. 2014, 58, 3270–3275. [Google Scholar] [CrossRef] [PubMed]
  35. Qi, Z.H. Single-Cell Gene Expression Analysis of Transcriptional Heterogeneity in Monoculture and Dual-Culture of Desulfovibrio vulgaris. Doctoral Thesis, Tianjin University, Tianjin, China, 2016. [Google Scholar]
  36. Esen, A. β-Glucosidases: Biochemistry and Molecular Biology; American Chemical Society: Washington, DC, USA, 1993; pp. 1–13. [Google Scholar]
  37. Madan, R.; Kolter, R.; Mahadevan, S. Mutations that activate the silent bgl operon of Escherichia coli confer a growth advantage in stationary phase. J. Bacteriol. 2005, 187, 7912–7917. [Google Scholar] [CrossRef]
  38. Harwani, D.; Zangoui, P.; Mahadevan, S. The β-glucoside (bgl) operon of Escherichia coli is involved in the regulation of oppA, encoding an oligopeptide transporter. J. Bacteriol. 2012, 194, 90–99. [Google Scholar] [CrossRef]
  39. Houman, F.; Diaz-Torres, M.R.; Wright, A. Transcriptional antitermination in the bgl operon of E. coli is modulated by a specific RNA binding protein. Cell 1990, 62, 1153–1163. [Google Scholar] [CrossRef]
  40. Gulati, A.; Mahadevan, S. The Escherichia coli antiterminator protein BglG stabilizes the 5’region of the bgl mRNA. J. Biosci. 2001, 26, 193–203. [Google Scholar] [CrossRef]
  41. Gusev, N.B.; Bukach, O.V.; Marston, S.B. Structure, properties, and probable physiological role of small heat shock protein with molecular mass 20 kD (Hsp20, HspB6). Biochemistry 2005, 6, 629–637. [Google Scholar] [CrossRef]
  42. Ventura, M.; Canchaya, C.; Zhang, Z.; Fitzgerald, G.F.; van Sinderen, D. Molecular characterization of hsp20, encoding a small heat shock protein of Bifidobacterium breve UCC2003. Appl. Environ. Microb. 2007, 73, 4695–4703. [Google Scholar] [CrossRef]
  43. Wu, R.; Xu, X.; Meng, L.; Zou, T.; Tang, X.; Wu, J.; Yue, X. Identification of salt stress responsive protein in Lactobacillus paracasei LN-1 using SDS-PAGE. IERI Procedia 2014, 8, 60–65. [Google Scholar] [CrossRef]
  44. Yang, X.; Teng, K.; Zhang, J.; Wang, F.; Zhang, T.; Ai, G.; Han, P.; Bai, F.; Zhong, J. Transcriptome responses of Lactobacillus acetotolerans F28 to a short and long term ethanol stress. Sci. Rep. 2017, 7, 2650. [Google Scholar] [CrossRef] [PubMed]
  45. Alves, J.A.; Previato-Mello, M.; Barroso, K.C.M.; Koide, T.; Da Silva Neto, J.F. The MarR family regulator OsbR controls oxidative stress response, anaerobic nitrate respiration, and biofilm formation in Chromobacterium violaceum. BMC Microbiol. 2021, 21, 304. [Google Scholar] [CrossRef] [PubMed]
Figure 1. Survival of Lacticaseibacillus paracasei L9 under acid challenge following acid adaption with different pH. (A) Acid treatment at pH 5.0 for 40 min did not significantly affect its survival. The 0 h bar represents the viable count of Lacticaseibacillus paracasei L9 before acid treatment. (B) Acid adaption at pH 5.0 significantly increased the survival rate of Lacticaseibacillus paracasei L9 under a lethal acid challenge (pH 3.5 for 90 min). a, b, c indicate significant differences (p < 0.05). Data are presented as the mean ± SD from three biological replicates.
Foods 12 03971 g001
Figure 2. Heterogeneity and subpopulation physiology induced by acid tolerance response of Lacticaseibacillus paracasei L9. (AD) Distribution of Lacticaseibacillus paracasei L9 cells within a flow cytometric dot plot, gate Q4: SYTO13−/PI−, double-negative cells including fragments and unstained intact cells (A); gate Q1: SYTO13−/PI+, dead cells (B); gate Q2: SYTO13+/PI+, injured cells; gate Q3: SYTO13+/PI−, intact viable cells (C). Based on the region of interest with SYTO13 and PI fluorescence, cells were sorted into three groups by flow cytometry sorting: viable subpopulation (FCM-V), injured subpopulation (FCM-I), and total bacteria population (FCM-T). (E,F) Properties of acid resistance of different subpopulations were evaluated. The survival rate of the FCM-V subpopulation was significantly higher than that of the others at pH 3.5 for 20 min (E). Furthermore, different subpopulations had significant differences in intracellular ATP content (F). a, b, c, d indicate significant differences (p < 0.05).
Foods 12 03971 g002
Figure 3. The analysis of heterogeneity of ATR genes of Lacticaseibacillus paracasei L9 by RNA-Sequencing. The transcriptome data were screened and analysed, and 17 genes that showed different regulatory trends between the FCM-V subpopulation and FCM-I subpopulation compared with the non-acid group were selected.
Foods 12 03971 g003
Figure 4. Relative gene expression of bglG in different subpopulations. (A) By analyzing the transcriptome data, the relative expression of bglG showed an opposite trend in FCM-V and FCM-I. (B) Subsequently, the relative expression of bglG after acid adaption (pH 5.0 for 40 min) was verified by RT‒PCR. * indicates significant differences (p < 0.05).
Foods 12 03971 g004
Figure 5. Effects of salicin on acid tolerance characteristics of Lacticaseibacillus paracasei L9. (A) The survival rate at pH 3.5 for 90 min using salicin to replace glucose in different proportions. a, b, c, d indicate significant differences (p < 0.05). (B) The expression of bglG and bglB was induced by salicin. (C,D) The proportion of viable subpopulations of Lacticaseibacillus paracasei L9 at pH 3.5 for 90 min was effectively improved. In flow cytometry dot plot (C), Q1: dead cells (SYTO13−/PI+), Q2: injured cells (SYTO13+/PI+), Q3: viable cells (SYTO13+/PI−), Q4: double-negative cells including fragments and unstained intact cells (SYTO13−/PI−). * and # indicate significant differences between the SAL-pH 3.5 group and MRS-pH 3.5 group in the proportion of injured and viable subpopulations, respectively (p < 0.05).
Foods 12 03971 g005
Figure 6. Effects of bglG on acid tolerance characteristics of Lacticaseibacillus paracasei L9. (AC) The survival rate (A) and proportion of different subpopulations (B,C) of L9bglG- after acid challenge (pH 3.5 for 90 min). In the flow cytometry dot plot (B), Q1: dead cells (SYTO13−/PI+), Q2: injured cells (SYTO13+/PI+), Q3: viable cells (SYTO13+/PI−), Q4: double-negative cells including fragments and unstained intact cells (SYTO13−/PI−). * and # indicate significant differences among the mutant and wild-type strains, respectively, in the proportion of viable and injured subpopulations (p < 0.05).
Foods 12 03971 g006
Table 1. A total of 17 genes showed different regulatory trends between the FCM-V subpopulation and FCM-I subpopulation compared with samples without acid adaption.
No.Gene IDGene Namelog2FC
(FCM-V/Non-Acid)
log2FC
(FCM-I/Non-Acid)
Annotated Function
1gene2198LPL9_RS103702.0377 ↑−1.0162 ↓Amino acid ABC transporter permease
2gene2284LPL9_RS107601.6958 ↑−1.3129 ↓PTS beta-glucoside transporter subunit IIBCA
3gene807LPL9_RS037801.275 ↑−1.0363 ↓Iron–sulfur cluster biosynthesis family protein
4gene66LPL9_RS003051.2064 ↑−1.0832 ↓ABC transporter permease
5gene3139LPL9_RS147351.0483 ↑−1.1387 ↓BglG family transcriptional antiterminator
6gene59LPL9_RS00270−3.3762 ↓1.0407 ↑Transcriptional regulator
7gene1874LPL9_RS08830−2.8654 ↓1.156 ↑Hypothetical protein
8gene2556LPL9_RS12000−2.7301 ↓1.2204 ↑Glutamate 5-kinase
9gene780LPL9_RS03660−1.9645 ↓1.2441 ↑Hsp20/alpha-crystallin family protein
10gene3020LPL9_RS14160−1.7589 ↓1.0555 ↑NUDIX domain-containing protein
11gene3055LPL9_RS14325−1.5069 ↓1.2373 ↑Hsp20/alpha-crystallin family protein
12gene1995LPL9_RS09420−1.4664 ↓1.1811 ↑N-acetyltransferase
13gene1535LPL9_RS07225−1.4 ↓1.0644 ↑Hypothetical protein
14gene1231LPL9_RS05775−1.2073 ↓2.3676 ↑Flavodoxin
15gene1741LPL9_RS08205−1.1713 ↓1.0484 ↑Zinc-containing alcohol dehydrogenase/quinone oxidoreductase[NADPH]
16gene28LPL9_RS00140−1.1 ↓1.9574 ↑Hypothetical protein
17gene1239LPL9_RS05810−1.0844 ↓1.3583 ↑DEAD/DEAH box helicase
↑ indicates upregulate and ↓ indicates downregulate.
Table 2. Five selected genes upregulated after acid challenge in SAL and WT but not in L9bglG-, more obviously upregulated in SAL.
Gene IDGene DescriptionLog2FC
(SAL_ACID/SAL)
Log2FC
(WT_ACID/WT)
LPL9_RS03660Hsp20/alpha-crystallin family protein2.11> 1.99
LPL9_RS05270Type II secretion system F family protein1.61> 1.29
LPL9_RS08570Hypothetical protein1.21> 1.13
LPL9_RS10845MarR family transcriptional regulator1.12> 1.04
LPL9_RS0852030S ribosomal protein S21.1> 1.08
Disclaimer/Publisher’s Note: The statements, opinions and data contained in all publications are solely those of the individual author(s) and contributor(s) and not of MDPI and/or the editor(s). MDPI and/or the editor(s) disclaim responsibility for any injury to people or property resulting from any ideas, methods, instructions or products referred to in the content.