Article

Finding Traceability Granularity Influencing Factors Using Rough Set Method: An Empirical Analysis of Vegetable Companies in Tianjin City, China

1
Key Laboratory of Agricultural Remote Sensing (AGRIRS), Ministry of Agriculture and Rural Affairs/Institute of Agricultural Resources and Regional Planning, Chinese Academy of Agricultural Sciences, Beijing 100081, China
2
Yangtze River Delta Intelligent Agriculture Research Institute of Chinese Academy of Agricultural Sciences, Suzhou 215331, China
3
Institute of Agricultural Products Preservation and Processing Technology (National Engineering Technology Research Center for Preservation of Agriculture Product), Tianjin Academy of Agricultural Sciences/Key Laboratory of Postharvest Physiology and Storage of Agricultural Products, Ministry of Agriculture and Rural Affairs, Tianjin 300384, China
4
Tianjin Agricultural Development Service Center, Tianjin 300061, China
*
Author to whom correspondence should be addressed.
Foods 2023, 12(11), 2124; https://doi.org/10.3390/foods12112124
Submission received: 10 April 2023 / Revised: 17 May 2023 / Accepted: 20 May 2023 / Published: 24 May 2023
(This article belongs to the Section Food Systems)

Abstract

:
The effectiveness evaluation of the traceability system (TS) is a tool for enterprises to achieve the required traceability level. It plays an important role not only for planning system implementation before development but also for analyzing system performance once the system is in use. In the present work, we evaluate traceability granularity using a comprehensive and quantifiable model and try to find its influencing factors via an empirical analysis with 80 vegetable companies in Tianjin, China. We collect granularity indicators mostly through the TS platform to ensure the objectivity of the data and use the TS granularity model to evaluate the granularity score. The results show that there is an obvious imbalance in the distribution of companies as a function of score. The number of companies (21) scoring in the range (50,60) exceeded the number in the other score ranges. Furthermore, the influencing factors on traceability granularity were analyzed using a rough set method based on nine factors pre-selected using a published method. The results show that the factor “number of TS operation staff” is deleted because it is unimportant. The remaining factors rank according to importance as follows: Expected revenue > Supply chain (SC) integration degree > Cognition of TS > Certification system > Company sales > Informationization management level > System maintenance investment > Manager education level. Based on these results, the corresponding implications are given with the goal of (i) establishing the market mechanism of high price with high quality, (ii) increasing government investment for constructing the TS, and (iii) enhancing the organization of SC companies.

1. Introduction

With ever more attention being devoted to the topic of food safety, traceability is looked at as an effective method to ensure food safety and quality and to reduce the costs associated with recalls [1,2,3,4,5]. Traceability is defined in international standards, legislation, and even dictionaries [6,7]. Olsen and Borit offered a new definition, namely, the ability to access any or all information relating to that which is under consideration, throughout its entire life cycle, by means of recorded identifications [8].
Driven by food safety and quality as well as by regulatory, social, economic, and technological concerns, mandatory or voluntary traceability systems are now being enforced worldwide [9,10,11,12]. Several systems of government supervision, like the EU Rapid Alert System for Food and Feed (RASFF), the Food Modernization and Safety Act (USA), and the National Agriculture and Food Traceability System (Canada), have been implemented [13,14]. To improve company supply chain management (SCM), research has focused on state traceability systems and their application for satisfying the various requirements of agro-food or food quality, such as for vegetables [15,16], fruits [17,18,19], olive oil [20], aquaculture [21], meat [22], or beef [23,24].
It is very important to measure the degree of traceability when working with a widely applied TS. Such measurements play an important part not only in system implementation plans before deployment but also in analyzing system performance after the system is in use [25]. Precision, breadth, and depth were the early metrics for TS [26]. Precision reflects the degree of assurance with which the TS can pinpoint the movement or characteristics of a particular food product. Breadth describes the amount of information the TS records, and depth describes how far back or forward the TS tracks. Next, granularity was defined to reflect the size and number of product batches [27]. Finer traceability granularity means increasingly detailed information about a product and allows for recalls to be done on a more detailed and range-limited level [28]. In addition, other metrics are used to measure TSs, such as purity in horticultural pack-house-processing transformations [29] and capability, rapidity, and accuracy in fish-processing plants [30].
Targeting a comprehensive and quantifiable TS, Qian et al. proposed a novel traceability-granularity model for agro-food [31]. The model includes a comprehensive evaluation index that combines precision, breadth, and depth with a quantifiable evaluation model to measure TS level. The model was applied in preliminary tests to two companies in the wheat-flour supply chain. However, the preliminary tests may result from three limitations: (i) ignoring the company’s characteristics; (ii) limiting the survey samples; and (iii) confusing internal traceability with chain traceability. To overcome these shortcomings and resolve these puzzles, the traceability-granularity model was validated using data generated by 80 vegetable companies. Moreover, the influencing factors were analyzed based on a rough set to find the driving forces causing differences in traceability and granularity.
In this paper, Section 2 introduces the granularity-evaluation model, which is based on previous research. Section 3 describes the materials and methods, and Section 4 presents the results of the granularity evaluation and analyzes the factors that influence it. The main conclusions and policy suggestions are presented in Section 5.

2. Granularity-Evaluation Model and Influence Factors

2.1. Granularity-Evaluation Model to Measure Traceability

Defining and evaluating the performance of the TS is an important means to measure the differentiation and implementation effects of the traceability system. Qian et al. developed a traceability-granularity model to measure agro-food TS [31]. The model was constructed by using a two-layer index system, in which the first layer includes mainly factors such as precision, breadth, and depth, and the second layer includes seven indicator sub-factors: external trace units, internal flow units, identification unit (IU) conversion, information collection content, information update frequency, forward-tracking distance, and backward-tracking distance. The score of each indicator is rated by some 20 experts. The weight value of a granularity evaluation indicator is calculated by an analytic hierarchy process. The weights of the seven indicators were 0.1985, 0.1141, 0.0872, 0.1870, 0.1248, 0.1442, and 0.1442, respectively, as shown in Table 1.
We use a weighted sum to evaluate the traceability granularity:
S = 20 i = 1 n s i w i
In this formula, n is the number of indicators, s i is the score of indicator i, and w i is the weight of indicator i. Considering the evaluation involves a five-score system, the overall evaluation scores are extended by a factor of 20; therefore, the total evaluation score is 100, which increases the discrimination.
The evaluation score represents a comprehensive result. The higher the evaluation score, the higher the traceability granularity.

2.2. Selection of Factors That Influence Traceability

Recently, research has focused on the factors that influence the motivation to implement traceability, such as expected revenue, government policy, market requirements, authentication systems, company characteristics, human resources, and so on [32,33,34,35]. These main influencing factors are listed in Table 2.
From the factors found in this selection of literature, we selected nine and rejected two. Considering the TS was established by the government and applied according to the actual environment in which each company evolved, the factor of government policy can be seen as a similarity. Most vegetable companies deal with the local market or processing companies, so the market requirement is the same for most companies. Thus, we neglect the factors of government policy and market requirements in this research. Nine factors were selected for analyzing the factors that influence TS granularity. First, we conducted a preliminary investigation of 15 companies to determine the range of these factors. The main factors and the associated range are listed below.
(1) Expected revenue
The success of applying the TS to companies depends strongly on net revenue. When the expected revenue exceeds the investment, the company is motivated to use the TS. In this research, expected revenue is divided into five ranges: <0%, 0–5%, 5–10%, 10–15%, 15–20%, and >20%.
(2) Certification system
To a certain extent, quality certification reflects the importance that the company places on quality and safety. Certification systems include ISO 9000 certification, the Good Agriculture Practice, the Hazard Analysis and Critical Control Point, and other certifications, such as the Green Food Certification or the Organic Food Certification.
(3) Degree of SC integration
The stages of the vegetable supply chain include planting, processing, wholesale, and retail. The degree of SC integration indicates the degree to which SC stages are incorporated into company procedures, be they internal to the company or between companies. A higher degree of integration corresponds to a higher degree of SC integration, and vice versa.
(4) Education level of managers
Management desire plays an important part in implementing a TS. The education level of managers is related to the long-term viability of the TS. The education level of managers is divided into five categories: non-high school graduate, high school degree, college degree, master’s degree, and doctoral degree.
(5) Company sales
Company sales are an important factor. In this paper, sales in 2015 serve as an indicator of company size. The 80 companies were divided into five ranges of sales: <5 million yuan, 5–10 million yuan, 10–30 million yuan, 30–50 million yuan, and >50 million yuan.
(6) Number of TS operation staff
Human resources impact TS performance. Here, the ratio of TS operation staff to regular staff is used as the human resources indicator.
(7) Level of information management
Information technology and management are key parts of implementing a TS. Equipment such as computers and barcode printers is necessary. Here, we use the number of computers per 100 people as an indicator of the level of information management.
(8) Cognition of TS
Although TS has spread in China in recent years, the cognition of TS by company managers is a step-by-step process. We evaluate the cognition of TS by asking company managers, “What is TS?”, “Which benefits can TS bring?”, “What is the main technology used to implement TS?”, and “Do you plan to use TS in your company?”
(9) Investment in system maintenance
Although system development is supported by the government, companies are expected to invest in system maintenance. To some extent, system-maintenance investment embodies the desire to sustainably use TS. To reflect this, we use the ratio of system-maintenance investment to company sales as an indicator.

3. Materials and Method

3.1. Study-Case Overview

The study zone is in Tianjin city, which is one of the four municipalities under direct control of the Central Government of China (Figure 1). The “rest-assured vegetable action plan” was started in 2012 to ensure food safety. The goal was to construct 25,000 ha of pollution-free land in four years and produce 2.4 million tons of high-quality vegetables each year, capable of meeting the demand of the whole city. As of December 2016, 243 bases have joined this plan.
To implement the plan, the TS was made mandatory. The TS includes four parts: the on-line authentication subsystem (OAS), the safety production management client (SMC), the mobile mobile application (MSA), and the on-line searching subsystem (OSS). Figure 2 shows a supervision and traceability flow framework with information and communication technologies. An OAS was applied by a supervisory agency to implement the origin base and its product authentication. The SMC was applied by the authorized origin base for information management and to print two-dimensional barcode labels with an authorized identification. The MSA was applied by the supervisory agency to check the authentication information in real time and implement on-scene communication with OAS. The OSS was used to implement the traceability information query.
We selected 80 vegetable companies in Tianjin city for this study. Although implementing traceability is mandatory, the performance level differs according to the situation of each company and their subjective desires. In other words, basic information and information batches were required from each company and were recorded to search for identification patterns, information content, and so on. This approach leads to differences in traceability granularity.

3.2. Data Collection to Evaluate Granularity

The TS platform aggregates a variety of detailed enterprise information, traceability information, and more. The granularity evaluation model requires seven indicators. The information can be collected via the OSS of the TS platform. When a traceability code is input into the system, the traceability information, including external trace units, simple information content, information-update frequency, forward-tracking distance, and backward-tracking distance, is displayed on the interface. Considering company trade secrets, customers are provided only partial information. Therefore, information related to internal flow units, IU conversion, and detailed information content is obtained from the SMC.

3.3. Characteristics of Companies Surveyed

With the TS used in Tianjin, information on nine factors that influence the TS’s success is available from the company registration interface on the OAS, as depicted in Figure 3. Eighty company characteristics are classified according to these influencing factors. As shown in Table 3, companies with expected revenue of 0–5% and 5–10% account for 30% and 46.25% of the sample, respectively. Thus, most of the companies surveyed clearly did not expect much revenue from implementing the TS. Other certifications, such as a certification of non-pollution (53.75%), dominate the sample of companies. Considering the vegetable-planting characteristics, most of the companies have either a medium or low degree of SC integration (15% and 47.5%, respectively). A few companies have a high or very high degree of SC integration because of a connection with a vegetable processing chain, a vegetable distribution chain, or even vegetable sales. For the managers, 60% have a college education. Only a few managers have no high school degree or a doctoral degree (5% and 2.5%, respectively). For annual company sales, 78.75% of the companies had less than 30 million yuan in 2015. For leadership in the vegetable industry, most companies have one designated TS employee, although some have none. The level of information management differs between companies, with most falling into the categories of medium and low. Finally, based on the survey of company managers, cognition of TS is mostly medium or high (50% and 26.25%, respectively). Thus, over half of the companies invest only 1–3% of sales in system maintenance.

3.4. Rough Set Method

Rough set theory can be used to identify and evaluate the dependence of data with the premise of retaining key information, revealing the importance of the condition attribute in determining the decision attribute, and removing redundant or unimportant condition attributes [49]. Details on rough set theory are available in the literature [50,51]. The rough set method has three parts: setting up the initial decision table, data preprocessing, and knowledge reduction [52]. The basic concepts are outlined below.

3.4.1. Information System

Let S = ( U , A , V , f ) be an information system, where U is a nonempty finite universe; in this case, the 80 companies in the sample. A is a nonempty finite set consisting of C and D, which are the condition- and decision-attribute sets, respectively. In this study, the condition-attribute set consists of nine factors, and the decision-attribute set is the TS granularity grade. The TS granularity scores are divided into five grades that increment by 20. V = a A V a , where Va is the numerical range of attribute a. f : U × A V is the information function. The information system S = (U, A) is also called the decision table.

3.4.2. Equivalence Relation

Let R be an equivalence relation in U. Each nonempty subset R A determines an indiscernibility relation IND(R) that divides U into k categories: X1, X2, X3,..., Xk. Each category represents a company from the sample of companies being investigated.

3.4.3. Approximations and Positive Region

We construct lower and upper approximations to define the degree of approximation of each attribute. The lower approximation R(X), also called the positive region of X, is denoted POSR(X). R(X) is the certain element set classified as R A , which is the maximum definition including X. R ¯ ( X ) is the uncertain element set, which is the minimal definition including X.

3.4.4. Attribute Importance

In information system S, the decision table is reduced according to the importance of the decision attribute. To start, to define the degree γ C D of dependency of each attribute, we calculate the ratio of the positive region element number of each attribute |POSC(D)| to the number of samples |U|. The equation is as follows:
γ C D = P O S C D U
Next, we calculate the importance S i g D C i of each condition attribute, where
S i g D C i = γ C D γ C C i D

4. Results Analysis

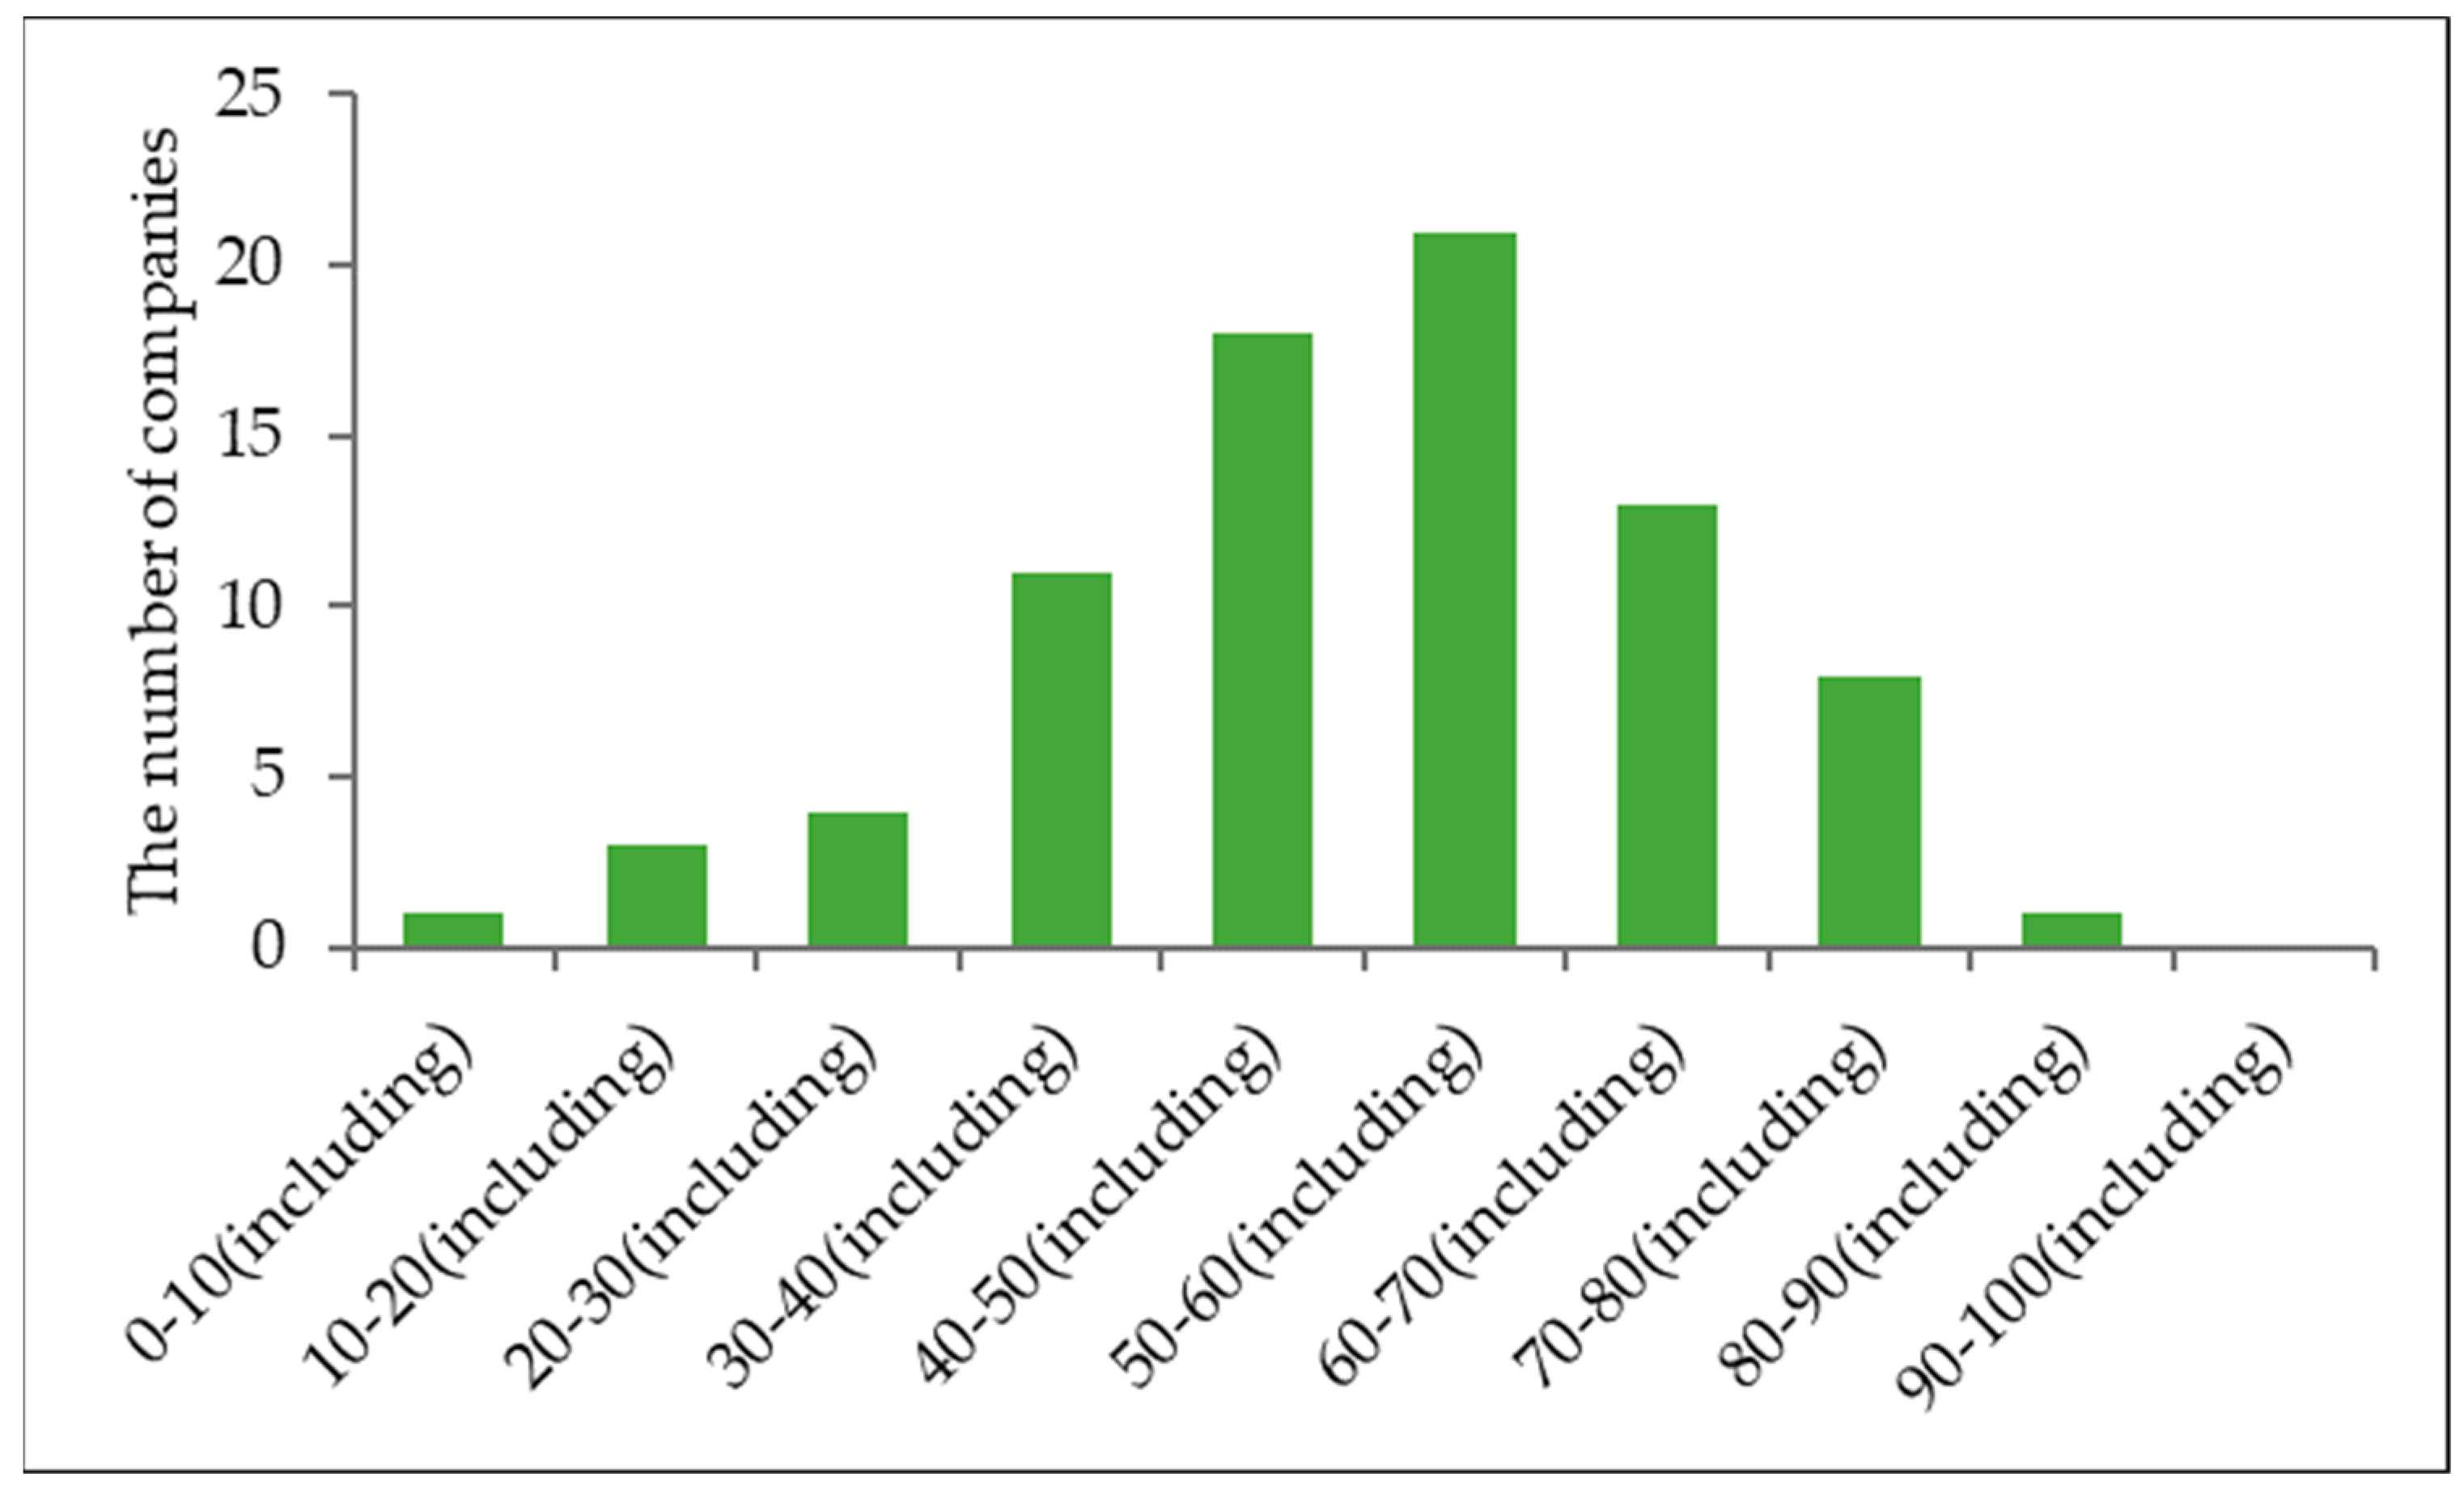
4.1. Comparison of Granularity

We use the model to evaluate TS granularity. The traceability granularity of the 80 companies is graded in score increments of 10, as shown in Figure 4.
Figure 4 shows that the distribution of 80 companies as a function of score is clearly unbalanced. Twenty-one companies fall in the range (50,60), which is higher than the other score ranges. None of the companies fall within the range (90,100). If the dividing point is set at a score of 60, the lower scores (≤60) account for 58 companies, with the rest having scores >60.

4.2. Attribute Reduction

The domain U contains the 80 companies in this study. The granularity score is incremented by 10, forming the decision-attribute set D. We then construct the individual factors that may affect the granularity grade, which form the condition-attribute set C (C1: expected revenue; C2: certification system, C3: SC integration degree; C4: manager education level; C5: company sales; C6: TS operation staff number; C7: information management level; C8: cognition of TS; C9: system maintenance investment). The initial decision table (partial) is presented in Table 4.
According to Table 4, the condition-attribute set and decision-attribute set are classified according to the rule of merging the same attributes. Upon deleting one condition attribute, the other condition attributes are classified. The classification result is shown below:
U / I N D C C 2 U / I N D C
U / I N D C C 3 U / I N D C
U / I N D C C 4 U / I N D C
U / I N D C C 5 U / I N D C
U / I N D C C 6 = U / I N D C
U / I N D C C 7 U / I N D C
U / I N D C C 8 U / I N D C
U / I N D C C 9 U / I N D C
If U / I N D C C i = U / I N D C , attribute Ci can be reduced. Therefore, the unimportant condition attribute C6 is deleted, and the condition attributes after reduction are C1–C5, C7–C9.

4.3. Analysis of Importance of Attributes

To determine the importance of a given condition attribute, the classification of the domain relative to the decision attribute is analyzed after removing the given condition attribute. For example, POSC(D), which is an attribute in U/IND(D), is compared with the classification in U/IND(C). If the attributes in U/IND(D) exist in the same class as in U/IND(C), the attribute remains; if not, the attribute is deleted [45]. We list the POS values for various conditions in Table 5.
The degree of importance is calculated as per Section 3.4.4 Attribute importance. The original degree of importance and normalized values are listed in Table 5. In terms of degree of importance, the attributes are: C1(expected revenue) > C3(SC integration degree) > C8(cognition of TS) > C2(certification system) > C5(company sales) > C7(information management level) > C9(system maintenance investment) > C4(manager education level). Expected revenue is the most important factor that affects traceability granularity. The companies that adopted higher-granularity TS expected to obtain more revenue. Implementation of the TS relies on supply-chain cooperation. With the intensive food-safety requirement for customers, enhancing TS cognition plays a significant role in promoting the adoption of a higher-granularity TS. Thus, a certification system is not only the basis for implementing TS but also for its improvement. Company sales and system maintenance determine sustainability. Manager education level is the smallest factor, perhaps because of the diverse levels of information acquisition among managers.

5. Main Conclusions and Implications

Traceability granularity is an effective method for evaluating TS levels. This study uses 80 vegetable companies from Tianjin city as examples and calculates their granularity scores by using the traceability-granularity evaluation model and information collected from the TS platform. The results show that the companies are unequally distributed as a function of score. The score range (50,60) contains the most companies (21). Furthermore, the factors and their level of importance in influencing traceability granularity are analyzed by adopting the rough set method based on nine preselected factors. The results of the analysis show that the factor “number of TS operation staff” is deleted because it is unimportant. The other factors are ranked from most important to least important as follows: expected revenue > SC integration degree > cognition of TS > certification system > company sales > information management level > system maintenance investment > manager education level. The research results can help identify which enterprises do well in traceability granularity. The importance of influencing factors can be used as a reference for enterprises to further improve and will help to implement an effective traceability system. At the same time, it can be used as an important reference for the government to evaluate the effect of implementing a traceability system in enterprises, which is helpful to improve the supervision of enterprises by government departments and ensure food quality and safety.
Based on the above research conclusions, the corresponding implications are as follows: First, the market mechanism of high prices and high quality should be established. The higher traceability granularity implies more safety and trustworthy information and a higher input cost. Ensuring income is the basis of company investment decisions. Second, government investment in constructing the TS should be increased. In the early stages of establishing the TS, relying solely on the spontaneous behavior of companies is insufficient. The government should formulate fiscal and taxation policies to encourage companies to establish a TS. Meanwhile, some basic traceability requirements should be put forward by the government through laws and regulations. Third, the degree of organization of SC companies should be enhanced. The upstream and downstream cooperation mechanism may be established with the core of large-scale agro-food production and processing companies. Thereby, the degree of organization of production and management should improve, and the construction of the TS should advance.

Author Contributions

Conceptualization, writing—original draft preparation, and project administration, J.Q.; methodology, J.L.; data analysis, B.G. and C.C.; validation, H.L.; investigation, J.W. All authors have read and agreed to the published version of the manuscript.

Funding

This research was funded by the National Natural Science Foundation of China, grant number 31971808; and the Central Public-interest Scientific Institution Basal Research Fund, grant number CAAS-ZDRW202107.

Data Availability Statement

No new data were created or analyzed in this study. Data sharing is not applicable to this article.

Acknowledgments

The authors would like to thank the referees for their suggestions, which improved the content and presentation of this paper. We also acknowledge the financial support from the National Natural Science Foundation of China (31971808) and the Central Public-interest Scientific Institution Basal Research Fund (CAAS-ZDRW202107).

Conflicts of Interest

The authors declare no conflict of interest.

References

  1. Qian, J.; Ruiz-Garcia, L.; Fan, B.; Robla Villalba, J.I.; McCarthy, U.; Zhang, B.; Yu, Q.; Wu, W. Food Traceability System from Governmental, Corporate, and Consumer Perspectives in the European Union and China: A Comparative Review. Trends Food Sci. Technol. 2020, 99, 402–412. [Google Scholar] [CrossRef]
  2. García-Díez, J.; Moura, D.; Nascimento, M.M.; Saraiva, C. Performance Assessment of Open-Access Information about Food Safety. J. Verbraucherschutz Leb. 2018, 13, 113–124. [Google Scholar] [CrossRef]
  3. Corallo, A.; Latino, M.E.; Menegoli, M.; Striani, F. What Factors Impact on Technological Traceability Systems Diffusion in the Agrifood Industry? An Italian Survey. J. Rural Stud. 2020, 75, 30–47. [Google Scholar] [CrossRef]
  4. Munasinghe, J.; de Silva, A.; Weerasinghe, G.; Gunaratne, A.; Corke, H. Food Safety in Sri Lanka: Problems and Solutions. Qual. Assur. Saf. Crop. Foods 2014, 7, 37–44. [Google Scholar] [CrossRef]
  5. Cozzolino, D. An Overview of the Use of Infrared Spectroscopy and Chemometrics in Authenticity and Traceability of Cereals. Food Res. Int. 2014, 60, 262–265. [Google Scholar] [CrossRef]
  6. Mehannaoui, R.; Mouss, K.N.; Aksa, K. IoT-Based Food Traceability System: Architecture, Technologies, Applications, and Future Trends. Food Control 2023, 145, 109409. [Google Scholar] [CrossRef]
  7. Heyder, M.; Theuvsen, L.; Hollmann-Hespos, T. Investments in Tracking and Tracing Systems in the Food Industry: A PLS Analysis. Food Policy 2012, 37, 102–113. [Google Scholar] [CrossRef]
  8. Olsen, P.; Borit, M. How to Define Traceability. Trends Food Sci. Technol. 2013, 29, 142–150. [Google Scholar] [CrossRef]
  9. Latino, M.E.; Menegoli, M.; Lazoi, M.; Corallo, A. Voluntary Traceability in Food Supply Chain: A Framework Leading Its Implementation in Agriculture 4.0. Technol. Forecast. Soc. Chang. 2022, 178, 121564. [Google Scholar] [CrossRef]
  10. Jin, S.; Zhou, L. Consumer Interest in Information Provided by Food Traceability Systems in Japan. Food Qual. Prefer. 2014, 36, 144–152. [Google Scholar] [CrossRef]
  11. Kim, Y.G.; Woo, E. Consumer Acceptance of a Quick Response (QR) Code for the Food Traceability System: Application of an Extended Technology Acceptance Model (TAM). Food Res. Int. 2016, 85, 266–272. [Google Scholar] [CrossRef]
  12. Boys, K.A.; Fraser, A.M. Linking Small Fruit and Vegetable Farmers and Institutional Foodservice Operations: Marketing Challenges and Considerations. Renew. Agric. Food Syst. 2019, 34, 226–238. [Google Scholar] [CrossRef]
  13. Badia-Melis, R.; Mishra, P.; Ruiz-García, L. Food Traceability: New Trends and Recent Advances. A Review. Food Control 2015, 57, 393–401. [Google Scholar] [CrossRef]
  14. Montet, D.; El Shobaky, A.; Barreto Crespo, M.T.; Payrastre, L.; Mansour, H.; Othman, Y.; Morshdy, A.; El Zayat, M.; Ibrahim, H.; El-Arabi, T.; et al. Future Topics of Common Interest for EU and Egypt in Food Quality, Safety and Traceability. Qual. Assur. Saf. Crops Foods 2015, 7, 401–408. [Google Scholar] [CrossRef]
  15. Mainetti, L.; Patrono, L.; Stefanizzi, M.L.; Vergallo, R. An Innovative and Low-Cost Gapless Traceability System of Fresh Vegetable Products Using RF Technologies and EPCglobal Standard. Comput. Electron. Agric. 2013, 98, 146–157. [Google Scholar] [CrossRef]
  16. Qian, J.; Yang, X.; Wang, X.; Lian, J.; Xing, B.; Fan, B.; Li, M. Framework for an IT-Based Vegetable Traceability System Integrated Two Different Operating Mechanisms in China on Comparison with Two Cities. J. Food Agric. Environ. 2013, 11, 317–323. [Google Scholar]
  17. Souza Monteiro, D.M.; Caswell, J.A. Traceability Adoption at the Farm Level: An Empirical Analysis of the Portuguese Pear Industry. Food Policy 2009, 34, 94–101. [Google Scholar] [CrossRef]
  18. Porto, S.M.C.; Arcidiacono, C.; Cascone, G. Developing Integrated Computer-Based Information Systems for Certified Plant Traceability: Case Study of Italian Citrus-Plant Nursery Chain. Biosyst. Eng. 2011, 109, 120–129. [Google Scholar] [CrossRef]
  19. Reyes, J.F.; Correa, C.; Esquivel, W.; Ortega, R. Development and Field Testing of a Data Acquisition System to Assess the Quality of Spraying in Fruit Orchards. Comput. Electron. Agric. 2012, 84, 62–67. [Google Scholar] [CrossRef]
  20. Violino, S.; Pallottino, F.; Sperandio, G.; Figorilli, S.; Ortenzi, L.; Tocci, F.; Vasta, S.; Imperi, G.; Costa, C. A Full Technological Traceability System for Extra Virgin Olive Oil. Foods 2020, 9, 624. [Google Scholar] [CrossRef]
  21. Parreño-Marchante, A.; Alvarez-Melcon, A.; Trebar, M.; Filippin, P. Advanced Traceability System in Aquaculture Supply Chain. J. Food Eng. 2014, 122, 99–109. [Google Scholar] [CrossRef]
  22. Wu, Q.; Zhou, G.; Yang, S.; Abulikemu, B.T.; Luo, R.; Zhang, Y.; Li, X.; Xu, X.; Li, C. SNP Genotyping in Sheep from Northwest and East China for Meat Traceability. J. Verbraucherschutz Leb. 2017, 12, 125–130. [Google Scholar] [CrossRef]
  23. Shew, A.M.; Snell, H.A.; Nayga, R.M.; Lacity, M.C. Consumer Valuation of Blockchain Traceability for Beef in the United States. Appl. Econ. Perspect. Policy 2022, 44, 299–323. [Google Scholar] [CrossRef]
  24. Ardeshiri, A.; Rose, J.M. How Australian Consumers Value Intrinsic and Extrinsic Attributes of Beef Products. Food Qual. Prefer. 2018, 65, 146–163. [Google Scholar] [CrossRef]
  25. Dabbene, F.; Gay, P. Food Traceability Systems: Performance Evaluation and Optimization. Comput. Electron. Agric. 2011, 75, 139–146. [Google Scholar] [CrossRef]
  26. Golan, E.; Krissoff, B.; Kuchler, F.; Calvin, L.; Nelson, K.; Price, G. Traceability in the U.S. Food Supply: Economic Theory and Industry Studies; Agricultural Economic Report; United States Department of Agriculture (USDA), Economic Research Service: Washington, DC, USA, 2004; Volume 3, pp. 1–48. [Google Scholar]
  27. Bertolini, M.; Bevilacqua, M.; Massini, R. FMECA Approach to Product Traceability in the Food Industry. Food Control 2006, 17, 137–145. [Google Scholar] [CrossRef]
  28. Karlsen, K.M.; Dreyer, B.; Olsen, P.; Elvevoll, E.O. Granularity and Its Role in Implementation of Seafood Traceability. J. Food Eng. 2012, 112, 78–85. [Google Scholar] [CrossRef]
  29. Bollen, A.F.; Riden, C.P.; Cox, N.R. Agricultural Supply System Traceability, Part I: Role of Packing Procedures and Effects of Fruit Mixing. Biosyst. Eng. 2007, 98, 391–400. [Google Scholar] [CrossRef]
  30. Mgonja, J.T.; Luning, P.; Van Der Vorst, J.G.A.J. Diagnostic Model for Assessing Traceability System Performance in Fish Processing Plants. J. Food Eng. 2013, 118, 188–197. [Google Scholar] [CrossRef]
  31. Qian, J.; Fan, B.; Wu, X.; Han, S.; Liu, S.; Yang, X. Comprehensive and Quantifiable Granularity: A Novel Model to Measure Agro-Food Traceability. Food Control 2017, 74, 98–106. [Google Scholar] [CrossRef]
  32. Banterle, A.; Stranieri, S. The Consequences of Voluntary Traceability System for Supply Chain Relationships. An Application of Transaction Cost Economics. Food Policy 2008, 33, 560–569. [Google Scholar] [CrossRef]
  33. Liao, P.; Chang, H.; Chang, C. Why Is the Food Traceability System Unsuccessful in Taiwan? Empirical Evidence from a National Survey of Fruit and Vegetable Farmers. Food Policy 2011, 36, 686–693. [Google Scholar] [CrossRef]
  34. Jose, A.; Prasannavenkatesan, S. Traceability Adoption in Dry Fish Supply Chain SMEs in India: Exploring Awareness, Benefits, Drivers and Barriers. Sadhana-Acad. Proc. Eng. Sci. 2023, 48, 19. [Google Scholar] [CrossRef]
  35. Mattevi, M.; Jones, J.A. Food Supply Chain Are UK SMEs Aware of Concept, Drivers, Benefits and Barriers, and Frameworks of Traceability? Br. Food J. 2016, 118, 1107–1128. [Google Scholar] [CrossRef]
  36. Meuwissen, M.P.M.; Velthuis, A.G.J.; Hogeveen, H.; Huirne, R.B.M. Traceability and Certification in Meat Supply Chains. J. Agribus. 2003, 21, 167–181. [Google Scholar]
  37. Du Plessis, H.J.; Du Rand, G.E. The Significance of Traceability in Consumer Decision Making towards Karoo Lamb. Food Res. Int. 2012, 47, 210–217. [Google Scholar] [CrossRef]
  38. Schulz, L.L.; Tonsor, G.T. Cow-Calf Producer Preferences for Voluntary Traceability Systems. J. Agric. Econ. 2010, 61, 138–162. [Google Scholar] [CrossRef]
  39. Zhou, J.; Jin, Y.; Liang, Q. Effects of Regulatory Policy Mixes on Traceability Adoption in Wholesale Markets: Food Safety Inspection and Information Disclosure. Food Policy 2022, 107, 102218. [Google Scholar] [CrossRef]
  40. Souza-Monteiro, D.M.; Caswell, J.A. The Economics of Voluntary Traceability in Multi-Ingredient Food Chains. Agribusiness 2010, 26, 122–142. [Google Scholar] [CrossRef]
  41. Wu, L.; Wang, S.; Hu, W. Consumers’ preferences and willingness-to-pay for traceable food-pork as an example. Chin. Rural Econ. 2014, 8, 58–75. [Google Scholar]
  42. Bosona, T.; Gebresenbet, G. Food Traceability as an Integral Part of Logistics Management in Food and Agricultural Supply Chain. Food Control 2013, 33, 32–48. [Google Scholar] [CrossRef]
  43. Mattevi, M.; Jones, J.A. Traceability in the Food Supply Chain: Awareness and Attitudes of UK Small and Medium-Sized Enterprises. Food Control 2016, 64, 120–127. [Google Scholar] [CrossRef]
  44. Zhang, X.; Zhang, J.; Liu, F.; Fu, Z.; Mu, W. Strengths and Limitations on the Operating Mechanisms of Traceability System in Agro Food, China. Food Control 2010, 21, 825–829. [Google Scholar] [CrossRef]
  45. Qian, J.; Wu, X.; Yang, X.; Xing, B.; Wang, F. Farm Products Quality Safety Emergency Management System Based on Rough Set and WebGIS. Nongye Jixie Xuebao/Trans. Chin. Soc. Agric. Mach. 2012, 43, 123–129. [Google Scholar] [CrossRef]
  46. Regattieri, A.; Gamberi, M.; Manzini, R. Traceability of Food Products: General Framework and Experimental Evidence. J. Food Eng. 2007, 81, 347–356. [Google Scholar] [CrossRef]
  47. Pelegrino, B.O.; Silva, R.; Guimaraes, J.T.; Coutinho, N.F.; Pimentel, T.C.; Castro, B.G.; Freitas, M.Q.; Esmerino, E.A.; Sant’Ana, A.S.; Silva, M.C.; et al. Traceability: Perception and Attitudes of Artisanal Cheese Producers in Brazil. J. Dairy Sci. 2020, 103, 4874–4879. [Google Scholar] [CrossRef]
  48. Narsimhalu, U.; Potdar, V.; Kaur, A. A Case Study to Explore Influence of Traceability Factors on Australian Food Supply Chain Performance. Oper. Manag. Digit. Econ. 2015, 189, 17–32. [Google Scholar] [CrossRef]
  49. Pawlak, Z.; Wong, S.K.M.; Ziarko, W. Rough Sets: Probabilistic versus Deterministic Approach. Int. J. Man. Mach. Stud. 1988, 29, 81–95. [Google Scholar] [CrossRef]
  50. Kumar, S.; Jain, N.; Fernandes, S.L. Rough Set Based Effective Technique of Image Watermarking. J. Comput. Sci. 2017, 19, 121–137. [Google Scholar] [CrossRef]
  51. Azam, N.; Zhang, Y.; Yao, J.T. Evaluation Functions and Decision Conditions of Three-Way Decisions with Game-Theoretic Rough Sets. Eur. J. Oper. Res. 2017, 261, 704–714. [Google Scholar] [CrossRef]
  52. Gao, Y.; Zhang, X.; Wu, L.; Yin, S.; Lu, J. Resource Basis, Ecosystem and Growth of Grain Family Farm in China: Based on Rough Set Theory and Hierarchical Linear Model. Agric. Syst. 2017, 154, 157–167. [Google Scholar] [CrossRef]
Figure 1. Study case position and survey company distribution in different counties in Tianjin city.
Foods 12 02124 g001
Figure 2. TS application processing with five subsystems.
Foods 12 02124 g002
Figure 3. Obtaining influencing factor information in the enterprise registration interface on OAS.
Foods 12 02124 g003
Figure 4. Granularity scores of the 80 investigated enterprises.
Foods 12 02124 g004
Table 1. Two-layer index, index weight, description, and quantization scores.
First Layer IndexesSecond Layer IndicatorsWeightIndicators DescriptionScores
PrecisionExternal trace unit Single product5
0.1985Single batch3
Mixed batch1
Internal flow unit Single product5
0.1141Single batch3
Mixed batch1
IU conversion One-to-one5
0.0872One-to-many4
Many-to-one2
Many-to-many1
BreadthInformation collection content0.1870Basic information, forward source information, backward direction information, process information5
All information except process information4
Basic information, forward source information or backward direction information3
only basic information1
Information update frequency0.1248Hourly level5
Daily level3
Monthly level1
DepthBackward tracing distance Tracking more than 3 levels5 (at the front of the supply chain is default to 5)
0.1442Tracking 2 levels4
Tracking 1 level3
Tracking less than 1 level1
Forward tracking distance Tracking more than 3 levels5 (at the end of the supply chain is default to 5)
0.1442Tracking 2 levels4
Tracking 1 level3
Tracking less than 1 level1
Table 2. Main factors that affect enterprise motivation on TS.
Factors TypeInfluencing FactorsMainly Literature
External factorsExpected revenue[36,37]
Government policy[26,38,39]
Market requirement[17,40]
Internal factorsCertification system[41]
SC integration degree[42]
Manager education level[40]
Enterprise turnover[43]
TS operation staff ratio[44]
Informationization management level[45]
Cognition of TS[46,47]
System maintenance investment[48]
Table 3. Characteristics of surveyed enterprises in Tianjin city.
Influencing FactorsFactors FeatureEnterprise NumberPercentage
(%)
Expected revenue<0%56.25
0–5%2430
5–10%3746.25
10–20%1215
>20%22.5
Certification systemNo certification00
ISO 9000 certification1215
GAP/HACCP1012.5
Other certification4353.75
ISO9000/GAP/HACCP + other certification1518.75
SC integration degreeVery low1620
Low3847.5
Medium1215
High911.25
Very high56.25
Manager education levelLess than senior high school45
Senior high school1113.75
College level4860
Master degree1518.75
Doctor degree22.5
Enterprise turnover<5 million Yuan2126.25
5–10 million Yuan2430
10–30 million Yuan1822.5
30–50 million1417.5
>50 million33.75
TS operation staffNo special operation staff1215
One person3645
Two persons2227.5
3–5 persons810
>5 persons22.5
Information management levelVery low810
Low2227.5
Medium3240
High1316.25
Very high56.25
Cognition of TSVery low45
Low911.25
Medium4050
High2126.25
Very high67.5
System maintenance investment0%22.5
0–1%1417.5
1–3%4252.5
3–5%1923.75
>5%33.75
Table 4. Initial decision table of TS granularity influencing factors (partial).
U123787980
CC1 (Expected revenue)224 133
C2 (Certification system)132 522
C3 (SC integration degree)313 323
C4 (Manager education level)214 415
C5 (Company sales)112 243
C6 (TS operation staff number)125 132
C7 (Information management level)223 251
C8 (Cognition of TS)414 512
C9 (System maintenance investment)235 114
D214 243
Table 5. POS value and importance degree.
POS AssortmentAssortment NumberImportance DegreeNormalized Importance Degree
POSC(D)58
POSC-C1(D)540.9310.205
POSC-C2(D)330.5690.126
POSC-C3(D)480.8280.182
POSC-C4(D)150.2590.057
POSC-C5(D)300.5170.114
POSC-C7(D)250.4310.095
POSC-C8(D)410.7070.156
POSC-C9(D)170.2930.065
Disclaimer/Publisher’s Note: The statements, opinions and data contained in all publications are solely those of the individual author(s) and contributor(s) and not of MDPI and/or the editor(s). MDPI and/or the editor(s) disclaim responsibility for any injury to people or property resulting from any ideas, methods, instructions or products referred to in the content.

