1. Introduction
At present, China’s rapid socio-economic development has led to significant changes in the structure of residents’ food consumption. In the past, direct consumption such as rations dominated the food consumption of Chinese residents, while indirect food consumption such as meat, poultry, eggs, and milk was relatively small. Studies [
1,
2] have shown that the consumption of food rations has been declining more significantly in the last three decades, while the consumption of other food categories has shown a rapid growth. The structure of animal-based and plant-based foods has changed significantly since the 1980s to 2015 [
3]. The current food consumption demands of residents have shifted from initial subsistence to diversification [
4].
However, the dietary structure has irrational problems, with low levels of consumption of fruits and vegetables, milk, and fish and shrimp [
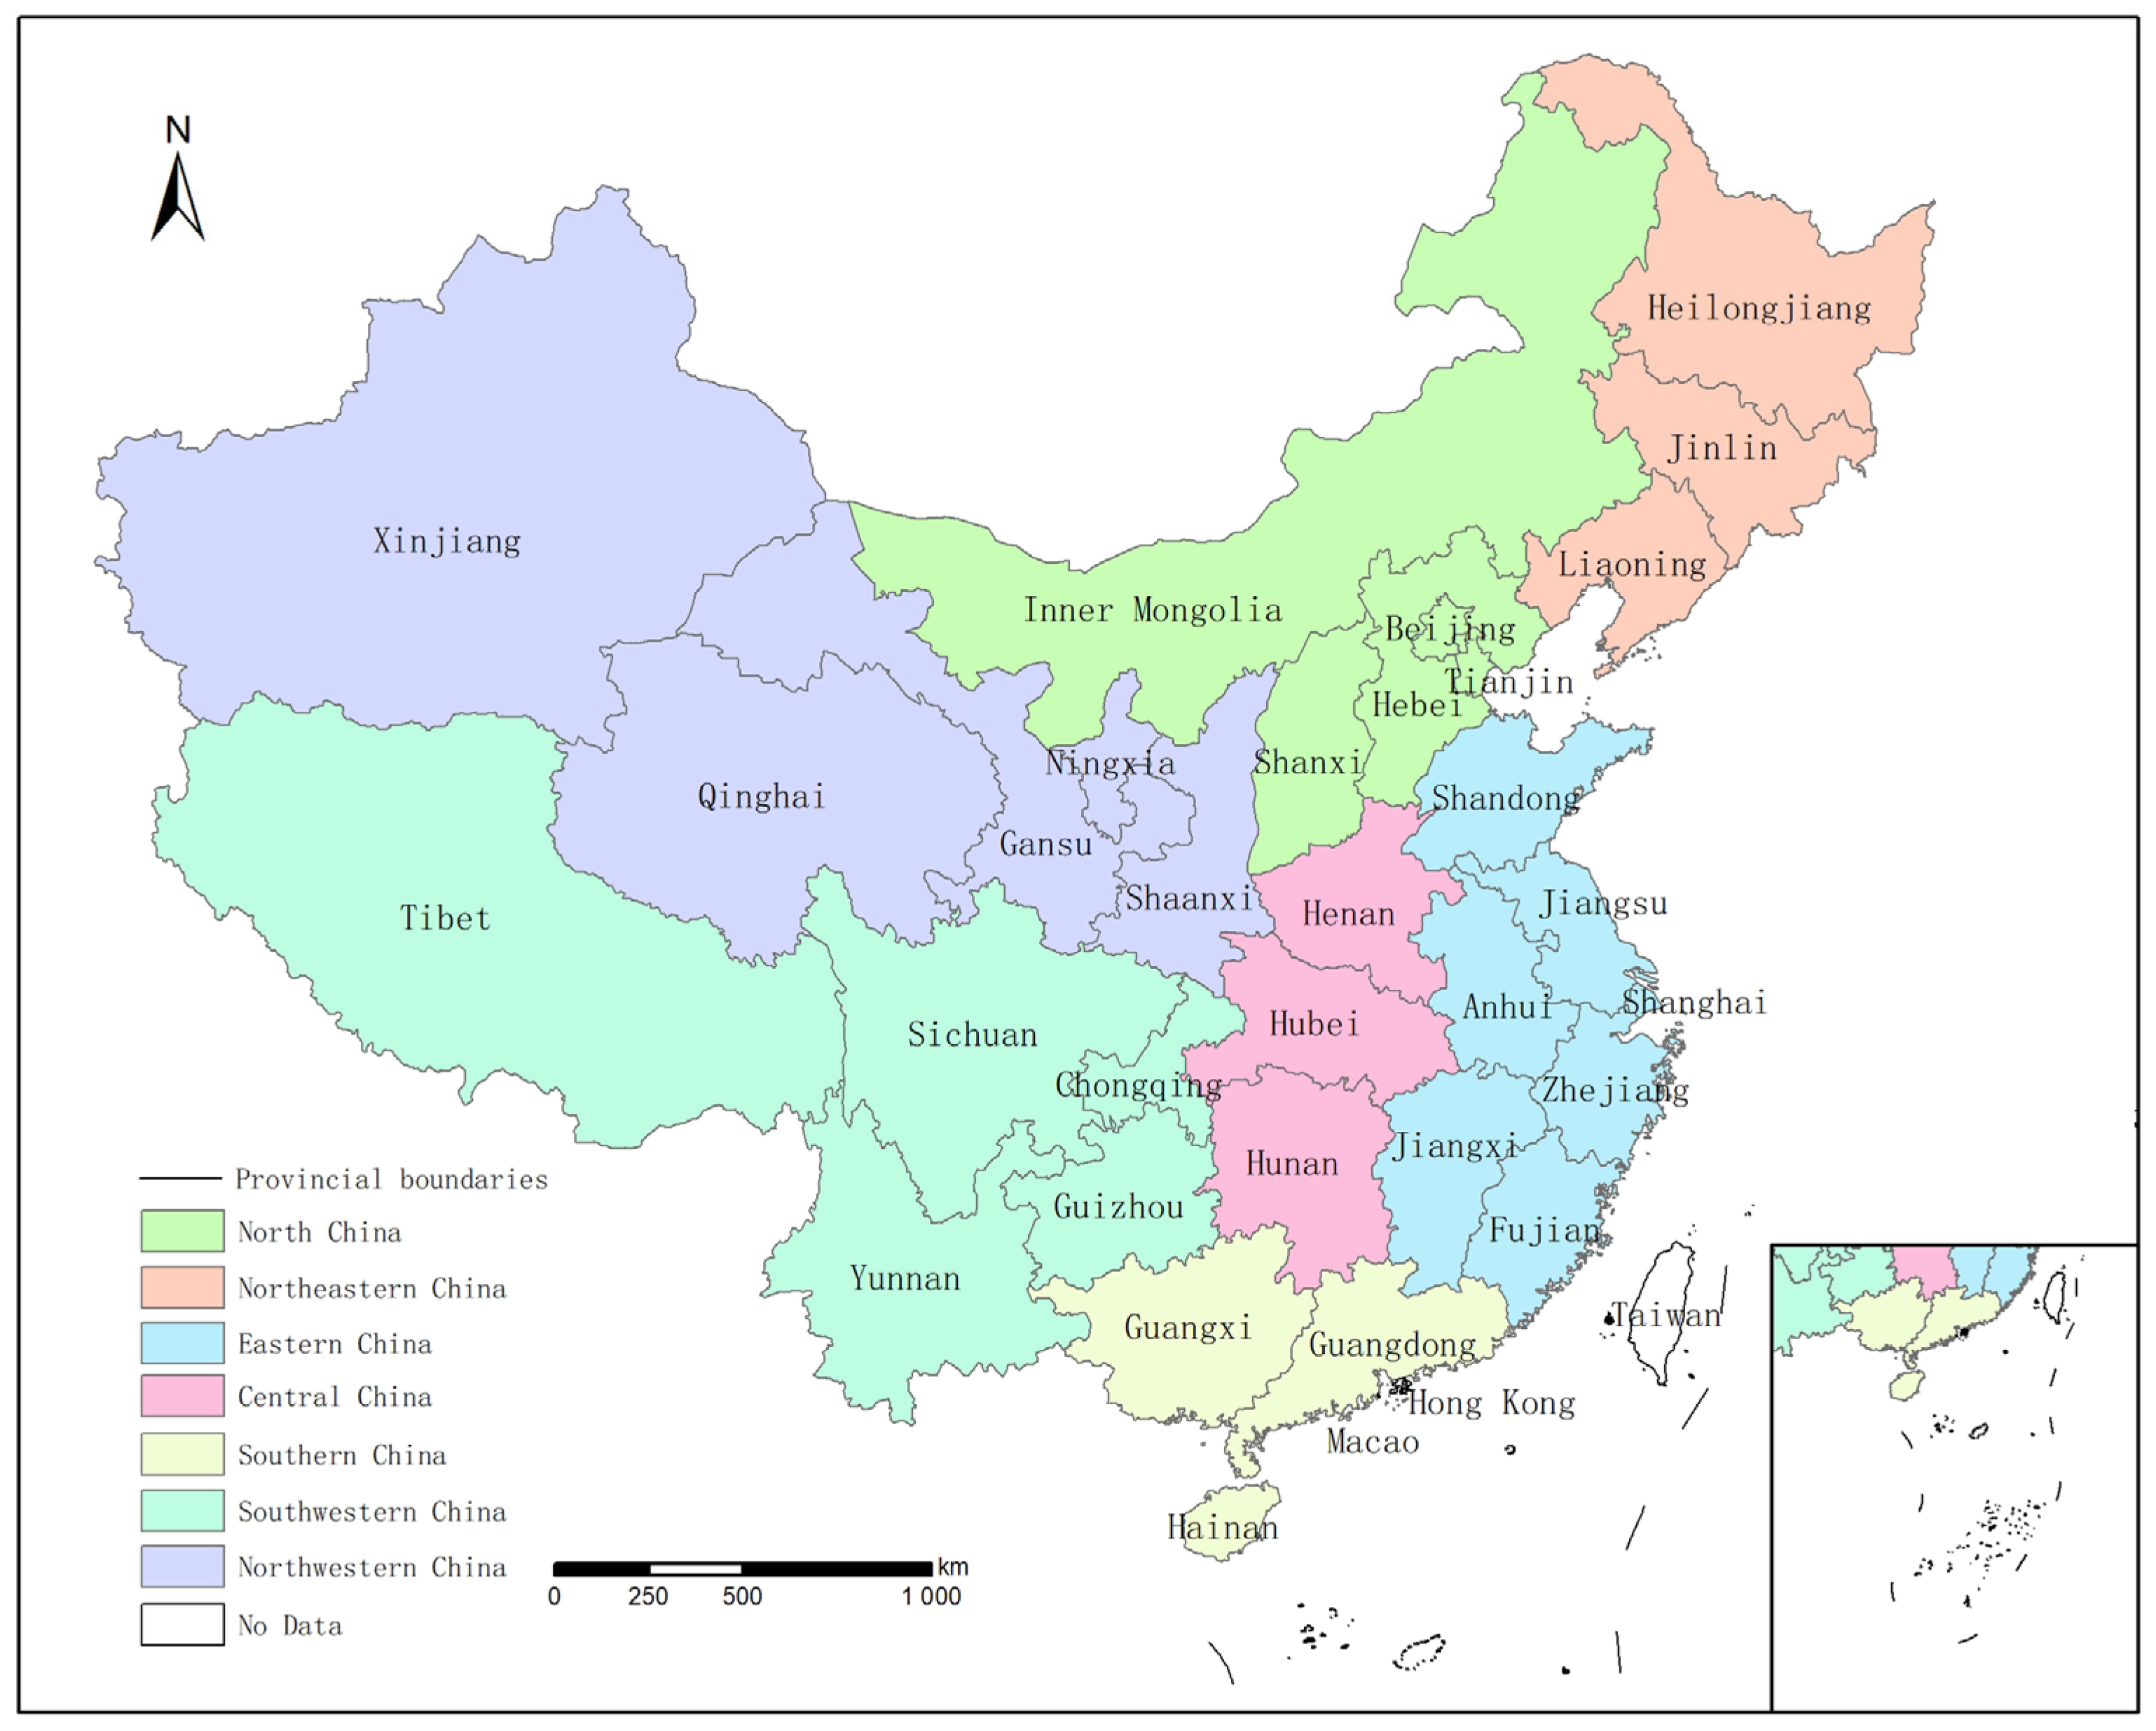
5]. Moreover, China is a vast country with complex topography and diverse climate, and there are obvious differences in dietary habits and food consumption in different regions [
6,
7]. In addition, it is often statistically divided into two parts: urban and rural, with urban referring to the residential councils and other areas connected to the actual construction of municipal, district, and county government sites in municipal districts and unincorporated cities, and rural being the areas outside of towns [
8]. There is also an unbalanced development of dietary structure in urban and rural areas [
9].
Food consumption is an important indicator of national living standards, and it is also an important basis for policy formulation in agricultural production restructuring, market circulation, and nutrition improvement. Food systems, human health, and the environment are interconnected. The food we eat and the way we produce it will determine the health of humans and the planet, and major changes must be made in response to existing problems in order to avoid a reduction in life expectancy and continued environmental degradation [
10,
11,
12,
13]. In terms of human health, the Chinese Dietary Guidelines is a visual representation of dietary health. It follows the principle of a balanced diet and divides the pagoda into five layers with different sizes to reflect the five major food groups and the amount of food. These five major food groups are cereals and potatoes; vegetables and fruits; livestock, poultry, fish, and eggs; milk, soybeans, and nuts; and cooking oil and salt.
Many scholars have conducted different types of studies on food consumption; descriptions and aspects of these follow. The first type of study is on changes in food consumption, which often use long-term time-series data on food consumption to elaborate on the trends and patterns of changes in the food consumption structure of China at the macro level [
1,
5]. The second type of study focuses on forecasting future food demand and supply for the whole country or for a key region using methods such as formula calculations [
14,
15]. The third type of study is based on a nutritional perspective and investigates the characteristics of food consumption and dietary nutrition status and the differences between them by methods such as household surveys or macro statistics [
2]. The fourth category in the literature examines interactions between food consumption and various types of resources and environments. The last category studies socioeconomic factors, such as income, urbanization level, food price index, and food production, that have an impact on residents’ food consumption [
16]. These factors can, in turn, influence the dietary structure of the residents by changing their health consciousness, dietary preferences, ability to access food, and ease of access to food.
Based on the existing literature, this study explores the main characteristics and problems of current food consumption and nutritional development of Chinese urban and rural residents and the influencing factors. The latter work is based on the theory of dietary balance, and analyzes the differences between geographical areas to see if problems in food consumption have been solved or improved in the last seven years compared to the past.
3. Results
3.1. Changes in the Food Consumption Structure
The change in the structure of food consumption is shown in
Figure 2. The share of per capita consumption of cereals showed an overall downward trend. In particular, the proportion of cereals consumption by rural residents fell from 44.8% to 38.8%, showing a faster downward trend, while the consumption of urban residents changed little. Compared to urban residents, the consumption of animal-based foods, fruits and vegetables by rural residents increased more significantly.
In recent years, the ratio between rural and urban residents increased for all food groups except grain, for which the difference between urban and rural areas gradually decreased. In 2021, the rural/urban ratios for aquatic products, milk and dairy products, fruits were 0.65, 0.51, and 0.77, respectively, and are still likely to increase. While the ratios for vegetables, meat, poultry and eggs were all close to 1.
3.2. Rationality of Food Consumption
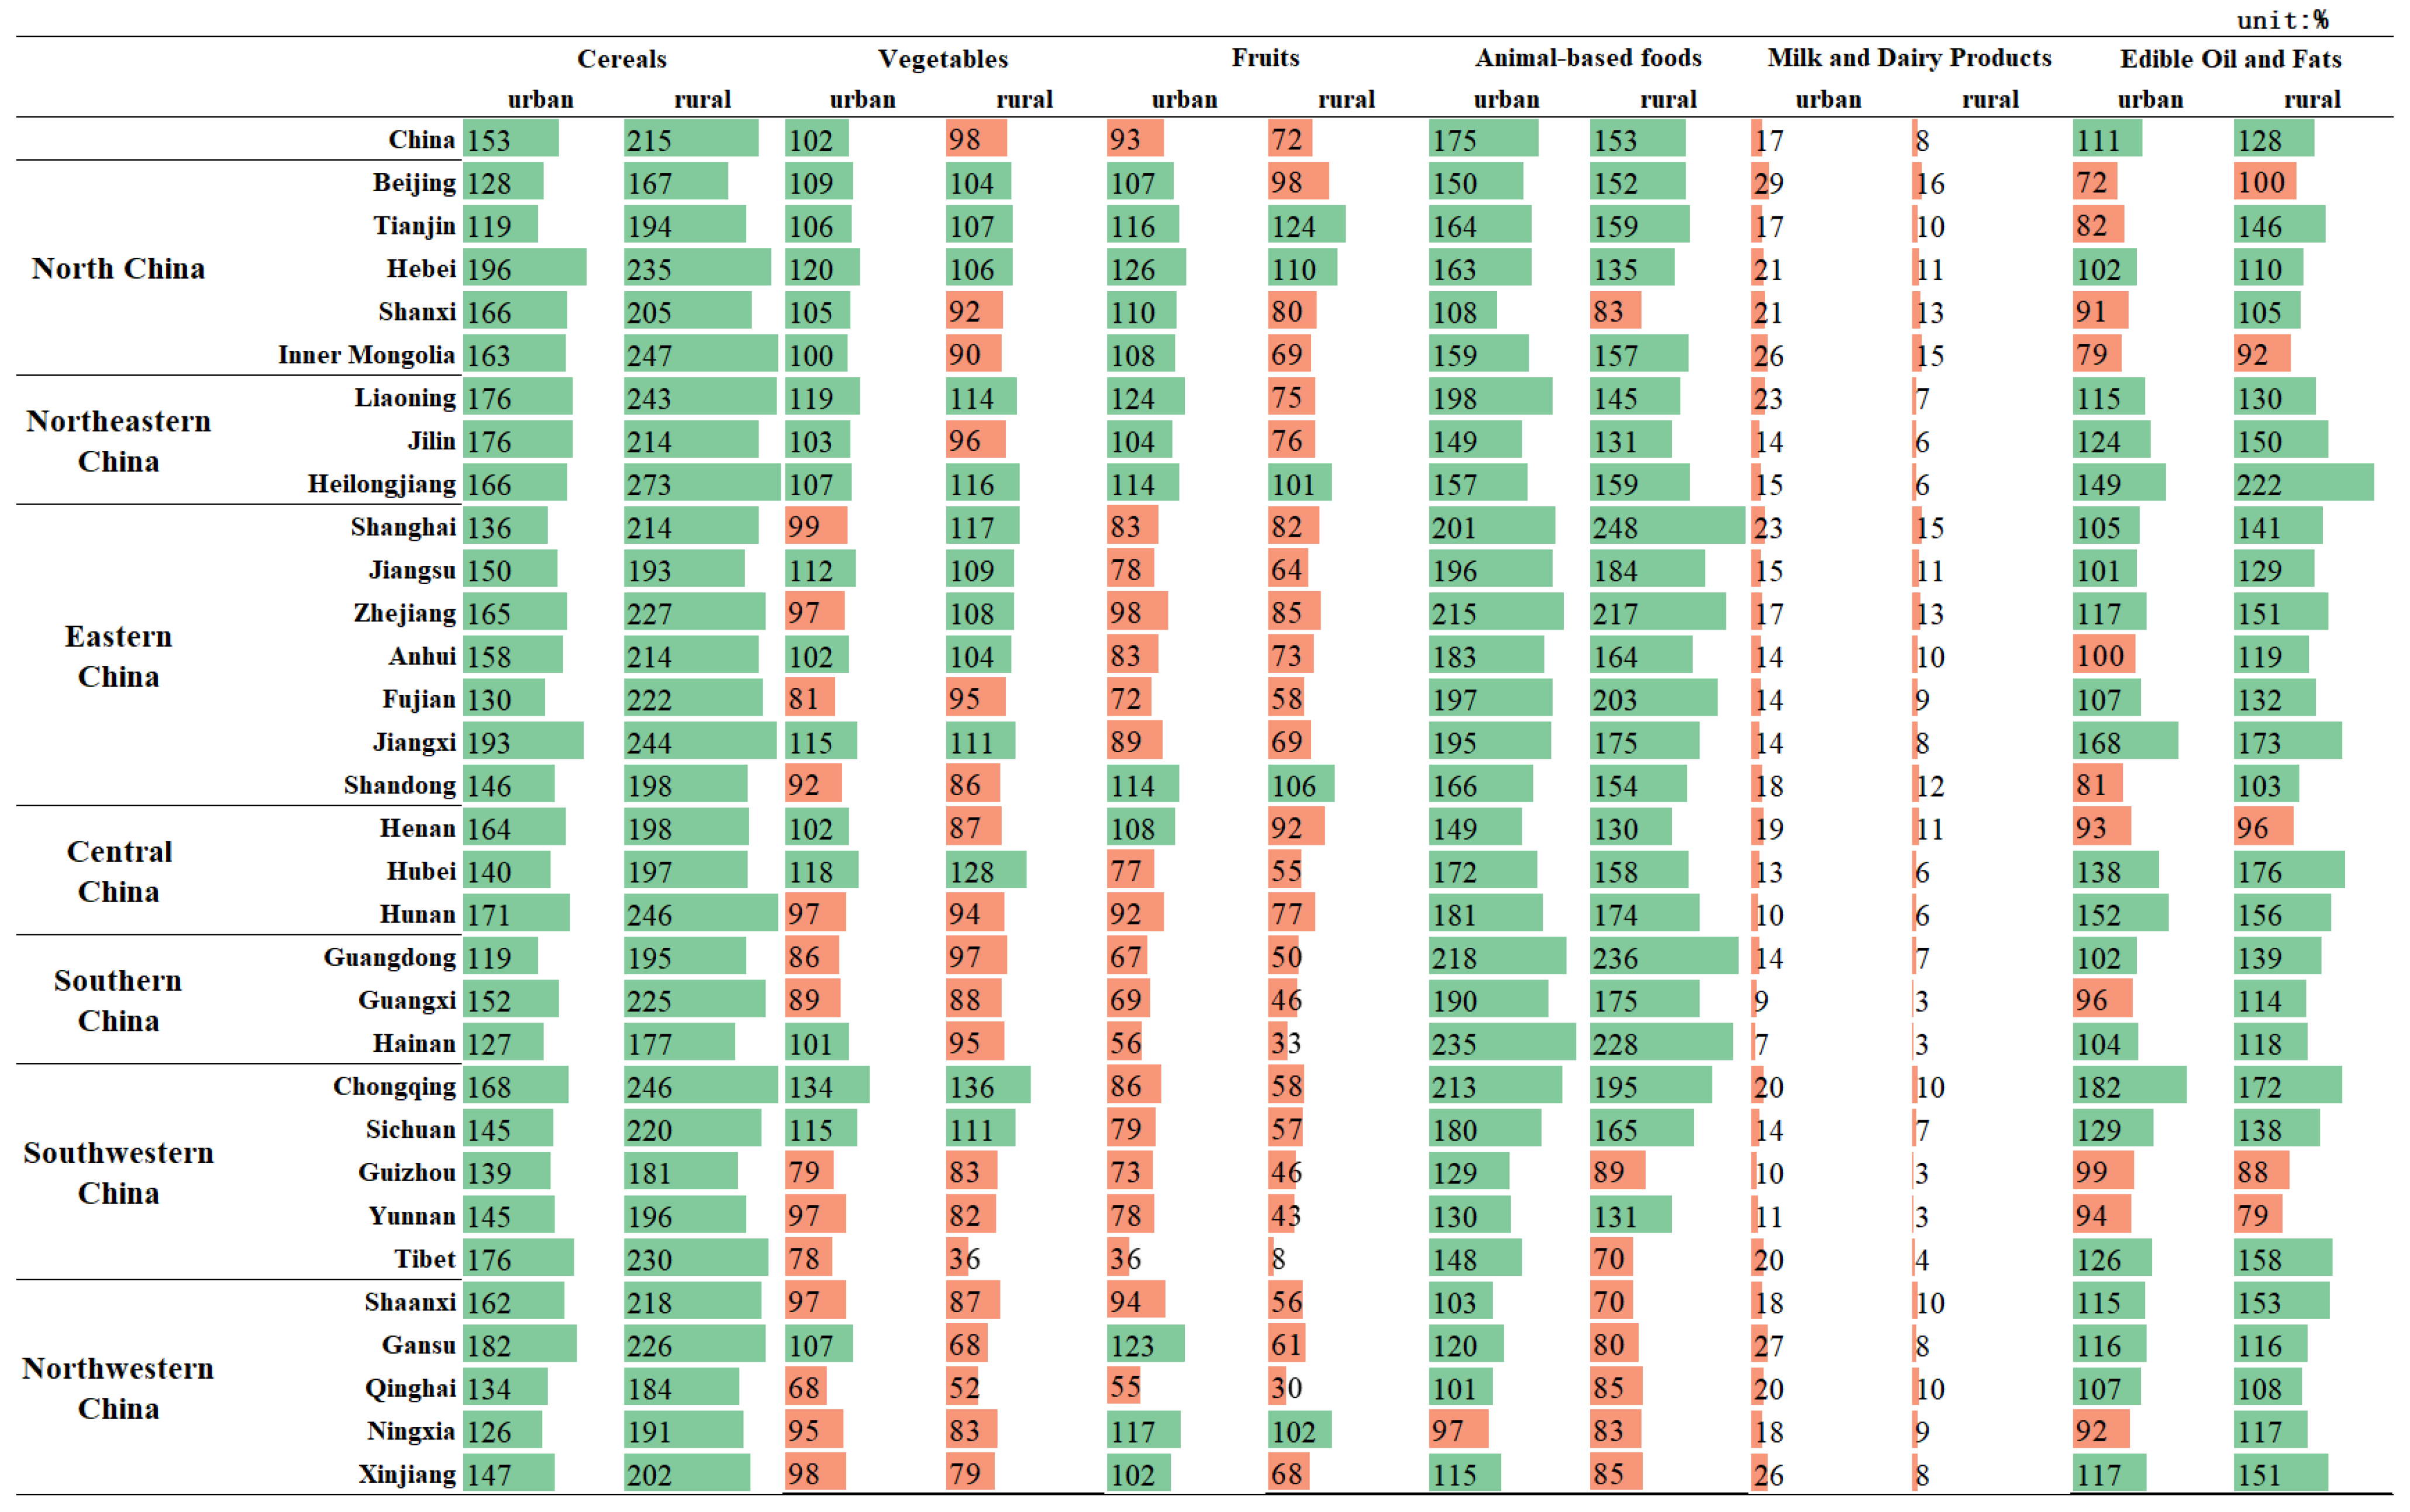
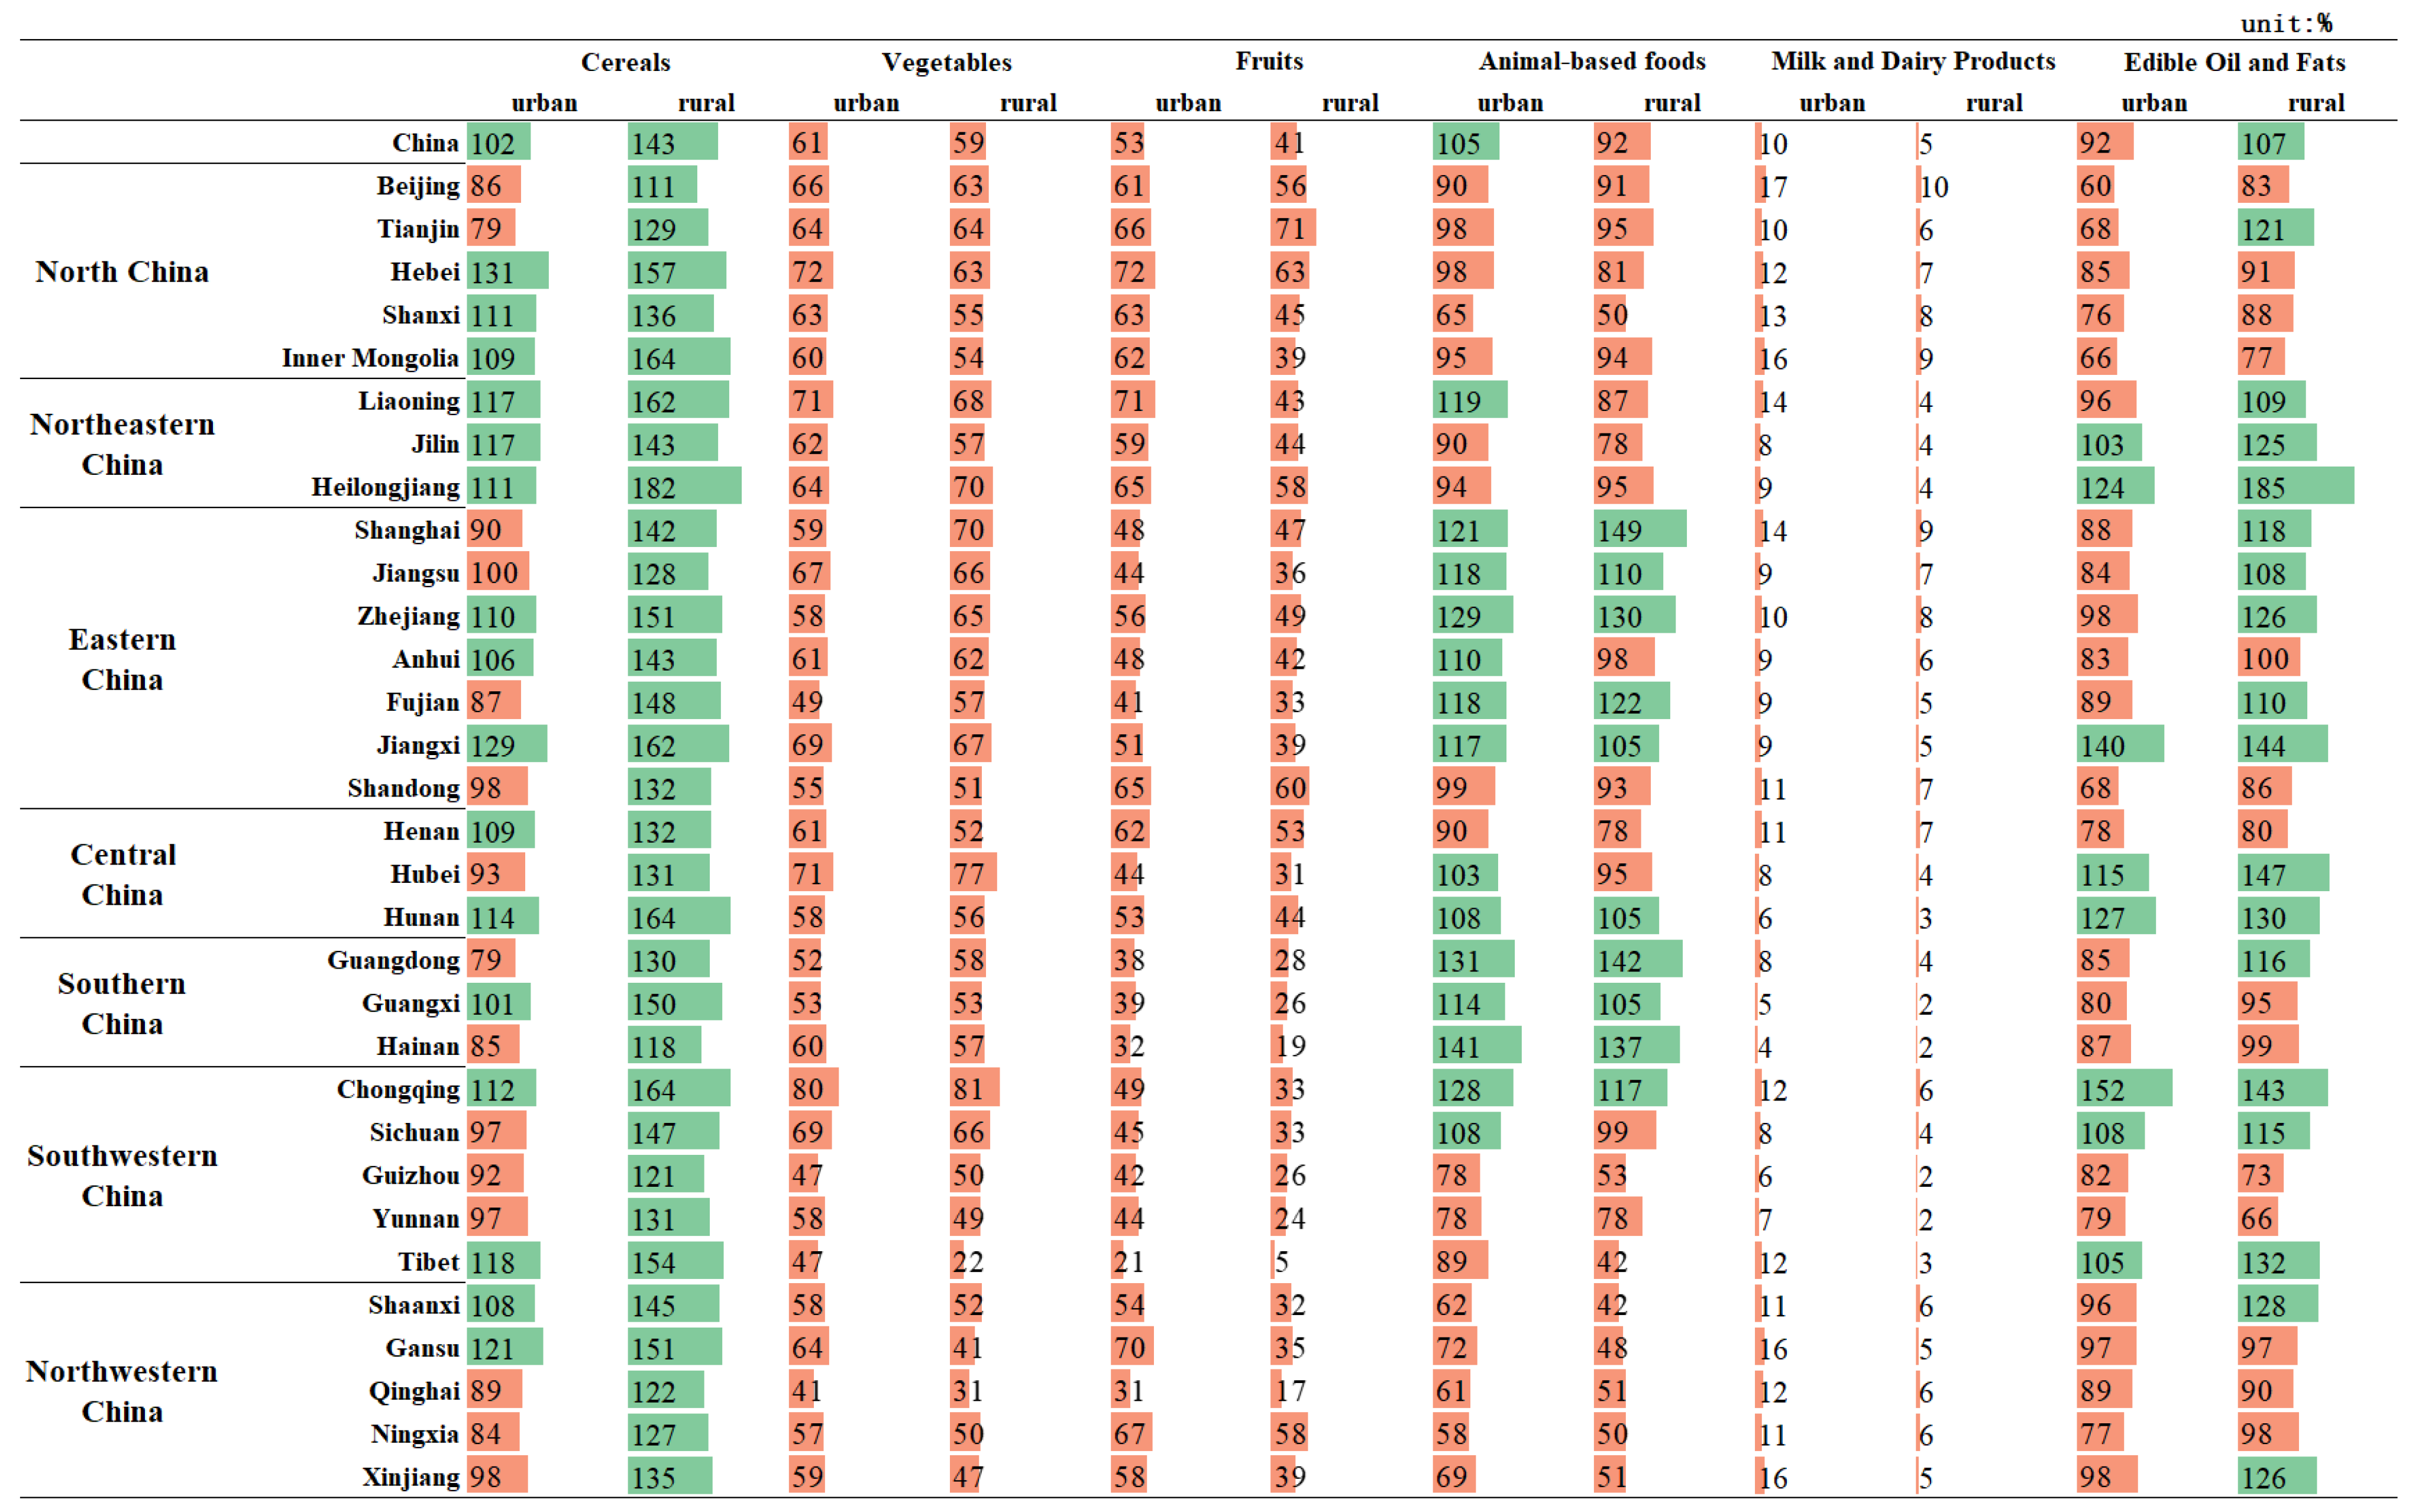
The structure of food consumption has become more diverse in recent years. However, from the perspective of nutrition and health, residents should not only eat enough, but also eat healthily. The comparison of food consumption by Chinese provinces in 2021 to the minimum and maximum standards recommended by the Chinese Food Guide Pagoda (2022) is shown in
Figure 3 and
Figure 4.
Cereals was the only food type for which the actual consumption in 2021 exceeded the minimum recommended by the Dietary Guidelines in all provinces. Meanwhile, all other food groups were under-consumed in individual provinces. However, rural residents consumed too much cereals, exceeding the recommended maximum (300 g) in all provinces. In terms of animal-based foods, there were differences in consumption between regions. Rural residents in the western region (including Guizhou, Tibet, Shaanxi, Gansu, Qinghai, Ningxia, and Xinjiang) consumed less than the minimum recommended standard, while the more economically developed eastern regions, such as Shanghai, Zhejiang, and Guangdong, consumed more than 30% of the maximum recommended standard for animal-based foods. Edible oil and fats consumption exceeded the maximum recommended standards to a greater extent in rural areas than in urban areas, especially in Hubei, Hunan, Chongqing, Jiangxi and Heilongjiang, where local residents like to eat spicy food or have heavy diets. The largest deviation between consumption and recommended intakes was for milk and dairy products, with all regions failing to meet the recommended standard and the highest value reaching only 29.0% of the minimum recommended value. This is followed by fruits and vegetables, with the Qinghai-Tibet Plateau having the most serious deviation; urban and rural fruit consumption in Tibet reached only 35.9% and 8.5% of the minimum recommended standard, respectively.
The trend in food consumption as a percentage of the dietary pagoda from 2015–2021 is shown in
Figure 5. It shows that the trend in cereals consumption varies across provinces, with only a few provinces (Tianjin, Inner Mongolia, Guangdong, Tibet and Xinjiang) where not only the percentage of consumption is decreasing, but also the consumption is decreasing. The trend in consumption of vegetables and fruits is increasing or fluctuating in most areas, but has not yet reached the recommended intake. Consumption of animal-based foods is increasing the fastest of all the food groups (with the exception of rural areas in Tibet). It is worth noting that, in contrast to other food groups, the change in milk and dairy products consumption was not significant, with per capita consumption of 46.8 and 17.3 g/day for urban and rural residents, respectively, in 2015, increased to 49.9 and 25.5 g/day, respectively, in 2021, which represents a very low growth rate. The low intake of milk and dairy products has long been a prominent problem in the food consumption. In terms of edible oil consumption, growth was insignificant or started to decline in urban areas in most provinces, but grew in rural areas.
3.3. Food Consumption Cluster
There were obvious spatial differences in the per capita consumption of major food in China, and this paper conducted spatial autocorrelation analysis on several major food groups to determine whether there was a convergence in food consumption in neighboring regions.
The Moran’s
I index for per capita consumption of major food items in 2021 was calculated (
Table 3). Except for cereals, edible oil and fats, meat, the Moran’s
I indices of food consumption in all other categories were positive, indicating that there is positive spatial autocorrelation in the per capita consumption of major food items among Chinese residents.
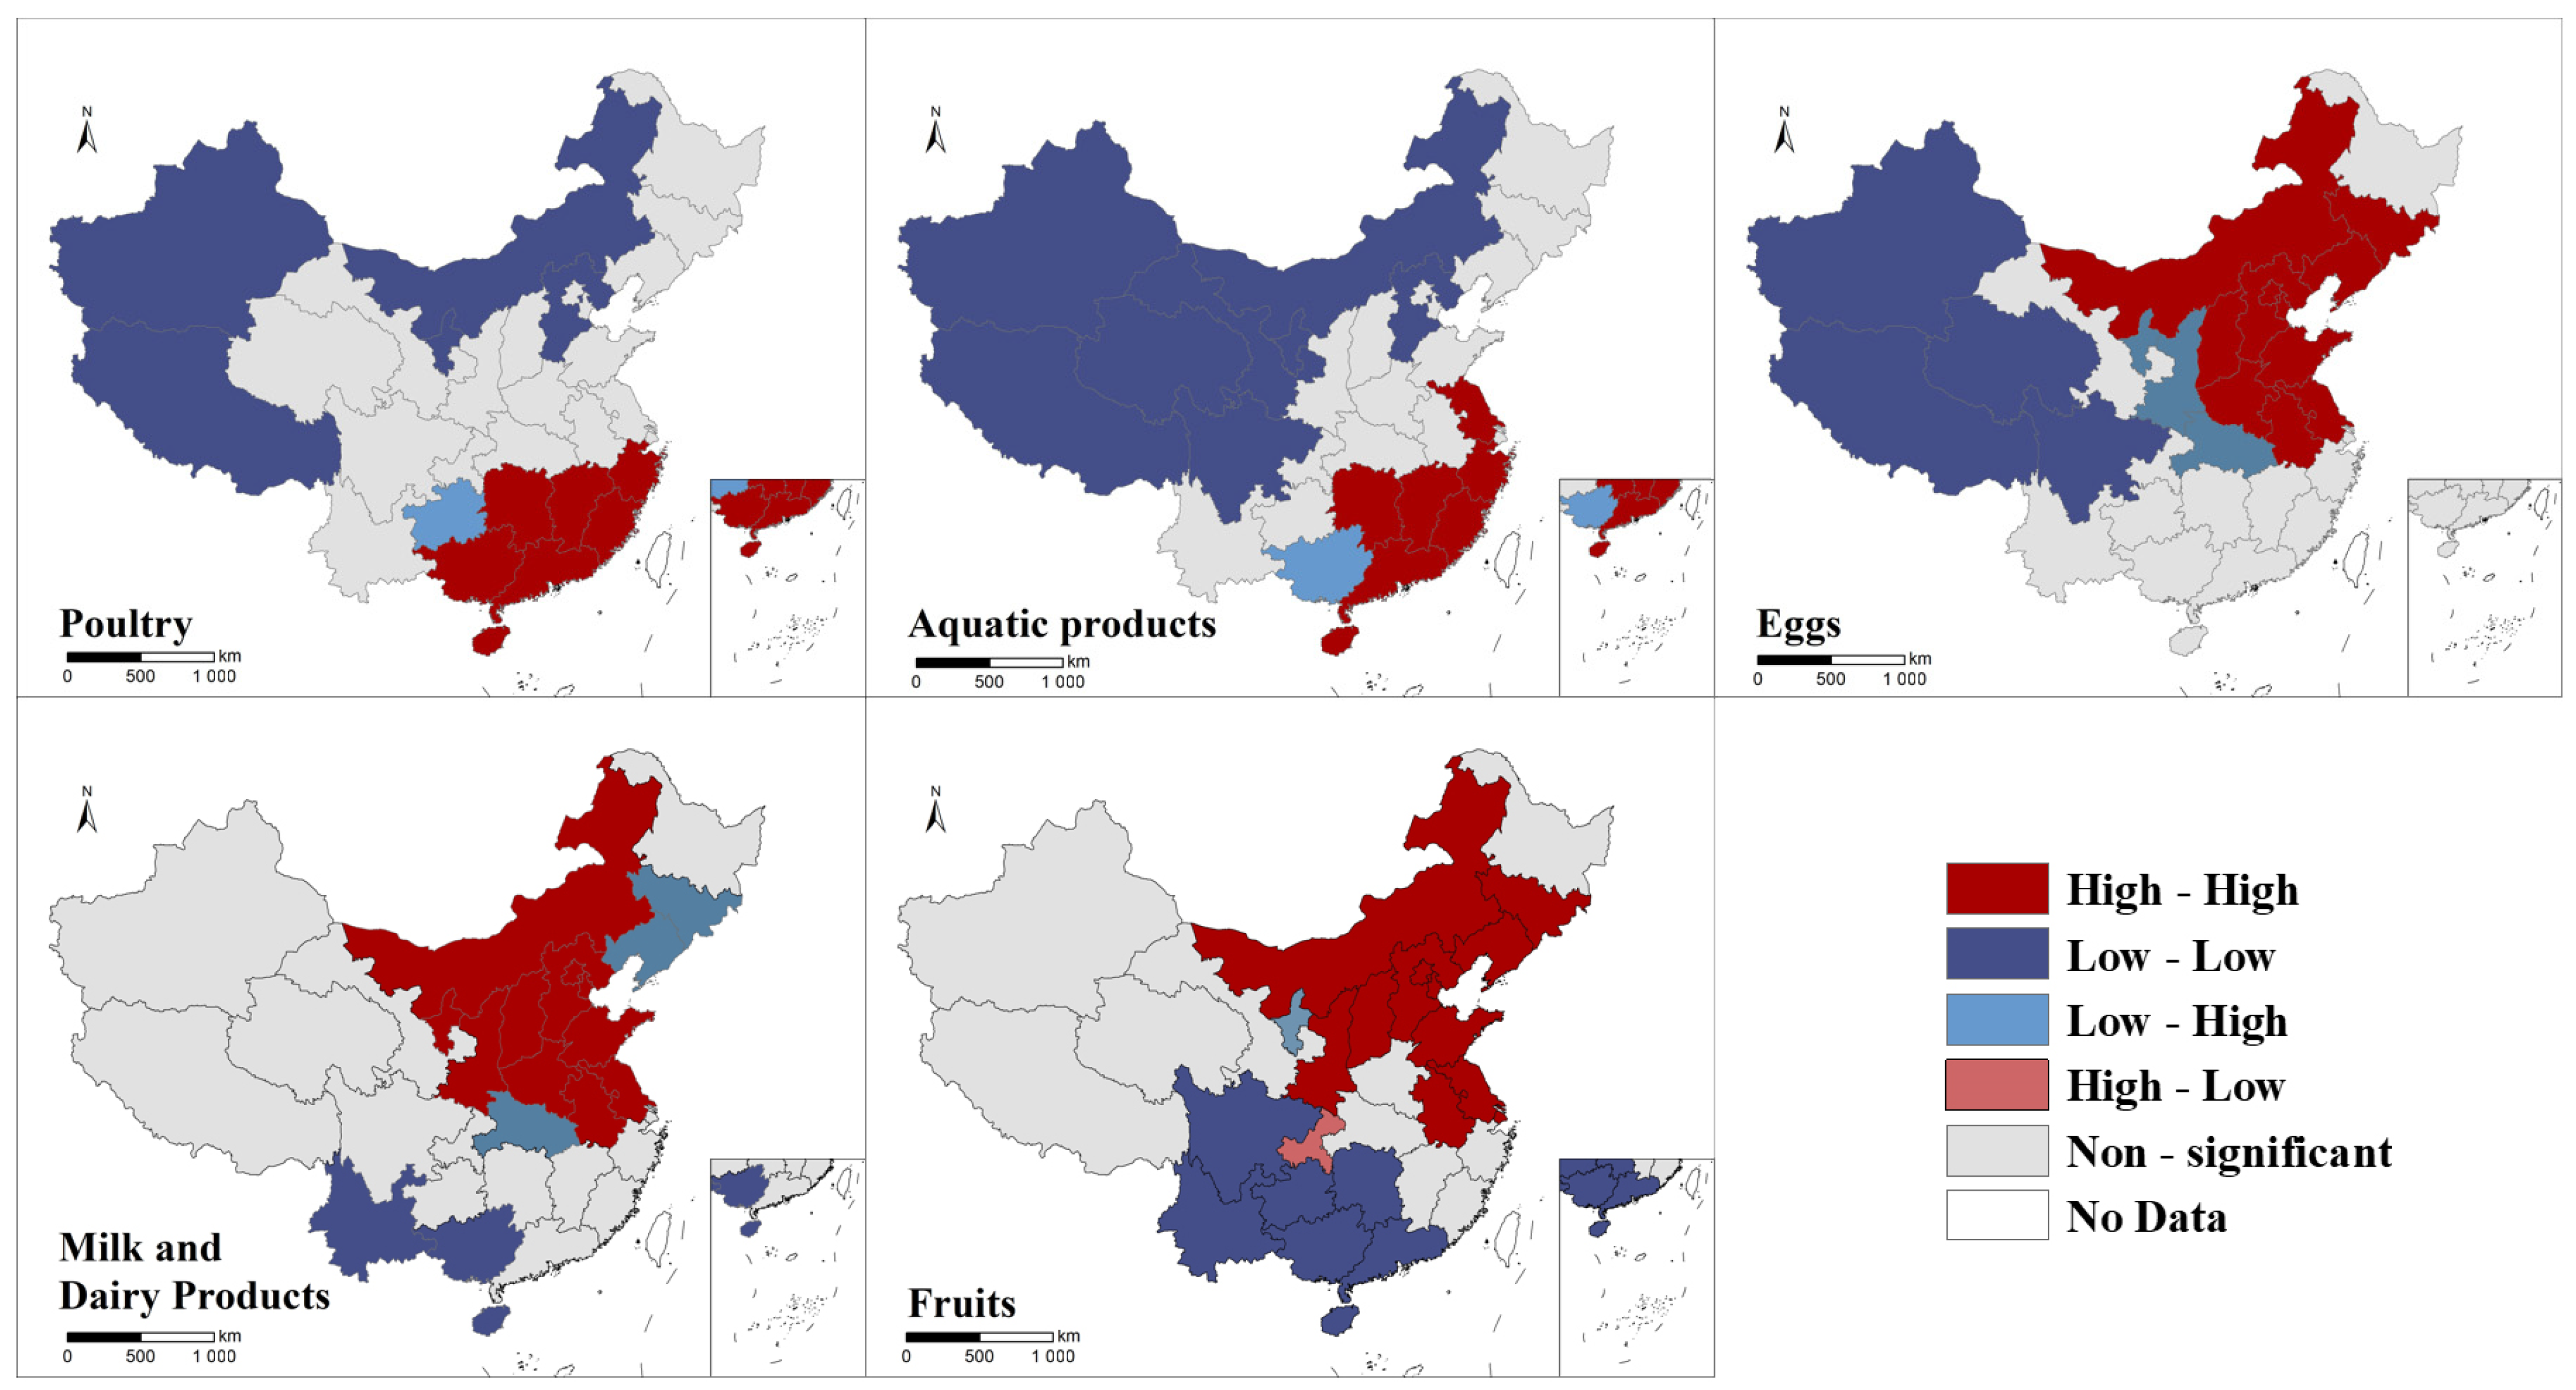
The LISA clustering map of per capita food consumption in 2021 was drawn, as shown in
Figure 6 and
Figure 7. The results showed that there is a clear regional clustering of consumption of each food group. High-high aggregation areas for poultry are concentrated in the southeast and low-low aggregation areas in the north; high-high aggregation areas for aquatic products consumption are also in the southeast and low-low aggregation areas in the west of China; high-high aggregation areas for eggs, dairy and fruits are in the south of China and low-low aggregation areas are in the central and north.
3.4. Regional Food Consumption
There was an obvious geographical clustering of consumption of different types of food in China. This paper compared the differences in food consumption and the deviation from the nutrition targets in different regions in China in 2021, based on the division into seven geographical regions in China, and the results are shown in
Figure 8.
In 2021, the average daily consumption of cereals in each of the seven regions far exceeds the minimum recommended value of the dietary pagoda, and rural inhabitants consume too much. The residents in southern China and northwestern China had the greatest under-consumption of vegetables. In terms of fruits consumption, only urban residents in northern China and northeastern China barely met the standard. Except for rural residents in the northwestern China, all regions were able to meet the minimum standard of animal-based foods intake, with the eastern China and southern China having the most adequate intake of animal food, which exceeded the maximum standard. Milk and dairy products are well below the lower limit of the recommended range in both urban and rural areas or in either region. In terms of edible oil and fats consumption, the recommended standard was largely met in rural and urban, while the exceedance of the standard was serious in rural areas.
3.5. Influencing Factors of Food Consumption
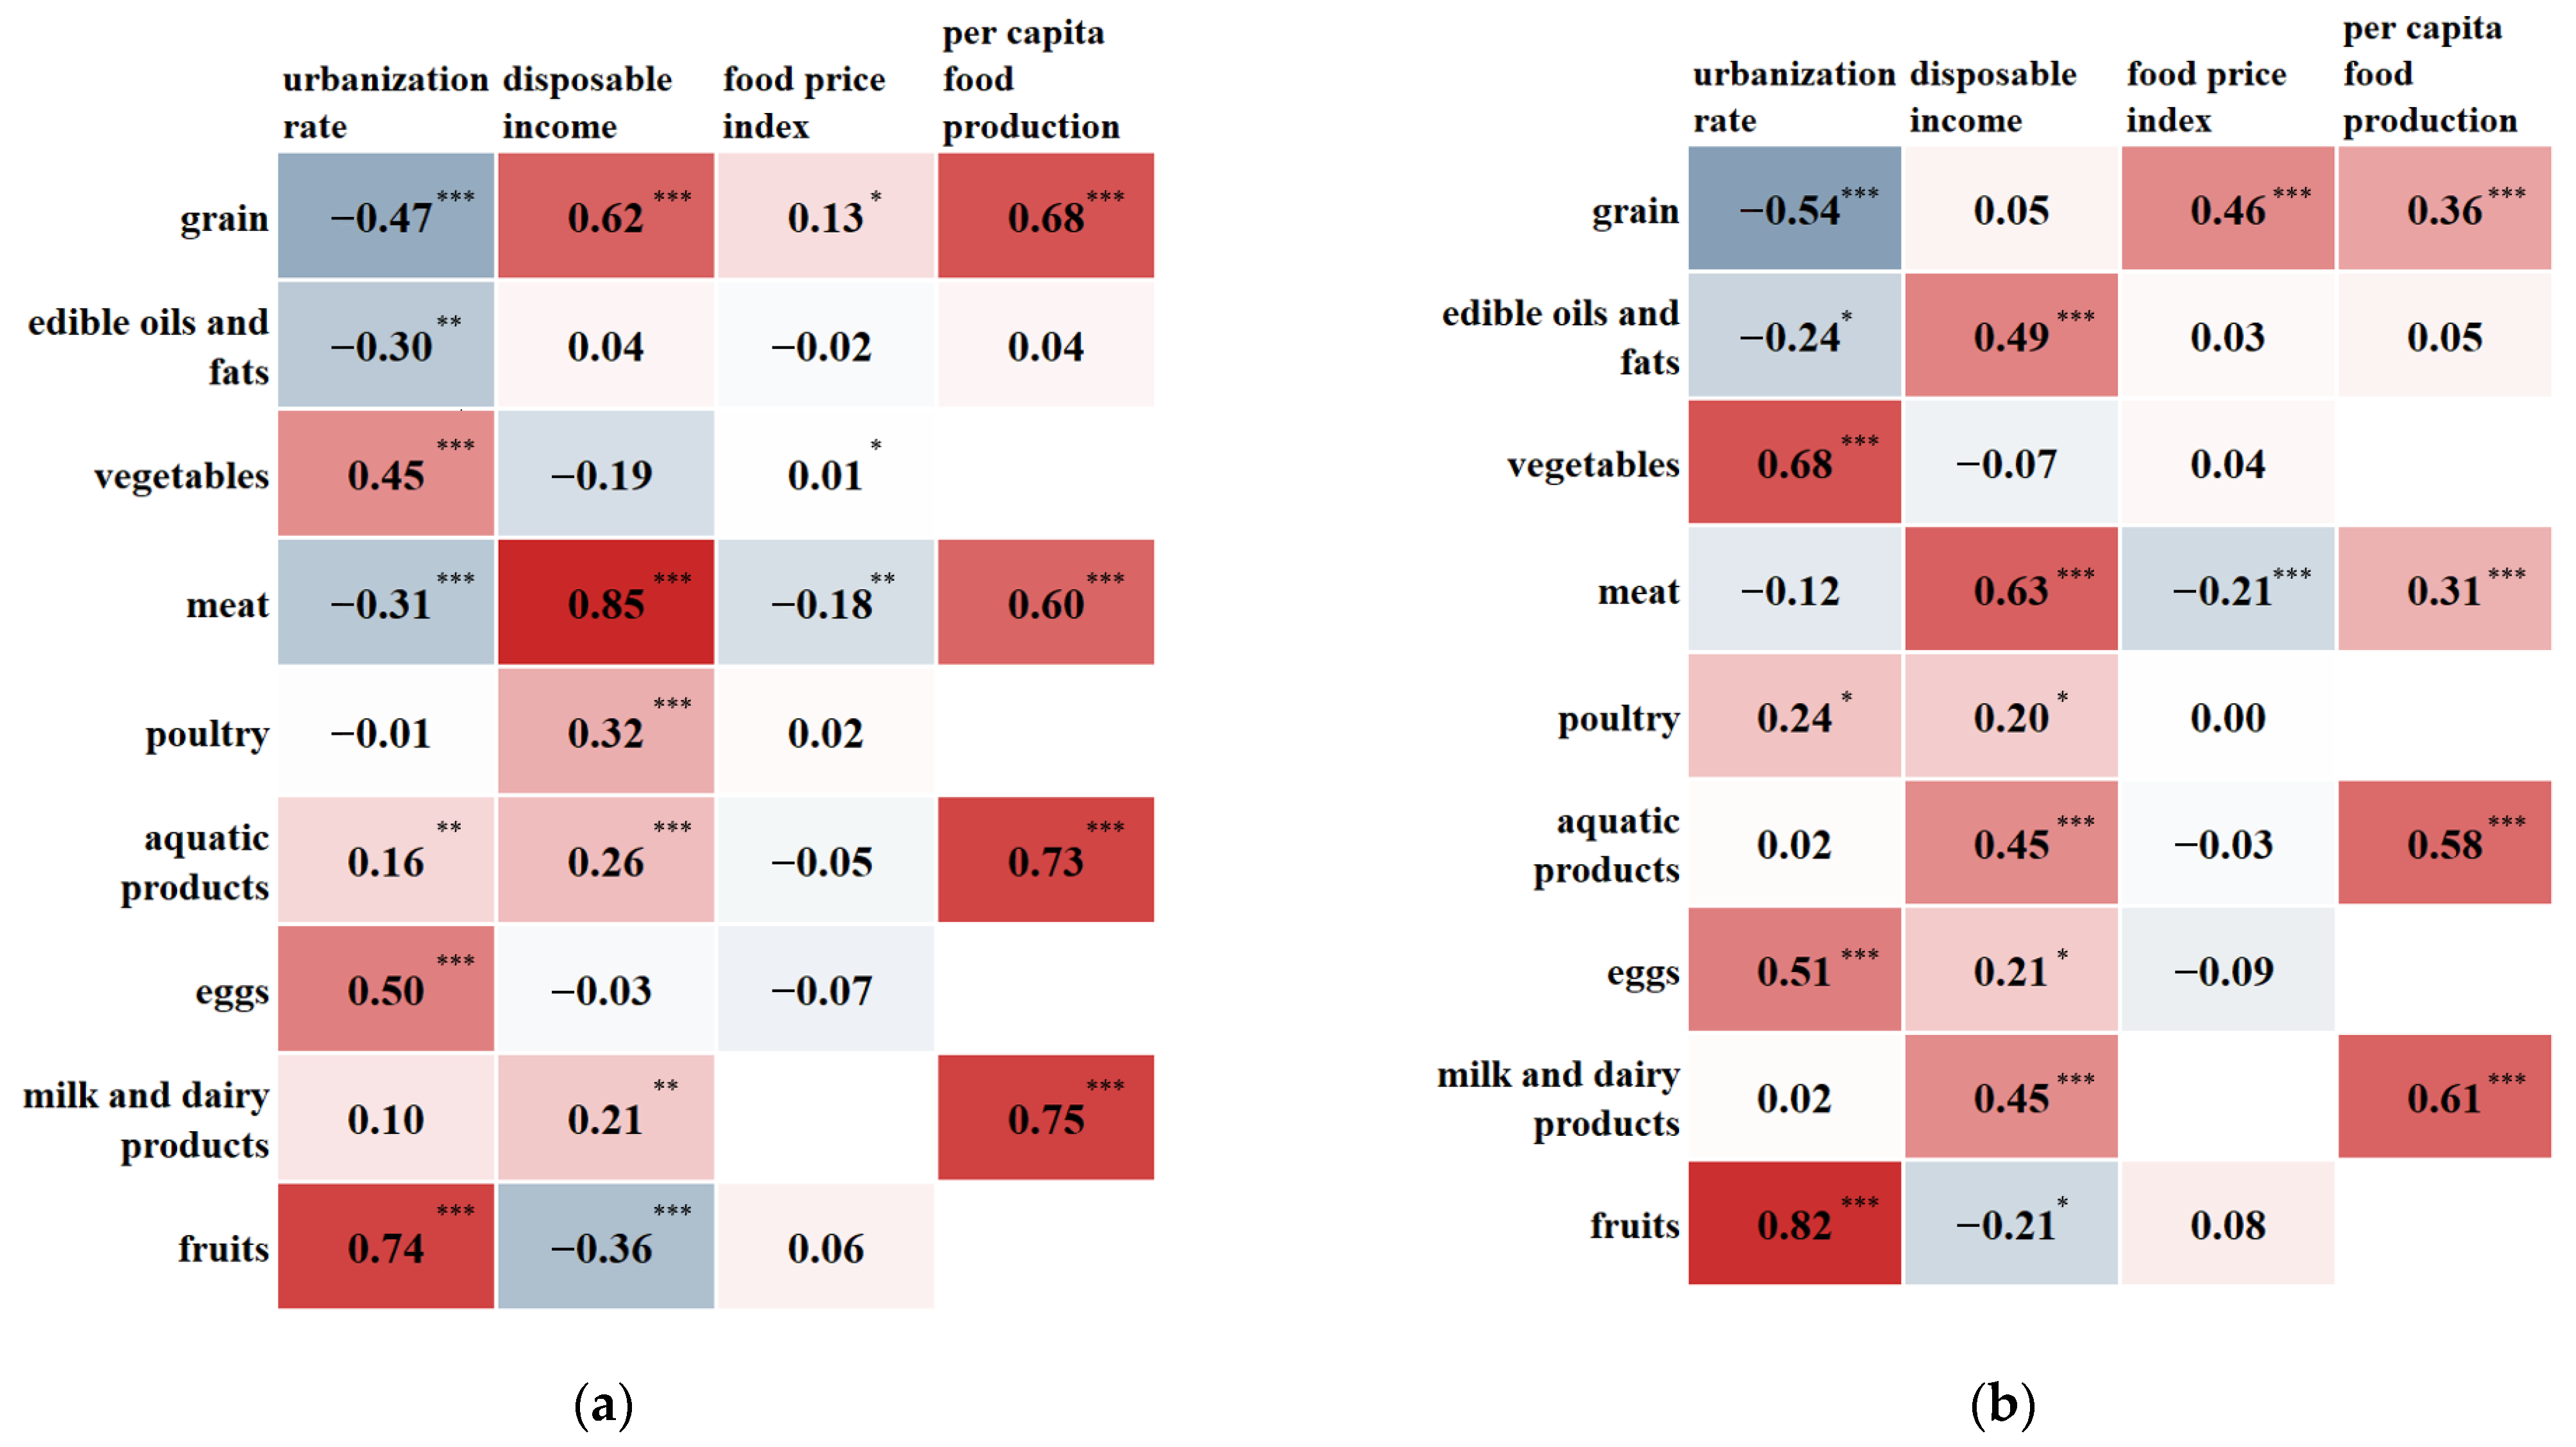
Food consumption is influenced by multiple factors.
Figure 9 shows that there is a significant relationship between food and urbanization rate. Grain and edible oils and fats were negatively correlated, while vegetables and fruits were positively correlated with urbanization rate; these findings are consistent with the higher consumption of food and edible oils and fats in rural areas and better vegetables and fruits eating habits in urban areas, as mentioned above. Disposable income significantly influences the consumption of meat. Per capita food production also has a strong impact on food consumption, especially on aquatic products and dairy products. Inner Mongolia has the highest milk production [
20] and, accordingly, local consumption of dairy products is higher in this region. The same is true for aquatic products consumption in the southeast coast.
4. Discussion
Food consumption among Chinese residents is now a diversified structure dominated by grain consumption and supplemented by meat, fruits, vegetables, aquatic products, poultry, eggs, milk, and dairy products. Hou et al. studied the changes in dietary consumption of the Chinese population between 1980 and 2021, which were mainly characterized by a decline in direct consumption of cereals, a rapid rise in consumption of animal products, and a continuous increase in vegetables and fruits [
1]. The results presented in this paper are consistent with that study. In recent years, the standard of living in rural areas has continued to improve and the supply of agricultural products in the market has become more abundant, giving rural residents a wider choice of food types, a trend that is still present in the food consumption of rural residents. The change in the structure of food consumption is more pronounced among rural residents than among urban residents. However, this change has slowed down in urban areas and is approaching equilibrium, with the rate of change remaining more or less the same over the past seven years.
As the economy and society continue to develop, the consumption of foods in the upper levels of the Chinese Food Guide Pagoda has increased, and the consumption of foods in the lower levels has decreased accordingly, but is still underdeveloped. The dietary problems that existed before 2015 mentioned in the study of Zhao et al. are still not fully resolved [
5]. The consumption of fruits, vegetables, and milk and dairy products is still seriously less than the intake range recommended by the Chinese Nutrition Society. There is also an imbalance between urban and rural areas, and the dietary structure in rural areas needs to be improved.
Food consumption, in addition to dietary imbalances, shows clear regional imbalances. For example, in 2021, the per capita consumption of grains, edible oils and meat in Tibet was in the middle to upper levels of consumption, while the per capita consumption of other food categories was in the lowest level of consumption; thus, there was a seriously unbalanced food consumption structure.
Food security is defined as physical, social, and economic access for all people at all times to a sufficient quantity and quality of food that meets their dietary needs and food preferences for an active and healthy life in terms of variety, diversity, nutrition, and safety [
21]. The issue of food consumption is an integral part of food security and the key to achieving the strategic goal of a healthy China is to enable the population to eat healthily. The above results show that the country’s dietary balance is not ideal. And food consumption is influenced by a number of external factors.
Many studies have examined the relationship between influencing factors such as income, urbanization, and food production and dietary health, and some studies have concluded that these factors have a positive impact on the improvement of dietary balance [
16,
22,
23,
24,
25]. The effect of income is shown by the increase in consumption of animal-based foods, dairy products, fruits and vegetables with increasing income among residents, and in the difference in the degree of dietary balance between urban and rural residents. Urbanization also causes changes in residents’ lifestyles and dietary preferences. Urbanization promotes the upgrading of food consumption structure and nutritional intake by increasing residents’ awareness of nutrition and health, reducing labor intensity, decreasing market distance, and increasing the availability of nutritious food to urban and rural residents. A diverse food structure is an important foundation for the nutritional health of residents, and food production often influences local dietary preferences. For example, the southeastern coastal regions are rich in fishery products, and, accordingly, the consumption of fishery products in these regions is much higher than that in other regions. However, some scholars argue that the influence of these factors cannot be generalized. For example, You et al. argue that the effect of income on improved nutritional balance is weak, while other factors (e.g., food prices, aging), can easily offset the weak effect of income [
26]. In response to the current food consumption situation, corresponding changes can be suggested. Firstly, there is a need to cultivate a balanced diet food consumption concept among residents, especially for those in rural areas of central and western China [
27]. As urbanization and income levels increase in China, animal-based foods consumption will continue to increase, and the environmental pressure and health risks caused by an unreasonable dietary structure will continue to be exposed. Residents’ food consumption is closely related to dietary habits and traditional culture. Therefore, it is necessary to take into account the national situation and advocate that the public eat a variety of foods with diets consisting of mainly cereals, but also more vegetables, milk and dairy products, more animal-based foods, in moderation, and less salt and oil, according to the recommended standards of the Chinese Food Guide Pagoda (2022). Secondly, the food supply should be enriched to enhance the residents’ access to food of insufficient consumption. The prerequisite for ensuring that residents have access to sufficient food is to produce sufficient food. In terms of agricultural supply, we need to actively develop dairy production and promote the development of high-quality pastures. Through the development of new breeding methods, we can overcome the seasonal and geographical difficulties faced by agricultural production in order to increase the supply of under-consumed food such as vegetables and fruits. Agrotourism can also be developed to in turn influence the production and consumption of local foods [
28]. There is an agglomeration effect in the consumption of food by our residents, and regions with high (low) consumption of a certain food will also have high (low) consumption in their surrounding areas. This feature can be used in the process of eliminating regional differences to improve the food consumption of neighboring regions through the optimization of the food consumption structure in one region.
Limitations exist in this paper. Constrained by the data in the yearbook, a more comprehensive analysis of all food groups and more influential factors in the dietary pagoda was not possible. The gradual diversification of food consumption will also bring about nutritional problems due to unreasonable dietary structure, that may produce a situation of overnutrition and high incidence of chronic diseases. In addition, the shift in consumption structure will bring certain challenges to food security and resources and the environment; the balance of food supply and demand and the allocation of environmental resources are topics that need attention in the future. Future studies can also be conducted in more depth for the regions with the most severe dietary imbalance.
5. Conclusions
Using publicly available food consumption data, this paper reviewed and analyzed food consumption in China at the macro level over the past seven years, discussed changes and problems in food consumption, and provided suggestions for optimization to inform future related research and policy formulation. From 2015 to 2021, the food consumption structure of China’s residents developed towards a balanced diet. However, it is still underdeveloped, with the consumption of fruits, vegetables, milk and dairy products not meeting the recommended intake range of the Chinese Dietary Guidelines being the most serious shortfall. Food consumption exhibits significant regional imbalances in the context of dietary imbalances and is influenced by urbanization, disposable income, and production. There is a clustering effect of food consumption in China, and more attention should be paid to regions where particular foods are under-consumed.


