
Comparative Lipidomics Profiling of Acylglycerol from Tuna Oil Selectively Hydrolyzed by Thermomyces Lanuginosus Lipase and Candida Antarctica Lipase A

 , and
, and 
Abstract
1. Introduction
2. Materials and Methods
2.1. Materials
2.2. Enzymatic Hydrolysis of Tuna Oil
2.3. Determination of Hydrolysis Degree
2.4. Extraction of Hydrolysates
2.5. Fourier Transform Infrared Spectroscopy (FTIR) Analysis
2.6. Fatty Acid Composition Analysis
2.7. Non-Targeted Qualitative and Quantitative Analysis of Acylglycerols
2.8. Statistical Analysis
3. Results and Analysis
3.1. FTIR Analysis of Acylglycerols from Tuna Oil Hydrolyzed by Two Lipases
3.2. Analysis of Fatty Acid Composition of Acylglycerols Obtained by Hydrolysis of Tuna Oil by Two Lipases
3.3. Lipid Composition Analysis of Acylglycerols Obtained from Hydrolysis of Tuna Oil by Two Lipases
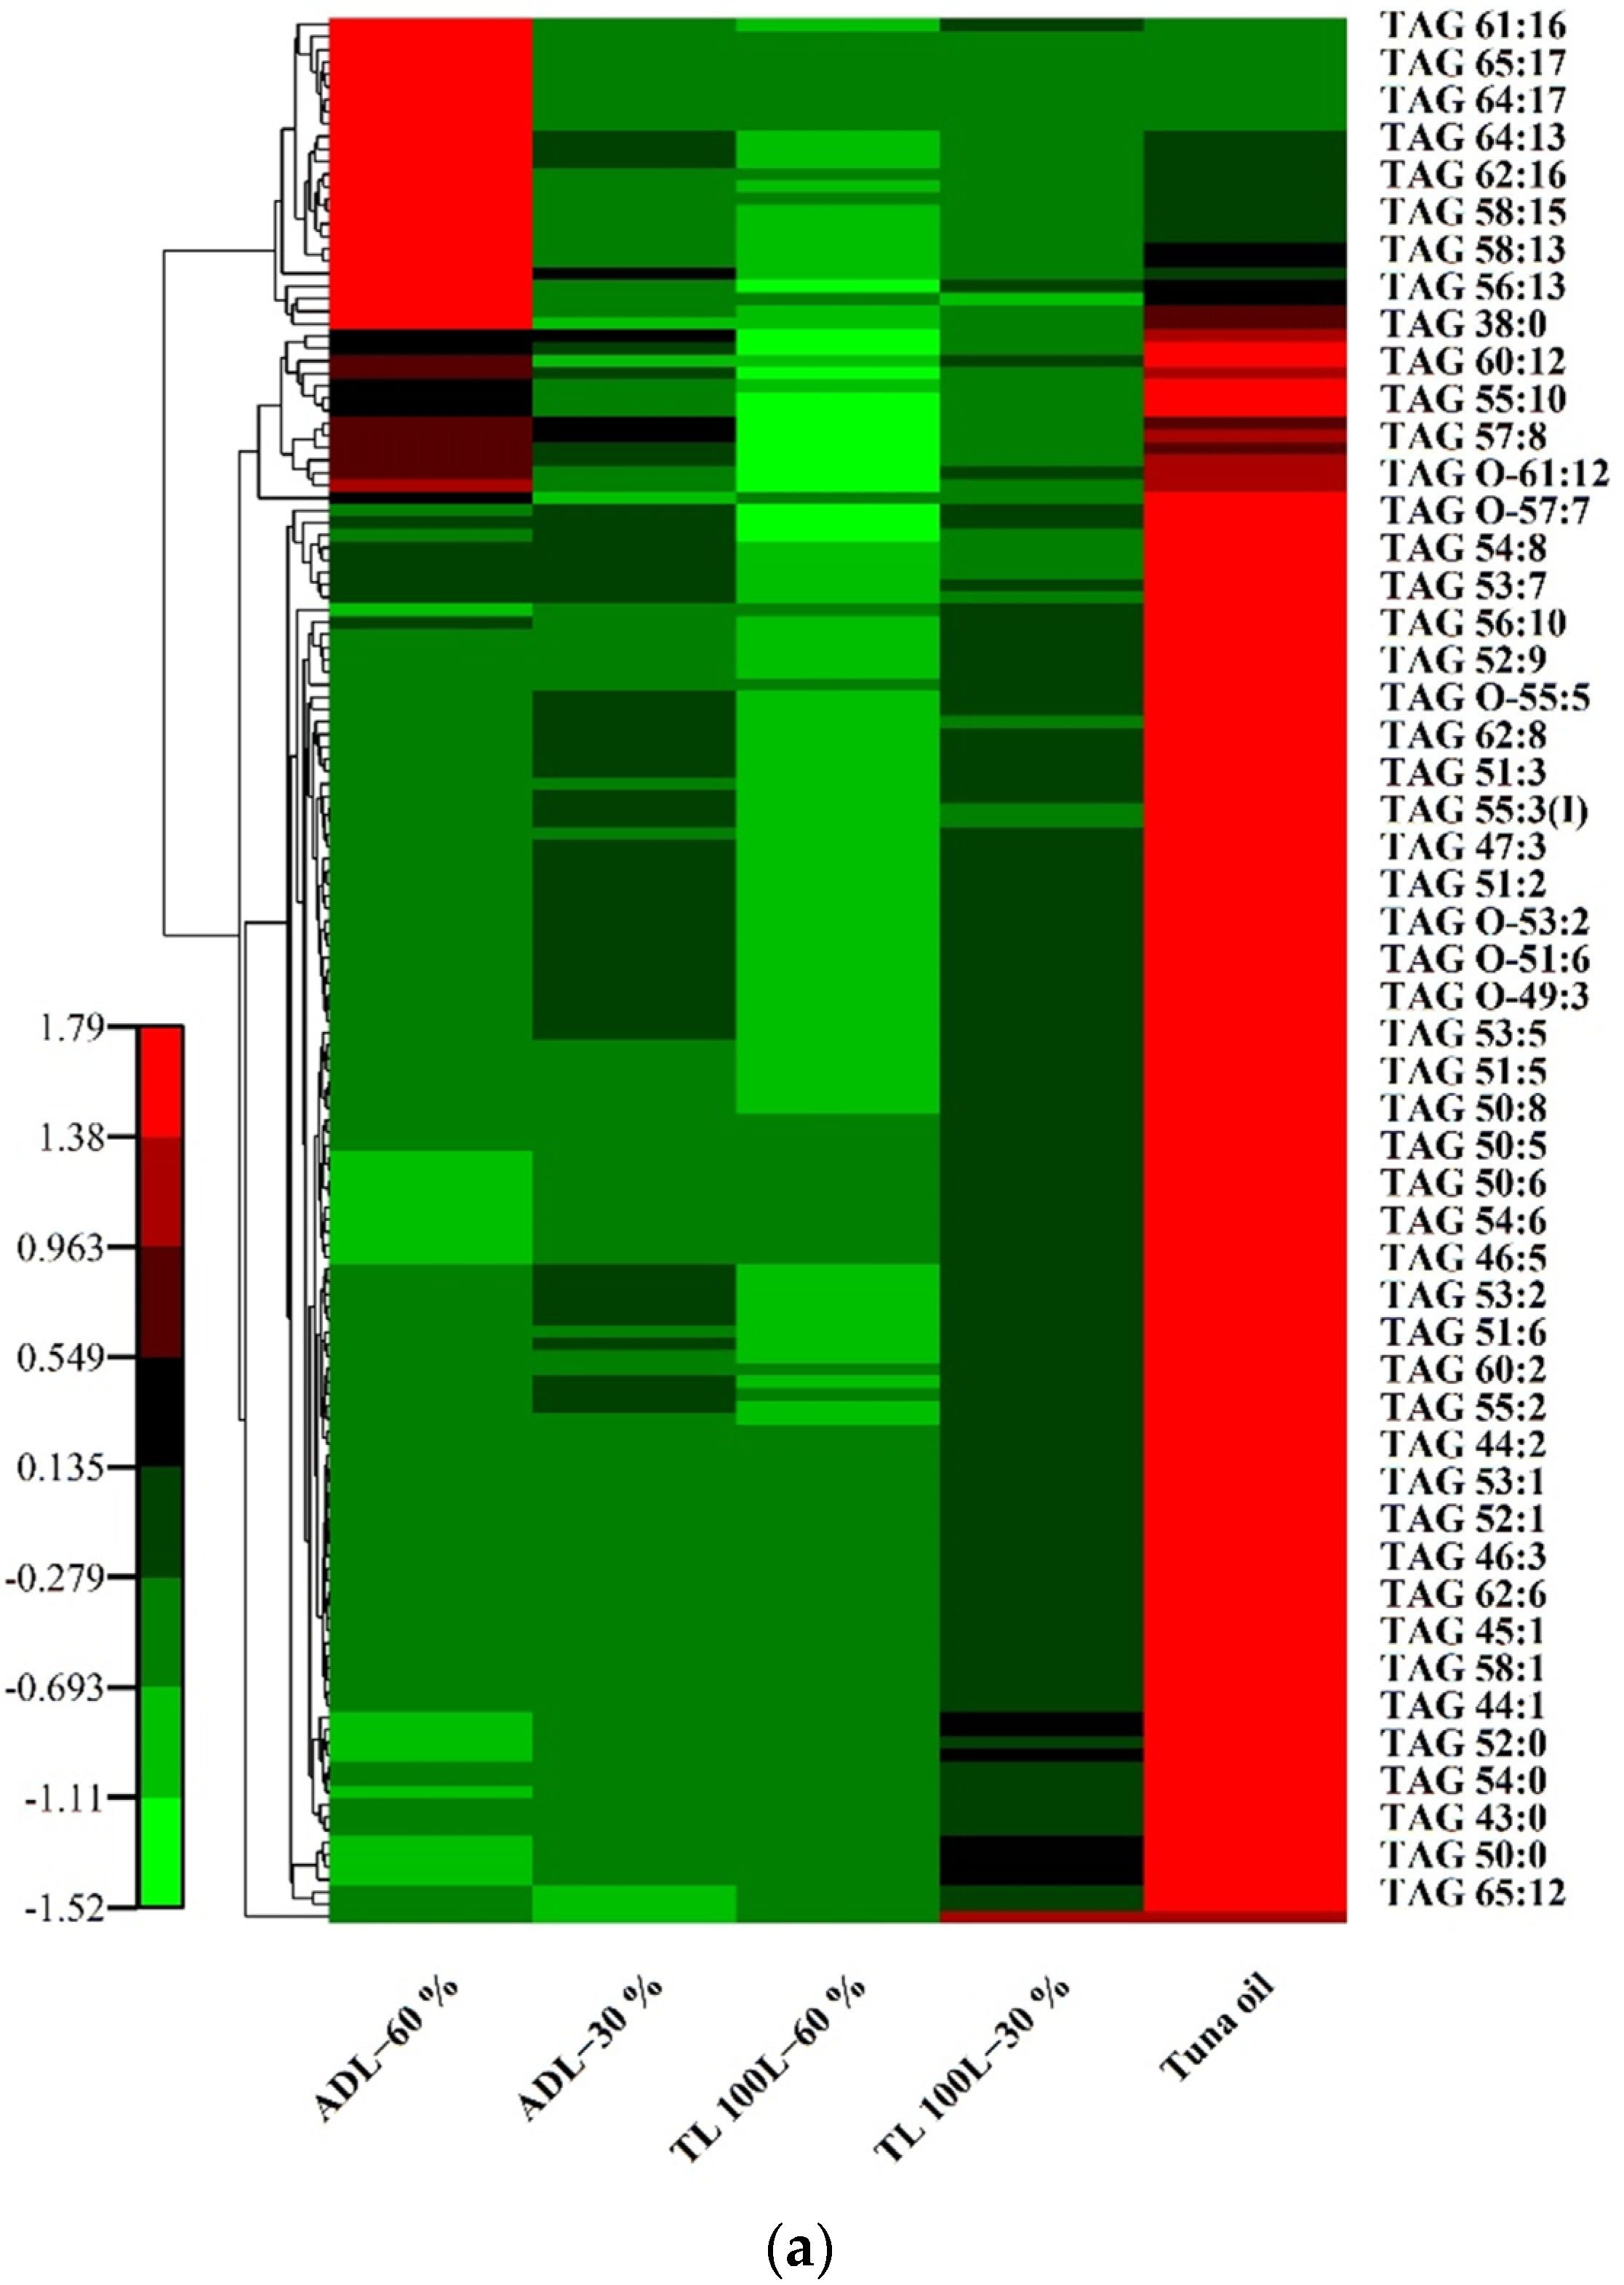
Cluster Heatmap Analysis of TAG, DAG and MAG
4. Discussion
5. Conclusions
Author Contributions
Funding
Institutional Review Board Statement
Informed Consent Statement
Data Availability Statement
Conflicts of Interest
Appendix A


Appendix B

| NO. | Acylglycerols | Tuna Oil | TL 100 L-30% | TL 100 L-60% | ADL-30% | ADL-60% |
|---|---|---|---|---|---|---|
| Content (μg/g) | ||||||
| 1 | DAG 30:0; DAG 14:0–16:0 | 47.32 | 475.13 | 74.70 | 45.69 | 20.12 |
| 2 | DAG 30:1; DAG 14:0–16:1 | 38.63 | 339.82 | 55.14 | 101.13 | 66.83 |
| 3 | DAG 32:0; DAG 16:0–16:0 | 125.00 | 1326.75 | 145.40 | 106.33 | 63.97 |
| 4 | DAG 32:1; DAG 16:0–16:1 | 211.87 | 2111.23 | 314.95 | 705.38 | 318.29 |
| 5 | DAG 32:2; DAG 16:1–16:1 | 69.96 | 722.03 | 136.78 | 372.39 | 220.36 |
| 6 | DAG 32:3; DAG 14:0–18:3 | 23.75 | 351.98 | 116.93 | 139.56 | 117.21 |
| 7 | DAG 32:4; DAG 14:0–18:4 | 26.20 | 532.66 | 227.40 | 146.72 | 130.25 |
| 8 | DAG 32:5; DAG 16:1–16:4 | 6.85 | 140.48 | 53.47 | 76.34 | 52.84 |
| 9 | DAG 33:1; DAG 16:0–17:1 | 90.58 | 864.33 | 142.32 | 352.42 | 251.53 |
| 10 | DAG 33:3; DAG 16:1–17:2 | 14.74 | 302.33 | 103.35 | 214.25 | 233.33 |
| 11 | DAG 34:0; DAG 16:0–18:0 | 73.61 | 522.74 | 78.53 | 113.21 | 57.39 |
| 12 | DAG 34:1; DAG 16:0–18:1 | 403.19 | 4365.69 | 469.57 | 1487.53 | 684.84 |
| 13 | DAG 34:3; DAG 16:0–18:3 | 77.77 | 1114.17 | 284.68 | 636.82 | 479.36 |
| 14 | DAG 34:4; DAG 16:0–18:4 | 100.07 | 2537.22 | 838.75 | 858.07 | 693.11 |
| 15 | DAG 34:5; DAG 14:0–20:5 | 113.58 | 3240.54 | 1029.56 | 1081.24 | 1140.68 |
| 16 | DAG 34:6; DAG 12:0–22:6 | 0.00 | 473.72 | 210.62 | 195.98 | 191.63 |
| 17 | DAG 35:0; DAG 16:0–19:0 | 0.00 | 85.27 | 14.26 | 20.37 | 0.00 |
| 18 | DAG 35:1; DAG 17:0–18:1 | 39.99 | 448.56 | 66.25 | 296.99 | 137.22 |
| 19 | DAG 35:2; DAG 17:1–18:1 | 67.48 | 809.33 | 158.66 | 691.64 | 669.88 |
| 20 | DAG 35:3; DAG 18:1–17:2 | 26.63 | 853.13 | 271.65 | 662.56 | 708.50 |
| 21 | DAG 35:4; DAG 15:0–20:4 | 23.63 | 561.66 | 204.49 | 316.99 | 329.38 |
| 22 | DAG 35:5; DAG 15:0–20:5 | 40.19 | 1267.39 | 512.74 | 545.52 | 680.90 |
| 23 | DAG 35:6; DAG 13:0–22:6 | 0.00 | 488.01 | 322.26 | 229.01 | 375.54 |
| 24 | DAG 36:0; DAG 18:0–18:0 | 24.91 | 113.92 | 21.70 | 32.83 | 17.04 |
| 25 | DAG 36:1; DAG 18:0–18:1 | 115.43 | 1122.42 | 126.34 | 692.08 | 255.61 |
| 26 | DAG 36:2; DAG 18:1–18:1 | 219.95 | 2370.38 | 342.97 | 2470.80 | 1745.08 |
| 27 | DAG 36:3; DAG 18:1–18:2 | 120.07 | 1445.63 | 332.78 | 1105.70 | 831.67 |
| 28 | DAG 36:4; DAG 16:0–20:4 | 259.56 | 4738.41 | 1400.83 | 2228.70 | 1817.08 |
| 29 | DAG 36:5; DAG 16:0–20:5 | 651.03 | 15,470.85 | 4713.80 | 6322.88 | 5960.53 |
| 30 | DAG 36:6; DAG 14:0–22:6 | 530.49 | 23,909.82 | 13595.62 | 7618.44 | 8534.96 |
| 31 | DAG 36:7; DAG 14:1–22:6 | 26.27 | 1036.15 | 563.22 | 621.78 | 859.90 |
| 32 | DAG 36:8; DAG 16:3–20:5 | 5.33 | 353.27 | 185.74 | 204.54 | 267.53 |
| 33 | DAG 37:5; DAG 17:1–20:4 | 77.19 | 2216.63 | 1002.70 | 1269.67 | 1467.85 |
| 34 | DAG 37:6; DAG 15:0–22:6 | 176.10 | 6138.33 | 3292.58 | 3204.83 | 3917.36 |
| 35 | DAG 38:10; DAG 16:4–22:6 | 19.73 | 781.55 | 727.54 | 437.00 | 681.68 |
| 36 | DAG 38:2; DAG 18:1–20:1 | 51.11 | 479.43 | 82.20 | 433.78 | 221.24 |
| 37 | DAG 38:3; DAG 18:1–20:2 | 34.50 | 406.95 | 112.38 | 292.39 | 218.78 |
| 38 | DAG 38:4; DAG 18:0–20:4 | 168.46 | 1908.06 | 629.20 | 1110.65 | 960.27 |
| 39 | DAG 38:5; DAG 16:0–22:5 | 471.89 | 10,335.06 | 3948.31 | 5561.04 | 5516.33 |
| 40 | DAG 38:5; DAG 18:1–20:4 | 143.43 | 5158.54 | 3224.51 | 2158.30 | 2053.61 |
| 41 | DAG 38:6; DAG 16:0–22:6 | 2389.80 | 102,309.97 | 66,519.14 | 39,001.33 | 39,865.78 |
| 42 | DAG 38:7; DAG 16:1–22:6 | 620.30 | 25,416.58 | 17,033.00 | 18,258.36 | 23,891.90 |
| 43 | DAG 38:8; DAG 16:2–22:6 | 67.72 | 3034.83 | 2213.23 | 1604.53 | 3121.21 |
| 44 | DAG 38:9; DAG 18:4–20:5 | 32.09 | 1950.56 | 1374.73 | 1122.22 | 2153.30 |
| 45 | DAG 39:6; DAG 17:0–22:6 | 196.61 | 4495.93 | 3149.77 | 2976.09 | 3028.51 |
| 46 | DAG 39:7; DAG 17:1–22:6 | 240.34 | 6981.90 | 5434.90 | 5825.93 | 11,082.13 |
| 47 | DAG 39:8; DAG 17:2–22:6 | 48.73 | 4188.93 | 4088.21 | 2013.50 | 4939.27 |
| 48 | DAG 40:1; DAG 16:0–24:1 | 38.21 | 213.94 | 28.78 | 62.27 | 26.14 |
| 49 | DAG 40:10; DAG 18:4–22:6 | 181.91 | 12,037.29 | 9686.87 | 7011.13 | 15,050.05 |
| 50 | DAG 40:2; DAG 18:1–22:1 | 21.41 | 263.89 | 35.75 | 130.91 | 64.95 |
| 51 | DAG 40:5; DAG 18:0–22:5 | 90.23 | 1582.24 | 737.01 | 1025.35 | 1470.10 |
| 52 | DAG 40:5; DAG 18:0–22:5 | 90.23 | 1582.24 | 737.01 | 1025.35 | 1470.10 |
| 53 | DAG 40:6; DAG 18:0–22:6 | 861.11 | 18,743.87 | 10323.01 | 11,102.21 | 10,724.67 |
| 54 | DAG 40:7; DAG 18:1–22:6 | 1410.22 | 61,949.47 | 46509.63 | 54,822.89 | 77,305.10 |
| 55 | DAG 40:8; DAG 18:2–22:6 | 206.87 | 7705.16 | 5693.55 | 5729.69 | 10,315.99 |
| 56 | DAG 40:9; DAG 18:3–22:6 | 150.55 | 6393.74 | 4850.48 | 4169.88 | 9355.75 |
| 57 | DAG 42:10; DAG 20:4–22:6 | 348.28 | 20,863.81 | 18,764.26 | 12,384.39 | 34,427.13 |
| 58 | DAG 42:11; DAG 20:5–22:6 | 747.84 | 45,571.15 | 50,662.00 | 27,924.17 | 96,552.23 |
| 59 | DAG 42:6; DAG 20:0–22:6 | 33.21 | 1239.30 | 587.09 | 649.15 | 541.44 |
| 60 | DAG 42:7; DAG 20:1–22:6 | 145.09 | 4610.14 | 2406.69 | 2828.37 | 3043.95 |
| 61 | DAG 42:8; DAG 20:2–22:6 | 51.05 | 1950.87 | 1294.44 | 1026.49 | 1132.87 |
| 62 | DAG 42:9; DAG 20:3–22:6 | 84.50 | 2958.85 | 2249.54 | 1859.50 | 3529.76 |
| 63 | DAG 43:10; DAG 21:4–22:6 | 0.00 | 255.09 | 282.47 | 177.19 | 412.86 |
| 64 | DAG 43:11; DAG 21:5–22:6 | 41.22 | 1889.05 | 2404.86 | 935.20 | 2465.08 |
| 65 | DAG 43:6; DAG 21:0–22:6 | 9.26 | 265.82 | 124.87 | 113.56 | 62.18 |
| 66 | DAG 43:7; DAG 21:1–22:6 | 0.00 | 146.73 | 62.36 | 67.33 | 101.03 |
| 67 | DAG 44:10; DAG 22:4–22:6 | 59.25 | 2464.97 | 2312.16 | 1440.98 | 3052.70 |
| 68 | DAG 44:11; DAG 22:5–22:6 | 197.72 | 13,152.21 | 18,262.20 | 6914.77 | 32,316.54 |
| 69 | DAG 44:11; DAG 22:5–22:6 | 197.72 | 13,152.24 | 18,262.24 | 6914.78 | 32,316.60 |
| 70 | DAG 44:12; DAG 22:6–22:6 | 1260.03 | 139,821.33 | 231,409.93 | 68,627.77 | 250,527.74 |
| 71 | DAG 44:6; DAG 22:0–22:6 | 14.11 | 526.51 | 318.57 | 205.98 | 148.49 |
| 72 | DAG 44:7; DAG 22:1–22:6 | 37.84 | 1184.01 | 608.59 | 719.51 | 600.11 |
| 73 | DAG 44:8; DAG 22:2–22:6 | 32.33 | 303.32 | 190.76 | 172.83 | 211.81 |
| 74 | DAG 46:12; DAG 22:6–24:6 | 23.17 | 563.99 | 757.00 | 367.34 | 859.42 |
| 75 | DAG 46:6; DAG 24:0–22:6 | 7.04 | 430.98 | 191.84 | 189.49 | 88.21 |
| 76 | DAG 46:7; DAG 24:1–22:6 | 43.16 | 1383.75 | 644.44 | 644.77 | 493.10 |
| 77 | DAG 46:8; DAG 24:2–22:6 | 21.92 | 162.61 | 115.59 | 115.98 | 79.02 |
| 78 | DAG 48:12; DAG 22:6–26:6 | 84.86 | 172.97 | 165.86 | 117.27 | 300.08 |
| 79 | DAG 48:7; DAG 26:1–22:6 | 17.72 | 209.00 | 78.23 | 106.95 | 85.33 |
| 80 | DAG O-30:2; DAG O-17:1–13:1 | 6.87 | 10.63 | 31.83 | 30.95 | 42.23 |
| 81 | DAG O-32:2; DAG O-17:0–15:2 | 12.79 | 51.55 | 187.35 | 21.23 | 23.01 |
| 82 | DAG O-34:1; DAG O-19:0–15:1 | 3.81 | 20.56 | 93.23 | 4.52 | 4.32 |
| 83 | DAG O-34:2; DAG O-19:1–15:1 | 29.88 | 88.77 | 335.12 | 34.06 | 46.17 |
| 84 | DAG O-36:3; DAG O-19:1–17:2 | 206.83 | 356.41 | 376.77 | 262.99 | 271.34 |
| 85 | DAG O-36:4; DAG O-19:2–17:2 | 94.21 | 283.04 | 146.66 | 312.97 | 215.63 |
| 86 | DAGGA 34:1; DAGGA 16:0–18:1 | 49.68 | 95.98 | 102.69 | 99.96 | 116.57 |
| 87 | DAGGA 36:2; DAGGA 18:1–18:1 | 258.76 | 370.96 | 287.25 | 371.22 | 351.11 |
| 88 | TAG 36:0; TAG 10:0–12:0–14:0 | 22.62 | 22.02 | 17.63 | 16.13 | 17.46 |
| 89 | TAG 38:0; TAG 10:0–12:0–16:0 | 19.65 | 17.12 | 16.53 | 16.37 | 21.88 |
| 90 | TAG 38:1; TAG 10:0–10:0–18:1 | 21.64 | 15.57 | 13.24 | 11.23 | 13.67 |
| 91 | TAG 40:0; TAG 10:0–14:0–16:0 | 30.54 | 21.04 | 21.53 | 19.45 | 26.04 |
| 92 | TAG 40:1; TAG 10:0–12:0–18:1 | 17.62 | 14.50 | 13.02 | 14.66 | 17.53 |
| 93 | TAG 42:0; TAG 12:0–14:0–16:0 | 108.35 | 39.03 | 25.54 | 25.76 | 24.23 |
| 94 | TAG 42:1; TAG 10:0–14:0–18:1 | 42.97 | 20.95 | 16.59 | 17.18 | 20.13 |
| 95 | TAG 43:0; TAG 14:0–14:0–15:0 | 77.20 | 24.44 | 11.33 | 11.00 | 9.51 |
| 96 | TAG 44:0; TAG 14:0–14:0–16:0 | 598.74 | 184.92 | 58.24 | 44.77 | 23.91 |
| 97 | TAG 44:1; TAG 14:0–14:0–16:1 | 417.01 | 99.31 | 41.51 | 64.52 | 36.68 |
| 98 | TAG 44:2; TAG 14:0–14:1–16:1 | 71.69 | 21.92 | 12.89 | 21.33 | 14.04 |
| 99 | TAG 45:0; TAG 14:0–15:0–16:0 | 319.72 | 117.00 | 37.38 | 39.57 | 18.54 |
| 100 | TAG 45:1; TAG 14:0–15:0–16:1 | 325.19 | 93.39 | 29.93 | 62.54 | 28.15 |
| 101 | TAG 45:2; TAG 15:0–14:1–16:1 | 83.58 | 27.40 | 11.36 | 24.13 | 16.06 |
| 102 | TAG 46:0; TAG 14:0–16:0–16:0 | 1772.31 | 737.54 | 177.23 | 140.50 | 46.62 |
| 103 | TAG 46:1; TAG 14:0–16:0–16:1 | 3107.62 | 722.24 | 175.80 | 372.83 | 108.81 |
| 104 | TAG 46:2; TAG 14:0–16:1–16:1 | 796.11 | 188.16 | 59.54 | 166.71 | 71.52 |
| 105 | TAG 46:3; TAG 14:0–16:0–16:3 | 196.66 | 55.17 | 20.22 | 45.05 | 21.94 |
| 106 | TAG 46:4; TAG 14:0–14:0–18:4 | 146.48 | 42.47 | 21.75 | 26.79 | 16.19 |
| 107 | TAG 46:5; TAG 12:0–14:0–20:5 | 38.35 | 15.58 | 5.35 | 9.55 | 5.17 |
| 108 | TAG 47:0; TAG 14:0–16:0–17:0 | 699.02 | 274.51 | 68.64 | 82.03 | 26.54 |
| 109 | TAG 47:1; TAG 14:0–16:0–17:1 | 1540.81 | 441.21 | 124.84 | 306.27 | 110.83 |
| 110 | TAG 47:2; TAG 14:0–16:1–17:1 | 645.66 | 213.60 | 69.64 | 200.66 | 107.67 |
| 111 | TAG 47:3; TAG 14:0–16:1–17:2 | 185.15 | 63.33 | 28.77 | 62.32 | 48.94 |
| 112 | TAG 48:0; TAG 16:0–16:0–16:0 | 2360.71 | 1349.53 | 303.78 | 244.57 | 66.12 |
| 113 | TAG 48:1; TAG 14:0–16:0–18:1 | 11,382.75 | 2785.59 | 494.86 | 1421.02 | 362.58 |
| 114 | TAG 48:2; TAG 14:0–16:1–18:1 | 4745.03 | 1141.24 | 257.93 | 1056.63 | 354.85 |
| 115 | TAG 48:3; TAG 14:0–16:1–18:2 | 1277.27 | 375.59 | 120.75 | 329.42 | 162.50 |
| 116 | TAG 48:4; TAG 14:0–16:0–18:4 | 899.02 | 311.34 | 140.68 | 213.37 | 101.40 |
| 117 | TAG 48:5; TAG 14:0–14:0–20: | 766.67 | 218.83 | 87.21 | 157.30 | 81.95 |
| 118 | TAG 48:6; TAG 12:0–14:0–22:6 | 117.25 | 44.23 | 23.35 | 36.59 | 23.90 |
| 119 | TAG 49:0; TAG 16:0–16:0–17:0 | 589.05 | 275.28 | 55.16 | 80.23 | 21.36 |
| 120 | TAG 49:1; TAG 15:0–16:0–18:1 | 4237.26 | 1030.17 | 202.59 | 717.88 | 218.71 |
| 121 | TAG 49:3; TAG 16:0–16:1–17:2 | 934.22 | 320.91 | 106.11 | 354.32 | 246.93 |
| 122 | TAG 49:5; TAG 14:0–15:0–20:5 | 422.49 | 164.69 | 69.06 | 135.40 | 86.89 |
| 123 | TAG 49:6; TAG 13:0–14:0–22:6 | 129.64 | 50.46 | 31.32 | 46.43 | 39.70 |
| 124 | TAG 50:0; TAG 16:0–16:0–18:0 | 1232.27 | 602.91 | 117.00 | 142.30 | 32.46 |
| 125 | TAG 50:1; TAG 16:0–16:0–18:1 | 16,831.89 | 4421.03 | 701.19 | 2404.55 | 622.86 |
| 126 | TAG 50:2; TAG 16:0–16:1–18:1 | 13,668.03 | 3233.82 | 513.71 | 3305.07 | 1136.30 |
| 127 | TAG 50:3; TAG 16:0–16:1–18:2 | 4249.84 | 1245.11 | 317.65 | 1371.66 | 613.79 |
| 128 | TAG 50:4; TAG 16:0–16:0–18:4 | 3483.53 | 1296.83 | 479.61 | 893.20 | 437.83 |
| 129 | TAG 50:5; TAG 14:0–16:0–20:5 | 4995.87 | 1821.60 | 693.31 | 1157.60 | 617.92 |
| 130 | TAG 50:6; TAG 14:0–14:0–22:6 | 2948.29 | 1089.61 | 545.24 | 773.05 | 429.69 |
| 131 | TAG 50:7; TAG 14:1–16:1–20:5 | 284.88 | 109.26 | 55.64 | 102.36 | 85.94 |
| 132 | TAG 50:8; TAG 14:0–16:3–20:5 | 61.26 | 30.70 | 17.50 | 22.24 | 19.88 |
| 133 | TAG 51:0; TAG 16:0–17:0–18:0 | 266.67 | 106.15 | 22.69 | 37.34 | 8.97 |
| 134 | TAG 51:1; TAG 16:0–17:0–18:1 | 3277.37 | 758.78 | 109.50 | 490.42 | 138.98 |
| 135 | TAG 51:2; TAG 16:0–17:1–18:1 | 4624.51 | 1167.22 | 212.05 | 1362.95 | 710.33 |
| 136 | TAG 51:3; TAG 16:0–18:1–17:2 | 2132.11 | 727.84 | 189.30 | 870.67 | 645.99 |
| 137 | TAG 51:4; TAG 15:0–17:2–19:2 | 1298.42 | 509.95 | 179.67 | 507.96 | 362.90 |
| 138 | TAG 51:5; TAG 15:0–16:0–20:5 | 1920.43 | 808.25 | 323.31 | 613.60 | 401.60 |
| 139 | TAG 51:6; TAG 14:0–15:0–22:6 | 1716.64 | 697.80 | 369.91 | 594.44 | 435.23 |
| 140 | TAG 51:7; TAG 14:0–15:1–22:6 | 289.07 | 125.98 | 73.70 | 135.69 | 140.98 |
| 141 | TAG 52:0; TAG 16:0–18:0–18:0 | 359.61 | 136.53 | 33.57 | 45.60 | 11.07 |
| 142 | TAG 52:1; TAG 16:0–18:0–18:1 | 7521.60 | 1610.37 | 221.37 | 965.94 | 225.14 |
| 143 | TAG 52:10; TAG 14:0–16:4–22: | 79.38 | 42.29 | 28.41 | 36.82 | 38.37 |
| 144 | TAG 52:2; TAG 16:0–18:1–18:1 | 14,528.15 | 3581.68 | 492.08 | 3886.73 | 1487.54 |
| 145 | TAG 52:3; TAG 16:0–18:1–18:2 | 6715.38 | 1893.02 | 368.07 | 2336.10 | 1295.27 |
| 146 | TAG 52:5; TAG 16:0–16:0–20:5 | 12,624.93 | 5019.98 | 1572.51 | 3005.89 | 2075.81 |
| 147 | TAG 52:6; TAG 14:0–16:0–22:6 | 20,775.69 | 8667.66 | 4465.53 | 5173.09 | 2905.92 |
| 148 | TAG 52:7; TAG 14:0–16:1–22:6 | 5268.18 | 2262.78 | 1127.22 | 2161.61 | 1479.09 |
| 149 | TAG 52:8; TAG 14:0–16:2–22:6 | 790.22 | 318.02 | 176.69 | 317.53 | 282.02 |
| 150 | TAG 52:9; TAG 14:0–18:4–20:5 | 314.17 | 147.07 | 85.42 | 118.05 | 120.07 |
| 151 | TAG 53:1; TAG 17:0–18:0–18:1 | 1082.49 | 231.67 | 36.50 | 156.72 | 47.08 |
| 152 | TAG 53:2; TAG 18:0–17:1–18:1 | 2097.92 | 502.91 | 71.64 | 535.59 | 250.17 |
| 153 | TAG 53:3; TAG 17:1–18:1–18:1 | 1789.09 | 570.71 | 99.01 | 712.15 | 605.64 |
| 154 | TAG 53:5; TAG 16:0–17:0–20:5 | 2129.93 | 921.36 | 315.77 | 708.85 | 440.68 |
| 155 | TAG 53:6; TAG 15:0–16:0–22:6 | 7756.86 | 3376.25 | 1459.65 | 2259.20 | 1711.91 |
| 156 | TAG 53:7; TAG 14:0–17:1–22:6 | 2959.02 | 1394.96 | 830.27 | 1482.14 | 1400.46 |
| 157 | TAG 53:9; TAG 15:0–18:4–20:5 | 133.67 | 68.36 | 44.99 | 72.04 | 96.88 |
| 158 | TAG 54:0; TAG 16:0–18:0–20:0 | 134.22 | 47.68 | 9.95 | 14.77 | 4.95 |
| 159 | TAG 54:1; TAG 18:0–18:0–18:1 | 1860.35 | 368.00 | 61.44 | 201.70 | 49.50 |
| 160 | TAG 54:10; TAG 14:0–18:4–22:6 | 1354.79 | 722.54 | 460.66 | 578.86 | 644.29 |
| 161 | TAG 54:11; TAG 12:0–20:5–22:6 | 107.87 | 62.86 | 44.94 | 69.50 | 92.07 |
| 162 | TAG 54:2; TAG 18:0–18:1–18:1 | 4348.16 | 972.05 | 134.50 | 996.12 | 364.78 |
| 163 | TAG 54:3; TAG 18:1–18:1–18:1 | 4415.34 | 1183.47 | 251.01 | 1778.01 | 1051.09 |
| 164 | TAG 54:4; TAG 18:1–18:1–18:2 | 4817.22 | 1802.51 | 483.94 | 1553.44 | 933.86 |
| 165 | TAG 54:5; TAG 16:0–18:1–20:4 | 10,617.33 | 4124.18 | 1116.78 | 2678.88 | 1503.99 |
| 166 | TAG 54:6; TAG 16:0–16:0–22:6 | 43,768.75 | 19,221.93 | 9247.44 | 11,928.87 | 6974.94 |
| 167 | TAG 54:7; TAG 16:0–16:1–22:6 | 26,437.66 | 12,513.05 | 6802.23 | 11,540.54 | 8925.58 |
| 168 | TAG 54:8; TAG 16:1–16:1–22:6 | 5369.36 | 2468.51 | 1318.56 | 2998.23 | 2620.45 |
| 169 | TAG 54:9; TAG 16:0–18:4–20:5 | 2226.27 | 1074.58 | 596.86 | 947.74 | 933.05 |
| 170 | TAG 55:10; TAG 15:0–18:4–22:6 | 442.13 | 245.52 | 161.68 | 240.29 | 327.21 |
| 171 | TAG 55:2; TAG 19:0–18:1–18:1 | 596.37 | 147.34 | 23.80 | 134.01 | 55.29 |
| 172 | TAG 55:3; TAG 17:1–18:1–20:1 | 550.48 | 142.05 | 42.07 | 154.17 | 104.63 |
| 173 | TAG 55:3; TAG 18:1–18:1–19:1 | 550.48 | 142.05 | 42.07 | 154.17 | 104.63 |
| 174 | TAG 55:9; TAG 16:1–17:2–22:6 | 750.36 | 457.78 | 292.78 | 569.79 | 748.54 |
| 175 | TAG 56:0; TAG 16:0–18:0–22:0 | 73.62 | 26.11 | 5.72 | 8.15 | 3.22 |
| 176 | TAG 56:1; TAG 16:0–22:0–18:1 | 813.79 | 179.75 | 27.99 | 72.28 | 18.02 |
| 177 | TAG 56:10; TAG 16:0–20:5–20:5 | 7474.70 | 4374.40 | 2651.81 | 3682.49 | 4208.50 |
| 178 | TAG 56:11; TAG 14:0–20:5–22:6 | 3760.87 | 2100.03 | 1467.95 | 2042.91 | 2572.65 |
| 179 | TAG 56:12; TAG 14:1–20:5–22:6 | 168.04 | 104.55 | 79.00 | 119.66 | 212.57 |
| 180 | TAG 56:13; TAG 18:4–18:4–20:5 | 38.44 | 32.73 | 20.69 | 28.38 | 51.49 |
| 181 | TAG 56:14; TAG 16:4–20:5–20:5 | 16.15 | 13.29 | 10.86 | 17.08 | 23.92 |
| 182 | TAG 56:2; TAG 16:0–18:1–22:1 | 1414.86 | 295.72 | 48.61 | 218.14 | 68.55 |
| 183 | TAG 56:3; TAG 18:1–18:1–20:1 | 883.75 | 245.01 | 44.24 | 280.18 | 145.27 |
| 184 | TAG 56:6; TAG 16:0–18:0–22:6 | 23,151.74 | 8969.90 | 3069.05 | 6220.28 | 3841.85 |
| 185 | TAG 56:7; TAG 16:0–18:1–22:6 | 39,424.14 | 18,549.03 | 9210.04 | 17,954.94 | 14,218.79 |
| 186 | TAG 56:8; TAG 16:1–18:1–22:6 | 13,568.57 | 6887.47 | 3582.07 | 8914.80 | 9537.98 |
| 187 | TAG 57:12; TAG 13:0–22:6–22:6 | 168.23 | 108.44 | 91.90 | 125.12 | 269.09 |
| 188 | TAG 57:7; TAG 17:0–18:1–22:6 | 5114.37 | 2107.36 | 836.21 | 2249.61 | 1799.39 |
| 189 | TAG 57:8; TAG 17:1–18:1–22:6 | 3652.72 | 1716.98 | 902.90 | 2740.44 | 3447.92 |
| 190 | TAG 58:1; TAG 16:0–24:0–18:1 | 338.55 | 74.96 | 12.09 | 36.58 | 10.28 |
| 191 | TAG 58:13; TAG 16:2–20:5–22:6 | 355.68 | 229.28 | 174.78 | 262.57 | 556.77 |
| 192 | TAG 58:14; TAG 18:4–20:5–20:5 | 125.61 | 99.31 | 75.83 | 95.27 | 225.71 |
| 193 | TAG 58:15; TAG 16:4–20:5–22:6 | 33.78 | 24.69 | 21.50 | 29.38 | 69.29 |
| 194 | TAG 58:2; TAG 16:0–18:1–24:1 | 856.05 | 181.40 | 25.10 | 119.13 | 34.12 |
| 195 | TAG 58:3; TAG 18:1–18:1–22:1 | 404.50 | 127.01 | 27.69 | 101.60 | 45.62 |
| 196 | TAG 58:6; TAG 18:0–18:0–22:6 | 4769.40 | 1641.79 | 392.38 | 803.00 | 255.79 |
| 197 | TAG 58:8; TAG 18:1–18:1–22:6 | 10,173.23 | 5079.44 | 2388.11 | 7777.92 | 9902.09 |
| 198 | TAG 59:13; TAG 17:2–20:5–22:6 | 275.89 | 196.08 | 176.57 | 232.30 | 591.30 |
| 199 | TAG 59:8; TAG 18:1–19:1–22:6 | 756.99 | 420.83 | 141.48 | 524.42 | 609.72 |
| 200 | TAG 60:1; TAG 18:0–24:0–18:1 | 64.53 | 15.79 | 4.00 | 10.49 | 3.35 |
| 201 | TAG 60:12; TAG 16:0–22:6–22:6 | 32,368.12 | 20,252.57 | 15,274.98 | 16,825.77 | 26,280.06 |
| 202 | TAG 60:14; TAG 18:3–20:5–22:6 | 720.74 | 506.00 | 403.96 | 558.30 | 1380.37 |
| 203 | TAG 60:15; TAG 18:4–20:5–22:6 | 440.17 | 349.36 | 275.19 | 339.00 | 974.30 |
| 204 | TAG 60:16; TAG 16:4–22:6–22:6 | 30.95 | 27.57 | 26.66 | 33.00 | 107.17 |
| 205 | TAG 60:2; TAG 16:0–18:1–26:1 | 210.54 | 52.11 | 9.86 | 42.60 | 14.43 |
| 206 | TAG 60:3; TAG 18:1–18:1–24:1 | 161.87 | 53.45 | 14.23 | 55.31 | 30.67 |
| 207 | TAG 60:6; TAG 16:0–22:0–22:6 | 1778.39 | 557.32 | 121.70 | 262.37 | 110.80 |
| 208 | TAG 60:8; TAG 18:1–20:1–22:6 | 2034.68 | 1015.92 | 367.64 | 1177.28 | 1123.11 |
| 209 | TAG 61:14; TAG 17:2–22:6–22:6 | 296.12 | 225.53 | 254.44 | 286.81 | 795.73 |
| 210 | TAG 61:15; TAG 20:5–20:5–21:5 | 27.26 | 22.33 | 28.14 | 16.53 | 105.81 |
| 211 | TAG 61:16; TAG 19:5–20:5–22:6 | 13.75 | 16.23 | 10.37 | 11.45 | 33.84 |
| 212 | TAG 62:1; TAG 16:0–22:0–24:1 | 13.79 | 4.77 | 3.77 | 2.83 | 1.20 |
| 213 | TAG 62:13; TAG 18:1–22:6–22:6 | 9988.21 | 7303.93 | 6706.18 | 9792.43 | 20,030.62 |
| 214 | TAG 62:16; TAG 20:5–20:5–22:6 | 1432.25 | 1074.75 | 909.81 | 1098.48 | 3579.97 |
| 215 | TAG 62:6; TAG 16:0–24:0–22:6 | 918.32 | 250.03 | 71.31 | 149.45 | 65.83 |
| 216 | TAG 62:8; TAG 18:1–22:1–22:6 | 963.28 | 405.18 | 118.21 | 376.57 | 314.10 |
| 217 | TAG 63:13; TAG 19:1–22:6–22:6 | 215.93 | 177.08 | 142.80 | 199.15 | 373.42 |
| 218 | TAG 63:16; TAG 20:5–21:5–22:6 | 60.25 | 58.39 | 56.25 | 56.81 | 194.69 |
| 219 | TAG 63:8; TAG 17:1–24:1–22:6 | 182.90 | 74.56 | 25.59 | 83.02 | 54.52 |
| 220 | TAG 64:13; TAG 20:1–22:6–22:6 | 688.32 | 546.05 | 463.50 | 656.28 | 1070.28 |
| 221 | TAG 64:14; TAG 20:2–22:6–22:6 | 271.53 | 154.26 | 177.03 | 203.52 | 366.76 |
| 222 | TAG 64:16; TAG 20:4–22:6–22:6 | 1275.00 | 1169.85 | 1275.64 | 1359.68 | 5210.51 |
| 223 | TAG 64:17; TAG 20:5–22:6–22:6 | 2502.17 | 2126.66 | 2061.56 | 2254.17 | 8625.88 |
| 224 | TAG 64:6; TAG 18:0–24:0–22:6 | 159.58 | 52.76 | 16.15 | 31.74 | 17.58 |
| 225 | TAG 64:9; TAG 18:1–24:2–22:6 | 198.84 | 105.08 | 40.08 | 98.33 | 77.03 |
| 226 | TAG 65:12; TAG 21:0–22:6–22:6 | 73.03 | 39.23 | 29.22 | 23.18 | 28.92 |
| 227 | TAG 65:17; TAG 21:5–22:6–22:6 | 62.58 | 57.91 | 66.92 | 61.74 | 246.85 |
| 228 | TAG 66:12; TAG 24:1–20:5–22:6 | 290.05 | 211.80 | 141.48 | 217.40 | 287.21 |
| 229 | TAG 66:18; TAG 22:6–22:6–22:6 | 1394.71 | 1374.35 | 1716.92 | 1866.91 | 9604.45 |
| 230 | TAG O-47:1; TAG O-17:0–14:0–16:1 | 64.26 | 25.58 | 8.49 | 16.30 | 6.54 |
| 231 | TAG O-49:3; TAG O-15:0–16:0–18:3 | 65.96 | 23.33 | 8.00 | 22.19 | 12.64 |
| 232 | TAG O-49:4; TAG O-15:0–16:1–18:3 | 46.79 | 19.10 | 8.46 | 13.86 | 8.12 |
| 233 | TAG O-51:0; TAG O-19:0–16:0–16:0 | 36.39 | 20.33 | 7.44 | 7.64 | 3.69 |
| 234 | TAG O-51:6; TAG O-15:0–14:0–22:6 | 89.92 | 46.29 | 25.42 | 43.59 | 31.91 |
| 235 | TAG O-53:2; TAG O-17:0–18:1–18:1 | 221.70 | 87.80 | 29.96 | 81.23 | 57.17 |
| 236 | TAG O-53:8; TAG O-15:0–16:2–22:6 | 64.22 | 23.73 | 14.06 | 25.65 | 25.34 |
| 237 | TAG O-54:3; TAG O-18:1–18:1–18:1 | 97.14 | 35.22 | 9.11 | 49.46 | 35.56 |
| 238 | TAG O-55:5; TAG O-17:0–16:0–22:5 | 502.38 | 263.82 | 106.03 | 208.61 | 150.81 |
| 239 | TAG O-57:7; TAG O-17:0–18:1–22:6 | 1150.46 | 712.15 | 244.95 | 694.66 | 552.02 |
| 240 | TAG O-61:12; TAG O-17:0–22:6–22:6 | 1529.10 | 1071.69 | 708.75 | 987.05 | 1475.27 |
| 241 | MAG 14:1 | 0.78 | 3.56 | 3.49 | 1.98 | 2.49 |
| 242 | MAG 16:0 | 127.53 | 997.54 | 199.96 | 179.46 | 532.42 |
| 243 | MAG 18:0 | 277.94 | 545.64 | 283.62 | 226.69 | 171.56 |
| 244 | MAG 20:4 | 0.00 | 4228.83 | 646.32 | 1196.14 | 763.06 |
| 245 | MAG 20:5 | 11.28 | 11,143.98 | 1604.80 | 3154.08 | 2149.15 |
| 246 | MAG 22:5 | 0.00 | 10,449.60 | 3095.61 | 1905.45 | 1082.52 |
| 247 | MAG 22:6 | 4.88 | 101,998.89 | 40,898.48 | 16,129.83 | 10,331.57 |
| TAG | 478,220.42 | 201,130.27 | 97,880.59 | 176,850.18 | 185,560.95 | |
| DAG | 15,174.52 | 614,859.76 | 571,876.83 | 336,213.70 | 720,765.00 | |
| MAG | 422.41 | 129,368.04 | 46,732.27 | 22,793.64 | 15,032.77 | |
References
- Ishihara, T.; Yoshida, M.; Arita, M. Omega-3 fatty acid-derived mediators that control inflammation and tissue homeostasis. Int. Immunol. 2019, 31, 559–567. [Google Scholar] [CrossRef] [PubMed]
- Li, N.; Wu, X.T.; Zhuang, W.; Xia, L.; Chen, Y.; Wu, C.C.; Rao, Z.Y.; Du, L.; Zhao, R.; Yi, M.S.; et al. Fish consumption and multiple health outcomes: Umbrella review. Trends Food Sci. Technol. 2020, 99, 273–283. [Google Scholar] [CrossRef]
- O’Keefe, E.L.; Harris, W.S.; DiNicolantonio, J.J.; Elagizi, A.; Milani, R.V.; Lavie, C.J.; O’Keefe, J.H. Sea Change for Marine Omega-3s: Randomized Trials Show Fish Oil Reduces Cardiovascular Events. Mayo Clin. Proc. 2019, 94, 2524–2533. [Google Scholar] [CrossRef] [PubMed]
- Saoudi, M.; Ben Hmida, I.; Kammoun, W.; Ben Rebah, F.; Jamoussi, K.; El Feki, A. Protective effects of oil of Sardinella pilchardis against subacute chlorpyrifos-induced oxidative stress in female rats. Arch. Environ. Occup. H 2018, 73, 128–135. [Google Scholar] [CrossRef]
- Ahmmed, M.K.; Ahmmed, F.; Tian, H.; Carne, A.; Bekhit, A.E. Marine omega-3 (n-3) phospholipids: A comprehensive review of their properties, sources, bioavailability, and relation to brain health. Compr. Rev. Food Sci. F 2020, 19, 64–123. [Google Scholar] [CrossRef]
- Torrinhas, R.S.; Calder, P.C.; Lemos, G.O.; Waitzberg, D.L. Parenteral fish oil: An adjuvant pharmacotherapy for coronavirus disease 2019? Nutrition 2021, 81, 110900. [Google Scholar] [CrossRef]
- Djuricic, I.; Calder, P.C. Beneficial Outcomes of Omega-6 and Omega-3 Polyunsaturated Fatty Acids on Human Health: An Update for 2021. Nutrients 2021, 13, 2421. [Google Scholar] [CrossRef]
- Xiao, B.P.; Li, Y.Y.; Lin, Y.Q.; Lin, J.Y.; Zhang, L.Y.; Wu, D.R.; Zeng, J.; Li, J.; Liu, J.W.; Li, G.L. Eicosapentaenoic acid (EPA) exhibits antioxidant activity via mitochondrial modulation. Food Chem. 2022, 373, 131389. [Google Scholar] [CrossRef]
- Ghasemi Fard, S.; Wang, F.L.; Sinclair, A.J.; Elliott, G.; Turchini, G.M. How does high DHA fish oil affect health? A systematic review of evidence. Crit. Rev. Food Sci. 2019, 59, 1684–1727. [Google Scholar] [CrossRef]
- Souza, L.T.D.; Moreno-Perez, S.; Lorente, G.F.; Cipolatti, E.P.; de Oliveira, D.; Resende, R.R.; Pessela, B.C. Immobilization of Moniliella spathulata R25L270 Lipase on Ionic, Hydrophobic and Covalent Supports: Functional Properties and Hydrolysis of Sardine Oil. Molecules 2017, 22, 1508. [Google Scholar] [CrossRef]
- Zhang, M.; Lu, W.B.; Yang, H.C.; Zheng, P.A.; Xie, H.J.; Chen, K.; Xue, J.; Shen, Q. Lipidomics study on the molecular changes of eicosapentaenoic and docosahexaenoic acyl structured glycerides during enzyme-catalysis and chemocatalysis. Lwt-Food Sci. Technol. 2021, 148, 111815. [Google Scholar] [CrossRef]
- Castejon, N.; Senorans, F.J. Enzymatic modification to produce health-promoting lipids from fish oil, algae and other new omega-3 sources: A review. New Biotechnol. 2020, 57, 45–54. [Google Scholar] [CrossRef] [PubMed]
- Martinez-Galan, J.P.; Ontibon-Echeverri, C.M.; Costa, M.C.; Batista-Duharte, A.; Batista, V.G.; Mesa, V.; Monti, R.; de Paula, A.V.; Baviera, A.M. Enzymatic synthesis of capric acid-rich structured lipids and their effects on mice with high-fat diet-induced obesity. Food Res. Int. 2021, 148, 110602. [Google Scholar] [CrossRef] [PubMed]
- Chen, Y.; Cheong, L.Z.; Zhao, J.H.; Panpipat, W.; Wang, Z.P.; Li, Y.; Lu, C.Y.; Zhou, J.; Su, X.R. Lipase-catalyzed selective enrichment of omega-3 polyunsaturated fatty acids in acylglycerols of cod liver and linseed oils: Modeling the binding affinity of lipases and fatty acids. Int. J. Biol. Macromol. 2019, 123, 261–268. [Google Scholar] [CrossRef]
- Xia, Q.Y.; Akanb, T.O.; Li, R.; Wang, B.; Yang, W.R.; Barrow, C.J. Lipase-catalysed synthesis of palm oil-omega-3 structured lipids. Food Funct. 2019, 10, 3142–3149. [Google Scholar] [CrossRef]
- Akanbi, T.O.; Adcock, J.L.; Barrow, C.J. Selective concentration of EPA and DHA using Thermomyces lanuginosus lipase is due to fatty acid selectivity and not regioselectivity. Food Chem. 2013, 138, 615–620. [Google Scholar] [CrossRef]
- Akanbi, T.O.; Barrow, C.J. Candida antarctica lipase A effectively concentrates DHA from fish and thraustochytrid oils. Food Chem. 2017, 229, 509–516. [Google Scholar] [CrossRef]
- Xia, Q.Y.; Akanbi, T.O.; Wang, B.; Li, R.; Liu, S.C.; Barrow, C.J. Investigation of enhanced oxidation stability of microencapsulated enzymatically produced tuna oil concentrates using complex coacervation. Food Funct. 2020, 11, 10748–10757. [Google Scholar] [CrossRef]
- Feng, J.; Cai, H.; Wang, H.; Li, C.Y.; Liu, S.B. Improved oxidative stability of fish oil emulsion by grafted ovalbumin-catechin conjugates. Food Chem. 2018, 241, 60–69. [Google Scholar] [CrossRef]
- Xia, Q.Y.; Wang, B.; Akanbi, T.O.; Li, R.; Yang, W.R.; Adhikari, B.; Barrow, C.J. Microencapsulation of lipase produced omega-3 concentrates resulted in complex coacervates with unexpectedly high oxidative stability. J. Funct. Foods 2017, 35, 499–506. [Google Scholar] [CrossRef]
- Wu, B.F.; Xie, Y.; Xu, S.L.; Lv, X.; Yin, H.Q.; Xiang, J.Q.; Chen, H.; Wei, F. Comprehensive Lipidomics Analysis Reveals the Effects of Different Omega-3 Polyunsaturated Fatty Acid-Rich Diets on Egg Yolk Lipids. J. Agric. Food Chem. 2020, 68, 15048–15060. [Google Scholar] [CrossRef] [PubMed]
- Engelmann, J.I.; Silva, P.P.; Igansi, A.V.; Pohndorf, R.S.; Cadaval, T.R.S.; Crexi, V.T.; Pinto, L.A.A. Structured lipids by swine lard interesterification with oil and esters from common carp viscera. J. Food Process Eng. 2018, 41, e12679. [Google Scholar] [CrossRef]
- Li, X.; Cao, J.; Bai, X.P.; Zhang, F.F. Chemical composition and thermal properties of Tilapia oil extracted by different methods. Int. J. Food Prop. 2018, 21, 1575–1585. [Google Scholar] [CrossRef]
- Yang, Z.Z.; Jin, W.H.; Cheng, X.Y.; Dong, Z.; Chang, M.; Wang, X.S. Enzymatic enrichment of n-3 polyunsaturated fatty acid glycerides by selective hydrolysis. Food Chem. 2021, 346, 128743. [Google Scholar] [CrossRef] [PubMed]
- Kahveci, D.; Xu, X.B. Repeated hydrolysis process is effective for enrichment of omega 3 polyunsaturated fatty acids in salmon oil by Candida rugosa lipase. Food Chem. 2011, 129, 1552–1558. [Google Scholar] [CrossRef]
- Yoshinaga, K.; Mizuno, Y.; Senarath, S.; Yoshinaga-Kiriake, A.; Nagai, T.; Beppu, F.; Tanaka, S.; Gotoh, N. Simultaneous Treatment of Long-chain Monounsaturated Fatty Acid and n-3 Polyunsaturated Fatty Acid Decreases Lipid and Cholesterol Levels in HepG2 Cell. J. Oleo Sci. 2021, 70, 731–736. [Google Scholar] [CrossRef] [PubMed]
- Gao, K.P.; Chu, W.Q.; Sun, J.A.; Mao, X.Z. Identification of an alkaline lipase capable of better enrichment of EPA than DHA due to fatty acids selectivity and regioselectivity. Food Chem. 2020, 330, 127225. [Google Scholar] [CrossRef]
- Kim, N.H.; Kim, H.; Choi, N.; Kim, Y.; Kim, B.H.; Kim, I.H. Production of stearidonic acid-rich triacylglycerol via a two-step enzymatic esterification. Food Chem. 2019, 270, 332–337. [Google Scholar] [CrossRef]
- Zarai, Z.; Eddehech, A.; Rigano, F.; Oteri, M.; Micalizzi, G.; Dugo, P.; Mondello, L.; Cacciola, F. Characterization of monoacylglycerols and diacylglycerols rich in polyunsaturated fatty acids produced by hydrolysis of Musteleus mustelus liver oil catalyzed by an immobilized bacterial lipase. J. Chromatogr. A 2020, 1613, 460692. [Google Scholar] [CrossRef]
- Ding, N.; Xue, Y.; Tang, X.; Sun, Z.M.; Yanagita, T.; Xue, C.H.; Wang, Y.M. Short-term Effects of Different Fish Oil Formulations on Tissue Absorption of Docosahexaenoic Acid in Mice Fed High- and Low-Fat Diets. J. Oleo Sci. 2013, 62, 883–891. [Google Scholar] [CrossRef]
- Zhang, Y.C.; Sun, Q.X.; Liu, S.C.; Wei, S.; Xia, Q.Y.; Ji, H.W.; Deng, C.J.; Hao, J.M. Extraction of fish oil from fish heads using ultra-high pressure pre-treatment prior to enzymatic hydrolysis. Innov. Food Sci. Emerg. 2021, 70, 102670. [Google Scholar] [CrossRef]
- Zhang, H.J.; Shen, Y.B.; Zhang, Y.W.; Li, L.R.; Wang, X.G. Regiospecific Analysis of Fatty Acids and Calculation of Triglyceride Molecular Species in Marine Fish Oils. Biomed. Res. Int. 2018, 2018, 9016840. [Google Scholar] [CrossRef] [PubMed]
- Morales-Medina, R.; Munio, M.; Guadix, A.; Guadix, E.M.; Camacho, F. A lumped model of the lipase catalyzed hydrolysis of sardine oil to maximize polyunsaturated fatty acids content in acylglycerols. Food Chem. 2018, 240, 286–294. [Google Scholar] [CrossRef]
- Simsek, E.B.; Saloglu, D. Exploring the structural and catalytic features of lipase enzymes immobilized on g-C3N4: A novel platform for biocatalytic and photocatalytic reactions. J. Mol. Liq. 2021, 337, 116612. [Google Scholar] [CrossRef]
- Lyberg, A.M.; Adlercreutz, P. Lipase-catalysed enrichment of DHA and EPA in acylglycerols resulting from squid oil ethanolysis. Eur. J. Lipid Sci. Technol. 2008, 110, 317–324. [Google Scholar] [CrossRef]
- Marin-Suarez, M.; Morales-Medina, R.; Guadix, E.M.; Guadix, A. A Simple Enzymatic Process to Produce Functional Lipids From Vegetable and Fish Oil Mixtures. Eur. J. Lipid Sci. Technol. 2017, 119, 1700233. [Google Scholar] [CrossRef]
- Wang, X.M.; Li, D.M.; Qu, M.; Durrani, R.; Yang, B.; Wang, Y.H. Immobilized MAS1 lipase showed high esterification activity in the production of triacylglycerols with n-3 polyunsaturated fatty acids. Food Chem. 2017, 216, 260–267. [Google Scholar] [CrossRef]
- Jiang, L.; Huang, H.; Lei, M.L.; Zheng, H.B.; Liang, J.R.; Zhang, H.M. Estimation of Docosahexaenoic Acid Glycerides in Schizochytrium sp Oil by Open Column Chromatography and Reversed-phase HPLC. J. Am. Oil Chem. Soc. 2013, 90, 1213–1221. [Google Scholar] [CrossRef]
- Tengku-Rozaina, T.M.; Birch, E.J. Positional distribution of fatty acids on hoki and tuna oil triglycerides by pancreatic lipase and 13C NMR analysis. Eur. J. Lipid Sci. Technol. 2014, 116, 272–281. [Google Scholar] [CrossRef]
- Monteiro, R.R.C.; Virgen-Ortiz, J.J.; Berenguer-Murcia, A.; da Rocha, T.N.; dos Santos, J.C.S.; Alcantara, A.R.; Fernandez-Lafuente, R. Biotechnological relevance of the lipase A from Candida antarctica. Catal. Today 2021, 362, 141–154. [Google Scholar] [CrossRef]


| Resource Before Hydrolysis | Sample After Hydrolysis | Lipase for Hydrolysis | HD |
|---|---|---|---|
| Tuna oil | TL 100 L-30% | TL 100 L | 30% |
| TL 100 L-60% | TL 100 L | 60% | |
| ADL-30% | ADL | 30% | |
| ADL-60% | ADL | 60% |
| No. | Wavelength | Infrared Spectrum |
|---|---|---|
| Peak 1 | 3600–3400 cm−1 | -OH |
| Peak 2 | 3100–3000 cm−1 | C=C |
| Peak 3 | 3000–2900 cm−1 | -CH2- |
| Peak 4 | 2900–2800 cm−1 | -CH2- |
| Peak 5 | 1800–1700 cm−1 | C=O |
| Peak 6 | 1500–1400 cm−1 | -CH2- |
| Peak 7 | 1200–1100 cm−1 | -C-O-C- |
| Peak 8 | near 725 cm−1 | -CH2- |
| Fatty Acids | Normalized Percentage/% | ||||
|---|---|---|---|---|---|
| Tuna Oil | TL 100 L-30% | TL 100 L-60% | ADL-30% | ADL-60% | |
| C14:0 | 4.34 ± 0.21 a | 3.57 ± 0.11 a | 2.70 ± 0.18 b | 2.48 ± 0.14 bc | 1.75 ± 0.42 c |
| C14:1 | 0.44 ± 0.33 a | 0.23 ± 0.05 a | 0.27 ± 0.22 a | 0.15 ± 0.07 a | 0.29 ± 0.17 a |
| C15:0 | 1.17 ± 0.07 a | 1.01 ± 0.13 a | 0.89 ± 0.16 ab | 0.78 ± 0.10 ab | 0.53 ± 0.12 b |
| C16:0 | 20.88 ± 0.53 a | 17.19 ± 0.09 b | 14.17 ± 0.53 c | 13.05 ± 0.35 c | 8.90 ± 1.39 d |
| C16:1 n7 | 5.41 ± 0.12 a | 4.41 ± 0.22 ab | 3.65 ± 0.39 b | 5.48 ± 0.36 a | 4.10 ± 0.45 b |
| C17:0 | 1.47 ± 0.11 a | 1.00 ± 0.11 b | 0.98 ± 0.07 b | 1.01 ± 0.11 b | 0.84 ± 0.11 b |
| C17:1 | 0.64 ± 0.12 a | 0.60 ± 0.08 a | 0.59 ± 0.11 a | 0.76 ± 0.10 a | 0.63 ± 0.20 a |
| C18:0 | 5.82 ± 0.01 a | 4.47 ± 0.24 b | 3.36 ± 0.21 c | 3.71 ± 0.08 bc | 2.29 ± 0.47 d |
| C18:1 n9 | 15.39 ± 0.26 ab | 12.87 ± 0.59 bc | 10.92 ± 1.21 c | 17.73 ± 0.65 a | 14.93 ± 1.17 ab |
| C18:2 n6 | 1.51 ± 0.03 a | 1.21 ± 0.01 b | 1.15 ± 0.05 b | 1.69 ± 0.03 a | 1.56 ± 0.16 a |
| C18:3 n6 | 0.28 ± 0.13 a | 0.22 ± 0.14 a | 0.21 ± 0.05 a | 0.20 ± 0.09 a | 0.28 ± 0.10 a |
| C18:3 n3 | 0.45 ± 0.11 a | 0.43 ± 0.11 a | 0.33 ± 0.08 a | 0.56 ± 0.04 a | 0.45 ± 0.13 a |
| C20:0 | 0.29 ± 0.14 a | 0.25 ± 0.06 a | 0.45 ± 0.52 a | 0.49 ± 0.35 a | 0.54 ± 0.43 a |
| C20:1 | 1.09 ± 0.22 ab | 0.97 ± 0.12 ab | 0.72 ± 0.16 b | 1.25 ± 0.11 a | 0.86 ± 0.09 ab |
| C20:2 n6 | 0.35 ± 0.11 a | 0.26 ± 0.07 a | 0.27 ± 0.11 a | 0.22 ± 0.06 a | 0.23 ± 0.06 a |
| C20:4 n6 | 2.72 ± 0.49 ab | 2.56 ± 0.11 b | 2.15 ± 0.17 b | 2.88 ± 0.02 ab | 3.52 ± 0.19 a |
| C20:3 n3 | 0.36 ± 0.17 a | 0.20 ± 0.08 a | 0.29 ± 0.27 a | 0.20 ± 0.03 a | 0.19 ± 0.08 a |
| C20:5 n3 | 7.14 ± 0.04 cd | 7.83 ± 0.34 bc | 6.36 ± 0.79 d | 8.82 ± 0.15 b | 10.61 ± 0.41 a |
| C22:0 | 0.31 ± 0.03 a | 0.21 ± 0.08 a | 0.36 ± 0.15 a | 0.32 ± 0.14 a | 0.30 ± 0.17 a |
| C24:0 | 0.27 ± 0.07 a | 0.18 ± 0.01 a | 0.31 ± 0.08 a | 0.24 ± 0.01 a | 0.28 ± 0.06 a |
| C22:5 n3 | 2.10 ± 0.10 b | 2.54 ± 0.14 b | 3.25 ± 0.02 a | 2.40 ± 0.09 b | 3.11 ± 0.25 a |
| C22:6 n3 | 27.14 ± 0.11 c | 37.21 ± 0.48 b | 45.88 ± 2.40 a | 34.75 ± 0.15 b | 42.89 ± 1.95 a |
| C24:1 | 0.43 ± 0.13 a | 0.59 ± 0.07 a | 0.75 ± 0.52 a | 0.80 ± 0.75 a | 0.93 ± 0.81 a |
| SFA | 34.55 ± 1.16 a | 27.87 ± 0.84 b | 23.20 ± 1.90 c | 22.09 ± 1.28 c | 15.43 ± 3.17 d |
| MUFA | 23.39 ± 1.19 ab | 19.67 ± 1.13 cd | 16.90 ± 2.61 d | 26.17 ± 2.04 a | 21.73 ± 2.89 bc |
| PUFA | 42.06 ± 1.30 c | 52.46 ± 1.47 b | 59.90 ± 3.95 a | 51.74 ± 0.66 b | 62.84 ± 3.32 a |
| EPA + DHA | 34.28 ± 0.15 c | 45.04 ± 0.82 b | 52.24 ± 3.19 a | 43.58 ± 0.30 b | 53.50 ± 2.37 a |
Publisher’s Note: MDPI stays neutral with regard to jurisdictional claims in published maps and institutional affiliations. |
© 2022 by the authors. Licensee MDPI, Basel, Switzerland. This article is an open access article distributed under the terms and conditions of the Creative Commons Attribution (CC BY) license (https://creativecommons.org/licenses/by/4.0/).
Share and Cite
Xuan, J.; Wang, Z.; Xia, Q.; Luo, T.; Mao, Q.; Sun, Q.; Han, Z.; Liu, Y.; Wei, S.; Liu, S. Comparative Lipidomics Profiling of Acylglycerol from Tuna Oil Selectively Hydrolyzed by Thermomyces Lanuginosus Lipase and Candida Antarctica Lipase A. Foods 2022, 11, 3664. https://doi.org/10.3390/foods11223664
Xuan J, Wang Z, Xia Q, Luo T, Mao Q, Sun Q, Han Z, Liu Y, Wei S, Liu S. Comparative Lipidomics Profiling of Acylglycerol from Tuna Oil Selectively Hydrolyzed by Thermomyces Lanuginosus Lipase and Candida Antarctica Lipase A. Foods. 2022; 11(22):3664. https://doi.org/10.3390/foods11223664
Chicago/Turabian StyleXuan, Junyong, Zefu Wang, Qiuyu Xia, Tingyu Luo, Qingya Mao, Qinxiu Sun, Zongyuan Han, Yang Liu, Shuai Wei, and Shucheng Liu. 2022. "Comparative Lipidomics Profiling of Acylglycerol from Tuna Oil Selectively Hydrolyzed by Thermomyces Lanuginosus Lipase and Candida Antarctica Lipase A" Foods 11, no. 22: 3664. https://doi.org/10.3390/foods11223664
APA StyleXuan, J., Wang, Z., Xia, Q., Luo, T., Mao, Q., Sun, Q., Han, Z., Liu, Y., Wei, S., & Liu, S. (2022). Comparative Lipidomics Profiling of Acylglycerol from Tuna Oil Selectively Hydrolyzed by Thermomyces Lanuginosus Lipase and Candida Antarctica Lipase A. Foods, 11(22), 3664. https://doi.org/10.3390/foods11223664