
How Much Did Internet Use Promote Grain Production?—Evidence from a Survey of 1242 Farmers in 13 Provinces in China

Abstract
:1. Introduction
2. Theoretical Model
2.1. Theoretical Analysis
2.2. Propensity Score Matching
3. Data and Variable Selection
3.1. Data
3.2. Variable Selection
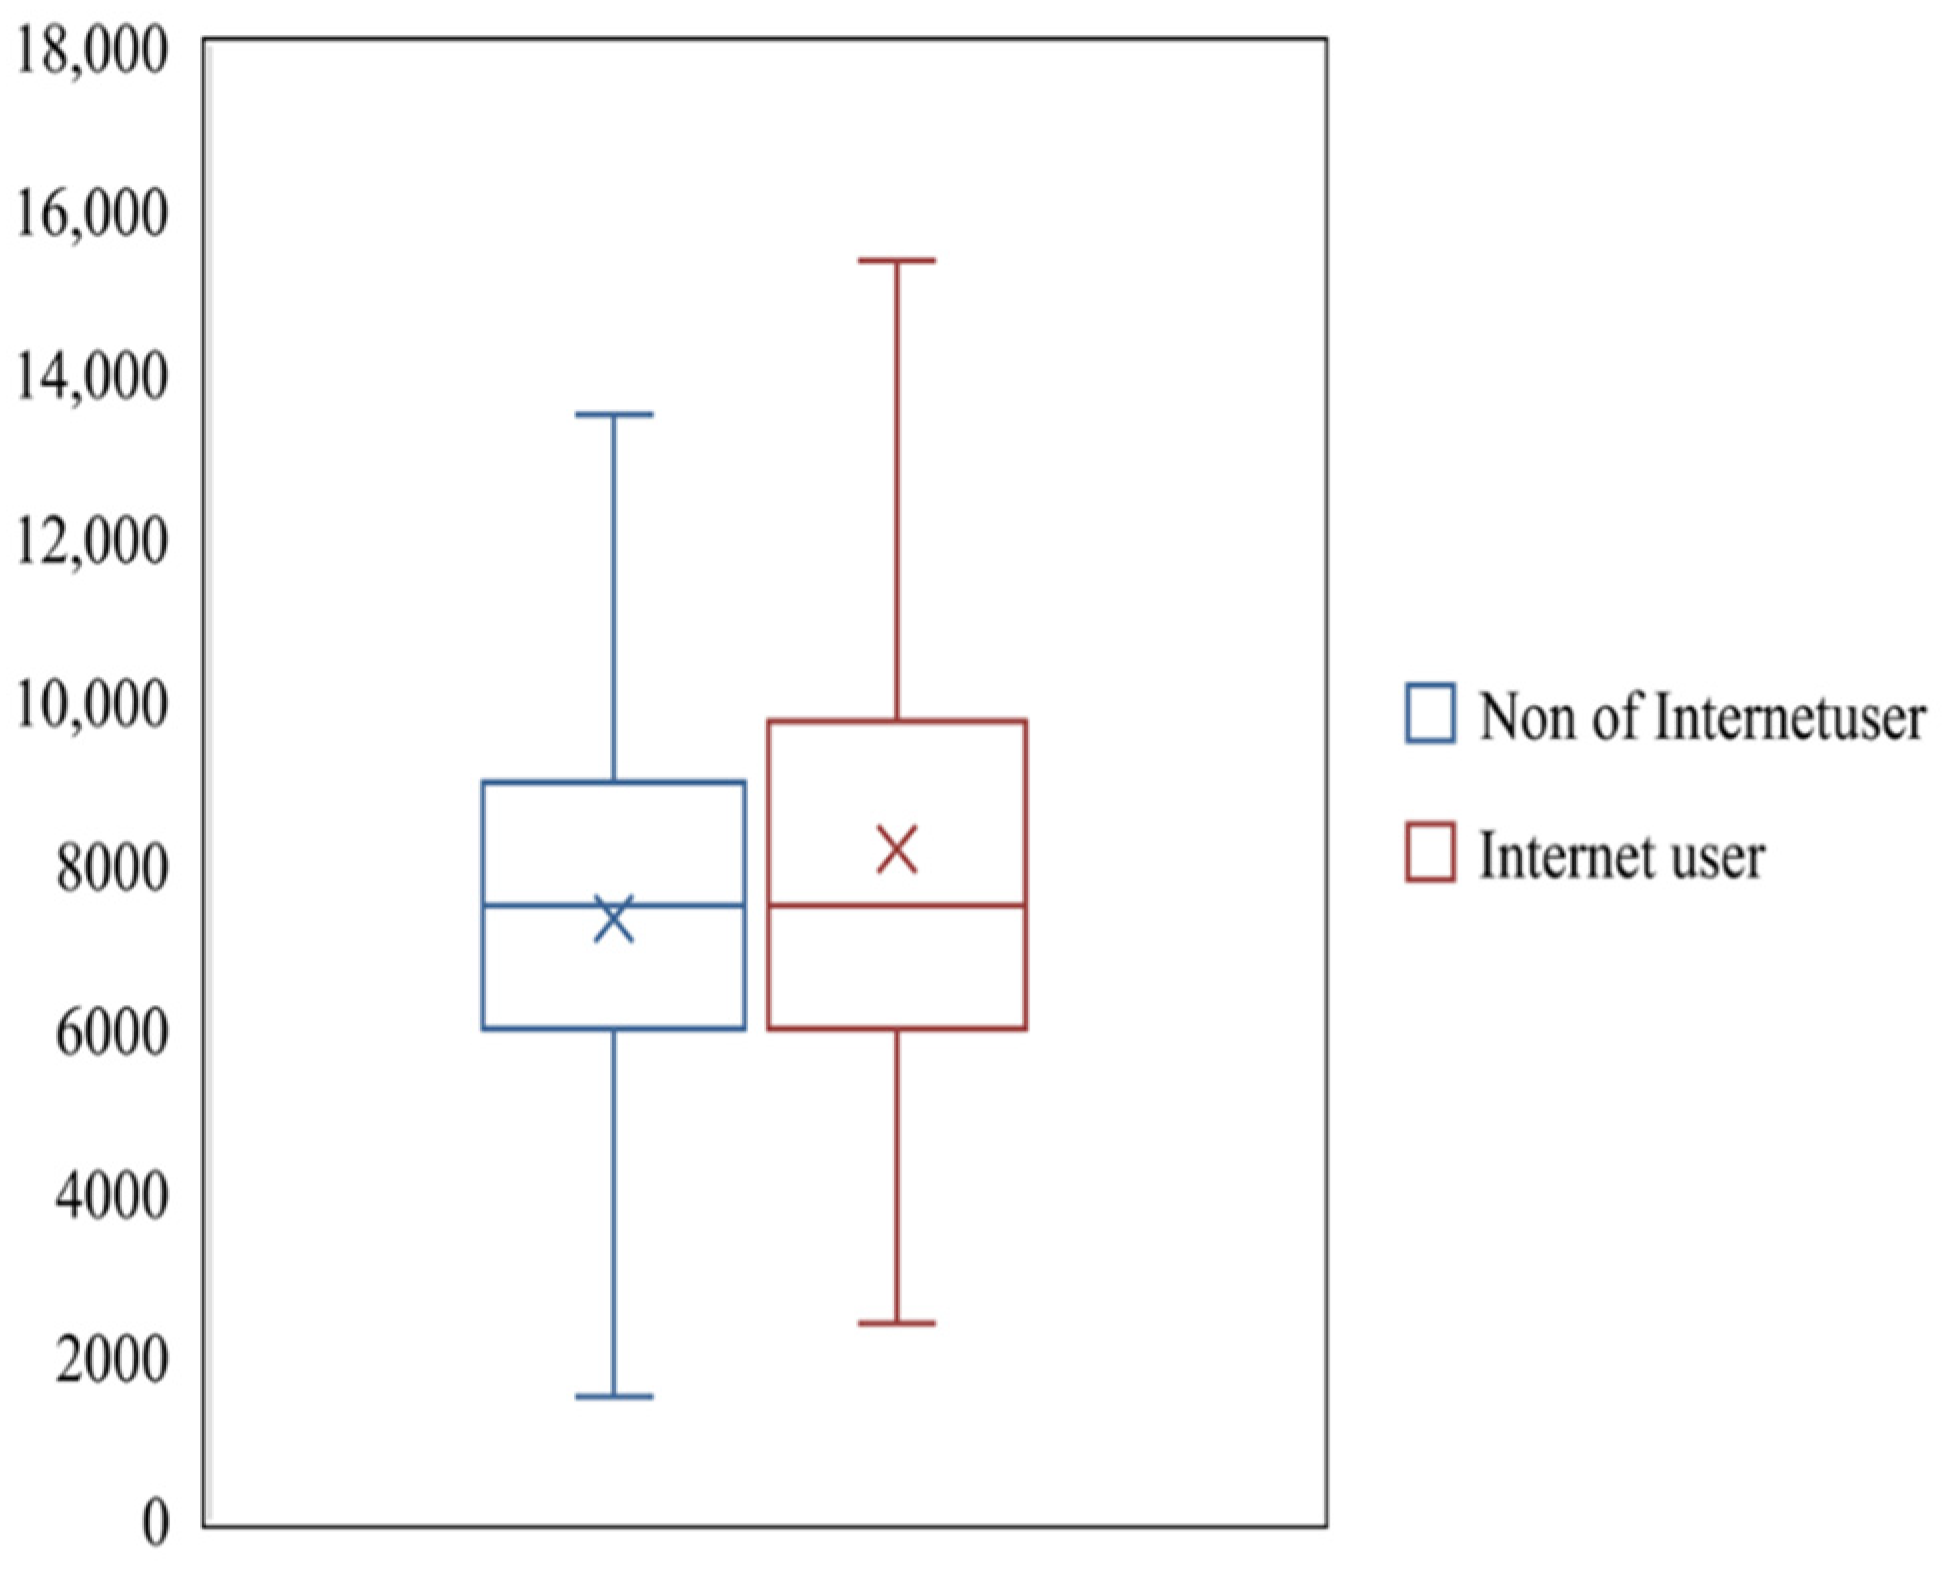
4. The Impact of Internet Use on Grain Production
4.1. Regression Results of Linear Regression Model
4.2. Propensity Score Matching Results
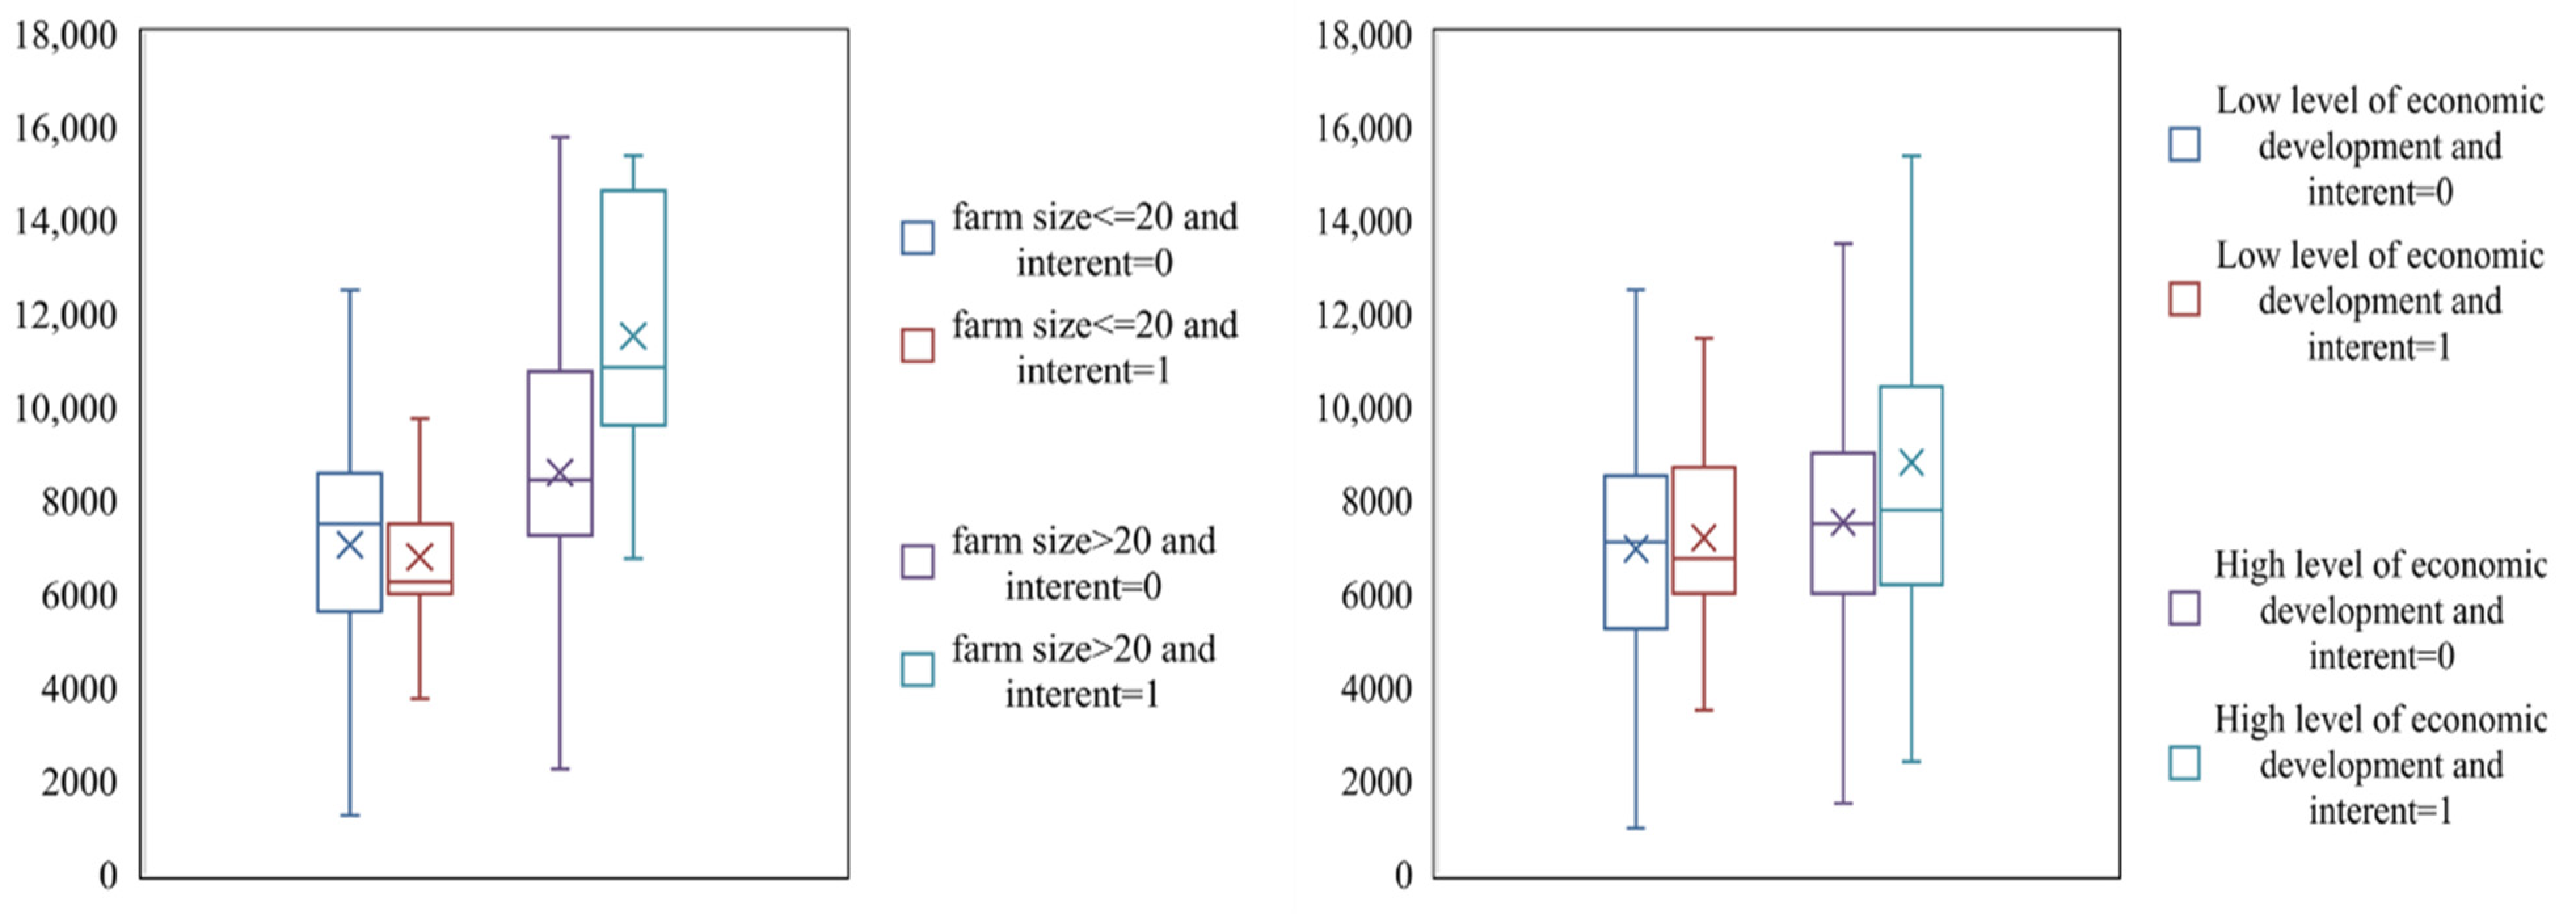
5. Heterogeneity Analysis
6. Research Conclusions and Policy Implications
Author Contributions
Funding
Data Availability Statement
Acknowledgments
Conflicts of Interest
References
- Xu, Z.; Zhang, W.; Li, M. China’s grain production. Mon. Rev. 2014, 66, 25–37. [Google Scholar] [CrossRef]
- Qiao, F. Increasing wage, mechanization, and agriculture production in China. China Econ. Rev. 2017, 46, 249–260. [Google Scholar] [CrossRef]
- Ge, D.; Long, H.; Zhang, Y.; Tu, S. Analysis of the coupled relationship between grain yields and agricultural labor changes in China. J. Geogr. Sci. 2018, 28, 93–108. [Google Scholar] [CrossRef] [Green Version]
- Abate, M.C.; Kuang, Y.P. The impact of the supply of farmland, level of agricultural mechanisation, and supply of rural labour on grain yields in China. Stud. Agric. Econ. 2021, 123, 33–42. [Google Scholar]
- Xu, X.P.; Ping, H.; Chuan, L.M.; Liu, X.Y.; Liu, Y.X.; Zhang, J.J.; Huang, X.M.; Qiu, S.J.; Zhao, S.C.; Wei, Z. Regional distribution of wheat yield and chemical fertilizer requirements in China. J. Integr. Agric. 2021, 20, 2772–2780. [Google Scholar] [CrossRef]
- Otsuka, K.; Liu, Y.; Yamauchi, F. The future of small farms in Asia. Dev. Policy Rev. 2016, 34, 441–461. [Google Scholar] [CrossRef]
- Qiu, T.; Choy, S.B.; Li, S.; He, Q.; Luo, B. Does land renting-in reduce grain production? Evidence from rural China. Land Use Policy 2020, 90, 104311. [Google Scholar] [CrossRef]
- Jin, S.; Huang, J.; Hu, R.; Rozelle, S. The creation and spread of technology and total factor productivity in China’s agriculture. Am. J. Agric. Econ. 2002, 84, 916–930. [Google Scholar] [CrossRef]
- Liu, Z.; Huang, F.; Li, B. Analysis on characteristics and influential factors of grain yield fluctuation in China based on empirical mode decomposition. Trans. Chin. Soc. Agric. Eng. 2015, 31, 7–13. [Google Scholar]
- Yu, J.; Wu, J. The sustainability of agricultural development in China: The agriculture–environment nexus. Sustainability 2018, 10, 1776. [Google Scholar] [CrossRef] [Green Version]
- Holst, R.; Yu, X.; Grün, C. Climate change, risk and grain yields in China. J. Integr. Agric. 2013, 12, 1279–1291. [Google Scholar] [CrossRef]
- Yang, X.; Tian, Z.; Sun, L.; Chen, B.; Tubiello, F.N.; Xu, Y. The impacts of increased heat stress events on wheat yield under climate change in China. Clim. Chang. 2017, 140, 605–620. [Google Scholar] [CrossRef]
- Liu, X.; Xu, Y.; Engel, B.A.; Sun, S.; Zhao, X.; Wu, P.; Wang, Y. The impact of urbanization and aging on food security in developing countries: The view from Northwest China. J. Clean. Prod. 2021, 292, 126067. [Google Scholar] [CrossRef]
- Zhang, W.; Cao, G.; Li, X.; Zhang, H.; Wang, C.; Liu, Q.; Chen, X.; Cui, Z.; Shen, J.; Jiang, R.; et al. Closing yield gaps in China by empowering smallholder farmers. Nature 2016, 537, 671–674. [Google Scholar] [CrossRef]
- Xie, H.; Wang, B. An empirical analysis of the impact of agricultural product price fluctuations on China’s grain yield. Sustainability 2017, 9, 906. [Google Scholar] [CrossRef] [Green Version]
- Wang, Y.; Yao, X.; Zhou, M. Rural labor outflow, regional disparities and food production. Manag. World 2013, 11, 67–76. (In Chinese) [Google Scholar]
- Pan, J.; Chen, Y.; Zhang, Y.; Chen, M.; Fennell, S.; Luan, B.; Wang, F.; Meng, D.; Liu, Y.; Jiao, L.; et al. Spatial-temporal dynamics of grain yield and the potential driving factors at the county level in China. J. Clean. Prod. 2020, 255, 120312. [Google Scholar] [CrossRef]
- Liang, B.; Liu, H.; Quine, T.A.; Chen, X.; Hallett, P.D.; Cressey, E.L.; Zhu, X.; Cao, J.; Yang, S.; Wu, L.; et al. Analysing and simulating spatial patterns of crop yield in Guizhou Province based on artificial neural networks. Prog. Phys. Geogr. Earth Environ. 2021, 45, 33–52. [Google Scholar] [CrossRef]
- Yao, S.; Liu, Z.; Zhang, Z. Spatial differences of grain production efficiency in China, 1987–1992. Econ. Plan. 2001, 34, 139–157. [Google Scholar] [CrossRef]
- Li, H.R.; Mao, L.L.; Mei, X.R.; Liu, Y.E.; Hao, W.P. Analysis on Influencing Factors of Grain Production Fluctuation during the Last 30 Years in China. Chin. J. Agric. Resour. Reg. Plan. 2018, 39, 1–10. (In Chinese) [Google Scholar]
- Yu, W.; Yue, Y.; Wang, F. The spatial-temporal coupling pattern of grain yield and fertilization in the North China plain. Agric. Syst. 2022, 196, 103330. [Google Scholar] [CrossRef]
- Aker, J.C.; Ksoll, C. Can mobile phones improve agricultural outcomes? Evidence from a randomized experiment in Niger. Food Policy 2016, 60, 44–51. [Google Scholar] [CrossRef] [Green Version]
- Rahman, M.M.; Mamun, S.A.K. The effects of telephone infrastructure on farmers’ agricultural outputs in China. Inf. Econ. Policy 2017, 41, 88–95. [Google Scholar] [CrossRef]
- Donovan, K. Anytime, anywhere: Mobile devices and services and their impact on agriculture and rural development. In ICT in Agriculture (Updated Edition): Connecting Smallholders to Knowledge, Networks, and Institutions; World Bank: Washington, DC, USA, 2017. [Google Scholar]
- Stigler, G.J. The economics of information. J. Political Econ. 1961, 69, 213–225. [Google Scholar] [CrossRef]
- Aker, J.C. Does digital divide or provide? The impact of cell phones on grain markets in Niger. In Center for Global Development Working Paper No. 154; Center for Global Development: Washington, DC, USA, 2008; pp. 1–61. [Google Scholar]
- Jensen, R. The digital provide: Information (technology), market performance, and welfare in the South Indian fisheries sector. Q. J. Econ. 2007, 122, 879–924. [Google Scholar] [CrossRef]
- Tadesse, G.; Bahiigwa, G. Mobile phones and farmers’ marketing decisions in Ethiopia. World Dev. 2015, 68, 296–307. [Google Scholar] [CrossRef] [Green Version]
- Aker, J.C.; Fafchamps, M. Mobile phone coverage and producer markets: Evidence from West Africa. World Bank Econ. Rev. 2015, 29, 262–292. [Google Scholar] [CrossRef] [Green Version]
- Shimamoto, D.; Yamada, H.; Gummert, M. Mobile phones and market information: Evidence from rural Cambodia. Food Policy 2015, 57, 135–141. [Google Scholar] [CrossRef]
- Adegbola, P.; Gardebroek, C. The effect of information sources on technology adoption and modification decisions. Agric. Econ. 2007, 37, 55–65. [Google Scholar] [CrossRef]
- Aker, J.C. Information from markets near and far: Mobile phones and agricultural markets in Niger. Am. Econ. J. Appl. Econ. 2010, 2, 46–59. [Google Scholar] [CrossRef] [Green Version]
- Zheng, Y.Y.; Zhu, T.H.; Wei, J. Does Internet use promote the adoption of agricultural technology? Evidence from 1449 farm households in 14 Chinese provinces. J. Integr. Agric. 2022, 21, 282–292. [Google Scholar] [CrossRef]
- Larochelle, C.; Alwang, J.; Travis, E.; Barrera, V.H.; Dominguez Andrade, J.M. Did you really get the message? Using text reminders to stimulate adoption of agricultural technologies. J. Dev. Stud. 2019, 55, 548–564. [Google Scholar] [CrossRef] [Green Version]
- Yan, B.B.; Zhang, Q.Q.; Liu, T.J. Can Mobile Phone Use Promote the Adoption of IPM Technology by Farmers? J. Agrotech. Econ. 2020, 5, 1–14. (In Chinese) [Google Scholar]
- Mittal, S.; Tripathi, G. Role of mobile phone technology in improving small farm productivity. Agric. Econ. Res. Rev. 2009, 22, 451–460. [Google Scholar]
- Zhu, Q.B.; Bai, J.F.; Peng, C.; Zhu, C. Do Information Communication Technologies Improve Agricultural Productivity? Chin. Rural. Econ. 2019, 4, 22–40. (In Chinese) [Google Scholar]
- Ma, W.; Renwick, A.; Nie, P.; Tang, J.; Cai, R. Off-farm work, smartphone use and household income: Evidence from rural China. China Econ. Rev. 2018, 52, 80–94. [Google Scholar] [CrossRef]
- Zhou, S.D. Agriculture Production Mode Reform Promoted by Internet plus: A Marxist Political Economy Perspective. China Rural. Surv. 2016, 6, 75–85. (In Chinese) [Google Scholar]
- Fang, X.; Liu, C. Striving for IT-based Agriculture Modernization: Challenges and Strategies. J. Xinjiang Norm. Univ. 2018, 39, 68–74. (In Chinese) [Google Scholar]
- Zhang, X.W.; Meng, L.; Du, S.M.; Yin, G.W. Research on Informatization Affecting Agricultural Marketization. Issues Agric. Econ. 2019, 4, 39–45. (In Chinese) [Google Scholar]
- Genius, M.; Koundouri, P.; Nauges, C.; Tzouvelekas, V. Information transmission in irrigation technology adoption and diffusion: Social learning, extension services, and spatial effects. Am. J. Agric. Econ. 2014, 96, 328–344. [Google Scholar] [CrossRef] [Green Version]
- Ma, W.; Wang, X. Internet use, sustainable agricultural practices and rural incomes: Evidence from China. Aust. J. Agric. Resour. Econ. 2020, 64, 1087–1112. [Google Scholar] [CrossRef]
- González-Flores, M.; Bravo-Ureta, B.E.; Solís, D.; Winters, P. The impact of high value markets on smallholder productivity in the Ecuadorean Sierra: A Stochastic Production Frontier approach correcting for selectivity bias. Food Policy 2014, 44, 237–247. [Google Scholar] [CrossRef]
- Aker, J.C.; Mbiti, I.M. Mobile phones and economic development in Africa. J. Econ. Perspect. 2010, 24, 207–232. [Google Scholar] [CrossRef] [Green Version]
- Kaloxylos, A.; Wolfert, J.; Verwaart, T.; Terol, C.M.; Brewster, C.; Robbemond, R.; Sundmaker, H. The use of future internet technologies in the agriculture and food sectors: Integrating the supply chain. Procedia Technol. 2013, 8, 51–60. [Google Scholar] [CrossRef] [Green Version]
- Hou, J.; Huo, X.; Yin, R. Does computer usage change farmers’ production and consumption? Evidence from China. China Agric. Econ. Rev. 2018, 11, 387–410. [Google Scholar] [CrossRef] [Green Version]
- Camacho, A.; Conover, E. The Impact of Receiving Price and Climate Information in the Agricultural Sector; Universidad de los Andes: Bogotá, Colombia, 2010. [Google Scholar]
- Fafchamps, M.; Minten, B. Impact of SMS-based agricultural information on Indian farmers. World Bank Econ. Rev. 2012, 26, 383–414. [Google Scholar] [CrossRef]
- Peng, D.Y.; Li, Y.C.; Li, C.Q. The Influence of Internet Use on Environmental Attitude and Literacy. Financ. Econ. 2019, 8, 97–109. (In Chinese) [Google Scholar]
- Rosenbaum, P.R.; Rubin, D.B. The central role of the propensity score in observational studies for causal effects. Biometrika 1983, 70, 41–55. [Google Scholar] [CrossRef]
- Caliendo, M.; Kopeinig, S. Some practical guidance for the implementation of propensity score matching. J. Econ. Surv. 2008, 22, 31–72. [Google Scholar] [CrossRef] [Green Version]
- Abadie, A.; Imbens, G.W. Matching on the estimated propensity score. Econometrica 2016, 84, 781–807. [Google Scholar] [CrossRef]
- Ji, C.; Jin, S.; Wang, H.; Ye, C. Estimating effects of cooperative membership on farmers’ safe production behaviors: Evidence from pig sector in China. Food Policy 2019, 83, 231–245. [Google Scholar] [CrossRef]
- Nadaraya, E.A. On estimating regression. Theory Probab. Its Appl. 1964, 9, 141–142. [Google Scholar] [CrossRef]
- Watson, G.S. Smooth regression analysis. Sankhyā Indian J. Stat. Ser. A 1964, 26, 359–372. [Google Scholar]
- Fan, J. Design-adaptive Nonparametric Regression. J. Am. Stat. Assoc. 1992, 87, 998–1004. [Google Scholar] [CrossRef]
- Ma, W.; Zhu, Z. Internet use and willingness to participate in garbage classification: An investigation of Chinese residents. Appl. Econ. Lett. 2021, 28, 788–793. [Google Scholar] [CrossRef]
- Nie, P.; Ma, W.; Sousa-Poza, A. The relationship between smartphone use and subjective well-being in rural China. Electron. Commer. Res. 2021, 21, 983–1009. [Google Scholar] [CrossRef]
- Yang, X.-R.; Chen, K.Z.; Kong, X.-Z. Factors affecting the adoption of on-farm milk safety measures in Northern China—An examination from the perspective of farm size and production type. J. Integr. Agric. 2019, 18, 471–481. [Google Scholar] [CrossRef] [Green Version]
- Ma, W. Heterogeneous effects of Internet use and adoption of sustainable production practices on rural incomes: Evidence from China. In Proceedings of the 64th AARES Annual Conference, Perth, Australia, 12–14 February 2020. [Google Scholar]
- Boz, I. Effects of environmentally friendly agricultural land protection programs: Evidence from the Lake Seyfe area of Turkey. J. Integr. Agric. 2016, 15, 1903–1914. [Google Scholar] [CrossRef] [Green Version]
- Hoffmann, V.; Jones, K.M. Improving Food Safety on the Farm: Experimental Evidence from Kenya on Agricultural Incentives and Subsidies as Public Health Investments; IFPRI: Washington, DC, USA, 2018. [Google Scholar]
- Janssen, B.H. Agriculture and the nitrogen cycle, Assessing the impact of fertilizer use on food production and the environment. Geoderma 2006, 134, 233–234. [Google Scholar] [CrossRef]
- Wang, X.; Cai, D.; Hoogmoed, W.B.; Oenema, O. Regional distribution of nitrogen fertilizer use and N-saving potential for improvement of food production and nitrogen use efficiency in China. J. Sci. Food Agric. 2011, 91, 2013–2023. [Google Scholar] [CrossRef]
- Tatlıdil, F.F.; Boz, İ.; Tatlidil, H. Farmers’ perception of sustainable agriculture and its determinants: A case study in Kahramanmaras province of Turkey. Environ. Dev. Sustain. 2009, 11, 1091–1106. [Google Scholar] [CrossRef]
- Wooldridge, J.M. Introductory Econometrics: A Modern Approach; Cengage learning: Boston, MA, USA, 2015. [Google Scholar]
- Babatunde, R.O.; Qaim, M. Impact of off-farm income on food security and nutrition in Nigeria. Food Policy 2010, 35, 303–311. [Google Scholar] [CrossRef]
- Samberg, L.H.; Gerber, J.S.; Ramankutty, N.; Herrero, M.; West, P.C. Subnational distribution of average farm size and smallholder contributions to global food production. Environ. Res. Lett. 2016, 11, 124010. [Google Scholar] [CrossRef]
- Jaja, E.T.; Barber, L.I. Organic and inorganic fertilizers in food production system in Nigeria. Nature 2017, 7, e18. [Google Scholar]
- Gordon, L.J.; Finlayson, C.M.; Falkenmark, M. Managing water in agriculture for food production and other ecosystem services. Agric. Water Manag. 2010, 97, 512–519. [Google Scholar] [CrossRef]
- Davis, K.F.; Rulli, M.C.; Seveso, A.; D’Odorico, P. Increased food production and reduced water use through optimized crop distribution. Nat. Geosci. 2017, 10, 919–924. [Google Scholar] [CrossRef]
- Rosenbaum, P.R. Observational Studies; Springer: New York, NY, USA, 2002. [Google Scholar]
- Dillon, A. The effect of irrigation on poverty reduction, asset accumulation, and informal insurance: Evidence from Northern Mali. World Dev. 2011, 39, 2165–2175. [Google Scholar] [CrossRef]
- Zhou, Z.A.; Zhao, S.Y.; He, Q.H. The Impact of Aging Labor Force on Agricultural Land Transfer and Scale Management. Financ. Econ. 2020, 2, 120–132. (In Chinese) [Google Scholar]
- Mhango, W.G.; Snapp, S.S.; Phiri, G.Y. Opportunities and constraints to legume diversification for sustainable maize production on smallholder farms in Malawi. Renew. Agric. Food Syst. 2013, 28, 234–244. [Google Scholar] [CrossRef]
- Xu, Q.; Yin, R.; Zhang, H. Economies of Scale, Returns to Scale and the Problem of Optimum-scale Farm Management: An Empirical Study Based on Grain Production in China. Econ. Res. J. 2011, 3, 59–71. (In Chinese) [Google Scholar]
- Herrero, M. Global data, farm size and food and nutrition security. Transform. Lives Livelihoods Digit. Revolut. Agric. 2017, 8, 32–40. [Google Scholar]
- Bosiu, T.; Vilakazi, T. Competition and Inclusive Regional Economic Growth in Food Production: Barriers to Entry and the Role of African Multinational Corporations; World Institute for Development Economic Research (UNU-WIDER): Helsinki, Finland, 2020; pp. 103–187. [Google Scholar]


| Province | Sample Size | Percentage (%) | Cumulative Percentage (%) | Province | Sample Size | Percentage (%) | Cumulative Percentage (%) |
|---|---|---|---|---|---|---|---|
| Inner Mongolia | 176 | 14.17 | 14.17 | Henan | 199 | 16.02 | 85.99 |
| Jilin | 131 | 10.55 | 24.72 | Hubei | 39 | 3.14 | 89.13 |
| Sichuan | 125 | 10.06 | 34.78 | Hunan | 15 | 1.21 | 90.34 |
| Anhui | 11 | 0.89 | 35.67 | Gansu | 16 | 1.29 | 91.63 |
| Shandong | 257 | 20.69 | 56.36 | Liaoning | 52 | 4.19 | 95.81 |
| Jiangsu | 15 | 1.21 | 57.57 | Heilongjiang | 52 | 4.19 | 100.00 |
| Hebei | 154 | 12.40 | 69.97 | Total | 1242 | 100 | 100 |
| Variable | Variable Description | All | Internet User | Not Internet User | Difference |
|---|---|---|---|---|---|
| Maize yield per ha | kg | 7481.74 | 8192.27 | 7346.17 | 846.107 *** |
| Age | Age of household head, in years | 52.79 | 48.55 | 53.60 | −5.043 *** |
| Education | Illiteracy = 1; elementary school = 2; junior high school (secondary vocational) = 3; high school (secondary vocational) = 4; junior college (higher vocational) = 5; college or higher = 6 | 2.76 | 3.13 | 2.70 | 0.430 *** |
| Health | Good = 1; Normal = 2; Poor = 3; No labor capacity = 4 | 1.42 | 1.37 | 1.43 | −0.065 |
| Train | 1 if smallholder farmers receive training, 0 otherwise | 0.19 | 0.22 | 0.18 | 0.038 |
| Risk preference | Risk conservative type = 1; risk neutral type = 2; risk preference type = 3 | 1.40 | 1.51 | 1.38 | 0.130 *** |
| Proportion of non-agricultural income | The proportion of household non-agricultural income in total household income | 0.60 | 0.63 | 0.59 | 0.034 |
| Farm size | Logarithm of farm size (unit: ha) | 0.61 | 0.71 | 0.59 | 0.119 *** |
| Number of plots | (unit: plots) | 5.23 | 4.28 | 5.42 | −1.134 |
| Subsidy | Logarithm of subsidies in total (it includes agricultural machinery subsidies, subsidies for large grain farmers, production technology subsidies, agricultural insurance premium subsidies, loan discounts, etc.): (unit: RMB) | 6.29 | 6.68 | 6.21 | 0.469 *** |
| Seed fee | (unit: RMB) | 6.67 | 6.71 | 6.66 | 0.048 |
| Pesticide fee | (unit: RMB) | 5.77 | 5.47 | 5.83 | −0.361 *** |
| Fertilizer fee | The cost of chemical fertilizer and organic fertilizer (unit: RMB) | 7.68 | 7.82 | 7.65 | 0.167 *** |
| Irrigation cost | The cost of electricity and irrigation (unit: RMB) | 4.79 | 4.55 | 4.84 | −0.295 |
| Machinery cost | The cost of machinery operation (unit: RMB) | 6.38 | 6.95 | 6.27 | 0.677 *** |
| Invest time | (unit: day) | 2.03 | 2.06 | 2.03 | 0.026 |
| Whether or it is a poor village | 1 if it is a poor village, 0 otherwise | 0.26 | 0.29 | 0.25 | 0.043 |
| Economic development level | Good = 1; better = 2; general = 3; poor = 4; very poor = 5 | 3.29 | 3.47 | 3.26 | 0.215 *** |
| Variables | Maize Yield per ha | ||||
|---|---|---|---|---|---|
| Model 1 | Model 2 | Model 3 | Model 4 | Model 5 | |
| Internet use | 1066 *** | 958.5 *** | 795.6 *** | 944.8 *** | 959.8 *** |
| (165.9) | (170.3) | (174.3) | (200.0) | (199.5) | |
| Age | 7.714 | 10.81 | 6.815 | 3.266 | |
| (6.959) | (6.992) | (7.056) | (7.400) | ||
| Education | 260.3 *** | 296.1 *** | 270.8 *** | 265.1 *** | |
| (80.00) | (80.66) | (81.51) | (84.15) | ||
| Health | 25.28 | −48.96 | −26.91 | −106.6 | |
| (99.69) | (100.2) | (102.5) | (105.4) | ||
| Train | −72.71 | 135.4 | 118.9 | 149.1 | |
| (187.4) | (185.8) | (177.6) | (190.5) | ||
| Risk preference | −653.6 *** | −667.1 *** | −639.2 *** | −688.7 *** | |
| (116.9) | (119.3) | (121.0) | (123.9) | ||
| Non-agricultural income proportion | −925.0 *** | −874.8 *** | −1077 *** | ||
| (220.4) | (224.3) | (230.9) | |||
| Farm size | 806.1 *** | 874.7 *** | 966.6 *** | ||
| (164.5) | (166.4) | (164.6) | |||
| Number of plots | −46.01 *** | −47.49 *** | −47.55 *** | ||
| (13.49) | (13.77) | (12.83) | |||
| Subsidy | 28.61 | 26.48 | 26.03 | ||
| (41.04) | (40.44) | (40.57) | |||
| Seed fee | −180.8 | −156.7 | |||
| (137.9) | (140.9) | ||||
| Pesticide fee | 151.9 *** | 155.6 *** | |||
| (46.75) | (47.67) | ||||
| Fertilizer fee | 252.2 ** | 314.6 *** | |||
| (103.3) | (106.7) | ||||
| Irrigation cost | 102.1 *** | 114.3 *** | |||
| (26.36) | (26.67) | ||||
| Machinery cost | −132.9 *** | −150.4 *** | |||
| (39.19) | (39.65) | ||||
| Invest time | −94.92 | −107.0 | |||
| (83.40) | (82.12) | ||||
| Whether or not it is a poor village | −777.6 *** | ||||
| (175.2) | |||||
| Economic development level | −291.0 *** | ||||
| (90.44) | |||||
| Eastern reference group | |||||
| Middle region | −1288 *** | −1410 *** | −1450 *** | −1558 *** | −1525 *** |
| (162.4) | (164.2) | (164.7) | (163.8) | (160.0) | |
| Western region | 418.6 * | 224.3 | 310.3 | 699.0 *** | 546.5 ** |
| (227.3) | (234.7) | (221.0) | (228.5) | (233.4) | |
| Northeast region | 638.6 *** | 524.6 *** | 320.0 * | 1195 *** | 1032 *** |
| (191.7) | (196.6) | (190.6) | (174.6) | (169.6) | |
| Constant | 7348 *** | 5495 *** | 7467 *** | 7442 *** | 7317 *** |
| (1218) | (1134) | (588.0) | (562.9) | (114.2) | |
| Observations | 1242 | 1242 | 1242 | 1242 | 1242 |
| Pseudo R2 | 0.285 | 0.259 | 0.223 | 0.145 | 0.115 |
| Matching Method | Treatment Group | Control Group | ATT | Standard Error | T Value |
|---|---|---|---|---|---|
| Nearest neighbor matching | 8248.11 | 7170.05 | 1078.07 *** | 266.29 | 4.05 |
| Kernel matching | 8248.11 | 7221.24 | 1026.88 *** | 244.51 | 4.2 |
| Local linear regression matching | 8248.11 | 7200.57 | 1047.54 *** | 333.46 | 3.14 |
| Radius matching | 8248.11 | 7234.48 | 1013.63 *** | 244.62 | 4.14 |
| Variable | Unmatched/ Matched | Treated | Control | Bias (%) | Reduct |Bias| | T Test | p > t |
|---|---|---|---|---|---|---|---|
| Age | U | 48.55 | 53.60 *** | −48.8 | −5.94 | 0.000 | |
| M | 48.85 | 47.98 | 8.4 | 82.8 | 0.84 | 0.404 | |
| Education | U | 3.13 | 2.70 *** | 46.8 | 6.09 | 0.000 | |
| M | 3.07 | 3.15 | −8.6 | 81.6 | −0.82 | 0.411 | |
| Health | U | 1.37 | 1.43 | −10.7 | −1.33 | 0.185 | |
| M | 1.37 | 1.32 | 8.6 | 20.1 | 0.88 | 0.380 | |
| Train | U | 0.22 | 0.18 | 9.5 | 1.25 | 0.210 | |
| M | 0.19 | 0.18 | 4.3 | 54.3 | 0.44 | 0.662 | |
| Risk preference | U | 1.51 | 1.38 *** | 20.4 | 2.74 | 0.006 | |
| M | 1.51 | 1.58 | −11.6 | 42.9 | −1.05 | 0.296 | |
| Non-agricultural income Proportion | U | 0.63 | 0.59 | 9.4 | 1.23 | 0.217 | |
| M | 0.62 | 0.62 | −1.8 | 80.7 | −0.18 | 0.857 | |
| Farm size | U | 0.71 | 0.59 *** | 18.1 | 2.59 | 0.010 | |
| M | 0.71 | 0.71 | 0.4 | 98 | 0.03 | 0.974 | |
| Number of plots | U | 4.28 | 5.42 | −15.7 | −1.62 | 0.106 | |
| M | 4.35 | 4.48 | −1.8 | 88.5 | −0.32 | 0.746 | |
| subsidy | U | 6.68 | 6.21 *** | 25.6 | 3.13 | 0.002 | |
| M | 6.69 | 6.74 | −2.7 | 89.4 | −0.3 | 0.764 | |
| Seed fee | U | 6.71 | 6.66 | 9.6 | 1.08 | 0.282 | |
| M | 6.72 | 6.80 | −16.8 | −74.9 | −1.57 | 0.117 | |
| Pesticide fee | U | 5.47 | 5.83 *** | −22.1 | −3.2 | 0.001 | |
| M | 5.61 | 5.69 | −4.9 | 77.9 | −0.47 | 0.638 | |
| Fertilizer fee | U | 7.82 | 7.65 *** | 22.7 | 2.9 | 0.004 | |
| M | 7.81 | 7.81 | −0.5 | 97.6 | −0.06 | 0.955 | |
| Irrigation fee | U | 4.55 | 4.84 | −10 | −1.33 | 0.184 | |
| M | 4.65 | 4.64 | 0.3 | 96.5 | 0.03 | 0.973 | |
| Machinery cost | U | 6.95 | 6.27 *** | 33 | 3.71 | 0.000 | |
| M | 6.92 | 6.90 | 1.1 | 96.6 | 0.14 | 0.890 | |
| Invest time | U | 2.06 | 2.03 | 3.1 | 0.36 | 0.721 | |
| M | 2.03 | 2.04 | −1.2 | 60.3 | −0.13 | 0.898 | |
| Whether or it is a poor village | U | 0.29 | 0.25 | 9.7 | 1.28 | 0.201 | |
| M | 0.30 | 0.28 | 5.3 | 45.7 | 0.5 | 0.614 | |
| Economic development level | U | 3.47 | 3.26 | 24.7 | 3.24 | 0.001 | |
| M | 3.48 | 3.39 | 10.8 | 56.1 | 1.09 | 0.275 |
| Γ | Sig+ | Sig− |
|---|---|---|
| 1.0. | 0.000142 | 0.000142 |
| 1.05 | 0.000421 | 0.000043 |
| 1.10 | 0.001101 | 0.000013 |
| 1.15 | 0.002564 | 3.70 × 10⁻⁶ |
| 1.20 | 0.005408 | 1.10 × 10⁻⁶ |
| 1.25 | 0.010455 | 2.90 × 10⁻⁷ |
| 1.30 | 0.018722 | 7.90 × 10⁻⁸ |
| 1.35 | 0.031332 | 2.10 × 10⁻⁸ |
| 1.40 | 0.049385 | 5.60 × 10⁻⁹ |
| 1.45 | 0.073802 | 1.40 × 10⁻⁹ |
| 1.50 | 0.105186 | 3.70 × 10⁻¹⁰ |
| Age | Education | Farm Size | Economic Development Level | ||||||
|---|---|---|---|---|---|---|---|---|---|
| <60 | ≥60 | Low Education Level | High Education Level | Small-Scale Farmer | Large-Scale Farmer | Undeveloped Village | Well-Developed Village | ||
| Matching method | Nearest neighbor matching | 1036.81 *** | 229.90 | 1281.90 *** | 1082.65 ** | 71.25 | 2022.84 *** | 198.61 | 728.10 * |
| (277.95) | (1121.81) | (327.52) | (482.68) | (237.49) | (611.46) | (382.79) | (425.69) | ||
| Kernel matching | 1018.57 *** | 318.11 | 1121.03 *** | 974.01 ** | 155.61 | 1709.57 *** | 255.49 | 773.50** | |
| (253.47) | (1086.73) | (298.79) | (475.66) | (205.93) | (604.22) | (367.49) | (383.23) | ||
| Local linear regression matching | 1001.96 *** | 181.85 | 1080.19 *** | 1017.02 * | 109.95 | 1718.18 ** | 234.33 | 903.06* | |
| (331.61) | (1399.20) | (421.08) | (580.43) | (324.00) | (734.57) | (556.73) | (479.61) | ||
| Radius matching | 1027.39 *** | 320.03 | 1119.97 *** | 976.12 ** | 140.91 | 1713.18 *** | 251.24 | 778.99 ** | |
| (253.19) | (1086.29) | (298.66) | (475.29) | (205.47) | (589.85) | (367.89) | (385.14) | ||
| 1021.18 | 262.47 | 1150.77 | 1012.45 | 119.43 | 1790.94 | 234.92 | 795.91 | ||
| Sample size | Quantity | 895 | 347 | 1016 | 226 | 982 | 260 | 396 | 846 |
| Proportion | 72% | 28% | 82% | 18% | 79% | 21% | 32% | 68% | |
Publisher’s Note: MDPI stays neutral with regard to jurisdictional claims in published maps and institutional affiliations. |
© 2022 by the authors. Licensee MDPI, Basel, Switzerland. This article is an open access article distributed under the terms and conditions of the Creative Commons Attribution (CC BY) license (https://creativecommons.org/licenses/by/4.0/).
Share and Cite
Zheng, Y.; Fan, Q.; Jia, W. How Much Did Internet Use Promote Grain Production?—Evidence from a Survey of 1242 Farmers in 13 Provinces in China. Foods 2022, 11, 1389. https://doi.org/10.3390/foods11101389
Zheng Y, Fan Q, Jia W. How Much Did Internet Use Promote Grain Production?—Evidence from a Survey of 1242 Farmers in 13 Provinces in China. Foods. 2022; 11(10):1389. https://doi.org/10.3390/foods11101389
Chicago/Turabian StyleZheng, Yangyang, Qinqin Fan, and Wei Jia. 2022. "How Much Did Internet Use Promote Grain Production?—Evidence from a Survey of 1242 Farmers in 13 Provinces in China" Foods 11, no. 10: 1389. https://doi.org/10.3390/foods11101389
APA StyleZheng, Y., Fan, Q., & Jia, W. (2022). How Much Did Internet Use Promote Grain Production?—Evidence from a Survey of 1242 Farmers in 13 Provinces in China. Foods, 11(10), 1389. https://doi.org/10.3390/foods11101389