Article

Safety of Vitamin D Food Fortification and Supplementation: Evidence from Randomized Controlled Trials and Observational Studies

1
Calcium Research Unit, Department of Food and Nutrition, University of Helsinki, P.O. Box 66, FI-00014 Helsinki, Finland
2
Cork Centre for Vitamin D and Nutrition Research, School of Food and Nutritional Sciences, University College Cork, T12 Y337 Cork, Ireland
*
Author to whom correspondence should be addressed.
The ODIN Consortium are listed in acknowledgments.
Foods 2021, 10(12), 3065; https://doi.org/10.3390/foods10123065
Submission received: 26 October 2021 / Revised: 18 November 2021 / Accepted: 29 November 2021 / Published: 9 December 2021
(This article belongs to the Special Issue Current Research on Vitamin and Mineral Fortification in Foods)

Abstract

:
The safety considerations of food-based solutions for vitamin D deficiency prevention, such as fortification and supplementation, are critical. On the basis of collective data from 20 randomized controlled trials (RCTs) and 20 national healthy surveys, as well as prospective cohort studies (PCSs) across the ODIN project (“Food-based solutions for optimal vitamin D nutrition and health through the life cycle”, FP7-613977), we analyzed the potential safety issues arising from vitamin D intakes and/or supplementation. These adverse consequences included high serum 25-hydroxyvitamin D (S-25(OH)D) concentrations (>125 nmol/L), high serum calcium concentrations, and vitamin D intakes in excess of the tolerable upper intake levels (ULs). In the RCTs (n = 3353, with vitamin D doses from 5–175 µg/day), there were no reported adverse effects. The prevalence of high S-25(OH)D was <10% when vitamin D supplements were administered, and <0.1% for fortified foods. Elevated serum calcium was observed among <0.5% in both administration types. No ODIN RCT participants exceeded the age-specific ULs. In observational studies (n = 61,082), the prevalence of high 25(OH)D among children/adolescents, adults, and older adults was <0.3%, with no evidence of adverse effects. In conclusion, high S-25(OH)D concentrations >125 nmol/L were rare in the RCTs and PCSs, and no associated adverse effects were observed.

Graphical Abstract

1. Introduction

Vitamin D is important for musculoskeletal health, and its extraskeletal roles are played in the cellular, endocrine, immune, cardiovascular, and other systems [1,2]. Hence, vitamin D deficiency/insufficiency manifests as rickets and osteomalacia and has also been associated with some extraskeletal diseases, such as cardiovascular disease and type 2 diabetes, among others [1,2]. Vitamin D is derived from diets and through cutaneous synthesis in human skin upon exposure to ultraviolet B (UVB) from sunlight [3]. However, the numbers of naturally occurring vitamin-D-rich foods, containing either vitamin D3 (cholecalciferol) or D2 (ergocalciferol), are limited [3,4]. Thus, vitamin D food fortification has been the most suitable approach for enhancing vitamin D intake and status in the general population [4]. This is important, especially for the people living in northern latitudes, where there is limited or no cutaneous vitamin D production for several months during wintertime because of the inadequate levels of UVB irradiation for the synthesis [5]. Besides vitamin D food fortification, which is the traditional way of adding vitamin D directly to food product, the vitamin D content of food can be increased through biofortification, without the direct exogenous addition [4]. Examples of such biofortification include the increase in the vitamin D2 content of mushrooms by UVB-exposure that induces vitamin D production [6], and the increase in the vitamin D3 content of eggs through vitamin D-rich hen feed [7], among others [8]. In addition, studies have clearly demonstrated the effectiveness of oral supplementation in improving vitamin D status (i.e., increasing serum 25-hydroxyvitamin D (S-25(OH)D) concentrations), especially among individuals with low statuses [9,10,11]. Either from foods or supplements, vitamin D2 is generally considered less potent than vitamin D3 in raising and maintaining S-25(OH)D concentrations [12,13].
Safety is always an important consideration, not only when formulating recommendations for nutrient intakes, but also in establishing strategies aimed at preventing deficiencies in the population, such as food fortification and dietary supplementation [14]. The Institute of Medicine (IOM) and the European Food Safety Authority (EFSA) have both evaluated the potential for high intakes of vitamin D to produce adverse effects and have, accordingly, set tolerable upper intake levels (ULs) for vitamin D [15,16,17]. These ULs were established on the basis of minimizing the risk of hypercalcemia (high serum calcium), using evidence from vitamin D supplementation studies. High serum 25(OH)D concentrations (>220 nmol/L) may lead to hypercalcemia [18]. While hypercalcemia is mainly related to primary hyperparathyroidism or malignancy, it can also be induced by very high calcium or vitamin D intakes. Hypercalcemia can be life-threatening, and its symptoms include: neuropsychiatric manifestations, such as apathy, confusion, depression, irritability, hallucinations, and, in extreme cases, stupor, and coma; gastrointestinal symptoms, such as nausea, vomiting, anorexia, and constipation; cardiovascular manifestations, such as ectopy and hypertension; and renal symptoms, such as polyuria, polydipsia, dehydration, and renal colic from the passage of renal stones [19,20]. Orally ingested vitamin D is relatively safe, and toxicity is not apparent at doses of up to 250 µg/day [15,17] in healthy adults. However, to maximize public health protection, both agencies applied an uncertainty factor of 1.2 to 2 in order to ensure no risk for harm [15,16]. A UL for vitamin D of 100 µg/day was assigned for all adults, including pregnant and lactating women, whereas there were slight variations in the two institutions for the ULs for children [15,16,17] (see Supplementary Table S1).
The International Agency for Research on Cancer (IARC) pointed out that there are no data on the health hazards of maintaining high serum 25(OH)D in healthy persons over long periods and urged caution to be mindful of past experiences with other compounds and treatments (e.g., some antioxidants and hormone replacement therapies) that showed serious adverse effects when chronic high-dose supplements were used [21]. Over and above the risk of hypercalcemia, reports of U-shaped and reverse J-shaped distributions have emerged for serum 25(OH)D and the adverse consequences, including all-cause mortality, cardiovascular disease risk, parathyroid hormone (PTH) suppression, and fetal growth restriction [15,22,23], which deserve serious consideration by both researchers and authoritative agencies. For these reasons, the IOM issued an additional cautionary note in the recommendations on the potential adverse effects of a sustained serum 25(OH)D above ~125–150 nmol/L, acknowledging the lack of empirical data [15]. Such serum concentrations could potentially be achieved at vitamin D intakes below the ULs.
In terms of monitoring the safety of any dietary strategies to increase vitamin D intakes in the population, the main requirement is that intakes at the 97.5th percentile of the distribution do not exceed the UL for a specified age group. In the European Union-funded ODIN (“Food-based solutions for optimal vitamin D nutrition and health through the life cycle”, FP7-613977) vitamin D project (2013–2017), different food-based strategies (such as the fortification and biofortification of different foods to accommodate the diverse dietary practices in modern society), aimed at increasing the habitual vitamin D intakes in the population, were proposed and evaluated [24]. These solutions sought to change the shape of the vitamin D intake distribution, increasing the median to ~10 µg/day, without increasing the intake to the UL [25]. In addition, the effects of higher serum 25(OH)D on various health outcomes were also investigated in observational and vitamin D supplement intervention studies within ODIN [24]. Importantly, the project maintained a watching safety brief over all activities with respect to exposure, status, and health outcomes in order to ensure the protection of public health and safety. The aim of this paper is to provide a summary of the key findings of the ODIN project as they relate to safety considerations in relation to increasing vitamin D intake and serum 25(OH)D concentrations. These safety considerations were based on collective data from 20 randomized controlled trials (RCTs) and 20 national healthy surveys, as well as prospective cohort studies (PCS) across the ODIN project. Details of the selection of the included studies are provided elsewhere [24].

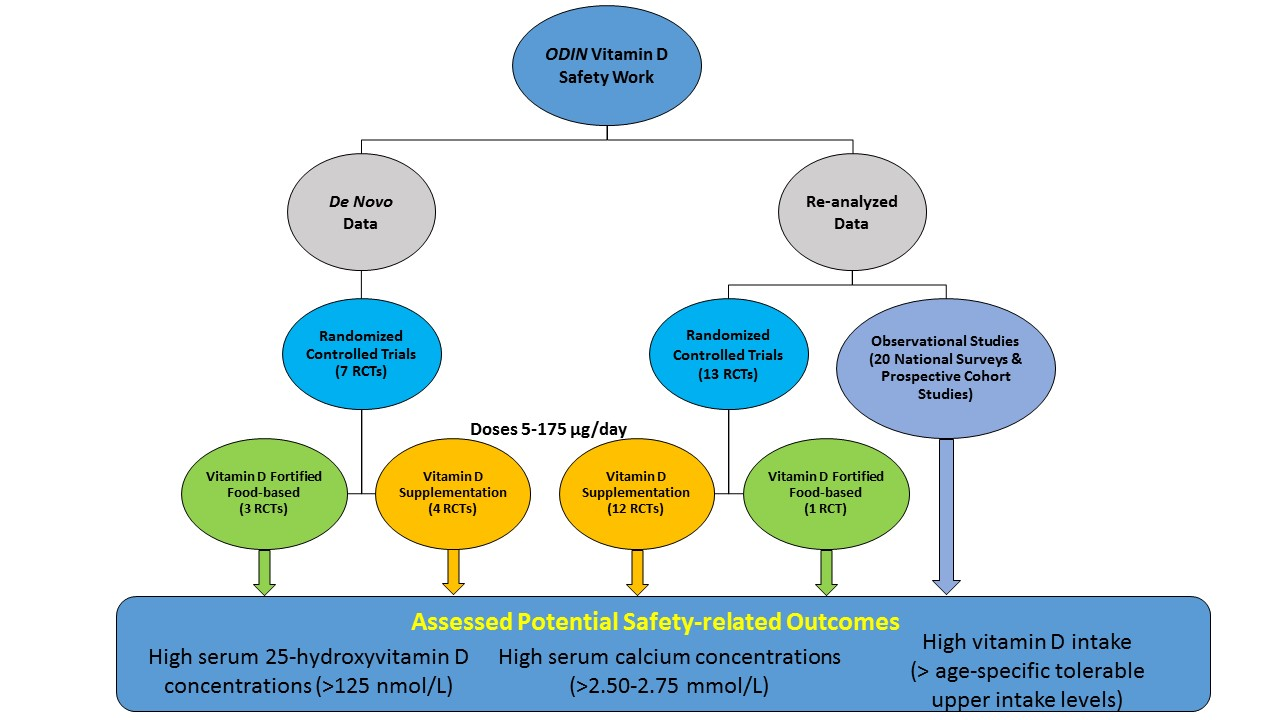
2. Methods, including Safety Approach, within the ODIN Project

The overall aim of the ODIN vitamin D project was to develop effective, safe, and sustainable solutions to prevent vitamin D deficiency and improve vitamin D-related health outcomes using a food-first approach, as described in detail elsewhere [24]. Structurally, the project, based on a collaborative and multidisciplinary consortium of 30 partners from 19 countries, had nine research work packages (WPs; akin to mini-projects; see Supplementary Figure S1), all of which had a particular focus aligned with the project’s key aims. The main aim of WP9 (the Safety WP) was to document all of the safety issues (see below) across the project and its various WPs, which included data from vitamin D RCTs, PCSs, and national nutrition surveys. The approach for the selection of these RCTs and PCSs within the ODIN project has been outlined elsewhere [20], but, in brief, the studies represented those RCTs or PCSs that fit with the specific aims of the individual WPs within the project, but also, importantly, those that had biobanked serum samples to facilitate standardization or the reanalysis of 25(OH)D by LC-MS/MS in order to ensure the removal of any method-related differences in the data. This was critical, as the 25(OH)D data was pooled for individual participant data analyses of the vitamin D and nonskeletal health effects.

2.1. Specification of Safety and the Adverse Effects

2.1.1. High Serum 25-Hydroxyvitamin D

Safety, in terms of high serum 25(OH)D, was defined as the prevalence of serum 25(OH)D >125 nmol/L. This aligns with the Institute of Medicine (IOM), 2011 [15], which, in setting their tolerable upper levels (ULs) for vitamin D intakes, also considered if the intakes of vitamin D were likely to lead to serum 25(OH)D concentrations in excess of approximately 125 to 150 nmol/L. They considered that this might be of concern on the basis of some of the observed U-shaped or reverse J-shaped relationships between serum 25(OH)D and mortality, as well as other health outcomes [4]. However, the European Food Safety Agency (EFSA) found no studies with an association between vitamin D intake and an increased risk for adverse long-term health outcomes, and that studies reporting on an association between 25(OH)D concentration and all-cause mortality or cancer were inconsistent [16].
All of the serum 25(OH)D concentration data within ODIN were either retrospectively standardized, as per the Vitamin D Standardization Program (VDSP) [26], fully reanalyzed, or analyzed de novo using the ODIN core analytical platform for serum total 25(OH)D at University College Cork [27], which was certified by the Centers for Disease Control and Prevention (CDC). The specificity of this certified LC-MS/MS platform avoids the artificially high measurement values for serum 25(OH)D generated by some immuno-assays, especially for concentrations >100 nmol/L [28]. This is important in the context of a more valid comparison of the prevalence data on high-serum 25(OH)D concentrations across populations and countries.
The IOM’s caution about serum 25(OH)D >125 nmol/L relates to sustained concentrations, as opposed to the more transient elevations that are part of the normal seasonal fluctuations in serum 25(OH)D. Blood sampling in several of the population samples (RCTs and observational studies) within ODIN was done throughout the year. Hence, yearly prevalence estimates of serum 25(OH)D >125 nmol/L would include data from the summer sampling, when higher serum 25(OH)D concentrations are more likely to be achieved [29]. During the subsequent winter and spring, serum 25(OH)D concentrations will significantly decline, as the UVB availability for the synthesis of previtamin D3 in the skin becomes absent or limited [5]. High concentrations of serum 25(OH)D achieved in wintertime are more likely due to high dietary intake (i.e., vitamin D supplement use and/or the use of vitamin-D-fortified foods in addition to natural food sources). Therefore, in addition to yearly prevalence estimates, the prevalence of serum 25(OH)D >125 nmol/L during an extended wintertime (October–March), which might be more indicative of sustained high concentrations, are also reported in the present work.

2.1.2. High Serum Calcium Concentration

The normal range of serum calcium is 2.1–2.6 mmol/L, with concentrations ≥2.6 mmol/L typically defined as hypercalcemia [15,17]. The upper limit of the reference range for Ca (mmol/L), however, varies slightly, depending on the method of analysis and the laboratory. Hence, hypercalcemia is defined in the present work as a serum calcium concentration >2.50–2.75 mmol/L, on the basis of laboratory-specific values.

2.1.3. Dietary Intakes of Vitamin D Exceeding the Tolerable Upper Level

Safety, in terms of dietary vitamin D intakes, was defined as the risk of exceeding the EFSA age-specific UL values, namely, 25 µg/day for infants ≤6 months, and 35 µg/day for infants aged 6–12 months [17], as well as 50 µg/day for children aged 1–10 years, and 100 µg/day for children and adolescents aged 11–17 years and adults [16]. Additionally, in the case of vitamin D RCTs within ODIN, we used a crude stratification, depending on the dose of the supplemental vitamin D3 being ≤70 µg/day or ≥71 µg/day, being representative of “low to moderately high” or “moderately high to high” doses, respectively.

2.2. Studies Contributing Data on Safety and Adverse Effects

Safety surveillance data emanated from numerous RCTs within ODIN’s WPs 4–6 and 8, as well as observational studies within WPs 1, 2, and 8 (Supplementary Figure S1), as follows.

2.2.1. Randomized Controlled Trials

Safety data from a total of 20 RCTs arising from WPs 4–6 and 8 were included (Table 1). Of these, 7 were de novo RCTs performed within ODIN (total n = 736 subjects), all of which used supplemental vitamin D and/or vitamin-D-(bio)fortified foods. The project had one additional RCT using controlled UV-exposure (WP3), but the primary data from this study has not yet been published and, thus, is not included in the present work. Moreover, 12 previously conducted RCTs were used in ODIN’s individual participant data (IPD) meta-analysis focused on the beneficial or harmful effects of vitamin D3 on cardiovascular disease (CVD) and diabetes [30]. In this case, biobanked sera (baseline and endpoint) from the 12 studies (total combined n = 2617 subjects) were reanalyzed by the ODIN CDC-certified LC-MS/MS method [31,32,33,34,35,36,37,38,39,40,41,42,43,44,45,46,47,48,49,50,51,52,53,54].
In some of the RCTs, vitamin D3 supplements were administered once or twice a week, monthly, or quarterly, and the doses were reported in the form of international units (IUs) [38,42,43,46,47,48]. For this work, these were converted to daily dose equivalents and expressed in micrograms (i.e., 40 IU = 1 µg). A food frequency questionnaire was used in the studies that reported habitual dietary intakes of vitamin D; such data were not available from all RCTs. For those studies that did report habitual vitamin D intakes, these were added to the supplemental vitamin D to derive “total vitamin D intake” estimates.

2.2.2. Observational Studies

VDSP standardized 25(OH)D data, and other safety data from 20 observational studies [55,56,57,58,59,60,61,62,63,64,65,66,67,68,69,70,71,72,73,74,75,76,77], were gathered from representative childhood/teenage and adult/older adult European populations (WP1) [78], as well as two pregnancy cohorts [79,80] and one infant [64,65] cohort (WP7) (Supplementary Table S2). In addition, 25(OH)D data from a second ODIN IPD-level meta-analysis, in this case, of the association between vitamin D and all-cause mortality (including cardiovascular and cancer mortality), based on eight previous PCSs (n = 26,916) [81], were included. Seven of these PCSs had their serum 25(OH)D data standardized by the VDSP protocols, whereas one had its serum 25(OH)D values measured de novo.

2.2.3. Adverse Health Effects of High Vitamin D Intake or Serum 25(OH)D Concentrations

Safety, in terms of the additional potential adverse health effects of high vitamin D intake or serum 25(OH)D concentrations, was defined within the ODIN project as the risk of increased mortality, cardiovascular mortality, adverse pregnancy outcomes, any adverse fetal and infant outcomes, and an increased risk of eczema, asthma, and food allergies. Specifically, in the IPD meta-analysis of 12 RCTs to investigate whether there are beneficial or harmful effects of vitamin D3 supplementation [30], the specified outcomes were blood pressure, low-density lipoprotein (LDL), high-density lipoprotein (HDL), total cholesterol, triglycerides, PTH, glycated hemoglobin (HbA1c), fasting glucose, insulin and C-peptide, and 2-h glucose.

2.3. Collection of Safety Data

The data regarding the safety and the adverse effects throughout the ODIN project were collected via a specific questionnaire-based Excel repository platform. The questions on the safety considerations reflected the abovementioned specified measures, namely, the prevalence of high serum 25(OH)D concentrations, the prevalence of elevated serum calcium, new information on the possible associated adverse health effects, vitamin D intakes at, or in excess of, the ULs, when available, as well as other specific safety considerations.

2.4. Ethical Considerations

ODIN included a dedicated ethics work package, which collected the ethical approvals from pre-existing studies to ensure that the necessary consent was obtained to conduct 25(OH)D, and associated, data analysis. Ethical approval was obtained for the individual studies conducted within ODIN from the respective local ethical review boards [34,35,36,37,52,53,54].

3. Results

3.1. Study Characteristics

3.1.1. Observational Setting

The characteristics of the observational studies included in this work are described in Supplementary Table S2. These studies were nationally representative nutrition surveys and epidemiological cohorts among a wide range of European populations across several countries. Surveys were conducted among infants and children, adolescents, adults, and older adults; cohorts among pregnant women and infant populations; and the IPD-level meta-analyses of cohorts among older adults.

3.1.2. Interventional Setting

Table 1 shows the characteristics of the 20 vitamin D RCTs and their participants. The studies were all conducted in the following European countries: three each in Denmark, Ireland, and the Netherlands; five in Norway; two in Finland; and one each in the U.K., Greece, Germany, and Austria. One study each was conducted among the following population groups: children, adolescents, and pregnant women. Among the remaining 17 RCTs, all carried out in adult populations (age range 18–80 years), two studies were in women of ethnic groups, two in mixed gender populations with immigrant backgrounds, one among the elderly living in nursing home, and two among individuals with high BMI. One study each was carried out in a population with the following conditions: impaired glucose tolerance (IGT) and/or impaired fasting glucose (IFG), low bone mineral density, and arterial hypertension. The study durations varied from one to twelve months.
The vitamin D supplementation RCTs administered vitamin D3 supplements (18 RCTs) or vitamin D2 supplements (2 RCTs) (Table 1). The administered supplemental vitamin D3 doses ≤70 µg/day were: 5 µg/day; 10 µg/day; 15 µg/day; 20 µg/day; 25 µg/day; 30 µg/day; and 70 µg/day. Those of doses ≥71 µg/day (or the daily equivalent) were: 71 µg/day (i.e., 20,000 IU/week); 143 µg/day (i.e., 20,000 IU/twice a week or 40,000 IU/week); 163 µg/day (i.e., 800 IU/day + 20,000 IU/twice a week); and 175 µg/day. Each of the 2 RCTs that administered supplemental vitamin D2 used doses of 25 and 100 µg/d, respectively. Of the 4 RCTs administering vitamin D as fortified food(s), 1 RCT each used bread, cheese, mushrooms, or a combination of four different foods (vitamin D-fortified low-fat cheese, yoghurt, eggs, and crisp bread). Of the food-based RCTs, 2 used vitamin D3-fortified food(s) (i.e., cheese and combined fortified foods providing 5.7 and 20 µg/day, respectively), while the other 2 studies used vitamin D2-fortified foods (i.e., bread and mushrooms providing 25 and 100 µg/day, respectively) in the intervention arms.

3.2. Dietary Intakes of Vitamin D Exceeding the Tolerable Upper Level: Interventional Setting

In the supplemental vitamin D RCTs, the mean total vitamin D intakes were 25.3 and 29.7 µg/day at the 99th percentile for children and adolescents, respectively (data not shown). Among those RCTs conducted in adult populations, where habitual vitamin D intakes were reported (4 out of 6 de novo RCTs), the mean total intake was between 53.4 and 79.5 µg/day at the 99th percentile. In food-based vitamin D RCTs, the mean total intake was 70.7 µg/day at the 99th percentile (intervention with vitamin D3-enriched food) and 55.5 at the 97.5th percentile (intervention with vitamin D2-fortified bread). Vitamin D intakes did not exceed the UL (i.e., 50 µg/day for children aged 1–10 years; 100 µg/day for adolescents and adults) in any RCT with available data on habitual vitamin D intakes.

3.3. Prevalence of High Serum 25(OH)D Concentrations (>125 nmol/L): Observational and Interventional Setting

3.3.1. Observational Studies in Children, Adolescents, and Older Adults

There were no cases of serum 25(OH)D concentrations >125 nmol/L during extended winter in seven of the eight European childhood and adolescent population samples [78]. In one child cohort (2-year-olds from the Cork BASELINE birth cohort) [64], three subjects (0.4%) had serum 25(OH)D concentrations >125 nmol/L during extended winter (Supplementary Table S2). Of the six European adult/older adult population samples, four had no cases of serum 25(OH)D concentrations >125 nmol/L during extended winter, and the prevalence in the other two studies (Tromsø study—6th Survey and the New Hoorn Study) [70,71,72,73] was 0.3%. In the one ethnic adult population sample, based in Finland (the Maamu study), the prevalence of serum 25(OH)D concentrations >125 nmol/L was 0.2% during extended winter.
Data from the eight prospective cohorts of older adults (median age 61.6 years, 58% females, combined n = 26,916) [81] showed that the prevalence of 25(OH)D >125 nmol/L ranged from 0 to 0.6% throughout the year, and from 0 to 0.3% during the extended wintertime (Supplementary Table S2).
Taking all 20 observational study samples of children/adolescents, adults, and older adults combined, out of a total of 61,082 subjects, 132 (0.22%) had serum 25(OH)D >125 nmol/L on a yearly basis, including the summer months, and only 70 during winter alone.
The prevalence of high 25(OH)D concentrations was almost zero in the pregnancy cohorts analyzed.

3.3.2. Interventional Setting: Vitamin D Supplementation RCTs

The prevalence of serum 25(OH)D >125 nmol/L in the vitamin D RCT studies, stratified by supplemental doses ≤70 µg/day or ≥71 µg/day, is shown in Table 2. Of the 10 RCTs of children, adolescents, and adults with doses ≤70 µg/day (ranging from 5 to 70 µg/day), only 2 RCTs had cases of endpoint serum 25(OH)D >125 nmol/L, and only one subject in each (one adolescent and one adult woman of East African descent, both of whom received a vitamin D3 supplement of dose 20 µg/day for five months of extended winter in the U.K. and Finland, respectively (Table 2)). It is important to note that when habitual vitamin D intake was accounted for, the total vitamin D intakes of these two individuals were 23.2 and 59.5 µg/day, respectively (data not shown). In the vitamin D RCT among pregnant women, endpoint serum 25(OH)D >125 nmol/L was observed among eleven participants, of whom five women received 10 µg, and six women received a 20-µg vitamin D3 supplement daily for 25 weeks (none were in the placebo group, eight had endpoint sampling in summer (total vitamin D intakes in the range of 16.0–43.9 µg/day); three in winter (total vitamin D intakes in the range of 29.6–53.4 µg/day)).
All 6 of the RCTs that administered supplement doses of vitamin D3 ≥71 µg/day had cases of serum 25(OH)D >125 nmol/L, ranged from 7.0% in the groups receiving 71 µg/day of vitamin D3 to 91.9% in those receiving 163 µg/day (Table 2). These RCTs ranged in duration from six months to 1 year so were not winter-based trials only. Of note, however, in all but one of these RCTs, the placebo group had no cases of endpoint serum 25(OH)D >125 nmol/L. Two individuals in the placebo group of the trial of Norwegian adults with impaired glucose tolerance had serum 25(OH)D >125 nmol/L (no data available other than supplemental vitamin D intake).

3.3.3. Interventional Setting: Vitamin D-Fortified Food-Based RCTs

In 3 out of the 4 RCTs using vitamin D-fortified foods, which provided doses of 5.7 µg vitamin D3/day, or 25 or 100 µg vitamin D2/day, no participants had endpoint serum 25(OH)D concentrations >125 nmol/L (Table 2). In the wintertime food-based RCT (in Denmark), 1 out of 35 women of Pakistani descent (2.9%), and 1 out of 37 Caucasian women of Danish descent (2.7%) who received vitamin D3-enriched food with 20 µg/day for 3 months had endpoint serum 25(OH)D >125 nmol/L. Accounting for habitual vitamin D intake together with supplemental vitamin D, their total vitamin D intakes were 25.8 and 27.4 µg/day, respectively.
In summary, out of 3353 participants who took part in the 20 vitamin D RCTs included in this ODIN safety work, a total of 320 (9.5%) individuals (belonging to the intervention arms that received either supplements or fortified foods) had serum 25(OH)D >125 nmol/L at the endpoint of the study. The proportion of the endpoint serum 25(OH)D >125 nmol/L was 9.4% (n = 318) among the participants who ingested vitamin D supplements, and 0.1% (n = 2) among those who ingested vitamin D-fortified foods. The majority (95%) of the prevalence of endpoint serum 25(OH)D >125 nmol/L among the vitamin D supplement RCTs was in those that used doses ≥71 µg/day.

3.4. Prevalence of High Serum Calcium Concentrations in Relation to Vitamin D-Fortified Foods and Dietary Supplements in Randomized Controlled Trials

The prevalence of high serum calcium concentrations (>2.50–2.75 mmol/L, based on laboratory-specific values), as an indicator of hypercalcemia, within the RCTs of either vitamin D supplementation or food fortification, and where data were available, are shown in Table 3.

3.4.1. Vitamin D supplementation RCTs

The two subjects from the UK [35] and Finnish [37] trials with elevated serum 25(OH)D concentrations (and total vitamin D intakes were 23.2 and 59.5 µg/day, respectively), mentioned above, had normal calcium concentrations. However, a high serum calcium concentration (>2.65 mmol/L) was evident in two subjects receiving the 20-µg vitamin D3 supplement at the endpoint of the RCT in Finland (with total vitamin D intakes 31.5 and 38.0 µg/day, respectively). In three other RCTs within the supplemental dose ≤70 µg/day grouping of trials, high calcium concentrations (>2.55 and 2.60 mmol/L) were found in 0.5–1.6% of subjects, but no cases of serum 25(OH)D >125 nmol/L were evident in the subjects.
In two of the ‘moderately high to high’ dose (≥71 µg/day) RCTs, high calcium concentrations (>2.55 mmol/L) were evident at the endpoint of the trials. In one of the RCTs, one subject receiving 143 µg/day of supplemental vitamin D had high serum calcium (total prevalence 0.4%), while a higher prevalence of 2.9% was observed in the study with a daily dose of 163 µg/day vitamin D + 1000 mg calcium (Table 3). Notably, the prevalence of high serum calcium concentrations among those with serum 25(OH)D >125 nmol/L in that study was 5.6%, while there was no link between high serum calcium concentrations and serum 25(OH)D >125 nmol/L in the other studies.

3.4.2. Vitamin D-Fortified Food-Based RCTs

In the vitamin D2-fortified bread study, one subject (2.7%, randomized to 25 µg/day of supplemental vitamin D2 in capsule form) had high serum calcium concentrations (>2.65 mmol/L) at the end of the trial [52] (Table 3). Moreover, among the ethnic women who received 20 µg of vitamin D3-enriched food (food-based RCT) in Denmark, high serum calcium concentrations (>2.55 mmol/L) were evident in 10.2% of the subjects at the endpoint of the intervention, although, of note, 7.1% had high serum calcium concentrations at baseline (Table 3). The elevated serum calcium concentrations did not change at the endpoint among 2.4% (three subjects) of those with high baseline concentrations, of which 1.6% (two subjects) belong to the placebo group.
Overall, prevalence of high serum calcium was observed in a total of 30 (<1%) out of 3353 participants who either took part in the 20 vitamin D RCTs included in this ODIN safety work; in 0.5% (n = 16) in the vitamin D supplementation trials; and in 0.4% (n = 14) in the studies based on vitamin D-fortified foods.

3.5. Potential Additional Adverse Health Effects of High Vitamin D Intake or Serum 25(OH)D Concentrations

3.5.1. Observational Studies: Serum 25(OH)D and Mortality

ODIN’s IPD-level meta-analysis of the association between standardized serum 25(OH)D and all-cause, cardiovascular, and cancer mortalities evaluated these at various bands of the serum 25(OH)D concentration [82]. During a median follow-up time of 10.5 years within the eight large European PCSs in older adults, 6802 persons died (total n = 26,916). In the context of the safety of high serum 25(OH)D concentrations, there was no apparent excess of mortality (all-cause or CVD-linked) for the group with serum 25(OH)D concentrations >125 nmol/L; albeit, the number of individuals was small (n = 172). In addition, there was no significant linear association between 25(OH)D and cancer mortality.

3.5.2. Randomized Controlled Trials of Vitamin D Supplementation and Vitamin D-Enriched Foods

In the ODIN supplemental vitamin D RCTs, no serious adverse effects in relation to vitamin D supplementation were reported. An analysis of the data from the pregnancy and birth cohorts showed no evidence of adverse health effects of high S 25(OH) concentrations, which were rare. Similarly, no cases of adverse effects related to the intake of vitamin D-enriched foods were reported in the ODIN food-based RCTs. In the ODIN’s IPD-level meta-analysis [30], the subgroup analyses, according to the achieved (i.e., endpoint) serum 25(OH)D concentrations, revealed no observed adverse effects of serum 25(OH)D >125 nmol/L arising from vitamin D supplementation on the surrogate markers for cardiovascular disease or glucometabolic health.

4. Discussion

Vitamin D toxicity, including hypercalcemia and its sequelae, is rare. However, the adverse health effects, especially those due to the excessive long-term intake of vitamin D, can be serious [4,20]. The IOM has classified circulating 25(OH)D concentrations >125 nmol/L, if sustained, as potentially harmful on the basis of the reported associations with increases in all-cause mortality, a greater risk of cancer at some sites, such as the pancreas, and a greater risk of cardiovascular events, although this level is far lower than the serum 25(OH)D concentrations associated with hypercalcemia, approximately greater than 375–500 nmol/L [15]. Of note, Pilz et al. [4] have emphasized that the risk of adverse events at 25(OH)D concentrations >125 nmol/L has only been inconsistently reported in observational studies, and there are mixed findings in relation to safety from RCTs with subjects having serum 25(OH)D concentrations >125 nmol/L. Recently, safety concerns were raised regarding randomization to supplemental vitamin D at 2000 IU/day (i.e., 50 µg/day), and 4000 IU/day (i.e., 100 µg/day), in the dose-finding phase of a two-stage randomized clinical trial among older adults because of the higher primary outcome rates in terms of falls or death, compared to those assigned 1000 IU/day [82]. This paper provides comprehensive data on the prevalence of standardized serum 25(OH)D >125 nmol/L in a large number of observational studies of children, adults, and older adults in Europe. The prevalence of standardized serum 25(OH)D >125 nmol/L during extended wintertime in the various national surveys and cohorts within ODIN was low overall (typically 0.03 to 0.5% in the eight samples that had cases), and, in fact, was absent altogether in the remaining 11 studies. Overall, the prevalence in the combined sample (n = 61,082) was 0.1% (n = 66). Not unsurprisingly, the prevalence of serum 25(OH)D concentrations >220 nmol/L, which may lead to hypercalcemia [18], was extremely low (<0.005%) in these studies.
The analyses in ODIN did not seek to explore the underpinning reasons for the high serum 25(OH)D concentrations in the subjects, but using extended winter as the priority sampling period increases the likelihood that it was induced through the oral ingestion of vitamin D (vitamin D-fortified foods and/or supplements) rather than via UVB-rich sun exposure. A low prevalence of serum 25(OH)D >125 nmol/L has also been reported in other national surveys beyond those included in the present ODIN work. For example, data on VDSP standardized serum 25(OH)D >125 nmol/L, from the National Adult Nutrition Survey in Ireland (n = 1118), showed a low prevalence of 0.3% (n = 3; all sampled in extended summer, and one of the three took vitamin D supplements) [27]. Likewise, in the Finnish nationally representative Health 2011 survey of adults (n = 4051), the prevalence of VDSP standardized serum 25(OH)D >125 nmol/L was only 0.2% (i.e., seven participants who used a supplement and one who did not; samples taken within August and December) [83]. An evaluation of data from national nutritional surveys in Europe shows that adults in Finland have the highest mean daily intake of vitamin D from food, including fortified foods, and excluding the contribution from supplements [84].
The prevalence data in the present work is novel as it based on VDSP standardized serum 25(OH)D data, which provides for a truer picture of the prevalence of high serum 25(OH)D in Europe. The standardization of serum 25(OH)D data removes the potential for artefactual high serum concentrations, which are intrinsic to some immunoassays because of the cross-reactivity of the antibodies with other vitamin D metabolites, such as 24,25(OH)2D [28]. Interestingly, the previously reported inverse J-shaped association between high serum 25(OH)D concentrations and all-cause mortality in the NHANES III survey (1988–1994) in the United States, one of the examples referenced by the IOM in issuing their caution about serum 25(OH)D >125 nmol/L, disappeared when the serum 25(OH)D data was standardized [85]. There were only seven individuals with serum 25(OH)D >120 nmol/L when the data was standardized. The ODIN IPD-level meta-analysis of eight European cohorts of older adults showed that there was no apparent excess of all-cause or cardiovascular mortality for the group with standardized serum 25(OH)D concentrations >125 nmol/L, acknowledging the limited statistical power due to the small number of individuals with these concentrations (n = 172). There is also uncertainty as to whether the reverse J-shaped association between serum 25(OH)D and all-cause mortality is causal. It has been hypothesized that these findings may have been driven by individuals with particularly high 25(OH)D concentrations who started supplementing vitamin D because they were previously vitamin D deficient [85,86,87]. However, ODIN’s IPD-level meta-analysis of 12 RCTs, using supplemental vitamin D and stratified according to subgroups of re-measured serum 25(OH)D, showed no adverse effect of the achieved endpoint concentrations >125 nmol/L on the surrogate markers for cardiovascular disease or cardiometabolic health [30].
The data from ODIN’s overall collection of 20 vitamin D RCTs, ranging from de novo conducted studies to those in which the serum 25(OH)D was reanalyzed by the project’s CDC-certified method to reduce assay-related differences in estimates for inclusion in the IPD analyses, provided some insight into the relationship between vitamin D supplementation/food fortification and high serum 25(OH)D concentrations. Overall, the prevalence of high serum 25(OH)D was <10% among subjects who received vitamin D supplementation, and <0.1% among those who received foods fortified with vitamin D. However, the incidences of high serum 25(OH)D concentrations were related to the vitamin D dosage. For example, within the nine RCTs of children, adolescents, and adults in Europe, which used supplemental vitamin D3 at doses in the range of 5–70 µg/day (as being representative of “low to moderately high” doses), for ≤6 months and generally during an extended winter period, there were only two cases (out of n = 1486) with serum 25(OH)D >125 nmol/L. This was also the case for the four winter-based RCTs, which used vitamin D-fortified foods (dose range of 5.5–100 µg/day), with only two cases out of a combined sample of 269. The RCT of vitamin D supplementation during pregnancy had eleven women (out of 144; 7.6%) with serum 25(OH)D >125 nmol/L. These received 10 or 20 µg of vitamin D supplementation for around six months, and while eight of the women had endpoint sampling for serum 25(OH)D in summer, three had endpoint sampling in winter, where UVB-induced synthesis in the skin would not have contributed to the high status. The total vitamin D intakes for these three participants were in the range of 29.6–53.4 µg/day.
Of note, the prevalence of high serum calcium was also very low in these RCTs, with the exception of one of the food-based RCTs, with a prevalence of high serum Ca of 10% at endpoint [54]. In this RCT, however, there may have been methodological issues, as even at baseline there was an unusually high prevalence at 7%. Furthermore, only two participants (1.6%) had serum 25(OH)D >125 nmol/L at endpoint. Overall, these findings are not unexpected, as the total vitamin D intakes in those trials that captured such data were less than the vitamin D UL for children (Denmark) [34], adolescents (UK) [35], pregnant women (Ireland) [36], women with Danish and Pakistani origin in Denmark [54], and women with Finnish and East African backgrounds in Finland [37,52].
On the other hand, a high prevalence of serum 25(OH)D >125 nmol/L was evident in each of the six RCTs that administered “moderately high to high” doses of vitamin D3 (≥71 µg/day). Overall, 21.0% (n = 307 out of 1459) had endpoint serum 25(OH)D >125 nmol/L. It was particularly evident in the trials that used doses of supplemental vitamin D >140 µg/day, where between 31.8 and 91.9% of the participants had serum 25(OH)D >125 nmol/L at endpoint. All six RCTs were of 6 to 12 months in duration and, thus, would have had some summer blood sampling. However, in general, the prevalence of high serum 25(OH)D in the placebo groups was absent or very low, suggesting oral intake as the main driver of high status. These data are also of note, all were reanalyzed serum 25(OH)D using the project’s certified LC-MS/MS method, avoiding the inflated estimates that can occur with some methods [28]. More recently, Burt and coauthors, in their three-year vitamin D RCT, also observed the occurrence of serum 25(OH)D >125 nmol/L in those arms with supplemental vitamin D doses of 100 and 250 µg/d, but not in the arm with a dose of 10 µg/day [88]. A recent systematic review and meta-analysis demonstrated consistent dose–response relationships between serum 25(OH)D concentrations (from a variety of different analytical methods) and vitamin D supplementation (dose range of 10–149 µg/day), among children, adolescents, and adults (including pregnant and lactating women, postmenopausal women, and the elderly) from around the globe. It also highlights cases of high serum 25(OH)D concentration among the highest supplemental doses (>100 µg/day) [89].
Three out of the five “moderately high to high-dose” vitamin D RCTs that had data reported no prevalence of high serum calcium concentrations. In the remaining two RCTs [47,48], high serum calcium concentrations (>2.55 mmol/L) were observed at the endpoint of the trials (six months and one year, respectively). The highest prevalence of elevated serum calcium (3%; n = 8 out of 275) was seen in the study in which a daily dose of 1000 mg of calcium was administered, together with a daily vitamin D3 dose of 163 µg/day [48]. Notably, the prevalence of high serum calcium among those with serum 25(OH)D >125 nmol/L in that study was 6%, while there was no link between elevated serum calcium and serum 25(OH)D >125 nmol/L in the other studies. In the RCT of Burt et al., where the effect of high-dose vitamin D supplementation on bone mineral density was investigated for three years, episodes of hypercalcemia and hypercalciuria (in the range of 4–9% and 22–33%, respectively) were found with the doses of 100 and 250 µg/day, respectively [88]. While there were cases of hypercalciuria (17%, but not hypercalcemia) with the vitamin D dose of 10 µg/d in the study, these were possibly linked to the calcium intake, which was based on achieving 1200 mg/day [88]. A systematic review and meta-analysis of long-term studies (n = 37) of vitamin D supplementation in adults showed an increased risk of hypercalcemia in vitamin D supplementation groups [90]. Subgroup analyses showed that the risk was not modified by the vitamin D dose (≤20 [n = 3 studies] or >20 µg/day [n = 33 studies]) and meta-regression showed no association between the vitamin D dose and the risk of hypercalcemia [90]. In contrast, the present findings seem to point to a high dose of vitamin D supplements in relation to a trend for elevated serum calcium. From a wider safety perspective, it should also be noted again that high endpoint serum 25(OH)D were not related to increases in surrogate markers for cardiovascular disease or cardiometabolic health in the ODIN IPD of the RCTs using supplemental vitamin D [30]. While this analysis included data from 12 RCTs, only the 6 high-dose trials had participants with serum 25(OH)D >125 nmol/L [30].
In efforts to prevent vitamin D deficiency and improve vitamin D status in the population, national vitamin D fortification policies have been established in some countries, especially at the high latitudes (e.g., United States, Canada, Finland, Norway, and Sweden) [91]. In those countries, usually fluid milk products and/or fat spreads have been fortified [91]. In other European member states, the voluntary fortification of some food products is practiced, but the impact of this mode of fortification on the population intakes of vitamin D has been shown to be modest at best [92].
In further support of the good safety profile of vitamin D-fortified foods, the findings of low prevalence of high endpoint serum 25(OH)D concentrations, and elevated serum calcium in the ODIN RCTs, with no evidence of adverse health effects, showed that these vitamin D-fortified food products (in addition to fortified dairy products) can effectively, safely, and sustainably increase habitual vitamin D intakes, and prevent deficiency in the general population.
The main strengths of this work are that our data are based on a large collection of observational studies representing a wide range of European populations (infants, children, adolescents, adults, older adults, pregnant women, and immigrants). Importantly, the serum 25(OH)D data from these studies was standardized, enhancing the comparability across the studies [26] and limiting the impact of method-related artefactually elevated serum 25(OH)D concentrations [28]. This is also the first study, to the best of our knowledge, to report high serum 25(OH)D concentrations in a selection of RCTs, offering the highest level of scientific evidence for causality. In the case of the 20 vitamin D RCTs, serum 25(OH)D was analyzed, or, specifically, reanalyzed, by the project’s certified method. This has benefits not only for the true prevalence of serum 25(OH)D >125 nmol/L, but also for decreasing the well-established method-related variability arising from, and inherent in, IPD analyses. Nevertheless, our collection of studies within European countries limits the generalizability of our findings to other populations. Other limitations of this study include incomplete data on urinary calcium concentrations and hypercalciuria. Serum calcium concentrations were not available in some RCTs, and, for others, it was not stratified by intervention groups. Moreover, the absence of data on dietary vitamin D intakes from the majority of the cohort studies was a limitation in examining the relationship between the total vitamin D intakes and the prevalence of high endpoint serum 25(OH)D concentrations.

5. Conclusions

A consideration of all safety aspects of food-based solutions for addressing vitamin D deficiency is paramount prior to initiating public health measures. From a safety perspective, the data from across the ODIN project suggest that high serum 25(OH)D concentrations (i.e., >125 nmol/L) are relatively rare in European populations. However, the risk of high serum 25(OH)D can be increased with high-dose vitamin D supplementation (in excess of 70 µg/day (2800 IU)). In addition, high-dose vitamin D supplement use also increases the risk of exceeding the EFSA-defined UL for vitamin D, the touchstone public health safety index. The inclusion of vitamin D-(bio)fortified foods, singularly, but also in combination (which has the most benefit in terms of the prevention of vitamin D inadequacy) carries little or no risk of exceeding the UL for vitamin D, even when low-dose vitamin D supplements, up to the recommended intake value, are used in tandem.

Supplementary Materials

The following are available online at https://www.mdpi.com/article/10.3390/foods10123065/s1, Figure S1: The work packages (WP) within the ODIN vitamin D project and their workflows and interdependencies. WP1-8 reported all their safety data to WP9 as the dedicated safety WP; Table S1: Tolerable upper intake levels (ULs) for vitamin D; Table S2: Included national nutrition surveys and epidemiological cohorts/samples of European populations and prevalence of high serum 25-hydroxyvitamin D (25(OH)D) concentrations (>125 nmol/L).

Author Contributions

Conceptualization, F.A.A., S.T.I., C.L.-A., M.K. and K.D.C.; methodology, S.T.I. and C.L.-A.; validation, C.L.-A. and S.T.I.; formal analysis, M.K., K.D.C. and S.T.I.; investigation, M.K. and S.T.I.; data curation, S.T.I., T.Ö. and C.L.-A.; writing—original draft preparation, F.A.A.; writing—review and editing, F.A.A., S.T.I., C.L.-A., M.K. and K.D.C.; supervision, S.T.I. and C.L.-A.; project administration, C.L.-A. and M.K.; funding acquisition, C.L.-A., M.K. and K.D.C. All authors have read and agreed to the published version of the manuscript.

Funding

The present work was supported by funding received from the European Commission under its Seventh Framework Programme (FP7), ODIN (grant agreement no. 613977). The writing of this paper was supported by the Medicinska Understödsföreningen Liv och Hälsa and the Finnish Food Research Foundation.

Institutional Review Board Statement

Approval by a research ethics committee to conduct this analysis was not required because the aim of this study was consistent with the ethical review and approval earlier obtained, from respective local ethical review boards, for all the original studies included in this paper.

Informed Consent Statement

Informed consent from subjects was obtained in all the original studies that are included in this paper.

Data Availability Statement

Data is contained within the article and/or its supplementary material. Specific request in relation to data beyond that presented should be made to the PI (CL-A) for consideration.

Acknowledgments

The authors would like to thank their ODIN project collaborators within the consortium, for their help in acquiring and supplying the safety data throughout the project. Open access funding provided by University of Helsinki. ODIN Consortium (Work Package Leaders): Kevin Cashman, University College Cork (UCC), Ireland; Mairead Kiely, UCC, Ireland; Christel Lamberg-Allardt, University of Helsinki, Finland; Rikke Andersen, National Food Institute, Technical University of Denmark, Denmark; Christopher Sempos, Office of Dietary Supplements, National Institutes of Health (ODS-NIH), USA; Paul M. Finglas, European Food Information Resource AISBL), Belgium; Sue Lanham-New, University of Surrey, UK; Rolf Jorde, University of Tromsø, Norway.

Conflicts of Interest

The authors declare no conflict of interest. The funders had no role in the design of the study; in the collection, analyses, or interpretation of data; in the writing of the manuscript; or in the decision to publish the results.

References

  1. Rejnmark, L.; Bislev, L.S.; Cashman, K.D.; Eiríksdottir, G.; Gaksch, M.; Grübler, M.; Grimnes, G.; Gudnason, V.; Lips, P.; Pilz, S.; et al. Non-skeletal health effects of vitamin D supplementation: A systematic review on findings from meta-analyses summarizing trial data. PLoS ONE 2017, 12, e0180512. [Google Scholar] [CrossRef] [PubMed] [Green Version]
  2. Bouillon, R.; Marcocci, C.; Carmeliet, G.; Bikle, D.; White, J.H.; Dawson-Hughes, B.; Lips, P.; Munns, C.F.; Lazaretti-Castro, M.; Giustina, A.; et al. Skeletal and extraskeletal actions of Vitamin D: Current Evidence and Outstanding Questions. Endocr. Rev. 2019, 40, 1109–1151. [Google Scholar] [CrossRef] [PubMed] [Green Version]
  3. Lamberg-Allardt, C.; Brustad, M.; Meyer, H.E.; Steingrimsdottir, L. Vitamin D—A systematic literature review for the 5th edition of the Nordic Nutrition Recommendations. Food Nutr. Res. 2013, 57, 22671. [Google Scholar] [CrossRef] [PubMed] [Green Version]
  4. Pilz, S.; März, W.; Cashman, K.D.; Kiely, M.E.; Whiting, S.J.; Holick, M.F.; Grant, W.B.; Pludowski, P.; Hiligsmann, M.; Trummer, C.; et al. Rationale and plan for vitamin D food fortification: A review and guidance paper. Front. Endocrinol. (Lausanne) 2018, 9, 373. [Google Scholar] [CrossRef]
  5. O’Neill, C.M.; Kazantzidis, A.; Ryan, M.J.; Barber, N.; Sempos, C.T.; Durazo-Arvizu, R.A.; Jorde, R.; Grimnes, G.; Eiriksdottir, G.; Gudnason, V.; et al. Seasonal changes in vitamin D-effective UVB availability in Europe and associations with population serum 25-hydroxyvitamin D. Nutrients 2016, 8, 533. [Google Scholar] [CrossRef] [Green Version]
  6. Cashman, K.D.; Kiely, M.; Seamans, K.M.; Urbain, P. Effect of Ultraviolet Light-Exposed Mushrooms on Vitamin D Status: Liquid Chromatography-Tandem Mass Spectrometry Reanalysis of Biobanked Sera from a Randomized Controlled Trial and a Systematic Review plus Meta-Analysis. J. Nutr. 2016, 146, 565–575. [Google Scholar] [CrossRef] [PubMed] [Green Version]
  7. Hayes, A.; Duffy, S.; O’Grady, M.; Jakobsen, J.; Galvin, K.; Teahan-Dillon, J.; Kerry, J.; Kelly, A.; O’Doherty, J.; Higgins, S.; et al. Vitamin D-enhanced eggs are protective of wintertime serum 25-hydroxyvitamin D in a randomized controlled trial of adults. Am. J. Clin. Nutr. 2016, 104, 629–637. [Google Scholar] [CrossRef] [Green Version]
  8. Hayes, A.; Cashman, K.D. Food-based solutions for vitamin D deficiency: Putting policy into practice and the key role for research. Proc. Nutr. Soc. 2017, 76, 54–63. [Google Scholar] [CrossRef]
  9. Seamans, K.M.; Cashman, K.D. Existing and potentially novel functional markers of vitamin D status: A systematic review. Am. J. Clin. Nutr. 2009, 89, 1997S–2008S. [Google Scholar] [CrossRef] [Green Version]
  10. Autier, P.; Gandini, S.; Mullie, P. A systematic review: Influence of vitamin D supplementation on serum 25-hydroxyvitamin D concentration. J. Clin. Endocrinol. Metab. 2012, 97, 2606–2613. [Google Scholar] [CrossRef] [PubMed] [Green Version]
  11. Whiting, S.J.; Bonjour, J.-P.; Payen, F.D.; Rousseau, B. Moderate amounts of vitamin D3 in supplements are effective in raising serum 25-hydroxyvitamin D from low baseline levels in adults: A systematic review. Nutrients 2015, 7, 2311–2323. [Google Scholar] [CrossRef] [Green Version]
  12. Heaney, R.P.; Recker, R.R.; Grote, J.; Horst, R.L.; Armas, L.A. Vitamin D3 is more potent than vitamin D2 in humans. J. Clin. Endocrinol. Metab. 2011, 96, E447–E452. [Google Scholar] [CrossRef] [PubMed] [Green Version]
  13. Balachandar, R.; Pullakhandam, R.; Kulkarni, B.; Sachdev, H.S. Relative Efficacy of Vitamin D2 and Vitamin D3 in Improving Vitamin D Status: Systematic Review and Meta-Analysis. Nutrients 2012, 13, 3328. [Google Scholar] [CrossRef]
  14. Allen, L.; de Benoist, B.; Dary, O.; Hurrell, R. (Eds.) Guidelines on Food Fortification with Micronutrients; World Health Organization and Food and Agriculture Organization of the United Nations: Geneva, Switzerland, 2006; Available online: http://apps.who.int/iris/bitstream/10665/43412/1/9241594012_eng.pdf (accessed on 21 June 2021).
  15. Institute of Medicine (US) Committee to Review. Dietary Reference Intakes for Vitamin D and Calcium; Ross, A.C., Taylor, C.L., Yaktine, A.L., Del Valle, H.B., Eds.; National Academies Press: Washington, DC, USA, 2011. [Google Scholar]
  16. EFSA Panel on Dietetic Products, Nutrition and Allergies (NDA). Scientific opinion on the Tolerable Upper Intake Level of vitamin D. EFSA J. 2012, 10, 2813. [Google Scholar]
  17. EFSA NDA Panel (EFSA Panel on Dietetic Products, Nutrition and Allergies). Update of the tolerable upper intake level for vitamin D for infants. EFSA J. 2018, 16, 5365. [Google Scholar]
  18. Vieth, R. Vitamin D supplementation, 25-hydroxyvitamin D concentrations, and safety. Am. J. Clin. Nutr. 1999, 69, 842–856. [Google Scholar] [CrossRef] [Green Version]
  19. Tebben, P.J.; Singh, R.J.; Kumar, R. Vitamin D-Mediated Hypercalcemia: Mechanisms, Diagnosis, and Treatment. Endocr. Rev. 2016, 37, 521–547. [Google Scholar] [CrossRef]
  20. Marcinowska-Suchowierska, E.; Kupisz-Urbanska, M.; Lukaszkiewicz, J.; Pludowski, P.; Jones, G. Vitamin D Toxicity-A Clinical Perspective. Front. Endocrinol. 2018, 9, 550. [Google Scholar] [CrossRef] [PubMed] [Green Version]
  21. IARC (International Agency for Research on Cancer). Vitamin D and Cancer; IARC Working Group Reports; International Agency for Research on Cancer: Lyon, France, 2008; Volume 5. [Google Scholar]
  22. Cashman, K.D.; Kiely, M. Towards prevention of vitamin D deficiency and beyond: Knowledge gaps and research needs in vitamin D nutrition and public health. Br. J. Nutr. 2011, 106, 1617–1627. [Google Scholar] [CrossRef] [PubMed]
  23. Brannon, P.M. Key questions in vitamin D research. Scand. J. Clin. Lab. Investig. Suppl. 2012, 243, 154–162. [Google Scholar]
  24. Kiely, M.; Cashman, K.D. Summary Outcomes of the ODIN Project on Food Fortification for Vitamin D Deficiency Prevention. Int. J. Environ Res. Public Health 2018, 15, 2342. [Google Scholar] [CrossRef] [Green Version]
  25. Cashman, K.D.; Kiely, M. Tackling inadequate vitamin D intakes within the population: Fortification of dairy products with vitamin D may not be enough. Endocrine 2016, 51, 38–46. [Google Scholar] [CrossRef]
  26. Sempos, C.T.; Vesper, H.W.; Phinney, K.W.; Thienpont, L.M.; Coates, P.M.; Vitamin D Standardization Program (VDSP). Vitamin D status as an international issue: National surveys and the problem of standardization. Scand. J. Clin. Lab. Investig. Suppl. 2012, 243, 32–40. [Google Scholar]
  27. Cashman, K.D.; Kiely, M.; Kinsella, M.; Durazo-Arvizu, R.A.; Tian, L.; Zhang, Y.; Lucey, A.; Flynn, A.; Gibney, M.J.; Vesper, H.W.; et al. Evaluation of Vitamin D Standardization Program protocols for standardizing serum 25-hydroxyvitamin D data: A case study of the program’s potential for national nutrition and health surveys. Am. J. Clin. Nutr. 2013, 97, 1235–1242. [Google Scholar] [CrossRef] [PubMed] [Green Version]
  28. Cashman, K.D.; Hayes, A.; Galvin, K.; Merkel, J.; Jones, G.; Kaufmann, M.; Hoofnagle, A.N.; Carter, G.D.; Durazo-Arvizu, R.; Sempos, C.T. Significance of serum 24,25-dihydroxyvitamin D in the assessment of vitamin D status: A double-edged sword? Clin. Chem. 2015, 61, 636–645. [Google Scholar] [CrossRef] [Green Version]
  29. Schleicher, R.L.; Sternberg, M.R.; Looker, A.C.; Yetley, E.A.; Lacher, D.A.; Sempos, C.T.; Taylor, C.L.; Durazo-Arvizu, R.A.; Maw, K.L.; Chaudhary-Webb, M.; et al. National Estimates of Serum Total 25-Hydroxyvitamin D and Metabolite Concentrations Measured by Liquid Chromatography-Tandem Mass Spectrometry in the US Population during 2007–2010. J. Nutr. 2016, 146, 1051–1061. [Google Scholar] [CrossRef] [Green Version]
  30. Swart, K.M.; Lips, P.; Brouwer, I.A.; Jorde, R.; Heymans, M.W.; Grimnes, G.; Grubler, M.R.; Gaksch, M.; Tomaschitz, A.; Pilz, S.; et al. Effects of vitamin D supplementation on markers for cardiovascular disease and type 2 diabetes: An individual participant data meta-analysis of randomized controlled trials. Am. J. Clin. Nutr. 2018, 107, 1043–1053. [Google Scholar] [CrossRef] [PubMed]
  31. Cashman, K.D.; Wallace, J.M.W.; Muldowney, S.; Fitzgerald, A.P.; Flynn, A.; Strain, J.J.; Kiely, M.; Horigan, G.; Hill, T.R.; Barnes, M.S.; et al. Estimation of the dietary requirement for vitamin D in free-living adults > = 64 y of age. Am. J. Clin. Nutr. 2009, 89, 1366–1374. [Google Scholar] [CrossRef] [Green Version]
  32. Cashman, K.D.; Hill, T.R.; Bonham, M.P.; Duffy, E.M.; Strain, J.J.; Wallace, J.M.W.; Kiely, M.; Lucey, A.J.; Taylor, N.; Seamans, K.M.; et al. Estimation of the dietary requirement for vitamin D in healthy adults. Am. J. Clin. Nutr. 2008, 88, 1535–1542. [Google Scholar] [CrossRef] [Green Version]
  33. Muldowney, S.; Lucey, A.J.; Hill, T.R.; Seamans, K.M.; Taylor, N.; Wallace, J.M.; Horigan, G.; Barnes, M.S.; Bonham, M.P.; Duffy, E.M.; et al. Incremental cholecalciferol supplementation up to 15 mug/d throughout winter at 51-55o N has no effect on biomarkers of cardiovascular risk in healthy young and older adults. J. Nutr. 2012, 142, 1519–1525. [Google Scholar] [CrossRef] [PubMed] [Green Version]
  34. Mortensen, C.; Damsgaard, C.T.; Hauger, H.; Ritz, C.; Lanham-New, S.A.; Smith, T.J.; Hennessy, Á.; Dowling, K.; Cashman, K.D.; Kiely, M.; et al. Estimation of the dietary requirement for vitamin D in white children aged 4–8 y: A randomized, controlled, dose-response trial. Am. J. Clin. Nutr. 2016, 104, 1310–1317. [Google Scholar] [CrossRef] [PubMed] [Green Version]
  35. Smith, T.J.; Tripkovic, L.; Damsgaard, C.T.; Molgaard, C.; Ritz, C.; Wilson-Barnes, S.L.; Dowling, K.G.; Hennessy, Á.; Cashman, K.D.; Kiely, M.; et al. Estimation of the dietary requirement for vitamin D in adolescents aged 14–18 y: A dose-response, double-blind, randomized placebo-controlled trial. Am. J. Clin. Nutr. 2016, 104, 1301–1309. [Google Scholar] [CrossRef] [PubMed] [Green Version]
  36. O’Callaghan, K.M.; Hennessy, Á.; Hull, G.L.; Healy, K.; Ritz, C.; Kenny, L.C.; Cashman, K.D.; Kiely, M.E. Estimation of the maternal vitamin D intake that maintains circulating 25-hydroxyvitamin D in late gestation at a concentration sufficient to keep umbilical cord sera 25–30 nmol/L: A dose-response, double-blind, randomized placebo-controlled trial in pregnant women at northern latitude. Am. J. Clin. Nutr. 2018, 108, 77–91. [Google Scholar] [PubMed] [Green Version]
  37. Adebayo, F.A.; Itkonen, S.T.; Öhman, T.; Skaffari, E.; Saarnio, E.M.; Erkkola, M.; Cashman, K.D.; Lamberg-Allardt, C. Vitamin D intake, serum 25-hydroxyvitamin D status and response to moderate vitamin D3 supplementation: A randomised controlled trial in East African and Finnish women. Br. J. Nutr. 2018, 119, 431–441. [Google Scholar] [CrossRef] [Green Version]
  38. Chel, V.; Wijnhoven, H.A.; Smit, J.H.; Ooms, M.; Lips, P. Efficacy of different doses and time intervals of oral vitamin D supplementation with or without calcium in elderly nursing home residents. Osteoporos. Int. 2008, 19, 663–671. [Google Scholar]
  39. Wicherts, I.S.; Boeke, A.J.; van der Meer, I.M.; van Schoor, N.M.; Knol, D.L.; Lips, P. Sunlight exposure or vitamin D supplementation for vitamin D-deficient non-western immigrants: A randomized clinical trial. Osteoporos. Int. 2011, 22, 873–882. [Google Scholar] [CrossRef] [Green Version]
  40. Oosterwerff, M.M.; Eekhoff, E.M.; Van Schoor, N.M.; Boeke, A.J.; Nanayakkara, P.; Meijnen, R.; Knol, D.L.; Kramer, M.H.; Lips, P. Effect of moderate-dose vitamin D supplementation on insulin sensitivity in vitamin D-deficient non-Western immigrants in the Netherlands: A randomized placebo-controlled trial. Am. J. Clin. Nutr. 2014, 100, 152–160. [Google Scholar] [CrossRef]
  41. Pilz, S.; Gaksch, M.; Kienreich, K.; Grubler, M.; Verheyen, N.; Fahrleitner-Pammer, A.; Treiber, G.; Drechsler, C.; O Hartaigh, B.; Obermayer-Pietsch, B.; et al. Effects of vitamin D on blood pressure and cardiovascular risk factors: A randomized controlled trial. Hypertension 2015, 65, 1195–1201. [Google Scholar]
  42. Sollid, S.T.; Hutchinson, M.Y.; Fuskevag, O.M.; Figenschau, Y.; Joakimsen, R.M.; Schirmer, H.; Njolstad, I.; Svartberg, J.; Kamycheva, E.; Jorde, R. No effect of high-dose vitamin D supplementation on glycemic status or cardiovascular risk factors in subjects with prediabetes. Diabetes Care 2014, 37, 2123–2131. [Google Scholar] [CrossRef] [Green Version]
  43. Sneve, M.; Figenschau, Y.; Jorde, R. Supplementation with cholecalciferol does not result in weight reduction in overweight and obese subjects. Eur. J. Endocrinol. 2008, 159, 675–684. [Google Scholar] [CrossRef]
  44. Jorde, R.; Sneve, M.; Torjesen, P.; Figenschau, Y. No improvement in cardiovascular risk factors in overweight and obese subjects after supplementation with vitamin D3 for 1 year. J. Intern Med. 2010, 267, 462–4672. [Google Scholar] [CrossRef]
  45. Beilfuss, J.; Berg, V.; Sneve, M.; Jorde, R.; Kamycheva, E. Effects of a 1-year supplementation with cholecalciferol on interleukin-6, tumor necrosis factor-alpha and insulin resistance in overweight and obese subjects. Cytokine 2012, 60, 870–874. [Google Scholar] [CrossRef] [PubMed]
  46. Grimnes, G.; Figenschau, Y.; Almas, B.; Jorde, R. Vitamin D, insulin secretion, sensitivity, and lipids: Results from a case-control study and a randomized controlled trial using hyperglycemic clamp technique. Diabetes 2011, 60, 2748–2757. [Google Scholar] [CrossRef] [Green Version]
  47. Kjaergaard, M.; Waterloo, K.; Wang, C.E.; Almas, B.; Figenschau, Y.; Hutchinson, M.S.; Svartberg, J.; Jorde, R. Effect of vitamin D supplement on depression scores in people with low levels of serum 25-hydroxyvitamin D: Nested case-control study and randomised clinical trial. Br. J. Psychiatry 2012, 201, 360–368. [Google Scholar] [CrossRef] [PubMed] [Green Version]
  48. Grimnes, G.; Joakimsen, R.; Figenschau, Y.; Torjesen, P.A.; Almas, B.; Jorde, R. The effect of high-dose vitamin D on bone mineral density and bone turnover markers in postmenopausal women with low bone mass—A randomized controlled 1-year trial. Osteoporos. Int. 2012, 23, 201–211. [Google Scholar] [CrossRef]
  49. Wamberg, L.; Kampmann, U.; Stodkilde-Jorgensen, H.; Rejnmark, L.; Pedersen, S.B.; Richelsen, B. Effects of vitamin D supplementation on body fat accumulation, inflammation, and metabolic risk factors in obese adults with low vitamin D levels—Results from a randomized trial. Eur. J. Intern Med. 2013, 24, 644–649. [Google Scholar] [CrossRef] [PubMed]
  50. Wamberg, L.; Pedersen, S.B.; Richelsen, B.; Rejnmark, L. The effect of high-dose vitamin D supplementation on calciotropic hormones and bone mineral density in obese subjects with low levels of circulating 25-hydroxyvitamin d: Results from a randomized controlled study. Calcif. Tissue Int. 2013, 93, 69–77. [Google Scholar] [CrossRef]
  51. Urbain, P.; Singler, F.; Ihorst, G.; Biesalski, H.K.; Bertz, H. Bioavailability of vitamin D2 from UV-B-irradiated button mushrooms in healthy adults deficient in serum 25-hydroxyvitamin D: A randomized controlled trial. Eur. J. Clin. Nutr. 2011, 65, 965–971. [Google Scholar] [CrossRef] [Green Version]
  52. Itkonen, S.T.; Skaffari, E.; Saaristo, P.; Saarnio, E.M.; Erkkola, M.; Jakobsen, J.; Cashman, K.D.; Lamberg-Allardt, C. Effects of vitamin D2-fortified bread v. supplementation with vitamin D2 or D3 on serum 25-hydroxyvitamin D metabolites: An 8-week randomised-controlled trial in young adult Finnish women. Br. J. Nutr. 2016, 115, 1232–1239. [Google Scholar] [CrossRef] [Green Version]
  53. Manios, Y.; Moschonis, G.; Mavrogianni, C.; van den Heuvel, E.; Singh-Povel, C.M.; Kiely, M.; Cashman, K.D. Reduced-fat Gouda-type cheese enriched with vitamin D3 effectively prevents vitamin D deficiency during winter months in postmenopausal women in Greece. Eur. J. Nutr. 2017, 56, 2367–2377. [Google Scholar] [CrossRef] [PubMed]
  54. Grønborg, I.M.; Tetens, I.; Christensen, T.; Andersen, E.W.; Jakobsen, J.; Kiely, M.; Cashman, K.D.; Andersen, R. Vitamin D-fortified foods improve wintertime vitamin D status in women of Danish and Pakistani origin living in Denmark: A randomized controlled trial. Eur. J. Nutr. 2020, 59, 741–753. [Google Scholar] [CrossRef] [PubMed] [Green Version]
  55. Moreno, L.A.; De Henauw, S.; González-Gross, M.; Kersting, M.; Molnár, D.; Gottrand, F.; Barrios, L.; Sjöström, M.; Manios, Y.; Gilbert, C.C.; et al. Design and implementation of the Healthy Lifestyle in Europe by Nutrition in Adolescence Cross-Sectional Study. Int. J. Obes. (Lond.) 2008, 32, S4–S11. [Google Scholar] [CrossRef] [PubMed] [Green Version]
  56. González-Gross, M.; Valtueña, J.; Breidenassel, C.; Moreno, L.A.; Ferrari, M.; Kersting, M.; De Henauw, S.; Gottrand, F.; Azzini, E.; Widhalm, K.; et al. Vitamin D status among adolescents in Europe: The Healthy Lifestyle in Europe by Nutrition in Adolescence study. Br. J. Nutr. 2012, 107, 755–764. [Google Scholar] [CrossRef] [PubMed]
  57. Damsgaard, C.T.; Dalskov, S.M.; Petersen, R.A.; Sørensen, L.B.; Mølgaard, C.; Biltoft-Jensen, A.; Andersen, R.; Thorsen, A.V.; Tetens, I.; Sjödin, A.; et al. Design of the OPUS School Meal Study: A randomised controlled trial assessing the impact of serving school meals based on the New Nordic Diet. Scand. J. Public Health 2012, 40, 693–703. [Google Scholar] [CrossRef] [Green Version]
  58. Damsgaard, C.T.; Dalskov, S.-M.; Laursen, R.P.; Ritz, C.; Hjorth, M.F.; Lauritzen, L.; Louise, B.S.; Petersen, R.A.; Andersen, M.R.; Stender, S.; et al. Provision of healthy school meals does not affect the metabolic syndrome score in 8-11-year-old children, but reduces cardiometabolic risk markers despite increasing waist circumference. Br. J. Nutr. 2014, 112, 1826–1836. [Google Scholar]
  59. Oberg, J.; Jorde, R.; Almas, B.; Emaus, N.; Grimnes, G. Vitamin D deficiency and lifestyle risk factors in a Norwegian adolescent population. Scand. J. Public Health 2014, 42, 593–602. [Google Scholar] [CrossRef]
  60. Winther, A.; Dennison, E.; Ahmed, L.A.; Furberg, A.S.; Grimnes, G.; Jorde, R.; Gjesdal, C.G.; Emaus, N. The Tromsø Study: Fit Futures: A study of Norwegian adolescents’ lifestyle and bone health. Arch. Osteoporos. 2014, 9, 185. [Google Scholar]
  61. The Tromsø Study: UiT the Artic University of Norway. Available online: https://uit.no/research/tromsostudy (accessed on 29 April 2021).
  62. Moschonis, G.; Tanagra, S.; Vandorou, A.; Kyriakou, A.E.; Dede, V.; Siatitsa, P.E.; Koumpitski, A.; Androutsos, O.; Grammatikaki, E.; Kantilafti, M.; et al. Social, economic and demographic correlates of overweight and obesity in primary-school children: Preliminary data from the Healthy Growth Study. Public Health Nutr. 2010, 13, 1693–1700. [Google Scholar] [CrossRef] [Green Version]
  63. McBride, D.; Keil, T.; Grabenhenrich, L.; Dubakiene, R.; Drasutiene, G.; Fiocchi, A.; Dahdah, L.; Sprikkelman, A.B.; Schoemaker, A.A.; Roberts, G.; et al. The EuroPrevall birth cohort study on food allergy: Baseline characteristics of 12,000 newborns and their families from nine European countries. Pediatr. Allergy Immunol. 2012, 23, 230–239. [Google Scholar] [CrossRef]
  64. Kiely, M.; O’Donovan, S.M.; Kenny, L.C.; Hourihane, J.O.; Irvine, A.D.; Murray, D.M. Vitamin D metabolite concentrations in umbilical cord blood serum and associations with clinical characteristics in a large prospective mother-infant cohort in Ireland. J. Steroid Biochem. Mol. Biol. 2017, 167, 162–168. [Google Scholar] [CrossRef]
  65. Ní Chaoimh, C.; McCarthy, E.K.; Hourihane, J.O.; Kenny, L.C.; Irvine, A.D.; Murray, D.M.; Kiely, M.E. Low vitamin D deficiency in Irish toddlers despite northerly latitude and a high prevalence of inadequate intakes. Eur. J. Nutr. 2018, 57, 783–794. [Google Scholar] [CrossRef]
  66. Kurth, B.-M.; Kamtsiuris, P.; Hölling, H.; Schlaud, M.; Dölle, R.; Ellert, U.; Kahl, H.; Knopf, H.; Lange, M.; Mensink, G.B.; et al. The challenge of comprehensively mapping children’s health in a nation-wide health survey: Design of the German KiGGS-Study. BMC Public Health 2008, 8, 196. [Google Scholar] [CrossRef] [Green Version]
  67. Public Health England and Food Standards Agency. National Diet and Nutrition Survey Results from Years 1 to 4 (combined) of the Rolling Programme (2008/2009–2011/2012). 2014. Available online: https://www.gov.uk/government/statistics/national-diet-and-nutrition-survey-results-from-years-1-to-4-combined-of-the-rolling-programme-for-2008-and-2009-to-2011-and-2012 (accessed on 29 April 2021).
  68. Scheidt-Nave, C.; Kamtsiuris, P.; Gößwald, A.; Hölling, H.; Lange, M.; Busch, M.A.; Dahm, S.; Dölle, R.; Ellert, U.; Fuchs, J.; et al. German health interview and examination survey for adults (DEGS)—design, objectives and implementation of the first data collection wave. BMC Public Health 2012, 12, 730. [Google Scholar] [CrossRef] [PubMed] [Green Version]
  69. Kamtsiuris, P.; Lange, M.; Hoffmann, R.; Schaffrath Rosario, A.; Dahm, S.; Kuhnert, R.; Kurth, B.M. The first wave of the German Health Interview and Examination Survey for Adults (DEGS1): Sample design, response, weighting and representativeness. Bundesgesundheitsblatt Gesundheitsforschung Gesundheitsschutz 2013, 56, 620–630. [Google Scholar] [CrossRef] [PubMed]
  70. Grimnes, G.; Almaas, B.; Eggen, A.E.; Emaus, N.; Figenschau, Y.; Hopstock, L.A.; Hutchinson, M.S.; Methlie, P.; Mihailova, A.; Sneve, M.; et al. Effect of smoking on the serum levels of 25-hydroxyvitamin D depends on the assay employed. Eur. J. Endocrinol. 2010, 163, 339–348. [Google Scholar] [CrossRef] [PubMed] [Green Version]
  71. Jacobsen, B.K.; Eggen, A.E.; Mathiesen, E.B.; Wilsgaard, T.; Njølstad, I. Cohort profile: The Tromsø Study. Int. J. Epidemiol. 2012, 41, 961–967. [Google Scholar] [CrossRef] [PubMed]
  72. Eggen, A.E.; Mathiesen, E.B.; Wilsgaard, T.; Jacobsen, B.K.; Njølstad, I. The sixth survey of the Tromsø Study (Tromsø 6) in 2007–08: Collaborative research in the interface between clinical medicine and epidemiology: Study objectives, design, data collection procedures, and attendance in a multipurpose population-based health survey. Scand. J. Public Health 2013, 41, 65–80. [Google Scholar]
  73. van ’t Riet, E.; Alssema, M.J.; Rijkelijkhuizen, J.M.; Kostense, P.J.; Nijpels, G.; Dekker, J.M. Relationship between A1C and glucose levels in the general Dutch population: The new Hoorn study. Diabetes Care 2010, 33, 61–66. [Google Scholar] [CrossRef] [PubMed] [Green Version]
  74. Huisman, M.; Poppelaars, J.L.; van der Horst, M.H.L.; Beekman, A.T.F.; Brug, J.; van Tilburg, T.G.; Deeg, D.J.H. Cohort profile: The Longitudinal Aging Study Amsterdam. Int. J. Epidemiol. 2011, 40, 868–876. [Google Scholar] [CrossRef] [Green Version]
  75. Harris, T.B.; Launer, L.J.; Eiriksdottir, G.; Kjartansson, O.; Jonsson, P.V.; Sigurdsson, G.; Thorgeirsson, G.; Aspelund, T.; Garcia, M.E.; Cotch, M.F.; et al. Age, Gene/Environment Susceptibility–Reykjavik Study: Multidisciplinary applied phenomics. Am. J. Epidemiol. 2007, 165, 1076–1087. [Google Scholar] [CrossRef] [Green Version]
  76. Tiittala, P.J.; Kivelä, P.S.; Ristola, M.A.; Surcel, H.M.; Koponen, P.M.; Mölsä, M.; Ollgren, J.; Liitsola, K. Achieving high acceptability of HIV testing in a population-based survey among immigrants in Finland. Scand. J. Public Health 2015, 43, 393–398. [Google Scholar] [CrossRef]
  77. Finnish Institute for Health and Welfare. Migrant Health and Wellbeing Study (Maamu). 2021. Available online: https://www.thl.fi/fi/web/thlfi-en/research-and-expertwork/population-studies/migrant-health-and-wellbeing-study-maamu- (accessed on 29 April 2021).
  78. Cashman, K.D.; Dowling, K.G.; Skrabakova, Z.; Gonzalez-Gross, M.; Valtuena, J.; De Henauw, S.; Moreno, L.; Damsgaard, C.T.; Michaelsen, K.F.; Molgaard, C.; et al. Vitamin D deficiency in Europe—Pandemic? Am. J. Clin. Nutr. 2016, 103, 1033–1044. [Google Scholar] [CrossRef] [PubMed] [Green Version]
  79. Kiely, M.E.; Zhang, J.Y.; Kinsella, M.; Khashan, A.S.; Kenny, L.C. Vitamin D status is associated with uteroplacental dysfunction indicated by pre-eclampsia and small-for-gestational-age birth in a large prospective pregnancy cohort in Ireland with low vitamin D status. Am. J. Clin. Nutr. 2016, 104, 354–361. [Google Scholar] [CrossRef] [PubMed] [Green Version]
  80. Bärebring, L.; Schoenmakers, I.; Glantz, A.; Hulthén, L.; Jagner, Å.; Ellis, J.; Bärebring, M.; Bullarbo, M.; Augustin, H. Vitamin D Status during Pregnancy in a Multi-Ethnic Population-Representative Swedish Cohort. Nutrients 2016, 22, 655. [Google Scholar] [CrossRef] [PubMed] [Green Version]
  81. Gaksch, M.; Jorde, R.; Grimnes, G.; Joakimsen, R.; Schirmer, H.; Wilsgaard, T.; Mathiesen, E.B.; Njolstad, I.; Lochen, M.L.; Marz, W.; et al. Vitamin D and mortality: Individual participant data meta-analysis of standardized 25-hydroxyvitamin D in 26916 individuals from a European consortium. PLoS ONE 2017, 12, e0170791. [Google Scholar]
  82. Appel, L.J.; Michos, E.D.; Mitchell, C.M.; Blackford, A.L.; Sternberg, A.L.; Miller, E.R., 3rd; Juraschek, S.P.; Schrack, J.A.; Szanton, S.L.; Charleston, J.; et al. The Effects of Four Doses of Vitamin D Supplements on Falls in Older Adults: A Response-Adaptive, Randomized Clinical Trial. Ann. Intern Med. 2021, 174, 145–156. [Google Scholar] [CrossRef] [PubMed]
  83. Jääskeläinen, T.; Itkonen, S.T.; Lundqvist, A.; Erkkola, M.; Koskela, T.; Lakkala, K.; Dowling, K.G.; Hull, G.L.; Kroger, H.; Karppinen, J.; et al. The positive impact of general vitamin D food fortification policy on vitamin D status in a representative adult Finnish population—Evidence from an 11-year follow-up based on standardized 25-hydroxyvitamin D data. Am. J. Clin. Nutr. 2017, 105, 1512–1520. [Google Scholar] [CrossRef] [Green Version]
  84. Rippin, H.L.; Hutchinson, J.; Evans, C.E.L.; Jewell, J.; Breda, J.J.; Cade, J.E. National nutrition surveys in Europe: A review on the current status in the 53 countries of the WHO European region. Food Nutr. Res. 2018, 62. [Google Scholar] [CrossRef] [Green Version]
  85. Durazo-Arvizu, R.A.; Dawson-Hughes, B.; Kramer, H.; Cao, G.; Merkel, J.; Coates, P.M.; Sempos, C.T. The Reverse J-Shaped Association Between Serum Total 25-Hydroxyvitamin D Concentration and All-Cause Mortality: The Impact of Assay Standardization. Am. J. Epidemiol. 2017, 185, 720–726. [Google Scholar] [CrossRef]
  86. Grant, W.B.; Karras, S.N.; Bischoff-Ferrari, H.A.; Annweiler, C.; Boucher, B.J.; Juzeniene, A.; Garland, C.F.; Holick, M.F. Do studies reporting ‘U’-shaped serum 25-hydroxyvitamin D-health outcome relationships reflect adverse effects? Dermato-Endocrinol. 2016, 8, e1187349. [Google Scholar] [CrossRef] [Green Version]
  87. Kroll, M.H.; Bi, C.; Garber, C.C.; Kaufman, H.W.; Liu, D.; Caston-Balderrama, A.; Zhang, K.; Clarke, N.; Xie, M.; Reitz, R.E.; et al. Temporal Relationship between Vitamin D Status and Parathyroid Hormone in the United States. PLoS ONE 2015, 10, e0118108. [Google Scholar] [CrossRef] [PubMed]
  88. Burt, L.A.; Billington, E.O.; Rose, M.S.; Raymond, D.A.; Hanley, D.A.; Boyd, S.K. Effect of High-Dose Vitamin D Supplementation on Volumetric Bone Density and Bone Strength: A Randomized Clinical Trial. JAMA 2019, 322, 736–745. [Google Scholar] [CrossRef]
  89. Mo, M.; Wang, S.; Chen, Z.; Muyiduli, X.; Wang, S.; Shen, Y.; Shao, B.; Li, M.; Chen, D.; Chen, Z.; et al. A systematic review and meta-analysis of the response of serum 25-hydroxyvitamin D concentration to vitamin D supplementation from RCTs from around the globe. Eur. J. Clin. Nutr. 2019, 73, 816–834. [Google Scholar] [CrossRef]
  90. Malihi, Z.; Wu, Z.; Stewart, A.W.; Lawes, C.M.; Scragg, R. Hypercalcemia, hypercalciuria, and kidney stones in long-term studies of vitamin D supplementation: A systematic review and meta-analysis. Am. J. Clin. Nutr. 2016, 104, 1039–1051. [Google Scholar] [CrossRef] [PubMed] [Green Version]
  91. Itkonen, S.T.; Erkkola, M.; Lamberg-Allardt, C.J.E. Vitamin D fortification of fluid milk products and their contribution to vitamin D intake and vitamin D status in observational studies—A review. Nutrients 2018, 10, 1054. [Google Scholar] [CrossRef] [PubMed] [Green Version]
  92. Black, L.J.; Walton, J.; Flynn, A.; Cashman, K.D.; Kiely, M. Small Increments in Vitamin D Intake by Irish Adults over a Decade Show That Strategic Initiatives to Fortify the Food Supply Are Needed. J. Nutr. 2015, 145, 969–976. [Google Scholar] [CrossRef] [PubMed] [Green Version]
Table 1. Characteristics of the included randomized controlled trials within ODIN safety work.
ReferencesCountryTotal nAge (Yrs)Sex: %
Female
Population GroupDuration of
Intervention
Intervention Groups
Cashman et al., 2009 *,
Muldowney et al., 2012 *
Ireland200≥6459.2Adults22 wkPlacebo-controlled
Vitamin D3 Supplements (5 or 10 or 15 µg/d)
Cashman et al., 2008 *,
Muldowney et al., 2012 *
Ireland21420–4050.0Adults22 wkPlacebo-controlled
Vitamin D3 Supplements (5 or 10 or 15 µg/d)
Mortensen et al., 2016 **Denmark1194–853.1Children20 wkPlacebo-controlled
Vitamin D3 Supplements (10 or 20 µg/d)
Smith et al., 2016 **UK10514–1857.3Adolescents20 wkPlacebo-controlled
Vitamin D3 Supplements (10 or 20 µg/d)
O’Callaghan et al., 2018 **Ireland14421–41100Pregnant women25 wkPlacebo-controlled
Vitamin D3 Supplements (10 or 20 µg/d)
Adebayo et al., 2018 **Finland12521–64100Ethnic women5 moPlacebo-controlled
Vitamin D3 Supplements (10 or 20 µg/d)
Chel et al., 2008 *Netherlands273>70 years77.4Nursing home residents4 moPlacebo-controlled
Vitamin D3 Supplements (15 µg/d)
Wicherts et al., 2011 *Netherlands14818–6574.8Non-western immigrants, 25(OH)D <25 nmol/L6 moPlacebo-controlled
Vitamin D3 Supplements (20 µg/d)
Oosterwerff et al., 2014 *Netherlands11020–6560.0Non-western immigrants,
prediabetic, with 25(OH)D
<50 nmol/L
16 wkPlacebo-controlled
Vitamin D3 Supplements (30 µg/d)
Pilz et al., 2015 *Austria187≥1847.0Persons with history of arterial
hypertension, 25(OH)D
<75 nmol/L
8 wkPlacebo-controlled
Vitamin D3 Supplements (70 µg/d)
Sollid et al., 2014 *Norway48421–8038.6Persons with IGT and/or IFG1yrPlacebo-controlled
Vitamin D3 Supplements (71 µg/d)
Sneve et al., 2008 *,
Jorde et al., 2010 *,
Beilfuss et al., 2012 *
Norway33421-7064.2Persons with high BMI1 yrPlacebo-controlled
Vitamin D3 Supplements (71 or 143 µg/d)
Grimnes et al., 2011 *Norway9330–7549.5Persons with 25(OH)D
<42 nmol/L
6 moPlacebo-controlled
Vitamin D3 Supplements (143 µg/d)
Kjaergaard et al., 2012 *Norway23030–7554.7Persons with 25(OH)D
<55 nmol/L
6 moPlacebo-controlled
Vitamin D3 Supplements (143 µg/d)
Grimnes et al., 2012 *Norway27550–80100Women with low BMD1 yrPlacebo-controlled
Vitamin D3 Supplements (163 µg/d)
Wamberg et al., 2013 *
Denmark4318–5071.2Persons with high BMI, 25(OH)D <50 nmol/L6 moPlacebo-controlled
Vitamin D3 Supplements (175 µg/d)
Urbain et al., 2011 *Germany26≤4565Adults4 wkPlacebo-controlled
Vitamin D2-enriched mushrooms
or D2 supplement (700 µg/wk)
Itkonen et al., 2016 **Finland3720–37100Adults8 wkPlacebo-controlled
Vitamin D2-enriched bread
or D2 supplement (25 µg/d) or D3 (25 µg/d)
Manios et al., 2017 **Greece7955–75100Adults20 wkPlacebo-controlled
Vitamin D3-enriched Gouda cheese (5.7 µg/d)
Grønborg et al., 2020 **Denmark12718–50100Ethnic women3 moPlacebo-controlled
Vitamin D3-enriched food (20 µg/d)
* Reanalyzed 25(OH)D; ** 25(OH)D analyzed de novo; µg/d, µg/day; IGT, impaired glucose tolerance; IFG, impaired fasting glucose; BMI, body mass index; BMD, bone mineral density; wk, weeks; mo, months; yr, year.
Table 2. Prevalence of serum 25-hydroxyvitamin D (S-25(OH)D) >125 nmol/L at baseline and at endpoint in ODIN RCTs, stratified by vitamin D intervention and dose.
ReferencesPopulation
Group
Duration of
Intervention
Intervention
Groups
Prevalence (%) of S-25(OH)D
>125 nmol/L (n/Total n)
BaselineEndpoint
Vitamin D supplementation RCTs—Supplemental vitamin D3 dose ≤70 µg/d
Cashman et al., 2009 *,
Muldowney et al., 2012 *
Persons >63 years of age22 wk0 µg of vitamin D300
5 µg of vitamin D300
10 µg of vitamin D300
15 µg of vitamin D300
Cashman et al., 2008 *,
Muldowney et al., 2012 *
Persons 20–40 years of age22 wk0 µg of vitamin D31.8 (1/56)0
5 µg of vitamin D300
10 µg of vitamin D31.8 (1/57)0
15 µg of vitamin D31.9 (1/52)0
Mortensen et al., 2016 **Children20 wk0 µg of vitamin D300
10 µg of vitamin D300
20 µg of vitamin D300
Smith et al., 2016 **Adolescents20 wk0 µg of vitamin D300
10 µg of vitamin D300
20 µg of vitamin D302.6 (1/38)
O’Callaghan et al., 2018 **Pregnant women25 wk0 µg of vitamin D300
10 µg of vitamin D3013.5 (5/37)
20 µg of vitamin D3013.6 (6/44)
Adebayo et al., 2018 **Women of East African descent5 mo0 µg of vitamin D300
10 µg of vitamin D300
20 µg of vitamin D308.3 (1/12)
Women of Finnish descent0 µg of vitamin D300
10 µg of vitamin D300
20 µg of vitamin D300
Chel et al., 2008 *Nursing home residents >70 years of age4 mo0 µg of vitamin D300
15 µg of vitamin D300
Wicherts et al., 2011 *Non-western immigrants with 25(OH)D
values <25 nmol/L
6 mo0 µg of vitamin D300
20 µg of vitamin D300
Oosterwerff et al., 2014 *Non-western immigrants with pre-diabetes and 25(OH)D values <50 nmol/L16 wk 0 µg of vitamin D300
30 µg of vitamin D300
Pilz et al., 2015 *Persons with a history of arterial hypertension and 25(OH)D values <75 nmol/L8 wk0 µg of vitamin D300
70 µg of vitamin D300
Vitamin D supplementation RCTs—Supplemental vitamin D3 dose ≥71 µg/d
Sollid et al., 2014 *Persons with IGT and/or IFG1 yr0 µg of vitamin D30.4 (1/255)0.8 (2/242)
71 µg of vitamin D30.4 (1/256)7.0 (17/242)
Sneve et al., 2008 *,
Jorde et al., 2010 *,
Beilfuss et al., 2012 *
Persons with a high BMI1 yr0 µg of vitamin D300
71 µg of vitamin D3011.3 (12/106)
143 µg of vitamin D3053.4 (62/116)
Grimnes et al., 2011 *Persons with 25(OH)D values <42 nmol/L6 mo0 µg of vitamin D300
143 µg of vitamin D3046.9 (23/49)
Kjaergaard et al., 2012 *Persons with 25(OH)D values <55 nmol/L6 mo0 µg of vitamin D300
143 µg of vitamin D3049.2 (59/120)
Grimnes et al., 2012 *Women with a low BMD1 yr0 µg of vitamin D30.7 (1/148)0
163 µg of vitamin D31.3 (2/149)91.9 (125/136)
Wamberg et al., 2013 *
Persons with a high BMI and 25(OH)D values <50 nmol/L6 mo0 µg of vitamin D33.8 (1/26)0
175 µg of vitamin D3031.8 (7/22)
Vitamin D fortified food based RCTs
Urbain et al., 2011 *Adults4 wkPlacebo-controlled00
D2-enriched mushrooms providing
700 µg of vitamin D2 weekly
00
D2 supplement providing
700 µg of vitamin D2 weekly
00
Itkonen et al., 2016 **Adults8 wkPlacebo-controlled00
D2-enriched bread providing
25 µg of vitamin D2 daily
00
D2 supplement providing
25 µg of vitamin D2 daily
00
D3 supplement providing 25 µg
of vitamin D3 daily
00
Manios et al., 2017 **Adults20 wkPlacebo-controlled00
D3-enriched Gouda cheese providing
5.7 µg of vitamin D3 daily
00
Grønborg et al., 2020 **Women of Pakistani descent3 moPlacebo-controlled00
D3-enriched food providing 20 µg
of vitamin D3 daily
2.9 (1/35)2.9 (1/35)
Women of Danish descentPlacebo-controlled00
D3-enriched food providing 20 µg
of vitamin D3 daily
02.7 (1/37)
S-25(OH)D, serum 25-hydroxyvitamin D concentration; RCTs, randomized controlled trials; * Reanalyzed 25(OH)D; ** 25(OH)D analyzed de novo; µg/d, µg/day; IGT, impaired glucose tolerance; IFG, impaired fasting glucose; BMI, body mass index; BMD, bone mineral density; wk, weeks; mo, months; yr, year.
Table 3. Prevalence of high serum calcium (S-Ca) concentrations in ODIN RCTs.
ReferencesPopulation GroupType of
Intervention
Upper Limit (UL) of
Reference Range for
S-Ca (mmol/L)
Number of Subjects with
S-Ca >UL Out of
Total Number of Subjects
Prevalence (%) of Subjects
Exceeding Upper Limit of
Reference Range of S-Ca
Highest S-Ca
Concentration
mmol/L if >UL
Vitamin D supplementation RCTs—Supplemental vitamin D3 dose ≤70 µg/d
Cashman et al., 2009 *,
Muldowney et al., 2012 *
Persons of age > 63 yrsVitamin D32.601/2000.5NA
Cashman et al., 2008 *,
Muldowney et al., 2012 *
Persons of age 20–40 yrsVitamin D32.600/2140NA
Mortensen et al., 2016 **ChildrenVitamin D3>2.7000
Smith et al., 2016 **AdolescentsVitamin D32.5000
O’Callaghan et al., 2018 **Pregnant womenVitamin D32.63000
Adebayo et al., 2018 **Ethnic womenVitamin D32.659/147 (baseline)
2/125 (endpoint)
6.1 (baseline)
1.6 (endpoint)
2.82 (baseline)
2.74 (endpoint)
Chel et al., 2008 *Nursing home residents,
age >70 years
Vitamin D3NANANANA
Wicherts et al., 2011 *Non-western immigrants, 25(OH)D <25 nmol/LVitamin D32.601/1120.9NA
Oosterwerff et al., 2014 *Non-western immigrants,
prediabetic, with 25(OH)D
<50 nmol/L
Vitamin D3 ***2.600/1100NA
Pilz et al., 2015 *Persons with history of arterial hypertension, 25(OH)D
<75 nmol/L
Vitamin D32.553/1881.6NA
Vitamin D supplementation RCTs—Supplemental vitamin D3 dose ≥71 µg/d
Sollid et al., 2014 *Persons with IGT and/or IFGVitamin D3 ***2.600/4840NA
Sneve et al., 2008 *,
Jorde et al., 2010 *,
Beilfuss et al., 2012 *
Persons with high BMIVitamin D32.600/3340NA
Grimnes et al., 2011 *Persons with 25(OH)D
<42 nmol/L
Vitamin D32.600/940NA
Kjaergaard et al., 2012 *Persons with 25(OH)D
<55 nmol/L
Vitamin D32.551/2300.4NA
Grimnes et al., 2012 *Women with low BMDVitamin D3 ***2.558/2752.9NA
Wamberg et al., 2013 *
Persons with high BMI, 25(OH)D <50 nmol/LVitamin D3NANANANA
Vitamin D fortified food based RCTs
Urbain et al., 2011 *AdultsD2-enriched mushrooms>2.7000
Itkonen et al., 2016 **AdultsD2-enriched bread, vitamin D2 and D3 supplements2.651/37 (endpoint)2.7 (endpoint)2.86 (endpoint)
Manios et al., 2017 **AdultsD3-enriched Gouda cheeseNANANANA
Grønborg et al., 2020 **Ethnic womenD3-enriched food2.559/127 (Baseline)
13/127 (endpoint)
7.1 (baseline)
10.2 (endpoint)
2.67 (Baseline)
S-Ca, serum calcium concentration; RCTs, randomized controlled trials; * Reanalyzed RCT with endpoint data only; ** 25(OH)D analyzed de novo; µg/d, µg/day; IGT, impaired glucose tolerance; IFG, impaired fasting glucose; BMI, body mass index; BMD, bone mineral density; *** Intervention groups receiving calcium; NA, not available.
Publisher’s Note: MDPI stays neutral with regard to jurisdictional claims in published maps and institutional affiliations.

