Article

Lipid Compositions and Geographical Discrimination of 94 Geographically Authentic Wheat Samples Based on UPLC-MS with Non-Targeted Lipidomic Approach

1
Institute of Food and Nutraceutical Science, School of Agriculture and Biology, Shanghai Jiao Tong University, Shanghai 200240, China
2
Department of Nutrition and Food Science, University of Maryland, College Park, MD 20742, USA
*
Author to whom correspondence should be addressed.
Foods 2021, 10(1), 10; https://doi.org/10.3390/foods10010010
Submission received: 7 October 2020 / Revised: 16 December 2020 / Accepted: 18 December 2020 / Published: 23 December 2020
(This article belongs to the Special Issue New Trends in Bioactive Lipids Research in Health and Disease)

Abstract

:
Wheat is the staple food for the world’s major populations. However, chemical characters of geographically authentic wheat samples, especially for the lipids, have not been deeply studied. The present research aimed to investigate lipid compositions of Chinese wheat samples and clarify the major markers that contribute to the geographical differences. A total of 94 wheat samples from eight main wheat-producing provinces in China were evaluated to differentiate their lipid compositions. Based on the data collected from ultra-high-performance-liquid-chromatography tandem time-of-flight mass spectrometry (UPLC-Q/TOF MS), an optimized non-targeted lipidomic method was utilized for analyses. As the results, 62 lipid compounds, including fatty acids, phospholipids, galactolipids, triglycerides, diglycerides, alkylresorcinol, and ceramide were tentatively identified. Partial least squares discriminant analysis (PLS-DA) demonstrated a more satisfying performance in distinguishing wheat samples from different origins compared with principal component analysis (PCA). Further, the abundances of triglycerides and glycerophospholipids with more unsaturated fatty acids were found greater in wheat samples from northern origins of China, while more glycolipids and unsaturated fatty acids arose in southern original wheat samples. These findings describe the lipid profiles of wheat samples in China and could contribute to the quality and safety control for the wheat flour products.

1. Introduction

Wheat is one of the most important cereal crops that has nourished human beings for thousands of years [1]. In China, wheat is recognized as one of three most important grain crops, following rice and maize, with the production at 133 million tons in 2019 [2], and wheat flour is the most widely consumed carbohydrate source in the northern part of China. Hence, the safety and quality of wheat is critical to the national nutrition and health in China. The main high-quality production bases of wheat in China located in Yellow–Huai–Hai River Drainage Basin and North China Plain [3]. Previous publications reported that the botanical origins with diverse geographical features play important roles in determining chemical characteristics of crops and qualities of wheat flour final products [4,5], which also aroused a great deal of attentions toward food traceability [6]. For example, the labels on bread and pasta, especially the ones produced in Italy, must denote the producing regions where the wheat samples were cultivated and milled [7]. In order to clarify the geographic origins of botanical samples, the primary step is to establish the authentic sample information. Hence, it is of crucial importance to discriminate the chemical profiles of geographically authentic samples, so as to better describe the chemical characteristics of the authentic wheat samples.
Lipids are one group of important functional components in wheat grains, with the proportions at 2–2.5% [8]. Lipids have diverse chemical structures and functionalities [9], and play important roles in supplying energy, constructing membrane, and regulating crop metabolisms in wheat grains [10]. On the other hand, the quality of final products of wheat flour is greatly influenced by the lipid types [11]. For example, polar lipids are beneficial to the baking performance of the wheat flour, while some of the non-polar lipids are detrimental [12]. Larger abundance of fatty acids might be a threat to the safety of wheat storage since these fatty acids could easily be oxidated resulting in rancidity [13]. Thus, these minor components were essential to the quality of some loaf products and the wheat safety. The present study focused on wheat lipids instead of other higher-concentrated components such as wheat proteins or starches because this minor fraction has been less investigated to date than the major ones [14,15]. Moreover, from the perspective of omics, some most relevant differences in the upper reaches of omics towards exogenous factors (like growing location, weather and soil composition) might be detected and amplified investigating differences at small-molecule metabolome level [16,17], at which most studies focused on geographical discrimination of crops were investigated [18,19,20]. Previous researches have revealed that wheat lipids could be influenced by geological factors, thus wheat samples harvested from different origins might have specific lipid constitutes, which may affect the processing characteristics [21,22]. However, the specific lipids profile of geographically authentic wheat samples or the discriminated markers among different origins are not clear [7,17]. An effective analytical approach on investigating lipid profiles and exploring characteristics of wheat samples from different origins is constantly being searched for.
Some techniques have been proved effective in differentiating lipid compositions from different origins of samples. Thin layer chromatography (TLC) was previously used to analyze lipids [23], but the disabilities to identify and quantify lipid species had limited the application of TLC in modern food analytical work [8]. Spectroscopic techniques such as nuclear magnetic resonance spectroscopy (NMR) or infrared spectrum (IR) which could provide the chemical structure elucidation were considered as the powerful approach for lipid analyses in a non-destructive manner [5]. While compared to generally used mass spectrometry techniques, spectroscopic approaches revealed the moderate sensitivity [23]. With the advantages of high throughput, sensitivity, and accuracy, chromatography coupled to mass spectrometry has become one of the most suitable techniques applied in food authentication [24]. Gas chromatography coupled to mass spectrometry (GC-MS) was mainly applied in targeted detecting of fatty acids or polar lipid components in wheat [25,26]. Volatile compounds of wheat samples have drawn much attention, and they have been applied in wheat geographical discrimination using the GC-MS approach [27]. Finnie and colleagues quantitatively characterized the polar lipid components of different layers of wheat fractions based on liquid chromatography-mass spectrometry (LC-MS) techniques [28]. Different from the targeted analyses approaches, non-targeted strategies have aroused much interest in food fraud and traceability detections in recent years. Non-targeted strategies focus on the signals formed from entity foodstuff or the whole substances of one molecular species rather than specific chemical components. Certain methods could also effectively lead to the discovery of discriminated markers that contributed most to the differences [29]. The LC-MS approach has satisfactory ability to separate substances, and is capable of providing sufficient high-resolution chemical information, which is pertinent to non-targeted analyses [30]. Previous researches have reported that non-targeted lipidomic LC-MS approaches were applied in distinguishing different varieties of wheat samples [17,31,32] and different layers of wheat fractions [8,9]. Cavanna and colleagues reported through LC-MS approaches, the geographical discrimination of wheat samples from Italy, other European countries and countries out of Europe using chemometrics [7]. However, very few identification results for the markers in wheat samples were reported in previous studies, which resulted in the shortage of discussion in the chemical profiles of wheat samples from different growing regions. Geng and colleagues have identified lipid species in different layers of wheat grain in detail, and the different ionization techniques combined with two ion modes reflected the complex and time-consuming operations during the analyses [9]. All of these published results indicate that appropriate analytical approaches with chemometrics could effectively differentiate the lipid compositions of food samples.
The aim of the present study is to investigate the lipid compositions of wheat samples harvested from eight main wheat-producing origins and elucidate the major markers that contribute to the differences, in an attempt to clarify the lipid profiles of authentic wheat samples in China. Elucidating the chemical characteristics of authentic wheat samples from different origins would be helpful in understanding the potential qualities and applications of wheat samples harvested from different regions of China, thus extending or improving the wheat growing tendency and purpose in China. Further, after creating appropriate mathematic models, lipid profiles of authentic wheats could also be used as the indicators to monitor potential illegal adulteration in wheat or wheat products. All of these above made it meaningful and urgent to focus on the lipid compositions of authentic wheat samples in China.

2. Materials and Methods

2.1. Materials and Chemical Reagents

In total, 94 wheat samples from eight provinces in China, including Anhui, Fujian, Guizhou, Guangdong, Hubei, Henan, Gansu, and Shaanxi were gifted by local breeding institutes in 2018 and stored at −4 °C before analyses (Table S1).
Methanol, acetonitrile, isopropanol, and formic acid were in LC-MS grade and purchased from Merck KGaA (Darmstadt, Germany). HPLC grade dichloromethane used for extraction was purchased form Sigma-Aldrich (St. Louis, MO, USA). Water was purified by Milli-Q 10 ultrapure water system (Millipore Laboratory, Bedford, MA, USA).

2.2. Extraction Methods

Wheat samples were milled with a lab flour grinder (IKA A11 laboratory grinder (IKA, Staufen, Baden-Württemberg, Germany)). A total of 50 mg wheat flour was accurately weighted and mixed with 1.5 mL extraction solution (methanol/dichloromethane (7/3, v/v)) in a 2 mL polypropylene centrifugation tube [31]. After vortexed for 60 s, mixtures were extracted in the ultrasonic bath (Hechuang Ultrasonic, Shanghai, China) with the power consumption for 400 W at ambient temperature for 30 min. Extractions were centrifuged (13,000× g) at 4 °C for 10 min, and the supernatants were fileted through a 0.22 µm syringe filter. A total of 2 g of each sample was mixed to obtain quality control (QC) sample, and the milling and extraction methods for QC samples were the same as above. Every extraction for QC was prepared along with the same batch of other sample extractions for further data alignment. Each sample was extracted in triplicate.

2.3. UPLC Q/TOF-MS Conditions

Waters ACQUITY ultraperformance liquid chromatography combined with a Xevo G2 quadrupole time-of-flight mass spectrometry (UPLC Q/TOF MS) (Waters, Milford, MA, USA) was used for the analyses. The optimized 30-min gradient was carried out with mobile phase A (0.1% formic acid in purified water) and B (0.1% formic acid in isopropanol/acetonitrile (4/6, v/v)), and the flow rate was 0.3 mL/min. In total, one aliquot of 2 μL wheat extractions were injected into the Waters Acquity UPLC BEH C18 column (2.1 × 150 mm i.d.; 1.7 μm) with the column temperature at 45 °C. The linear gradient was performed as follows: 0–1 min, 10–50% B; 1–2 min, 50% B; 2–5 min, 50–80% B; 5–8 min, 80–90% B; 8–14 min, 90–91% B; 14–16 min, 91–95% B; 16–18 min, 95–96.5% B; 18–22 min, 96.5–97% B; 22–25 min, 97–100%; 25–28 min, 100% B; 28–28.1 min, 100–10% B; 28.1–30 min, 10% B. The electrospray ionization (ESI) source was set in positive ion mode, with the source temperature at 120 °C and desolvation temperature at 450 °C. The voltages for capillary, sampling cone and extraction cone were 2.5 kV, 40 V, and 4.0 V, respectively. The flow rates of cone gas and desolvation gas were 100 L/h and 800 L/h, respectively. In MS1 function, mass range was 100–1200 Da with the collision energy for 6 eV, and the fragment signals under the collision energy ranging from 20–35 eV with the mass of 100–1200 Da in MS2.

2.4. Data Processing

Chromatograms and MS spectra were acquired by MassLynx 4.1 (Waters, Milford, MA, USA). Identification of chemical compounds in wheat was based on the accurate molecular weight and mass fragment information obtained from MS1 and MS2 data, theoretical and experimental isotopic patterns, cleavage law of compounds, retention time, as well as the compounds and fragment information reported in previous literatures. Online databases, including SciFinder [33], Pubchem [34], and LIPID MAPS [35] were consulted for features searching.
Before chemometric analyses, Progenesis QI 1.0 (Waters Nonlinear, Milford, MA, USA) was used for data preprocessing, which included peak alignment, experiment design setup, peak picking and compounds identification. One of the QC samples was automatically selected as the most suitable run for peak alignment from all the QCs, then an alpha blend was used to animate between the current and reference runs to make all the runs correctly aligned. After data were grouped by their origins, peak picking was carried out. During the normalization process, one of the runs that is least different from all the other runs in the data set was automatically selected by Progenesis QI to be the normalizing reference. The normalization factor was then calculated by finding the mean of the log abundance ratios of the compounds that fall within the “robust estimated limits”. All compounds were normalized according to their factor based on the reference run. Different adducts of the same compound were then grouped by the deconvolution process. After the compound was identified by QI, the exported data were then delivered to EZinfo (version 3.0, Waters, Milford, MA, USA) for further multivariate data analyses. In the PLS-DA (partial least squares discriminant analysis) loading plot, variables with VIP values > 1.5 (VIP represents variable influence on projection) were selected as significant markers. Box plots that performed by Origin (version 8.5, Originlab, Northampton, MA, USA) were used for capturing abundances of these markers.

3. Results and Discussion

3.1. Optimization of Analytical Methods

Different extraction methods together with diverse parameters of analytical facilities were explored to obtain better separation effects in the preliminary experiment. Considering the QC sample contained chemical information from all wheat samples and could be recognized as the representative, the optimization of analytical method was carried out by using the QC sample. In order to focus on the lipid components in wheat samples, different extraction reagents, and periods were tested individually. UPLC columns and mobile phases with eluent procedure were also optimized.
Selecting an appropriate extraction solvent plays one of the most important roles in determining the polar-coverage of chemical components from the materials. Therefore, it needs to be carefully optimized [36]. Dichloromethane/methanol (5/5, v/v) showed the remarkable capability to extract as many metabolites as possible for wheat matrix compared with n-hexane and acetone/water (5/5, v/v). This might be due to the fact that a combination of certain ratios of dichloromethane/methanol covered a large scale of polarity in the metabolites of wheat samples according to the “like dissolves like” rule [37]. In addition, single extraction by dichloromethane/methanol was also compared with the combination of three fractions consequently obtained from one QC sample (Figures S1 and S2). Results showed that the two approaches had no significant difference, which further proved the effectiveness of dichloromethane/methanol. A similar ratio of chloroform/methanol had also been reported suitable for lipidomic analysis of starch-rich samples in some previous publications [31,37]. Besides, different extracting periods (30 min, 60 min, and 120 min) were also compared in their efficiency of extracting non-polar components, and no visual difference was observed among all the three extracting periods, so the final extracting method was determined by using dichloromethane/methanol for 30 min.
Different chromatographic columns including BEH C18, BEH Phenyl, and BEH HILIC were compared with their separation abilities, and the BEH C18 column (2.1 × 150 mm i.d.; 1.7 μm) resulted in the best separation. 0.1% formic acid in water and isopropanol/acetonitrile (4/6, v/v) were selected as mobile phase A and B, respectively, based on their stronger elution ability compared with other regents (methanol, acetonitrile). Elution gradient was also optimized to a moderate extent that good separation results can be achieved along with a not too long analytical period in order to give an efficient approach.

3.2. Identification of Chemical Compositions in Wheat

Chemical profiles of wheat were tentatively characterized by UPLC/Q-TOF-MS with the analysis of QC chromatogram. As per the results, a total of 62 components were tentatively identified and numbered in Figure 1, mainly including fatty acids, phospholipids, galactolipids, triglycerides, diglycerides together with a few alkylresorcinol and ceramide (Table 1).
Among all the chemical compounds, polar lipids including phospholipids, galactolipids, few free fatty acids, β-sitosterol, and docosenamide were eluted during the first 16 min, together with alkylresorcinol and ceramide. While in the later 14 min, abundant neutral lipids including diacylglycerols (DGs) and triacylglycerols (TGs) were eluted. Representative lipids of each lipid categories were explained in detail as examples for the identification progresses.

3.2.1. Identification of Fatty Acids

Fatty acids (FAs) were usually found in wheat germ with a content of about 2–5% [38]. In general, FAs were often methylated and analyzed using gas chromatography (GC) [39]. Recently, liquid chromatography combined with high-resolution accurate-mass multistage mass spectrometry (LC-HRAM-MS) have given detailed LC behavior and MSn fragments of FAs in wheat [9,40]. In the present study, the abundance of ions at 279.2325, 263.2378, and 265.2527 m/z in MS1 function were much higher than that of MS2 and the adduction forms were [M+H]+ or [M+H-H2O]+; thus, three FAs (linolenic acid (C18:3), linoleic acid (C18:2) and oleic acid (C18:1)) were ambiguously identified. Dehydration of the three FAs was observed in the current ESI positive mode of MS fragmentation pathways and the fragments given here (Table 1) were referred to others [9].

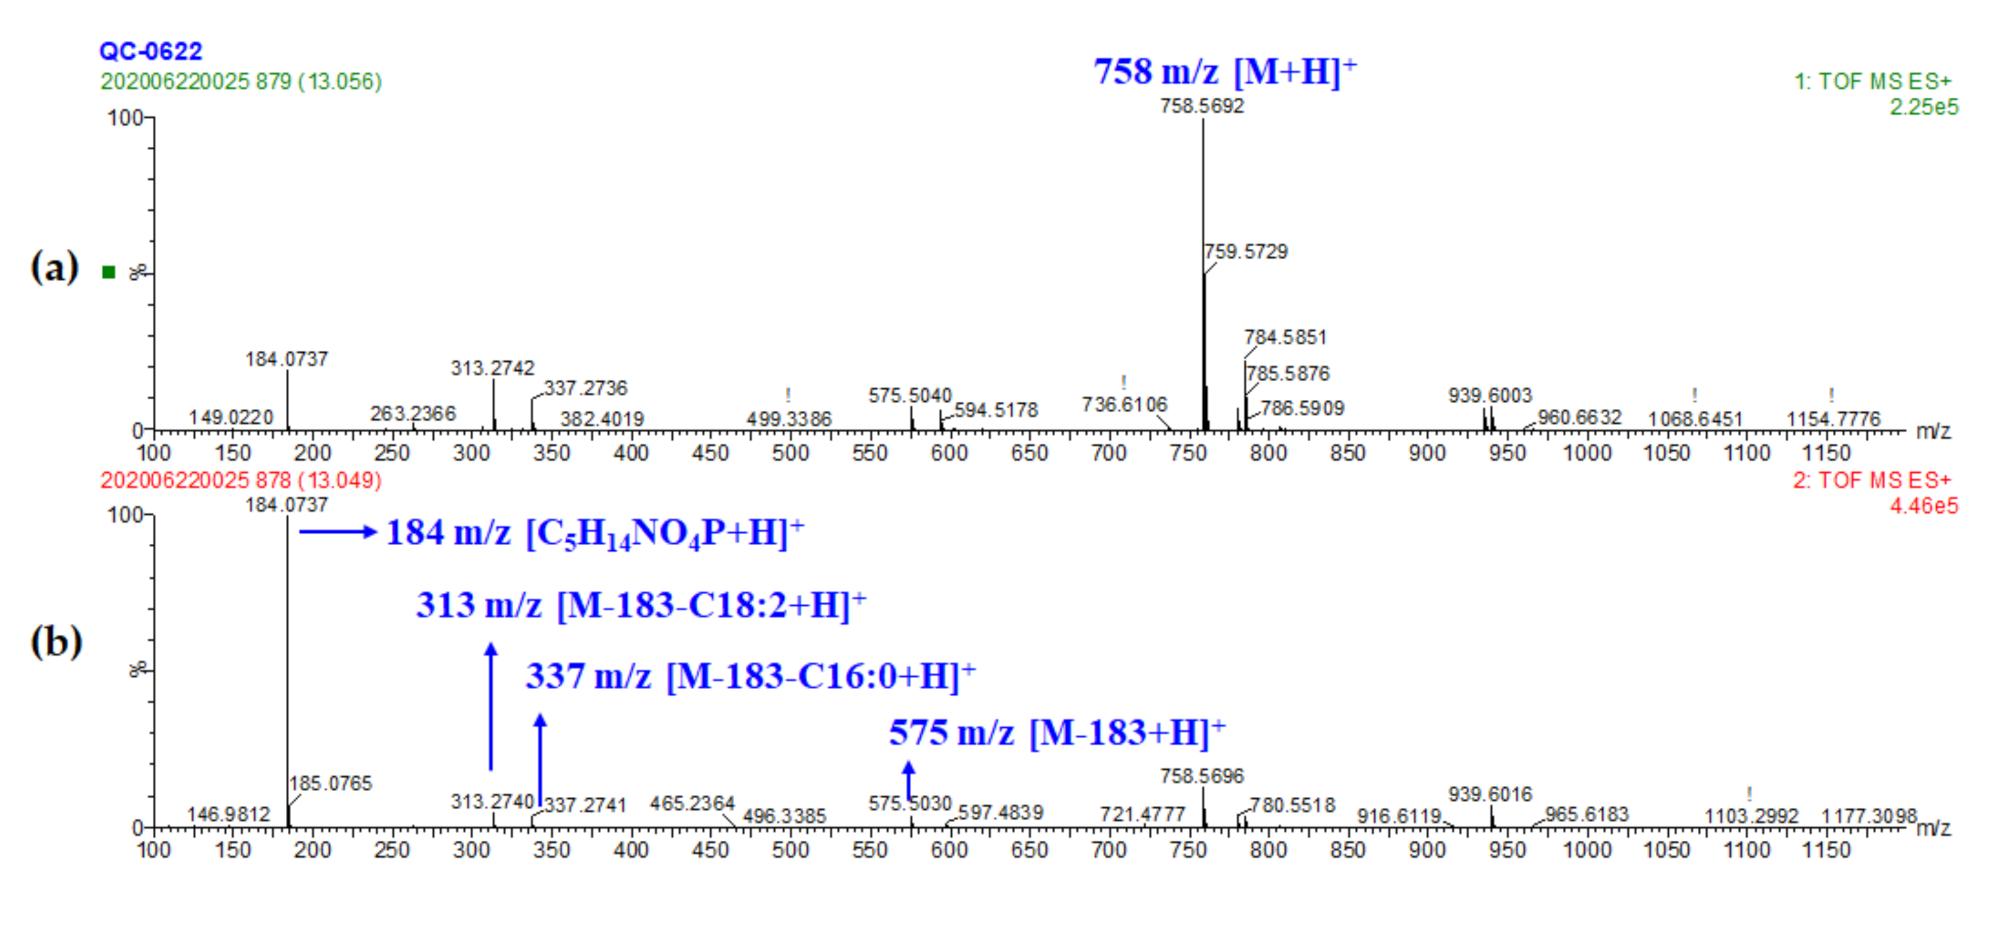
3.2.2. Identification of Glycerophospholipids

Glycerophospholipids were one type of lipids with a glycerol backbone and bound with fatty acids located in sn-1 and/or sn-2 positions (sn represented for stereospecific numbering), and the types of glycerophospholipid were differed by districting polar phosphor groups in the sn-3 position [41]. In ESI positive mode, [M+H]+ and [M+Na]+ were the main molecular ionization mode for phospholipids [41], which were also approved in the present study. A total of eight phosphatidylcholines (PC), two phosphatidylethanolamines (PE), five lyso-phosphatidylcholines (Lyso-PC), and one lyso-phosphatidylglycerol (Lyso-PG) were identified from wheat samples. For PC, the loss of choline moiety resulted in the formation of diagnostic ion [C5H14NO4P+H]+ (m/z 184.0739). The types and binding positions of fatty acids could be determined by the diglyceride fragments that formed after losing the polar phosphor group from the PC backbone or fatty acid fragments in the MS2 spectrum. For example, peak 25 showed the molecular weight of [M+H]+ at m/z 758.5692, so the molecular formula of the certain compound could be calculated as C42H81NO8P within the mass error of 0.67 ppm. Product ion at m/z 184.0737 showed higher abundance in the MS2 spectrum referred to the class of phospholipids-phosphatidylcholine (for the number of nitrogen atoms in the molecular formula did not match the composition of sphingomyelin (SM), PC was confirmed). Furthermore, [M-C5H14NO4P+H]+, [M-C5H14NO4P-C18H30O1+H]+ and [M-C5H14NO4P-C16H30O1+H]+ at m/z 575.5029, 313.2741, and 337.2740, respectively, with a slight abundance referred to the identification of palmitic and linoleic acyls (Figure 2). Due to the fatty acids substituent in sn-2 position was easier to be eliminated from PC, PG, and PE [41], the distribution of fatty acids can be clarified as PC (16:0/18:2) for the ions at m/z 313.2741 had a higher abundance than 337.2740 and that was reported previously [9,31]. Similarly, polar fragment losses of PG and PE formed [M-172+H]+ and [M-141+H]+ was observed in peak 5 (Lyso PG (16:0)) and peak 20 (PE (18:2/18:2)) [9,41]. All the other phospholipids were tentatively identified similarly.

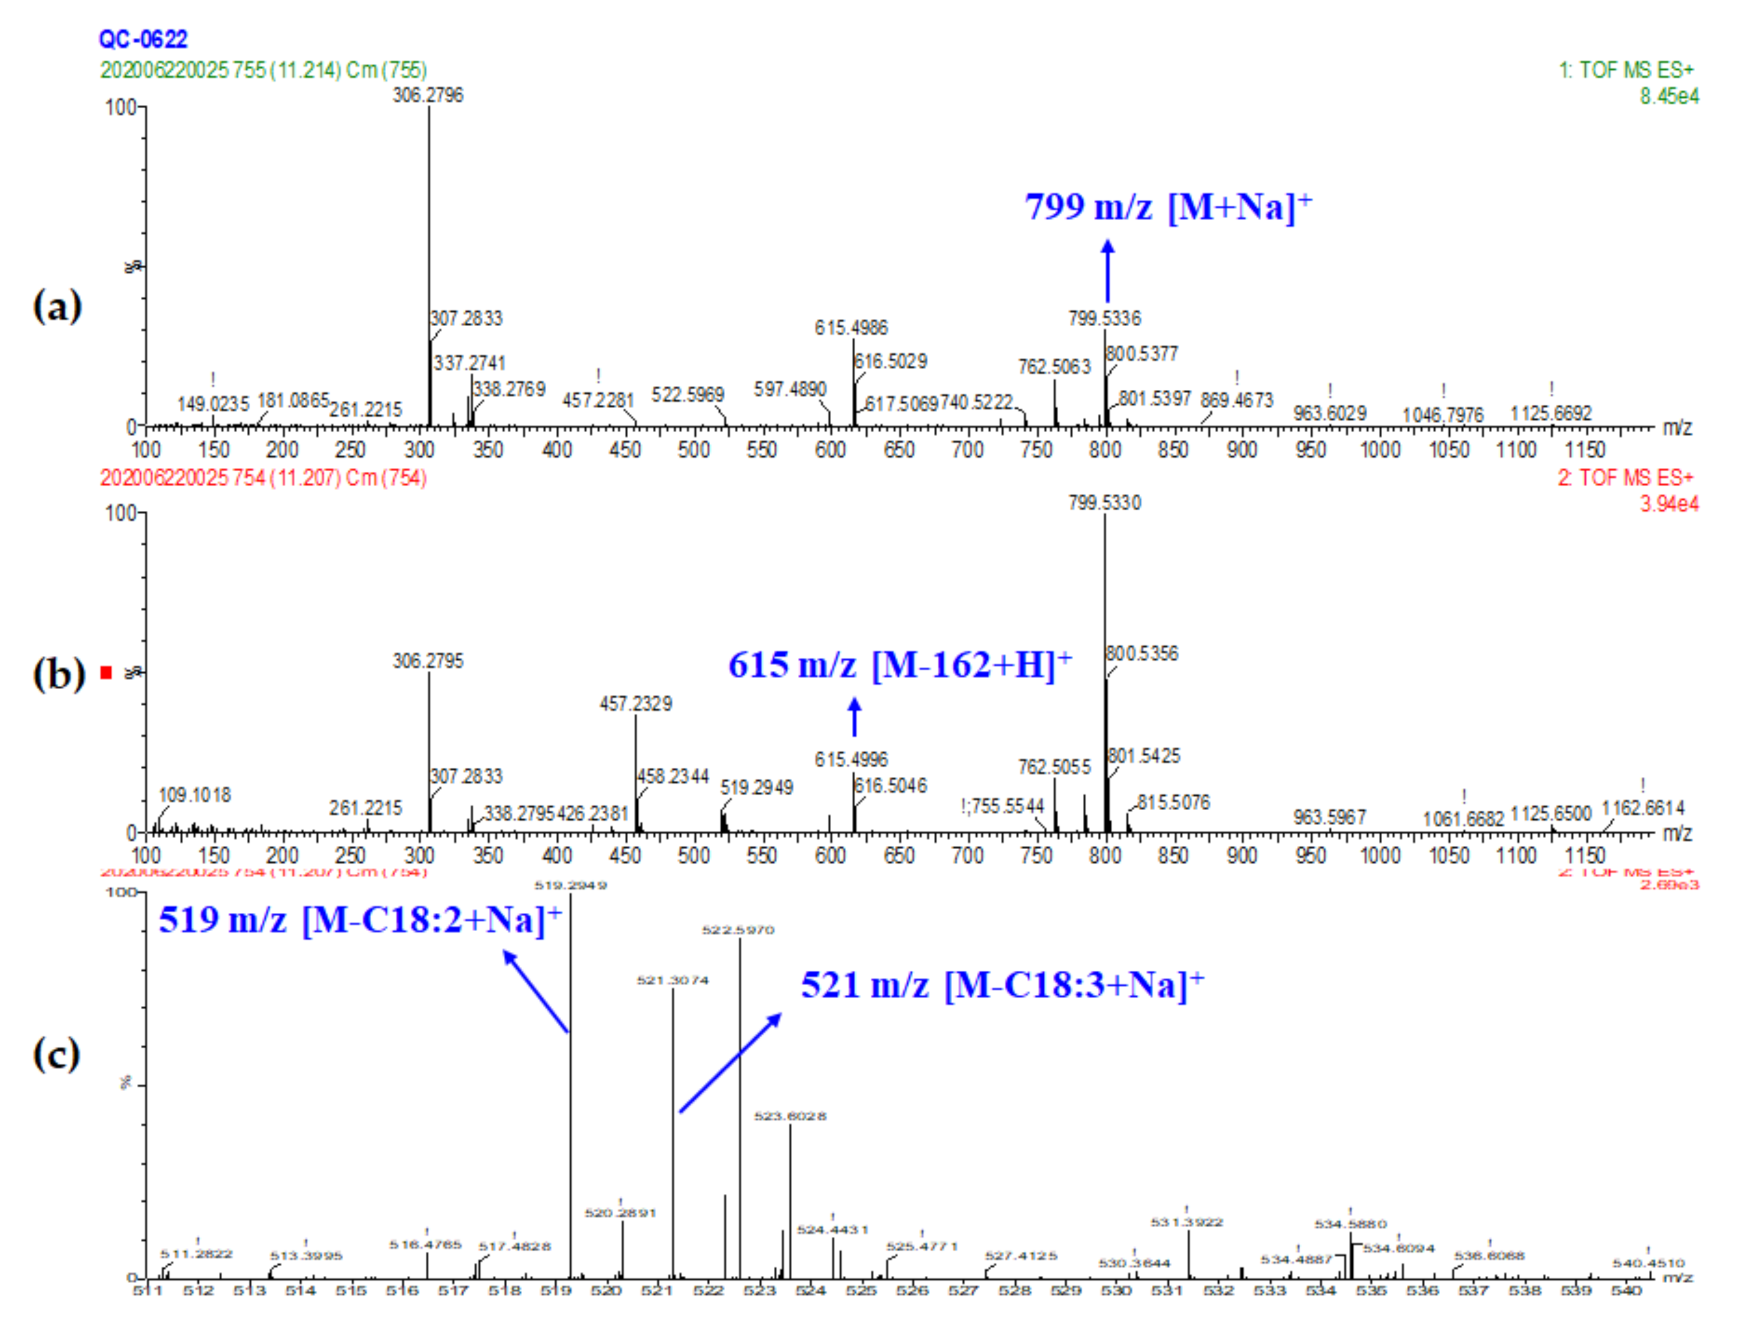
3.2.3. Identification of Galactolipids

Galactolipids were another type of polar lipids as well as a group of bound lipids with mono- or di-galactosyl located in the sn-3 position of the glyceride backbone and mainly distributed in wheat endosperm. Monogalactosyl-diacylglycerol (MGDG) and digalactosyl-diacylglycerol (DGDG) were the major galactolipid forms in wheat grain with unsaturated fatty acids that connected to sn-1 or/and sn-2 position in general [9]. In total, four MGDGs and seven DGDGs were identified in this study with molecular ion forms of [M+Na]+ and/or [M+NH4]+. The main product ions observed in the current positive MS mode were formed by the loss of galactosyl moiety to yield ion [M-162+H]+ or/and cleavage of a fatty acid to yield ion [M-RCOOH+Na]+ and [M-162-RCOOH+H]+. For example, peak 14 with the molecular ion of [M+Na]+ at m/z 799.5336 and [M+NH4]+ at m/z 794.5782 referring to C45H76O10 were both detected in the MS1 spectrum (Figure 3). Product ion at 615.4986 represented [M-162+H]+, which was formed by the loss of galactosyl and could also be pointed that the fatty acids constitution was C36:5. Furthermore, linoleic acid (C18:2) or linolenic acid (C18:3) losses resulted in fragments of [M-RCOOH+Na]+ at m/z 519.2949 and 521.3074, respectively. Due to the fatty acid in the sn-2 position of MGDG being more favorable to lose than sn-1 [42] and the abundance of 519 m/z was higher than 521 m/z, the distribution of fatty acids for MGDG (18:3/18:2) could be determined.

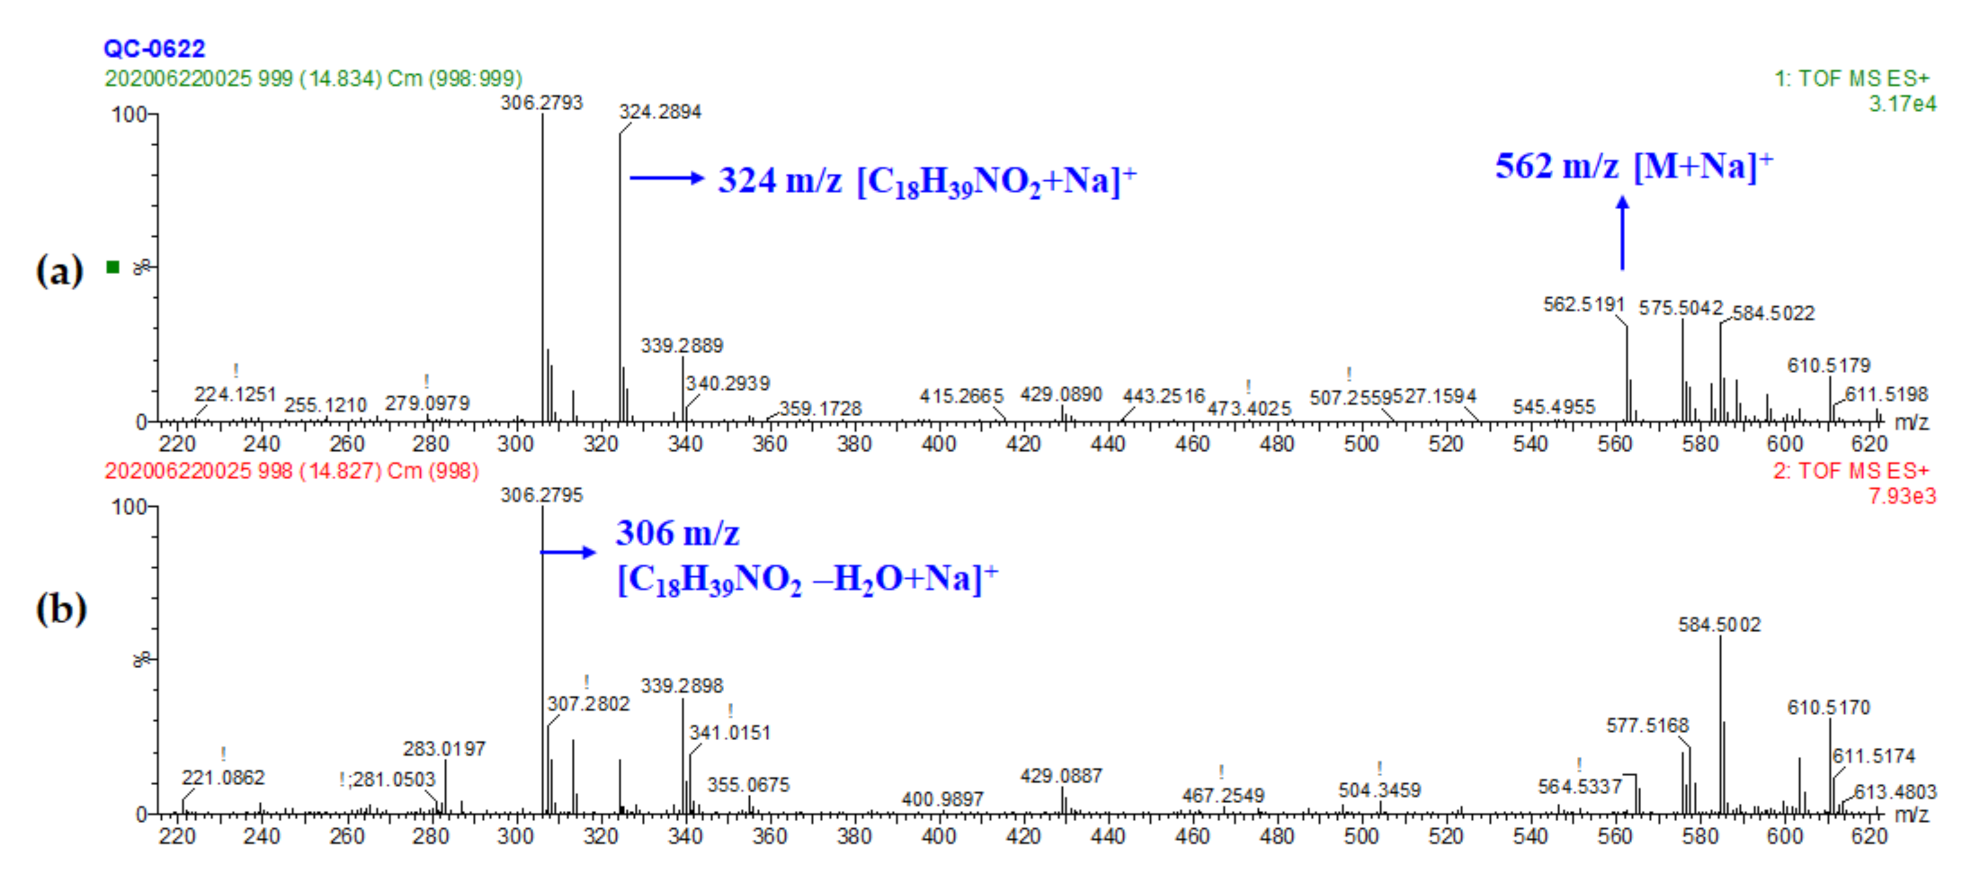
3.2.4. Identification of Other Minor Polar Lipids

As the functional constituent of food, sphingolipids have been widely identified in wheat bran [43]. In addition to its structural role, sphingolipids from wheat bran have performed extensive bioactivity [44]. Ceramide (Cer) was the simplest form of sphingolipid with a hydrogen atom substituting for the polar group [45]. Cer (d18:0/16:0) which consisted of a palmitoyl (16:0) and a dihydroxy sphingosine with 18 carbons (d18:0, where d represented two hydroxyls linked to sphingosine) was tentatively identified in the present study with the m/z of 562.5192 for the ion [M+Na]+ referring to the molecular formula of C34H69NO3 (peak 30) (Figure 4). Product ions in peak 30 were at m/z of 324.2898 and 306.2794, which corresponded to the fragments of sphingosine (d18:0) according to Cameron [46], so that the constitution of parent ion was clear. However, this was the only ceramide identified in our study. The other variable sphingolipids were not detected probably because of the ionization methods and instrument differences compared with other studies [9,45].
Alkylresorcinols (AR) were amphiphilic phenolic lipids with odd-numbered alkyl chain in the range of C15-C25 at position 5 of the 1,3-dihydroxybenzene [47]. As the ARs were not easily detected in ESI positive mode compared with ESI negative or APCI positive mode [31], only AR (21:0) (peak 19) were tentatively identified according to the fragments that were reported in previous researches [9].
In addition, other polar lipids including 13-docosenamide (peak 10) and β-sitosterol (peak 13) were also been found and identified according to previous literatures [40].

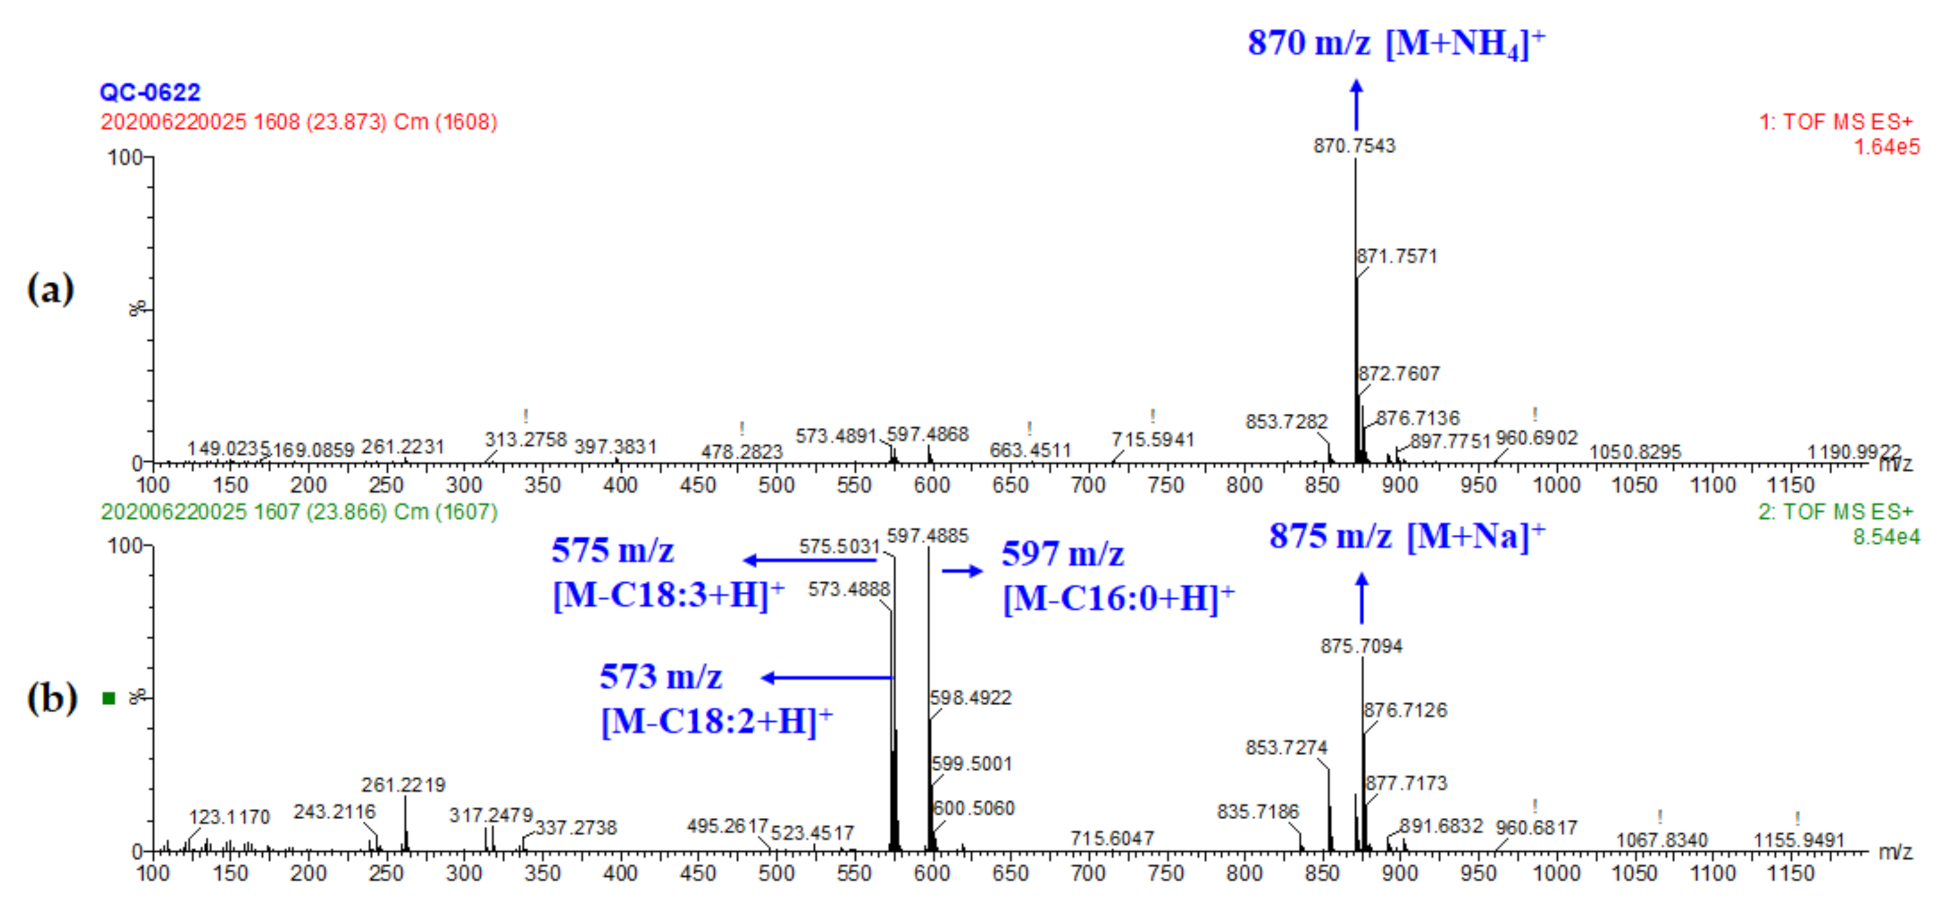
3.2.5. Identification of Glycerides

Triglyceride (TG) and diglyceride (DG) were the main storage lipid distributed in all wheat fractions, especially abundant in the outer layer of wheat kernel [8]. Different from other polar lipids, these neutral lipids eluted finally in the present gradient and showed large structural diversity. The cleavage principle of TGs and DGs were clearly discussed before [48,49]. In this study, a total of 22 TGs and six DGs were tentatively identified. For example, peak 48 revealed the molecular ion of [M+NH4]+ at m/z 870.7543, referring to its molecular formula C55H96O6. Product ions ([M-RCOOH+H]+) showed in MS2 were 597.4885, 575.5031, and 573.4888 (relative abundances were 100, 96.47, and 78.59, respectively), corresponding to the loss of palmitic, linolenic, and linoleic acid (Figure 5). Considering fatty acids at sn-1 or sn-3 with more tendency to be lost, linoleic acid could be identified in the sn-2 position [50]. Therefore, peak 48 was identified as TG (18:3/18:2/16:0). Other glycerides were deducted and all summarized in Table 1.
Chemical components identified in the present study revealed large structural diversity comprising of predominant polar and neutral lipids, which also proved the feasibility of our analysis method in non-targeted lipidomic research. However, some lipid groups were not detected, such as oxylipins and γ-oryzanols. In fact, it was too difficult for the single method to detect every compound and unambiguously identify them in a sample [47], the present analysis method may be a simple way to quickly depict the profile of wheat lipids.

3.3. Multivariate Modeling for Chemical Characteristics Discrimination of Geographical Authentic Wheat Samples
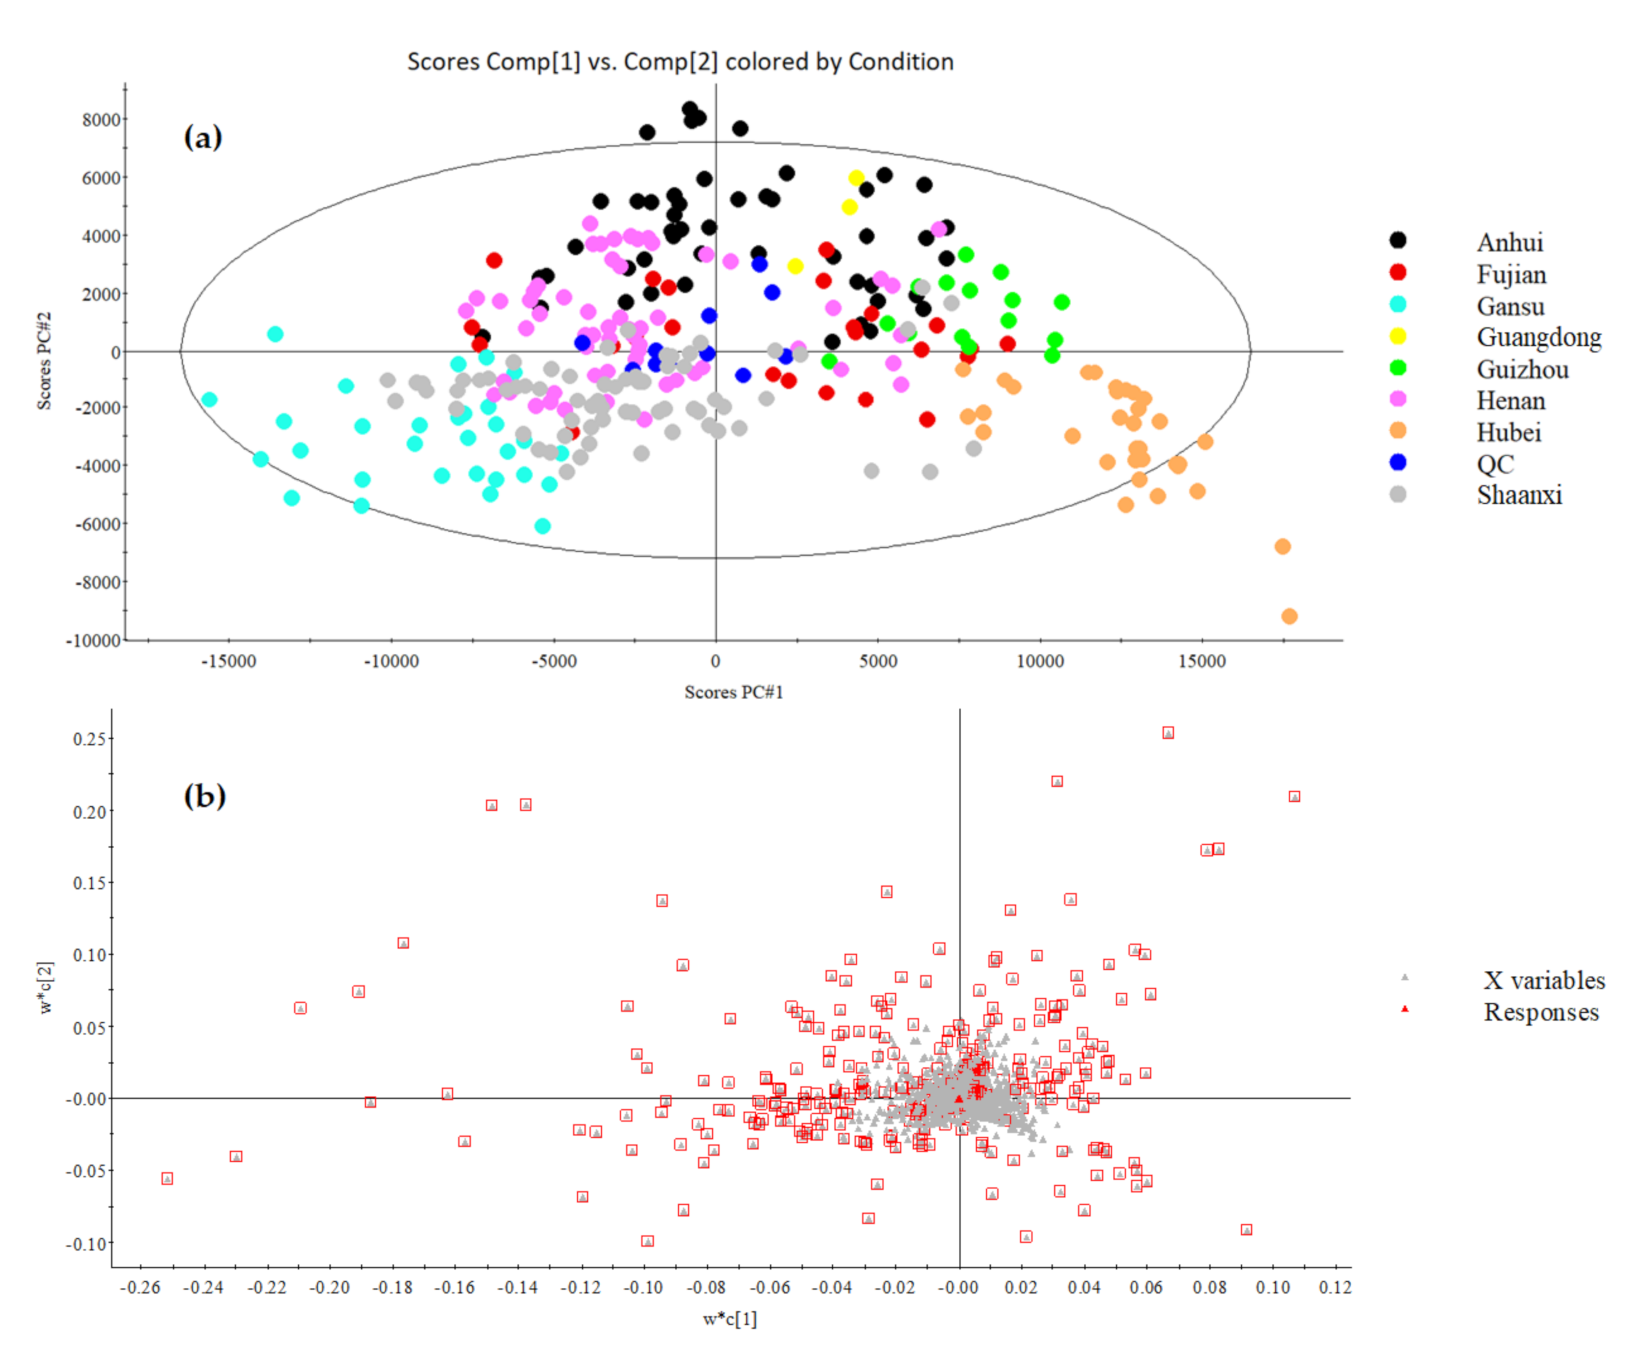
Chemometrics analyses, especially multivariate models, are usually used in metabolomic researches to explore the discriminations among tremendous amounts of omics data. In the present study, two approaches, principal component analysis (PCA) and partial least squares discriminant analysis (PLS-DA), were used to investigate the chemical differences of geographical authentic wheat samples from eight provinces in China [30].

3.3.1. PCA Analysis

After peak alignment and peak picking achieved by Progenesis QI (Waters, Milford, MA, USA), a total of 3771 variables were detected from 94 wheat samples along with QC samples. Firstly, the raw data consisting of 3771 variables were used for PCA modeling by Pareto scale. Due to the none-clustering information and none-selectivity variable used for the modeling, the unsupervised approach PCA could provide the unbiased general trends of classification characteristics for all the wheat samples (Figure S3). As a result, all the QCs were clustered closely at the center of scores plot, indicating the reliability of data acquisition. In total, 11 total ion chromatography (TIC) of all the overlaid QC runs are listed in Figure S4. Chemical information of wheat from Anhui, Henan, Shaanxi, Fujian, and Guangdong provinces clustered loosely together with QCs which reflected that wheat from these origins contributed more to the commonness from the chemic perspective. Despite the unsatisfactory results obtained from the PCA model, wheat from Gansu province of north China manifested the visible differences against Hubei and Guizhou that came from southern China along the PC1 dimension. In order to achieve better discrimination performance and better find differential substances referring to geographical origins, a supervised cluster approach was further induced.

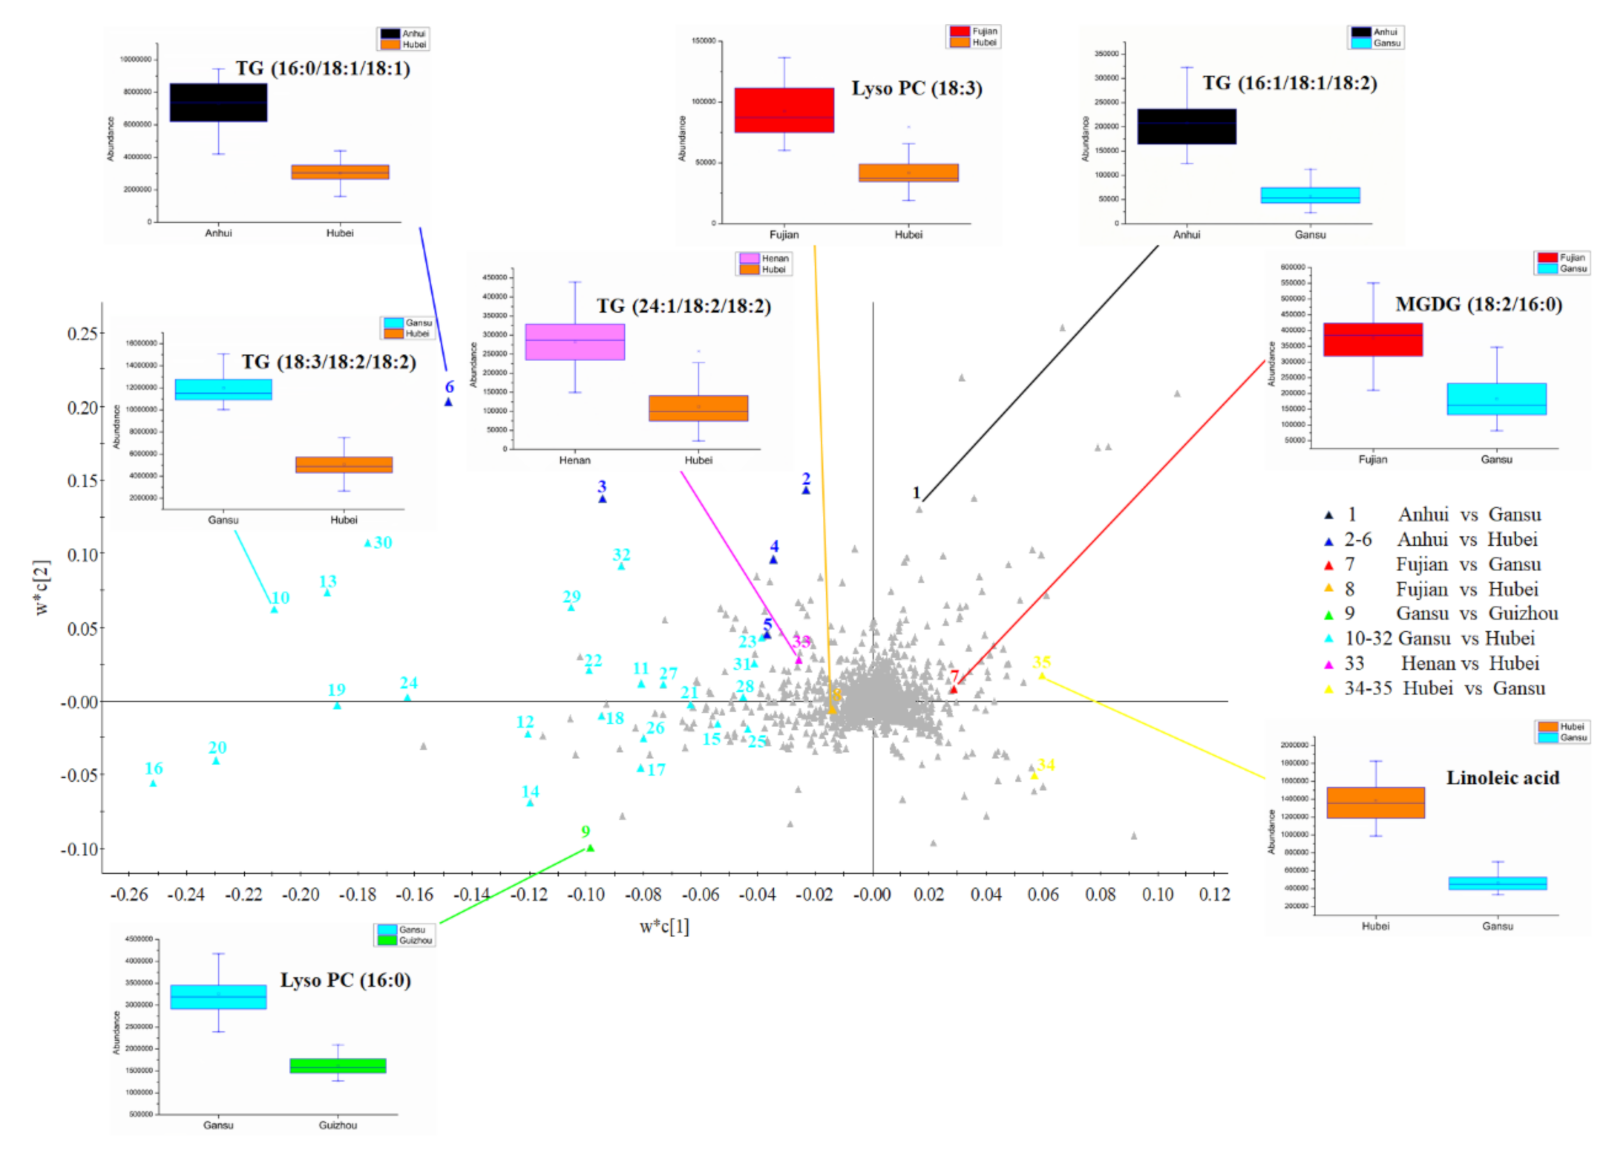
3.3.2. PLS-DA Analysis

Partial least squares discriminant analysis (PLS-DA) is one of the commonly used supervised models that grouping information was given before modeling. In this study, data with the features p < 0.01, coefficient of variance (CV) > 30 and fold change (FC) > 2 was induced for further PLS-DA modeling. Figure 6a visually showed satisfactory discrimination among wheat samples from eight provinces in China based on PLS-DA modeling. In the scores plot of PLS-DA, wheat samples from one province clustered almost tightly. Wheat from Gansu and Hubei displayed the most significant distance along the PC1 dimension, which was consistent with the PCA results. Along the PC2, wheat samples from Anhui and Shaanxi province also revealed a good separation. In addition, the discriminations of sample origins between Gansu and Guizhou, and Gansu and Guangdong province were significant along the diagonal of the first and third quadrants, especially for wheat from Gansu and Guangdong province, the two groups with the longest geographic distance among all wheat samples.
Interestingly, regional factors might play extremely important roles in determining the chemical compositions of wheat samples. The Qinling Mountains–Huaihe River boundary, which traverses from west to east in China, crossing Sichuan, Shaanxi, Hubei, Henan, Anhui, and Jiangsu provinces and connecting the East China Sea, is an essential dividing line separating not only geographic origin and climate but also the social and economic activities such as agricultural production which directly or indirectly affect the foodstuff characteristics [51]. The distinction for chemical profiles of botanical samples from different north-south origins in China was reported previously [5,52,53]. In the present study, most of the wheat samples from north of Qinling Mountains–Huaihe River boundary, including wheat from Shaanxi and Gansu provinces, were clustered on the lower left part of the PLS-DA scores plot, while wheat from southern provinces distributed mainly on the upper right zone, such as wheat from Guizhou and Guangdong provinces (Figure 6a). Meanwhile, wheat samples from central parts of China, including Henan and Anhui, also located at the central of scores plot with slight separation, which further confirmed that growing locations effectively affect the chemical profiles of wheat. However, wheat samples from Fujian province did not show strong clustering into the southern group, which might be for the reason that genotype, cultivation, or other factors that might display an overlap influence on the chemical information discrimination of wheat samples that resulted in the cluster with another irrelevance group set [17]. The clustering characterization depicted the authentic chemical characters of wheat from the specific origin, which gave convincing guidance for wheat origins validation and probably contributed to non-targeted detection of exogenous chemicals. To our best knowledge, this is the first time that a geographical-based distinction of wheat samples across multiple provinces in China has been described based on the perspective of lipid compositions.
Loading plot of PLS-DA reflected the extent that specific variables (chemical substances) contributed to the entirety classification, which meant the variables distributed in the corresponding clustering border with the same location connected to sample in scores plot could be considered as the discriminant markers of this group [54]. In the current study, variables with VIP > 1.5 were selected as the significant markers for the classification and marked with red boxes in the loading plot (Figure 6b), and a total of 317 variables were finally selected as potential markers in differentiating geographical discriminations.

3.4. Identified Markers for Wheat Geographical Discrimination

Among the 317 variables with VIP > 1.5 selected from the PLS-DA loading plot (red boxes in Figure 6b), 35 variables were identified and could be divided into eight groups with statistically meaningful markers. These 35 variables were labeled and identified; the natural abundances of these variables were compared among wheat samples from different provinces (Figure 7, Table S2). Abundances of the markers with the greatest VIP values in each group set were specially performed in Figure 7. For example, the abundances of TG (16:1/18:1/18:2) with the VIP value of 1.87 were greatest in Anhui and lowest in Gansu. Specific abundances of these eight markers in wheat from the provinces with the highest and lowest abundances were listed in Table S3. One thing needed to be mentioned is that although these identified markers showed great differences between the two provinces, they were still significant markers that contributed to differentiate the entire discrimination of wheat samples. From the massive identified marker information, abundances of TGs and glycerophospholipids with more unsaturated fatty acids were found greater in wheat samples from north origins like Gansu and Henan province. Compared with wheat from north origins, southern original wheat samples like Fujian and Hubei contained more glycolipids and unsaturated fatty acids.
Different regions possessed diverse climate situations, including sunshine, precipitation, temperature, and geographical features such as soil condition, altitude, and latitude [5]. These environmental factors led to differences in the metabolic processes of plant, which in turn contributed to the differentiation in metabolites reflected in the clustering model [55]. In China, the important Qinling Mountains–Huaihe River boundary divides the subtropical zone and warm temperate zone, thus the average temperature together with the annual precipitation are higher in the south while lower in the northern part [51].
Among the diverse environmental factors that affected wheat lipid species and contents, temperature, and water stress were reported as essential for the performance of lipidomic [16]. Under higher temperature, plants maintained moderate fluidity and integrity of membranes by re-modelling lipid compositions [21,22]. In the present study, the abundance of PC, PE, MGDG, and DGDG with polyunsaturated acyl chains was lower in the Hubei province, which had a higher average temperature compared with the Gansu province (Table S2). These results were consistent with previous results that decreasing polar lipids like PC, PE, PG, MGDG, DGDG, and SG (sterol glycosides) with two unsaturated fatty acid chains, such as 36:5 or 36:6 when wheat was cultivated under high-temperature stress [22]. TGs with more unsaturated acyl chains were abundant in Gansu, especially TG (18:3/18:2/18:2) performed the highest VIP value of 6.48 in wheat samples from Gansu when compared with that from Hubei province, which was also confirmed as the geographical discrimination marker in the previous publication [32]. Unsaturated fatty acids in wheat lipids were the major cis configuration, which added the bends and angulations in fatty acid chains and increased the distances between lipid molecules [22]. Hence, the decrease of unsaturation degree under high-temperature stress was to fasten the membrane structure [21], which was also observed in Henan samples that they contained more TG (24:1/18:2/18:2) compared with Hubei samples. However, linoleic acid and linolenic acid showed higher abundance in Hubei wheat samples compared with Gansu wheat samples, which was contrary to a previous study that the abundance of unsaturated fatty acids was lower under high temperature [21]. That might be the reason why that fatty acids were formed through releasing from membrane lipids in the process of re-modelling lipid compositions to gain more saturated substituents [22].
In addition, greater MGDG (18:2/16:0) abundance was found in Fujian wheat samples while compared with that from Gansu, which might due to the rainfall differences between two provinces according to the previous study that changes of wheat lipid constitutions happened under water shortage treatment [56]. Further, the observed increasing ratio of DGDG and MGDG might be due to the cylindrical shape of DGDG with two galactosyls, which contributed to the formation of a stable bilayer phase while MGDG tended to form an unstable hexagonal phase [10]. These phenomenon might explain the fact that wheat samples from northern provinces in China, which might suffer the water absence induced lower MGDG amount to maintain the stable bilayer membrane structure when compared with wheat samples from southern provinces of China [56].
Diverse lipid constitutes in wheat grains among different regions revealed the adaption that the plant made towards environmental conditions. Thus, the discriminate markers could be seen as the distinct chemical characters of wheat from the specific origin, and could further be used for origin traceability. However, there are still many other factors that might affect the original discriminations and markers of each origin, such as harvest seasons, years, coverage of both producing areas and sample size, and so on. Further, it is difficult to consider all of them in one study [57]. Present results were based on the current sample collection, which collected samples from the main producing areas and controlled the same and main harvest season of wheat in China. The influences of other factors on the original discrimination will be continually investigated in the future.
Although wheat lipids only presented a small amount in the grains, they had contributed significant effects on controlling stability of gas cells in the structures of dough during the fermentation. This effect diversified with different lipid types such as saturated or unsaturated lipids and polar or non-polar lipids [58,59,60]. Understanding the lipid characters of wheat from different origins might be useful for selecting appropriate raw materials for the deep processing of wheat products. Moreover, the presence of free FAs posed a threat to the safety of wheat storage process due to their susceptibility to oxidation and rancidity, which was principally responsible for the decline in quality in food materials [13]. To some extent, the wheat with a higher abundance of FAs in the current research might be paid attention to the safety control during storage process. Additionally, contrary to finding out the markers, a total of 3771 compounds were detected by Progenesis QI software based on the analysis of a total of 94 wheat samples from eight provinces, of which there was 1906 data with features p > 0.01, CV < 30, and FC < 2. Therefore, these 1906 compounds could broadly represent the authentic common substance compositions of wheat. In case chemical information of unknown samples differ significantly from the chemical profile we have constructed, there is reason to doubt the correctness of the samples. Conclusively, the lipid profile of authentic wheat samples was captured and the characteristics and commonness of lipids in wheat from different origins were clarified, which enriched the knowledge of wheat chemical constitutes and might provide the chemical information base for wheat quality and safety control.

4. Conclusions

To sum up, lipid profiles of authentic wheat samples were determined with UPLC-MS analyses, and characteristics of wheat from eight provinces were investigated using the non-targeted lipidomic approach in the present study. A total of 62 lipid components have been detected and identified from Chinese wheat samples. Polar lipids like phospholipids, galactolipids, and sphingolipids, as well as neutral lipids including triglycerides and diglycerides, took a large proportion and showed diversities among different wheat grains. Supervised multivariate analysis PLS-DA showed remarkable classification of authentic wheat samples harvested from different provinces of China based on lipid compositions, and 35 discriminated markers were identified. The abundance of PC, PE, and some galactolipids with polyunsaturated acyl chains were greater in northern wheat samples, while some southern samples contained more MGDG and probably some fatty acids. The present study established the lipid profiles of authentic wheat samples, proved the differences of lipid compositions in wheat grains from diverse origins, which also revealed the applicability of non-targeted metabolomic approach in establish chemical profiles of botanical crops and markers validation. These findings might also be utilized for breeding and selecting wheat samples with different processing applications.

Supplementary Materials

The following are available online at https://www.mdpi.com/2304-8158/10/1/10/s1, Figure S1: Base peak intensity chromatogram of QC sample only extracted by dichloromethane/methanol (5/5, v/v); Figure S2: Base peak intensity chromatogram of QC sample merged the 3-step extractions (n-hexane—dichloromethane/ methanol (5/5, v/v)—acetone/water (5/5, v/v)); Figure S3: Principal component analysis (PCA) scores plot of wheat samples from 8 provinces in China, including 3771 variables without any filtrations; Figure S4: Total ion chromatography (TIC) of all the 11 overlaid QC runs; Table S1: Collection information of wheat samples used in this research; Table S2: Identified discriminant markers according to the PLS-DA loadings with VIP > 1.5; Table S3. Normalized abundance data for the 8 markers in wheat from the provinces with the highest and lowest abundances.

Author Contributions

Conceptualization, Y.Z. and L.Y.; methodology, M.J. and W.Z.; validation, B.G.; investigation, M.J. and W.Z.; resources, B.G.; writing—original draft preparation, M.J. and B.G.; writing—review and editing, M.J. and B.G.; supervision, L.Y.; project administration B.G.; funding acquisition, B.G. All authors have read and agreed to the published version of the manuscript.

Funding

This research was funded by The National Key Research and Development Program of China (Grant No. 2018YFC1602400); and SJTU startup fund for young talent (Grant No. 18X100040051).

Institutional Review Board Statement

Not applicable. Current study did not involve humans or animals.

Informed Consent Statement

Not applicable. Current study did not involve humans.

Data Availability Statement

The data presented in this study are openly available in China Statistical Yearbook-2020 at http://www.stats.gov.cn/tjsj/ndsj/2020/indexch.htm (Reference number 2); SciFinder at https://scifinder.cas.org/scifinder/view/scifinder/scifinderExplore.jsf (Reference number 33); Pubchem at http://pubchem.ncbi.nlm.nih.gov/ (Reference number 34); Home: LIPID MAPS Lipidomics Gateway at http://www.lipidmaps.org/ (Reference number 35).

Acknowledgments

We sincerely appreciate the wheat samples gifted by Ting Peng and Yan Li.

Conflicts of Interest

The authors declare no conflict of interest.

References

  1. Borg, J.; Kiaer, L.; LeCarpentier, C.; Goldringer, I.; Gauffreteau, A.; Saint-Jean, S.; Barot, S.; Enjalbert, J. Unfolding the potential of wheat cultivar mixtures: A meta-analysis perspective and identification of knowledge gaps. Field Crop. Res. 2018, 221, 298–313. [Google Scholar] [CrossRef]
  2. National Bureau of Statistics of China. China Statistical Yearbook-2020. 12-10 Output of Major Farm Products. Available online: http://www.stats.gov.cn/tjsj/ndsj/2020/indexch.htm (accessed on 20 November 2020).
  3. Xu, Z.; Yu, Z.; Zhao, J. Theory and application for the promotion of wheat production in China: Past, present and future. J. Sci. Food Agric. 2013, 93, 2339–2350. [Google Scholar] [CrossRef]
  4. Cheong, B.E.; Ho, W.W.H.; Biddulph, B.; Wallace, X.; Rathjen, T.; Rupasinghe, T.W.T.; Roessner, U.; Dolferus, R. Phenotyping reproductive stage chilling and frost tolerance in wheat using targeted metabolome and lipidome profiling. Metabolomics 2019, 15, 144. [Google Scholar] [CrossRef] [Green Version]
  5. Wadood, S.A.; Guo, B.; Zhang, X.; Wei, Y. Geographical origin discrimination of wheat kernel and white flour using near-infrared reflectance spectroscopy fingerprinting coupled with chemometrics. Int. J. Food Sci. Technol. 2019, 54, 2045–2054. [Google Scholar] [CrossRef]
  6. Aung, M.M.; Chang, Y.S. Traceability in a food supply chain: Safety and quality perspectives. Food Control. 2014, 39, 172–184. [Google Scholar] [CrossRef]
  7. Cavanna, D.; Loffi, C.; Dall’Asta, C.; Suman, M. A non-targeted high-resolution mass spectrometry approach for the assessment of the geographical origin of durum wheat. Food Chem. 2020, 317, 126366. [Google Scholar] [CrossRef]
  8. González-Thuillier, I.; Salt, L.; Chope, G.; Penson, S.; Skeggs, P.; Tosi, P.; Powers, S.J.; Ward, J.L.; Wilde, P.J.; Shewry, P.R.; et al. Distribution of Lipids in the Grain of Wheat (cv. Hereward) Determined by Lipidomic Analysis of Milling and Pearling Fractions. J. Agric. Food Chem. 2015, 63, 10705–10716. [Google Scholar] [CrossRef] [Green Version]
  9. Geng, P.; Harnly, J.M.; Chen, P. Differentiation of Whole Grain from Refined Wheat (T. aestivum) Flour Using Lipid Profile of Wheat Bran, Germ, and Endosperm with UHPLC-HRAM Mass Spectrometry. J. Agric. Food Chem. 2015, 63, 6189–6211. [Google Scholar] [CrossRef]
  10. Jouhet, J. Importance of the hexagonal lipid phase in biological membrane organization. Front. Plant Sci. 2013, 4, 494. [Google Scholar] [CrossRef] [Green Version]
  11. Janssen, F.; Wouters, A.G.; Linclau, L.; Waelkens, E.; Derua, R.; Dehairs, J.; Moldenaers, P.; Vermant, J.; Delcour, J.A. The role of lipids in determining the air-water interfacial properties of wheat, rye, and oat dough liquor constituents. Food Chem. 2020, 319, 126565. [Google Scholar] [CrossRef]
  12. Bekes, F. Relationship between lipid content and composition and loaf volume of twenty-six common spring wheats. Cereal Chem. 1986, 63, 327–331. [Google Scholar]
  13. Tsuzuki, W.; Suzuki, Y.; Yamada, S.; Kano, S.; Ohnishi, H.; Fujimoto, T.; Horigane, A. Effect of oxygen absorber on accumulation of free fatty acids in brown rice and whole grain wheat during storage. LWT 2014, 58, 222–229. [Google Scholar] [CrossRef]
  14. Ribeiro, M.; Nunes-Miranda, J.D.; Branlard, G.; Carrillo, J.M.; Rodriguez-Quijano, M.; Igrejas, G. One Hundred Years of Grain Omics: Identifying the Glutens That Feed the World. J. Proteome Res. 2013, 12, 4702–4716. [Google Scholar] [CrossRef] [PubMed]
  15. Shevkani, K.; Singh, N.; Bajaj, R.; Kaur, A. Wheat starch production, structure, functionality and applications-a review. Int. J. Food Sci. Technol. 2016, 52, 38–58. [Google Scholar] [CrossRef]
  16. Saia, S.; Fragasso, M.; De Vita, P.; Beleggia, R. Metabolomics Provides Valuable Insight for the Study of Durum Wheat: A Review. J. Agric. Food Chem. 2019, 67, 3069–3085. [Google Scholar] [CrossRef]
  17. Righetti, L.; Rubert, J.; Galaverna, G.; Hurkova, K.; Dall’Asta, C.; Hajslova, J.; Stranska-Zachariasova, M. A novel approach based on untargeted lipidomics reveals differences in the lipid pattern among durum and common wheat. Food Chem. 2018, 240, 775–783. [Google Scholar] [CrossRef]
  18. Drivelos, S.A.; Danezis, G.P.; Halagarda, M.; Popek, S.; A Georgiou, C. Geographical origin and botanical type honey authentication through elemental metabolomics via chemometrics. Food Chem. 2020, 338, 127936. [Google Scholar] [CrossRef]
  19. Zhang, Q.; Zhang, Y.; Liu, Z.; Lu, N.; Hai, G.; Shao, S.; Zheng, Q.; Zhang, X.; Fu, H.; Bai, C.; et al. Differentiating Westlake Longjing tea from the first- and second-grade producing regions using ultra high performance liquid chromatography with quadrupole time-of-flight mass spectrometry-based untargeted metabolomics in combination with chemometrics. J. Sep. Sci. 2020, 43, 2794–2803. [Google Scholar] [CrossRef]
  20. Lyu, C.-G.; Kang, C.-Z.; Kang, L.-P.; Yang, J.; Wang, S.; He, Y.-L.; Deng, A.-P.; Wang, H.-Y.; Huang, L.; Guo, L. Structural characterization and discrimination of Ophiopogon japonicas (Liliaceae) from different geographical origins based on metabolite profiling analysis. J. Pharm. Biomed. Anal. 2020, 185, 113212. [Google Scholar] [CrossRef]
  21. Larkindale, J.; Huang, B. Changes of lipid composition and saturation level in leaves and roots for heat-stressed and heat-acclimated creeping bentgrass (Agrostis stolonifera). Environ. Exp. Bot. 2004, 51, 57–67. [Google Scholar] [CrossRef]
  22. Narayanan, S.; Tamura, P.J.; Roth, M.R.; Prasad, P.V.; Welti, R. Wheat leaf lipids during heat stress: I. High day and night temperatures result in major lipid alterations. Plant Cell Environ. 2016, 39, 787–803. [Google Scholar] [CrossRef] [PubMed] [Green Version]
  23. Carrasco-Pancorbo, A.; Navas-Iglesias, N.; Cuadros-Rodríguez, L. From lipid analysis towards lipidomics, a new challenge for the analytical chemistry of the 21st century. Part I: Modern lipid analysis. TrAC Trends Anal. Chem. 2009, 28, 263–278. [Google Scholar] [CrossRef]
  24. Sun, T.; Wang, X.; Cong, P.; Xu, J.; Xue, C. Mass spectrometry-based lipidomics in food science and nutritional health: A comprehensive review. Compr. Rev. Food Sci. Food Saf. 2020, 19, 2530–2558. [Google Scholar] [CrossRef] [PubMed]
  25. Lavergne, F.D.; Broeckling, C.D.; Cockrell, D.M.; Haley, S.D.; Peairs, F.B.; Jahn, C.E.; Heuberger, A.L. GC-MS Metabolomics to Evaluate the Composition of Plant Cuticular Waxes for Four Triticum aestivum Cultivars. Int. J. Mol. Sci. 2018, 19, 249. [Google Scholar] [CrossRef] [PubMed] [Green Version]
  26. Holt, M.D.; Moreau, R.; DerMarderosian, A.; McKeown, N.; Jacques, P.F. Accelerated Solvent Extraction of Alkylresorcinols in Food Products Containing Uncooked and Cooked Wheat. J. Agric. Food Chem. 2012, 60, 4799–4802. [Google Scholar] [CrossRef] [PubMed]
  27. Wadood, S.A.; Boli, G.; Xiaowen, Z.; Raza, A.; Wei, Y. Geographical discrimination of Chinese winter wheat using volatile compound analysis by HS-SPME/GC-MS coupled with multivariate statistical analysis. J. Mass Spectrom. 2020, 55, e4453. [Google Scholar] [CrossRef]
  28. Finnie, S.M.; Jeannotte, R.; Faubion, J.M. Quantitative Characterization of Polar Lipids from Wheat Whole Meal, Flour, and Starch. Cereal Chem. J. 2009, 86, 637–645. [Google Scholar] [CrossRef]
  29. Rodionova, O.; Pomerantsev, A. Chemometric tools for food fraud detection: The role of target class in non-targeted analysis. Food Chem. 2020, 317, 126448. [Google Scholar] [CrossRef]
  30. Gao, B.; Holroyd, S.E.; Moore, J.C.; Laurvick, K.; Gendel, S.M.; Xie, Z. Opportunities and Challenges Using Non-targeted Methods for Food Fraud Detection. J. Agric. Food Chem. 2019, 67, 8425–8430. [Google Scholar] [CrossRef]
  31. Righetti, L.; Rubert, J.; Galaverna, G.; Folloni, S.; Ranieri, R.; Stranska-Zachariasova, M.; Hajslova, J.; Dall’Asta, C. Characterization and Discrimination of Ancient Grains: A Metabolomics Approach. Int. J. Mol. Sci. 2016, 17, 1217. [Google Scholar] [CrossRef] [Green Version]
  32. Stark, T.D.; Weiss, P.; Friedrich, L.; Hofmann, T. The wheat species profiling by non-targeted UPLC–ESI–TOF-MS analysis. Eur. Food Res. Technol. 2020, 246, 1617–1626. [Google Scholar] [CrossRef]
  33. SciFinder. Available online: https://scifinder.cas.org/scifinder/view/scifinder/scifinderExplore.jsf (accessed on 20 November 2020).
  34. Pubchem. Available online: http://pubchem.ncbi.nlm.nih.gov/ (accessed on 15 May 2013).
  35. Home: LIPID MAPS Lipidomics Gateway. Available online: http://www.lipidmaps.org/ (accessed on 28 June 2013).
  36. De Vos, R.C.H.; Moco, S.; Lommen, A.; Keurentjes, J.J.B.; Bino, R.J.; Hall, R.D. Untargeted large-scale plant metabolomics using liquid chromatography coupled to mass spectrometry. Nat. Protoc. 2007, 2, 778–791. [Google Scholar] [CrossRef] [PubMed]
  37. Claassen, C.; Kuballa, J.; Rohn, S. Polar Lipids in Starch-Rich Commodities to be Analyzed with LC-MS-Based Metabolomics-Optimization of Ionization Parameters and High-Throughput Extraction Protocols. Metabolites 2019, 9, 167. [Google Scholar] [CrossRef] [PubMed] [Green Version]
  38. Abdel-Razek, A. Elucidation of polynutrients and fatty acid patterns of wheat germ oil extracted by n-hexane and chloroform/methanol. J. Appl. Sci. Res 2011, 7, 1840–1846. [Google Scholar]
  39. Kara, G.M. Some chemical and physical properties, fatty acid composition and bioactive compounds of wheat germ oils extracted from different wheat cultivars. Tarım Bilim. Derg. 2016, 22, 433–443. [Google Scholar] [CrossRef]
  40. Geng, P.; Harnly, J.M.; Chen, P. Differentiation of bread made with whole grain and refined wheat (T. aestivum) flour using LC/MS-based chromatographic fingerprinting and chemometric approaches. J. Food Compos. Anal. 2016, 47, 92–100. [Google Scholar] [CrossRef] [Green Version]
  41. Fang, J.; Barcelona, M.J. Structural determination and quantitative analysis of bacterial phospholipids using liquid chromatography/electrospray ionization/mass spectrometry. J. Microbiol. Methods 1998, 33, 23–35. [Google Scholar] [CrossRef]
  42. Kim, Y.H.; Gil, J.H.; Hong, J.; Yoo, J.S. Tandem mass spectrometric analysis of fatty acyl groups of galactolipid molecular species from wheat flour. Microchem. J. 2001, 68, 143–155. [Google Scholar] [CrossRef]
  43. Zhu, Y.; Soroka, D.N.; Sang, S. Structure Elucidation and Chemical Profile of Sphingolipids in Wheat Bran and Their Cytotoxic Effects against Human Colon Cancer Cells. J. Agric. Food Chem. 2013, 61, 866–874. [Google Scholar] [CrossRef]
  44. Vesper, H.; Schmelz, E.-M.; Nikolova-Karakashian, M.N.; Dillehay, D.L.; Lynch, D.V.; Merrill, A.H. Sphingolipids in Food and the Emerging Importance of Sphingolipids to Nutrition. J. Nutr. 1999, 129, 1239–1250. [Google Scholar] [CrossRef] [Green Version]
  45. Merrill, J.A.H.; Sullards, M.C.; Allegood, J.C.; Kelly, S.; Wang, E. Sphingolipidomics: High-throughput, structure-specific, and quantitative analysis of sphingolipids by liquid chromatography tandem mass spectrometry. Methods 2005, 36, 207–224. [Google Scholar] [CrossRef] [PubMed]
  46. Sullards, M.C. Analysis of sphingomyelin, glucosylceramide, ceramide, sphingosine, and sphingosine 1-phosphate by tandem mass spectrometry. Methods Enzymol. 2000, 312, 32–45. [Google Scholar] [PubMed]
  47. Koistinen, V.M.; Hanhineva, K. Mass spectrometry-based analysis of whole-grain phytochemicals. Crit. Rev. Food Sci. Nutr. 2017, 57, 1688–1709. [Google Scholar] [CrossRef] [PubMed]
  48. Zhou, Q.; Gao, B.; Zhang, X.; Xu, Y.; Shi, H.; Yu, L. Chemical profiling of triacylglycerols and diacylglycerols in cow milk fat by ultra-performance convergence chromatography combined with a quadrupole time-of-flight mass spectrometry. Food Chem. 2014, 143, 199–204. [Google Scholar] [CrossRef]
  49. Marzilli, L.A.; Fay, L.B.; Dionisi, F.; Vouros, P. Structural characterization of triacylglycerols using electrospray ionization-MSn ion-trap MS. J. Am. Oil Chem. Soc. 2003, 80, 195–202. [Google Scholar] [CrossRef]
  50. Jakab, A.; Héberger, K.; Forgács, E. Comparative analysis of different plant oils by high-performance liquid chromatography–atmospheric pressure chemical ionization mass spectrometry. J. Chromatogr. A 2002, 976, 255–263. [Google Scholar] [CrossRef]
  51. Kou, Z.-X.; Yao, Y.-H.; Hu, Y.; Zhang, B.-P. Discussion on position of China’s north-south transitional zone by comparative analysis of mountain altitudinal belts. J. Mt. Sci. 2020, 17, 1901–1915. [Google Scholar] [CrossRef]
  52. Wang, P.; Wu, D.; Yang, J.; Ma, Y.; Feng, R.; Huo, Z. Summer maize growth under different precipitation years in the Huang-Huai-Hai Plain of China. Agric. For. Meteorol. 2020, 285, 107927. [Google Scholar] [CrossRef]
  53. Wang, L.; Li, L.; Fan, J.; Saito, M.; Tatsumi, E. Radical-Scavenging Activity and Isoflavone Content of Sufu (Fermented Tofu) Extracts from Various Regions in China. Food Sci. Technol. Res. 2004, 10, 324–327. [Google Scholar] [CrossRef] [Green Version]
  54. Song, Y.; Nie, F.; Zhang, C.; Xiang, S. A unified framework for semi-supervised dimensionality reduction. Pattern Recognit. 2008, 41, 2789–2799. [Google Scholar] [CrossRef]
  55. Zhao, H.; Guo, B.; Wei, Y.; Zhang, B.; Sun, S.; Zhang, L.; Yan, J. Determining the Geographic Origin of Wheat Using Multielement Analysis and Multivariate Statistics. J. Agric. Food Chem. 2011, 59, 4397–4402. [Google Scholar] [CrossRef] [PubMed]
  56. Wang, Y.; Zhang, X.; Huang, G.; Feng, F.; Liu, X.; Guo, R.; Gu, F.; Zhong, X.; Mei, X. Dynamic changes in membrane lipid composition of leaves of winter wheat seedlings in response to PEG-induced water stress. BMC Plant Biol. 2020, 20, 1–15. [Google Scholar] [CrossRef] [PubMed]
  57. Hristov, N.; Mladenov, N.; Djuric, V.; Kondić-Špika, A.; Marjanović-Jeromela, A.; Šimić, D. Genotype by environment interactions in wheat quality breeding programs in southeast Europe. Euphytica 2009, 174, 315–324. [Google Scholar] [CrossRef]
  58. Sroan, B.S.; MacRitchie, F. Mechanism of gas cell stabilization in breadmaking. II. The secondary liquid lamellae. J. Cereal Sci. 2009, 49, 41–46. [Google Scholar] [CrossRef]
  59. Khalid, K.H.; Ohm, J.-B.; Simsek, S. Whole wheat bread: Effect of bran fractions on dough and end-product quality. J. Cereal Sci. 2017, 78, 48–56. [Google Scholar] [CrossRef]
  60. Mills, E.; Wilde, P.; Salt, L.; Skeggs, P. Bubble Formation and Stabilization in Bread Dough. Food Bioprod. Process. 2003, 81, 189–193. [Google Scholar] [CrossRef]
Figure 1. UPLC/Q-TOF-MS BPI chromatogram of lipid profiles in QC wheat sample.
Foods 10 00010 g001
Figure 2. MS spectra of PC (16:0/18:2). (peak 25) (a) MS1 spectrum and (b) MS2 spectrum.
Foods 10 00010 g002
Figure 3. MS spectra of MGDG (18:3/18:2). (peak 14) (a) MS1 spectrum, (b) MS2 spectrum and (c) Amplificatory MS2 spectrum.
Foods 10 00010 g003
Figure 4. MS spectra of Cer (d18:0/16:0). (peak 30) (a) MS1 spectrum and (b) MS2 spectrum.
Foods 10 00010 g004
Figure 5. MS spectra of TG (18:3/18:2/16:0). (Peak 48) (a) MS1 spectrum and (b) MS2 spectrum.
Foods 10 00010 g005
Figure 6. Partial least square discriminant analysis (PLS-DA) (a) scores plot and (b) loading plot of wheat samples from eight provinces in China. * X variables with the red box in the loading plot were the markers with VIP values > 1.5.
Foods 10 00010 g006
Figure 7. The whole view of the identified discriminated markers * in PLS-DA loading plot. * Markers were these contributed significant difference to the PLS-DA model with VIP > 1.5. Markers with different colors represented the abundance variables between the greatest versus lowest provinces. For example, the abundance of marker No. 1 colored with black was greatest in Anhui province and lowest in Gansu. A total of eight box plots were given for the markers with the maximum VIP value in the corresponding origin group set. Marker numbers and compound details could be found in Table S2.
Foods 10 00010 g007
Table 1. Chemical compounds identification of QC * wheat sample.
Peak
No.
RT
(min)
Exptl.
Mass
Calc.
Mass
Difference
(ppm)
Chemical
Formula
Tentative
Identification
Adducts #Fragments
14.79279.2325279.23240.36C18H30O2Linolenic acidM+H261.2218, 243.2115, 223.1702
25.70518.3240518.3247−1.35C26H48NO7PLyso PC (18:3)M+H, M+Na184.0731, 261.2234
36.21520.3404520.34030.19C26H50NO7PLyso PC (18:2)M+H, M+H-H2O, M+Na184.0739, 337.2746, 263.2377
46.57263.2378263.23751.14C18H32O2Linoleic acidM+H-H2O245.2271
56.60485.2899485.28794.12C22H45O9PLyso PG (16:0)M+H, M+Na313.2745
66.73496.3403496.34030C24H50NO7PLyso PC (16:0)M+H, M+Na, M+H-H2O184.0740, 518.3212, 478.3301, 313.2742
76.85522.3562522.35600.38C26H52NO7PLyso PC (18:1)M+H, M+Na184.0737, 544.3376, 339.2884
87.24265.2527265.2531−1.51C18H34O2Oleic acidM+H-H2O247.2427
97.71524.3718524.37160.38C26H54NO7PLyso PC (18:0)M+H, M+Na184.0740, 546.3522, 341.3028
109.59338.3422338.3423−0.29C22H43ON13-docosenamideM+H321.3154
1110.53961.5863961.5864−0.10C51H86O15DGDG (18:3/18:2)M+Na, M+NH4615.4992, 335.2579, 337.2722
1210.56780.5539780.5543−0.51C44H78NO8PPC (18:2/18:3)M+H, M+Na184.0740, 804.5352,
615.4985, 337,2734, 335.2593
1310.90397.3834397.38340C29H50Oβ-SitosterolM+H-H2O261.2611, 243.2099
14
15
11.21
11.50
799.5336
958.6453
799.5336
958.6467
0
−1.46
C45H76O10
C51H88O15
MGDG (18:3/18:2)
DGDG (18:1/18:3)
M+Na, M+NH4
M+NH4. M+Na
615.4988, 519.2949, 521.3074
617.5142, 963.6005, 339.2884, 335.2583,
261.2213
1611.54782.5692782.5700−1.02C44H80NO8PPC (18:2/18:2)M+H, M+Na184.0739, 804.5507, 617.5141,
337.2737, 263.2372
17
18
11.72
11.72
756.5547
937.5855
756.5543
937.5864
0.53
−0.96
C42H78NO8P
C49H86O15
PC (16:0/18:3)
DGDG (16:0/18:3)
M+H, M+Na
M+Na, M+NH4
184.0737, 778.5366, 573.4870,
313.2751, 335.2583
591.4999, 313.2751, 335.2583
1911.90405.3738405.37331.23C27H48O2AR (21:0)M+H169.0864
2011.99740.5226740.5230−0.54C41H74NO8PPE (18:2/18:2)M+H599.5045, 164.0087, 337.2759, 263.2316
2112.36801.5483801.5493−1.19C45H78O10MGDG (18:2/18:2)M+Na, M+NH4617.5139, 337.2738, 263.2366
2212.88965.6168965.6177−0.93C51H90O15DGDG (18:2/18:1)M+Na, M+NH4619.5295, 337.2737, 339.2901
2312.94784.5849784.5856−0.87C44H82NO8PPC (18:2/18:1)M+H, M+Na184.0738, 601.5189. 337.2745, 339.2901
2413.00939.6007939.6021−1.49C49H88O15DGDG (16:0/18:2)M+Na, M+NH4593.5148, 313.2745, 337.2736, 263.2358
2513.04758.5695758.5700−0.67C42H80NO8PPC (16:0/18:2)M+H, M+Na184.0737, 575.5029, 313.2738, 337.2738,
263.2369, 239.2382
2613.68716.5225716.5230−0.70C39H74NO8PPE (16:0/18:3)M+H, M+Na575.5034, 164.0086, 313.2756
2714.02803.5647803.5649−0.25C45H80O15MGDG (18:2/18:1)M+Na, M+NH4601.5180, 337.2742, 339.2883
2814.09639.4965639.49640.16C39H68O5DG (18:2/18:2)M+Na, M+H337.2743, 263.2377
2914.14777.5486777.5493−0.90C43H78O10MGDG (18:2/16:0)M+Na, M+NH4575.5027, 337.2739, 313.2733
3014.82562.5194562.51753.37C34H69NO3Cer (d18:0/16:0)M+Na324.2898, 306.2793
3114.86786.6000786.6013−1.59C44H84NO8PPC (18:1/18:1)M+H, M+Na184.0738, 603.5320, 339.2904
3214.88941.6179941.61770.21C49H90O15DGDG (18:1/16:0)M+Na, M+NH4577.5204, 595.5320, 339.2892, 313.2736
3314.98760.5846760.5856−1.34C42H82NO8PPC (16:0/18:1)M+H, M+Na184.0738, 313.2736, 339.2881
3415.08734.5682734.5700−2.45C40H80NO8PPC (16:0/16:0)M+H, M+Na184.0738, 313.2724
3515.13967.6302967.63343.31C51H92O15DGDG (18:0/18:2)M+Na, M+NH4621.5435, 341.3051, 337.2723
3615.84601.5196601.51960C39H70O5DG (18:1/18:2)M+H-H2O, M+Na641.5116, 337.2740, 339.2924
3715.91575.5035575.5039−0.67C37H68O5DG (18:2/16:0)M+H-H2O, M+Na615.4962, 313.2730, 239.2368, 263.2388,
337.2751
3816.21641.5121641.51210.07C39H70O5DG (18:2/18:1)M+Na, M+H-H2O339.2895, 337.2743
3917.57603.5346603.5352−0.99C39H72O5DG (18:1/18:1)M+H-H2O, M+Na339.2897
4017.64577.5201577.51960.87C37H70O5DG (16:0/18:1)M+H-H2O, M+Na339.2900, 313.2752
4118.90877.7283877.7285−0.23C57H96O6TG (18:3/18:2/18:2)M+H597.4886, 599.5010, 261.2220, 337.2750
4220.17853.7276853.7285−1.08C55H9606TG (18:2/18:2/16:1)M+H599.5036, 573,4883
4320.59892.7370892.7394−2.74C57H94O6TG (18:2/18:3/18:3)M+NH4, M+Na597.4885, 595.4723, 261.2222, 263.2357
4421.43855.7402855.7442−4.67C55H98O6TG (16:1/18:1/18:2)M+H575.5041, 601.5191, 591.4982,
263.2359
4521.87894.7540894.7551−1.24C57H96O6TG (18:3/18:2/18:2)M+NH4, M+Na,
M+H
597.4882, 599.5024, 261.2225, 263.2365
4622.27868.7374868.7394−2.31C55H94O6TG (16:0/18:3/18:3)M+NH4573.4875, 595.4715, 261.2215, 239.2369
4723.42896.7692896.7707−1.66C57H98O6TG (18:3/18:1/18:2)M+NH4, M+Na,
M+H
599.5039,597.4883, 263.2372, 261.2220,
265.2502
4823.87870.7543870.7551−0.92C55H96O6TG (18:3/18:2/16:0)M+NH4, M+H, M+Na597.4885, 575.5031, 573.4888, 313.2735,
261.2219, 263.2371
4925.12898.7851898.7864−1.50C57H100O6TG (18:1/18:2/18:2)M+NH4, M+Na,
M+H
601.5190, 599.5042, 263.2372, 265.2530
5025.37872.7695872.7707−1.41C55H98O6TG (16:0/18:2/18:2)M+NH4, M+Na,
M+H
575.5036, 599.5036, 263.2372, 239.2371
5126.46926.8163926.8177−1.55C59H104O6TG (20:1/18:2/18:2)M+NH4, M+Na629.5507, 599.5030, 263.2381, 293.2830
5226.59900.8008900.8020−1.33C57H102O6TG (18:2/18:1/18:1)M+NH4, M+Na601.5192, 603.5335, 265.2534, 263.2368
5326.81874.7850874.7864−1.60C55H100O6TG (18:2/18:1/16:0)M+NH4, M+Na601.5189, 577.5184, 575.5033, 263.2371,
265.2524, 239.2369
5427.00848.7700848.7707−0.82C53H98O6TG (18:2/16:0/16:0)M+NH4, M+Na575.5038, 551.5039, 263.2372, 239.2381
5527.66954.8481954.8490−0.90C61H108O6TG (18:2/22:1/18:2)M+NH4657.5815, 599.5043, 263.2386
5627.79928.8327928.8333−0.67C59H106O6TG (18:2/18:1/20:1)M+NH4601.5201, 631.5652, 629.5511
5727.97902.8168902.8177−0.95C57H104O6TG (20:1/16:1/18:1)M+NH4, M+Na603.5355, 575.5048, 631.5648
5828.23876.8003876.8020−1.99C55H102O6TG (16:0/18:1/18:1)M+NH4, M+Na577.5192, 603.5347, 265.2528, 239.2381
5928.49850.7857850.7864−0.83C53H100O6TG (18:1/16:0/16:0)M+NH4, M+Na577.5188, 551.5038, 239.2375, 265.2530
6028.84824.7705824.7707−0.23C51H98O6TG (16:0/16:0/16:0)M+NH4551.5038, 239.2386
6129.04982.8810982.88030.71C63H112O6TG (24:1/18:2/18:2)M+NH4, M+Na685.6135, 599.5028
6229.38930.8482930.8490−0.89C59H108O6TG (18:1/18:1/20:1)M+NH4631.5659, 603.5343, 265.2540
* Abbreviations: QC, quality control samples; RT, retention time; Exptl. and Calc. Mass, experimental and calculative m/z of molecular ions; TG, triacylglycerols; DG, diglyceride; AR, alkylresorcinols; PC, phosphatidylcholine; Lyso PC, lysophosphatidylcholines; PE, phosphoethanolamine; Lyso-PG, lyso-phosphatidylglycerol; DGDG, digalactosyldiacylglycerol; MGDG, monogalactosyldiacylglycerol; Cer, ceramide. # Adducts and fragments were given with the most reliable peaks as well as in the order of peak intensity; The most abundant precursor ion signal in MS 1 spectrum and its theoretical value were listed as Exptl. and Calc. Mass.
Publisher’s Note: MDPI stays neutral with regard to jurisdictional claims in published maps and institutional affiliations.

