Article

How Efficiently Do Elite US Universities Produce Highly Cited Papers?

by
Klaus Wohlrabe
1,*,
Félix de Moya Anegon
2 and
Lutz Bornmann
3
1
Ifo Institute, Poschingerstr. 5, 81679 Munich, Germany
2
CSIC, Institute of Public Goods and Policies (IPP) Consejo Superior de Investigaciones Científicas C/Albasanz, 26-28 28037 Madrid, Spain
3
Division for Science and Innovation Studies, Administrative Headquarters of the Max Planck Society Hofgartenstr. 8, 80539 Munich, Germany
*
Author to whom correspondence should be addressed.
Publications 2019, 7(1), 4; https://doi.org/10.3390/publications7010004
Submission received: 2 October 2018 / Revised: 21 December 2018 / Accepted: 7 January 2019 / Published: 10 January 2019

Abstract

:
While output and impact assessments were initially at the forefront of institutional research evaluations, efficiency measurements have become popular in recent years. Research efficiency is measured by indicators that relate research output to input. The additional consideration of research input in research evaluation is obvious, since the output depends on the input. The present study is based on a comprehensive dataset with input and output data for 50 US universities. As input, we used research expenses, and as output the number of highly-cited papers. We employed Data Efficiency Analysis (DEA), Free Disposal Hull (FDH) and two more robust models: the order-m and order-α approaches. The results of the DEA and FDH analysis show that Harvard University and Boston College can be called especially efficient compared to the other universities. While the strength of Harvard University lies in its high output of highly-cited papers, the strength of Boston College is its small input. In the order-α and order-m frameworks, Harvard University remains efficient, but Boston College becomes super-efficient. We produced university rankings based on adjusted efficiency scores (subsequent to regression analyses), in which single covariates (e.g., the disciplinary profile) are held constant.

1. Introduction

The science system has been characterised by the transition from academic science to post-academic science for several years. “Bureaucratization” is the term used to describe most of the processes connected with post-academic science: “The transition from academic to post-academic science is signaled by the appearance of words such as management, contract, regulation, accountability, training, employment, etc. which previously had no place in scientific life. This vocabulary did not originate inside science, but was imported from the more ‘modern’ culture which emerged over several centuries in Western societies—a culture characterized by Weber as essentially ‘bureaucratic’” ([1], p. 82). As an important part of universities’ commitments to accountability (against the government), research evaluation has assumed a steadily growing importance in the science system. While academic science (since its beginnings) has been characterised by the use of the peer-review system to assess single outcomes of science (e.g., manuscripts, [2]), post-academic science is characterised by the use of quantitative methods of research evaluation. According to Wilsdon, et al. [3], there are currently “three broad approaches to the assessment of research: a metrics-based model; peer review; and a mixed model, combining these two approaches. Choosing between these remains contentious” (p. 59). Typical metrics are publications and citations [4]. For example, the government of Mexico follows a metrics-based model by allocating funds to higher education institutions with several indicators [5].
A special characteristic of research evaluation in the area of post-academic science is the emergence of university rankings. Here, metrics are used to rank the universities in a country or worldwide [6]. University rankings have some obvious advantages. They offer, for example, a quick, simple, and easy way of comparing universities (worldwide). The most interested groups in the rankings are students, the public and governments [3]. However, a lot of critiques have been published in recent years (see e.g., Reference [7]) that focus on the methods and arbitrary weightings used to combine different metrics. Daraio, et al. [8] cited four points summarizing the main criticisms aimed at rankings: mono-dimensionality, statistical robustness, dependence on university size and subject mix, and lack of consideration of the input–output structure.
In this scientometric study, we pick up the last point “lack of consideration of the input-output structure” and set a possible approach for input–output consideration in institutional evaluation to discuss (in scientometrics). Since positions in rankings depend on certain context factors [9,10], rankings should not only offer information on the output, but also the relation of input to output. Moed and Halevi [11] define input indicators as follows: “indicators that measure the human, physical, and financial commitments devoted to research. Typical examples are the number of (academic) staff employed or revenues such as competitive, project funding for research” (p. 1990).
If metrics are used that relate output to input (e.g., the number of papers per full time equivalent researcher), research efficiency is measured. Thus, this study is intended to explore approaches of measuring the efficiency of universities. The study follows on from a recent discussion in the Journal of Informetrics, which started with Abramo’s and D’Angelo’s [12] doubts about the validity of established bibliometric indicators and the comments that ensued. Instead, they plead in favor of measuring scientific efficiency. For example, they proposed the Fractional Scientific Strength (FSS) indicator, which is a composite indicator that considers the total salary of the research staff and the total number of publications weighted with citation impact (when used on the university level).

2. Conceptual Framework

This study follows the call of Bornmann and Haunschild [13] and Waltman, et al. [14] who propose in a comment on the paper by Abramo’s and D’Angelo’s [12] that scientometricians should try to explore methods and available data to measure the efficiency of research. We do this both by using a unique data set and applying approaches rarely used in academic efficiency analysis. The former comprises information for the top 50 US American universities from the Times Higher Education (THE) Ranking 2015. Input is defined by annual research expenses. The output concerns the 1% most frequently cited publications in a specific field and given year (Ptop 1%). The focus on these top publications is derived from the fact that we focus on elite universities represented by the 50 best ranked universities in the THE. Whereas the input we used is standard in the literature, our output variable has never been used before (to the best of our knowledge)—although it is very suitable to study the efficiency of top institutions. Other output variables such as total number of publications, number of graduates or third-party funding could have equally been considered. However, we had three reasons to focus on highly-cited papers: (1) Reputable universities should be evaluated with indicators which focus on excellent research. (2) Gralka, et al. [15] and other studies have shown that conclusions are very similar if (top-cited) publications, third-party funding or other indicators are used in the efficiency analysis. (3) We wanted to trace out the ‘pure’ research effect in efficiency analysis. Including, for instance, teaching-oriented variables would divert from this goal.
University rankings identify top universities from around the world using various indicators. We initially had the idea to undertake a global university analysis by including not only US universities, but also top universities from other countries. This would require an international database with comparable input and output data. Whereas these data are available on the publication output side (with, e.g., the Scopus database from Elsevier), they are not available on the input side. We focus, therefore, in this study on US universities for which comparable data are available in a national database.
The most frequently used tool in the academic efficiency literature is the Data Efficiency Analysis (DEA) and variations of this non-parametric approach. The DEA yields an institutional efficiency score between 0 and 1, where 1 means efficient. However, these non-parametric approaches have several shortcomings. There is no well-defined data-generating process, and a deterministic approach is assumed: “Any deviation from the frontier is associated with inefficiency, and it is not possible to take into consideration casual elements or external noise which might have affected the results” [16]. The most serious drawback of the DEA in its simplest form is that it is extremely vulnerable to outliers and measurement errors.1
Thus, we further employ the Free Disposal Hull (FDH), which is less prone to outliers, and apply the partial frontier analysis (PFA), which nests FDH and DEA. Specifically, we employ the order- m [17] and order-α [18] approaches. Here, the sensitivity to outliers and measurement errors is reduced by allowing for super-efficient universities with efficiency scores larger than 1. To this end, sub-samples of the data are used and resampling techniques are employed. The use of four different approaches allows us to validate the robustness of our conclusions. Finally, we calculate efficiency scores adjusted for institutional background and research focus.
There is plenty of literature examining the efficiency of (higher) education institutions. Early examples are Lindsay [19] and Bessent, et al. [20]. Worthington [21] and more recently Rhaiem [22] as well as De Witte and López-Torres [23] provide comprehensive surveys of the literature. In the efficiency analyses of higher education institutions, PFA has rarely been used. Bonaccorsi, et al. [24,25] applied the order-m approach to study 45 universities in Italy and 261 universities across four European countries, respectively. De Witte, et al. [26] used DEA and PFA to study the performance of 155 professors working at a Business & Administration department of a Brussels university college. Bruffaerts, et al. [27] used FDH and PFA to study the efficiency of 124 US universities. The authors tried to explain which factors drove the efficiency scores. However, they do not provide scores for each university. Gnewuch and Wohlrabe [28] used partial frontier analysis to identify super-efficient economics departments. There are several studies available in the literature which have investigated efficiency aspects in the US higher education system [29,30,31,32,33,34].
The paper is organized as follows: It starts by explaining the four statistical approaches used in this study for calculating the efficiency scores of the universities. The paper subsequently describes the data set and provides some descriptive statistics. In the first step, we calculate efficiency scores for the universities. In the second step, we calculate adjusted efficiency scores. These scores are adjusted to the different profiles of the universities (e.g., their disciplinary profiles). After presenting our results, we discuss the implications of our analysis.

3. Methods

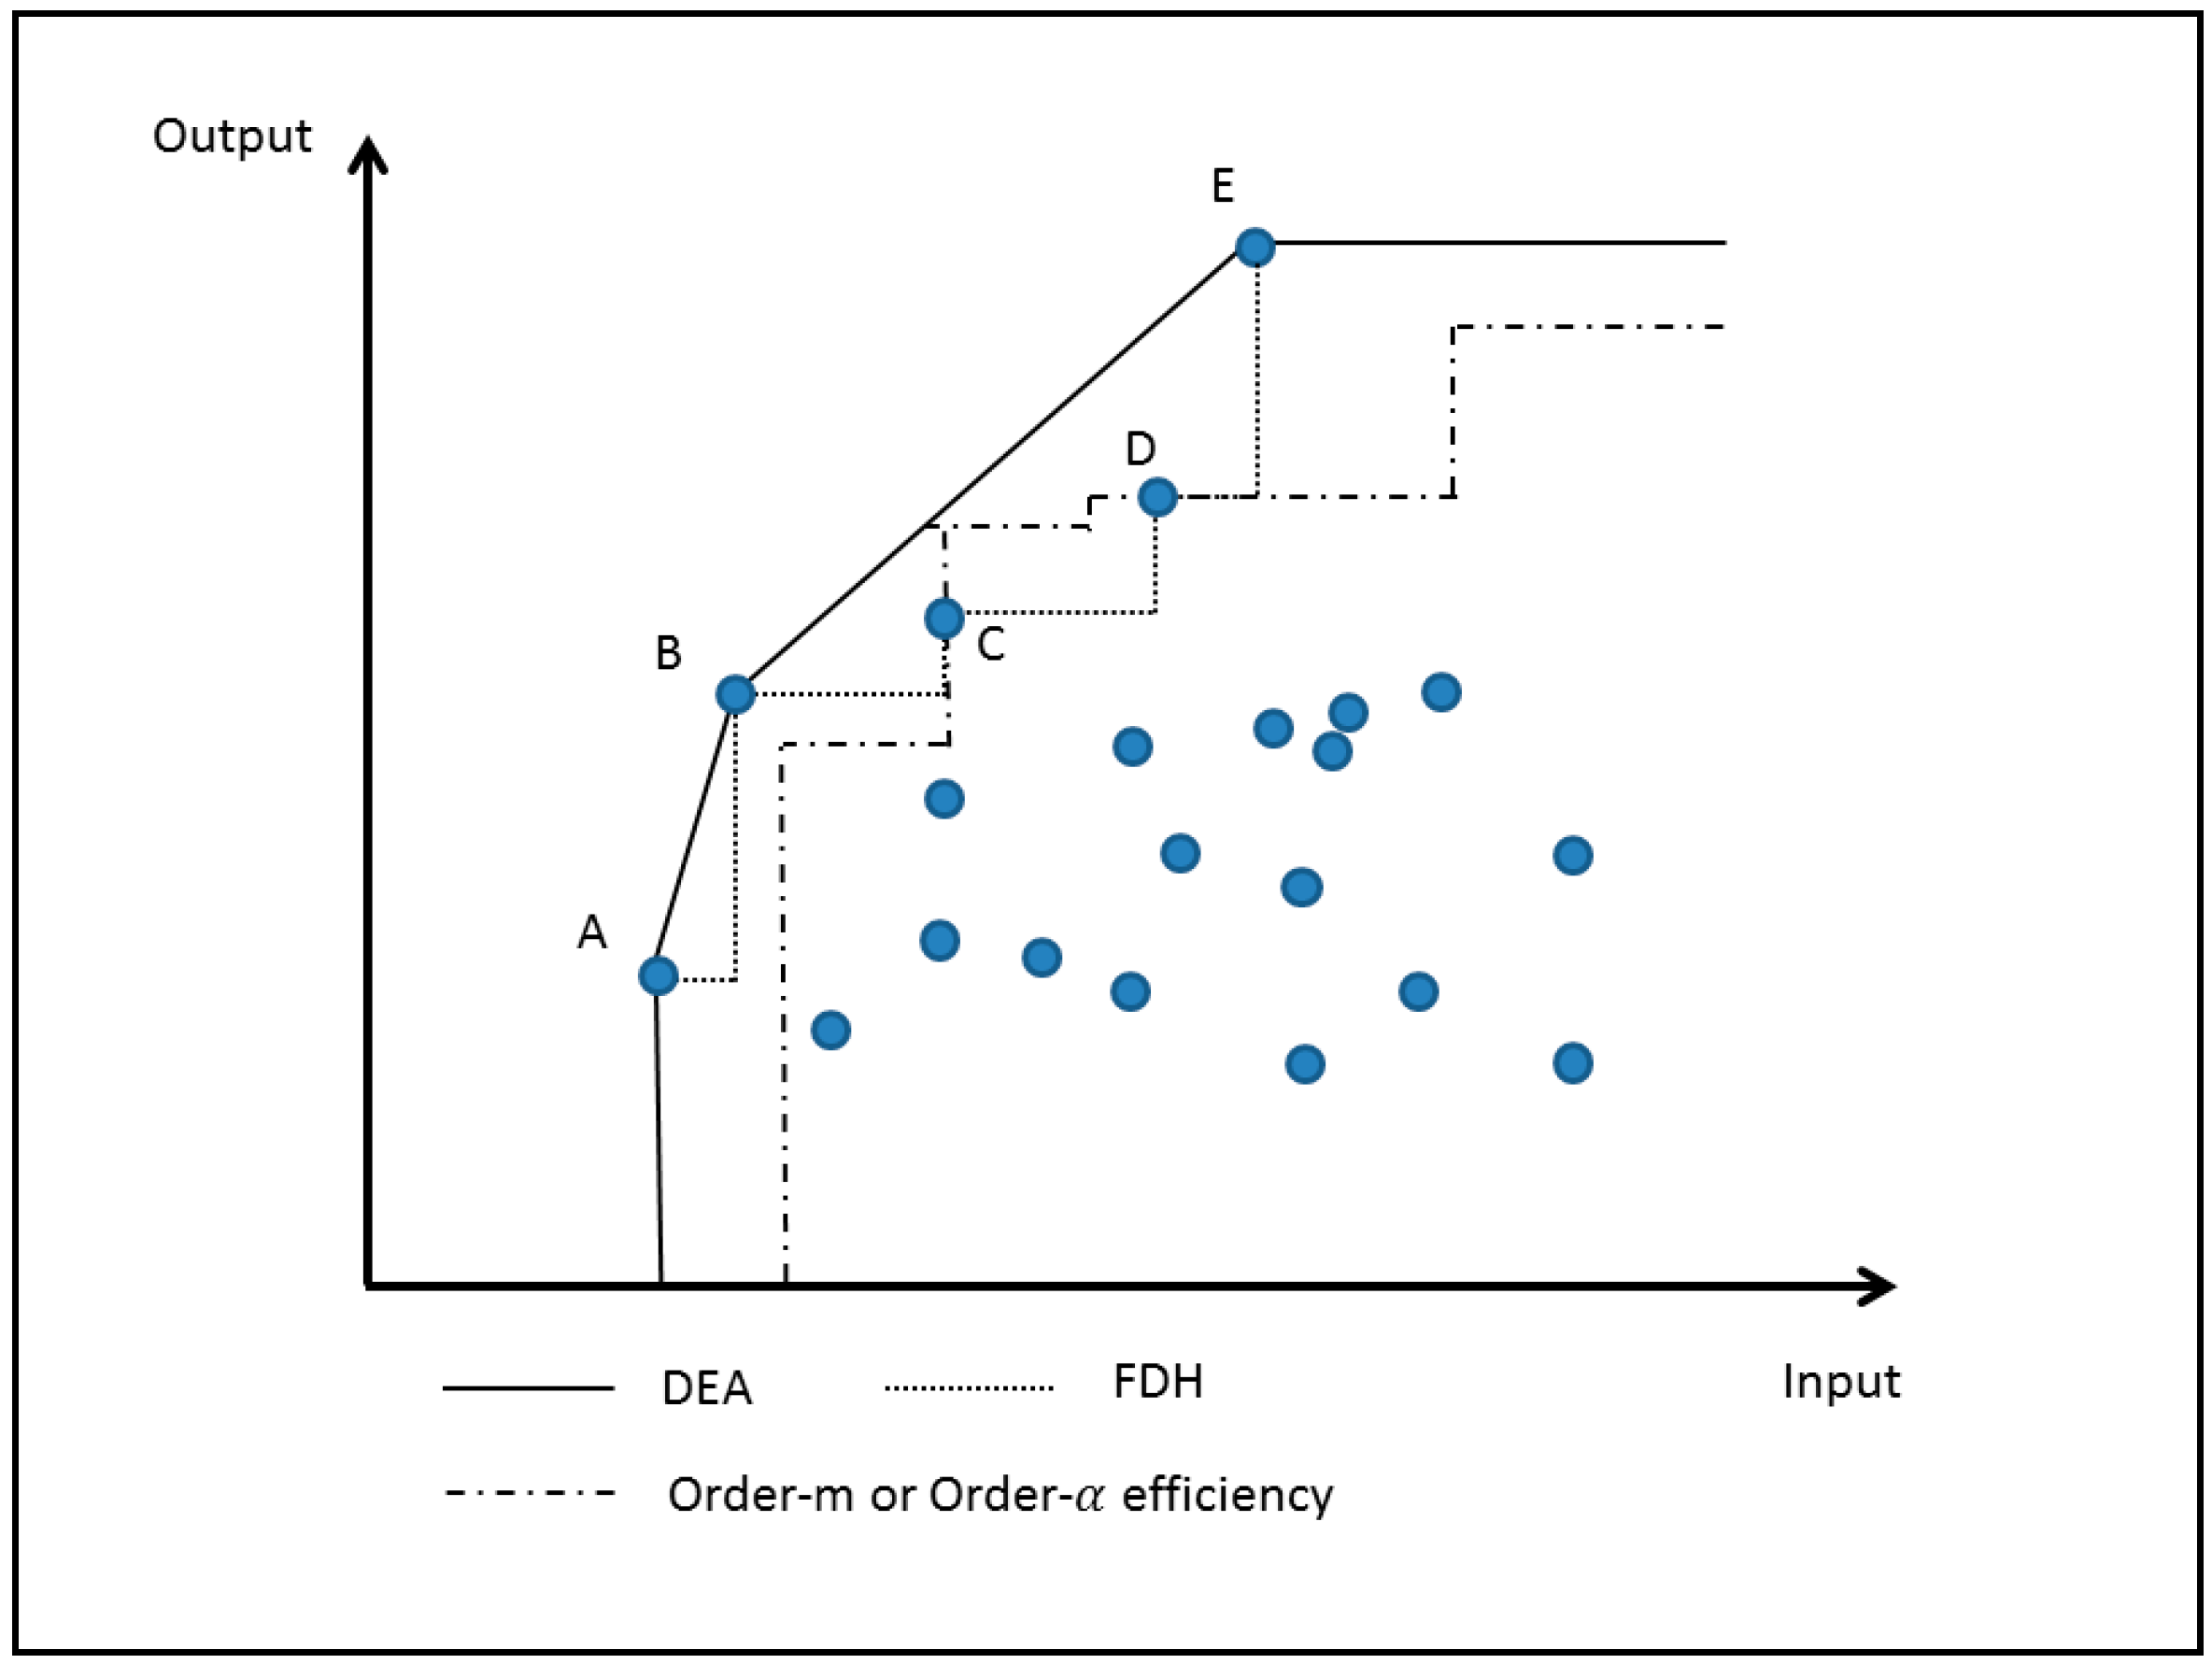
3.1. (Partial) Academic Production Frontier Analysis

The main goal of efficiency measurement is to calculate an efficiency score for each unit (here: each university). There are two main concepts: (1) input-orientated efficiency, where the output is set constant and the inputs are adjusted accordingly; (2) output-orientated efficiency, where for a given input the output is maximized. These concepts differ in terms of the direction in which the distance of a university from the efficiency frontier is measured. In this paper, we resort to input-efficiency and variable returns to scale (VSR). With respect to the former point, we could also consider output-efficiency as US universities may have control over both the inputs (the acquired budget) and the outputs. In our estimation framework, we cannot test the nature of economies of scale. The partial frontier approaches used in this paper assume constant returns to scale. Furthermore, the results do not point to evidences of how the production process with respect to top-cited publications works.
We start this section by describing two full production frontier approaches for elicitation of academic efficiency scores: The most commonly used DEA and the less known FDH approach. We subsequently outline two PFA: order-m and order-α. Both techniques are generalizations of the FDH approach, as they nest it. Both approaches allow for the existence of super-efficient universities, i.e., universities with efficiency scores larger than 1. In Section 3.1.4, we illustrate the four approaches with a simple example.
We denote the input and output of a university i with x i and y i , respectively. We consider N universities. The corresponding efficiency score is given by e i .

3.1.1. Data Envelopment Analysis (DEA)

DEA was introduced by Charnes, et al. [35]. It is a linear programming approach which envelopes the data by a piecewise-linear convex hull. The DEA efficiency score e i DEA solves the following optimization problem:
min e , λ   e   subject   to e · x mi j = 1 N λ j x mj 0   m = 1 , , M
j = 1 N λ j y lj y li 0   l = 1 , , L
λ j 0   j
where λ is a weighting parameter that maximizes the productivity. In this paper, we focus on the basic version of the DEA. With respect to outliers, sampling and measurement data issues we focus on the later introduced partial frontier analysis. For (robust) extensions of the DEA, we refer to Bogetoft and Otto [36] and Wilson and Clemson [37].
We compare each university i with every other university in the data set ( j = 1 N ) . The set of peer universities that satisfy the condition y lj y li   l is denoted by B i . Among the peer universities, the one that exhibits the minimum input serves as a reference to i , and e i FDH is calculated as the relative input use
e ^ i FDH = min j B i { max k = 1 , , K ( x kj x ki ) }
Universities that exhibit the minimum input–output serve as references. For these universities, the efficiency score e i FDH is 1. The FDH approach was introduced by Deprins, et al. [38].

3.1.2. Order-m Efficiency

In case of order-m efficiency, the partial aspect comes in by departing from the assumption that the universities are benchmarked on the basis of the best-performing universities in the sample. Instead, the best performance of a sample including m peers is considered. Daraio and Simar [39] proposed the following four-step procedure:
  • Draw from B i a random sample of m peer universities with replacement.
  • A pseudo-FDH efficiency score ( e ^ mi FDH ˜ d ) is calculated using the artificially drawn data.
  • Repeat steps 1 and 2 D times.
  • Order-m efficiency is calculated as the average of the pseudo-FDH scores
    e ^ mi OM = 1 D d = 1 D   e ^ mi FDH ˜ d
A potential result of this procedure is that the order-m efficiency scores exceed the value of 1. This is due to the resampling: In each replication d , university i may or may not be used for its own comparison. Therefore, this procedure allows for super-efficient universities (with e ^ mi OM > 1 ) located beyond the estimated production-possibility frontier. There are two parameters that need to be determined beforehand: m and D . D is just a matter of accuracy. The higher D is, the more accurate are the results. It prolongs the computational time only. The choice of m is more critical. The smaller m is, the larger is the share of super-efficient universities. For m the approach converges to the FDH results.

3.1.3. Order-α Efficiency

The order- α approach generalizes the FDH otherwise. Instead of searching for the minimum input–output relationship among the available peer universities (the benchmark), order- α uses the ( 100 α )th percentile
e ^ α i OA = P ( 100 α ) j B i { max k = 1 , , K ( x kj x ki ) }
When α = 100 , the approach replicates the FDH results. In case of α < 100 , some universities may be classified as super-efficient. As m is the approach explained in Section 3.1.2, α can be considered as a tuning parameter: the smaller α is, the larger is the share of the super-efficient universities.

3.1.4. A Simple Example for Explaining the Approaches

To illustrate the outlined full and PFA approaches, we sketched them out in Figure 1. We plotted input–output combinations for various universities. The results of the DEA are given by the straight line. Universities A, B and E define the academic production frontier. These universities have an efficiency score of 1, i.e., an optimal input–output combination. The other universities on the right of or below the frontier are considered as inefficient. In case of the FDH, the outer hull is spanned in more explicitly by also considering universities that are not on the DEA curve. In Figure 1, universities C and D are also efficient now. Since the frontier has shifted towards the right, the efficiency scores for all other universities slightly increase. The distance to the frontier is smaller than for the DEA.
Applying the partial frontier approaches, order-m or order-α, we get a different picture. Only universities C and D are efficient with a corresponding score of 1; universities A, B and E are considered as super-efficient with a score larger than 1. Of course, both approaches do not necessarily yield the same results, as the figure might suggest.

3.1.5. Regression Analyses and Adjusted Efficiency Scores

We performed regression analyses to produce adjusted efficiency scores for the universities. Since the universities have different profiles, the scores from the regression analyses are adjusted to these differences. Thus, the focus of the regression analyses is not on explaining the variance of the scores (as done, e.g., by Reference Agasisti and Wolszczak-Derlacz [40]). We used Stata [41] to compute the regression analyses.
The efficiency scores from the four approaches (explained above) are the dependent variable in the model. Four indicators are included as independent variables in the models, which reflect the disciplinary profile of the university. We expect that the disciplinary profile is related to the efficiency of a university. The results of Bornmann, et al. [42] show that the field-normalized citation impact of universities depends on the disciplinary profile. For each university, we searched for the number of publications in four broad disciplines and the multidisciplinary field in the SCImago Institutions Ranking.2 For each institution, the percentages of publications that belong to the four disciplines were calculated and included in the regression model (mean centered). As a further independent variable, the binary information is considered for whether the institution is a public (0) or private (1) university. Private universities tend to be elite research institutions. More than these two indicators are not available in the SCImago Institutions Ranking, which was used in the regression analyses to reflect the profiles of universities.
We used the cluster option in Stata to consider in the regression analysis that the universities are in different US states. With 10 universities, the most universities are located in California. The different regulations and financial opportunities in the states probably lead to related efficiency scores for universities within one state. The cluster option corrects the standard errors for the fact that there are up to 10 universities in each state. Although the point estimates of the coefficients are the same as in the regression model without the option, the standard errors are typically larger [43].

3.2. Data

For our case study, we gathered input and output data for the 50 best performing US universities as listed in the THE Ranking 2015. As input we used research expenses. The data source is the National Center for Education Statistics (NCES).3 The NCES gathers data from universities by applying uniform data definitions. This ensures the comparability of inputs across universities, which is an important requirement of efficiency studies [44,45]. The expenses are self-reported data by the universities. The category includes institutes and research centers, as well as individual and project research. Information technology expenses related to research activities are also considered if the institution separates budgets and expenses information technology resources. Universities are asked to report actual or allocated costs for operation and maintenance of plant, interest and depreciation. The data refer to the academic year, which starts on 1 July and ends on 30 June. As we needed information for three calendar years (the output data refer to the calendar years 2011, 2012 and 2013), we transformed the data. As an example, we obtained the input data for 2013 by taking the mean of the data from the academic year 2013/14 and 2012/2013.4 This approach might introduce some unknown biases as we assume that the expenses are being spent evenly across the year. So, we cannot assure that the research expenses represent correctly the production process of a university. Potential measurement errors are further reasons to employ PFA. In the best case, biases cancel out across the sample.
As we focus on the best US universities, we use as output the number of papers that belong to the 1% (Ptop 1%) most frequently cited papers in the corresponding fields and publication years. The use of this indicator ensures that the citation impact of all papers is standardized with respect to the year and subject area of publication. The typical output variables in efficiency analysis are students, graduates and funding; publications are used rather seldom [46,47]. The data were obtained from the SCImago Institutions Ranking, which is based on Scopus data.5 The output data refer to the publication period from 2011 to 2013 with a citation window from publication until the end of 2015. We did not use data later than 2013 since it is standard to use a citation window of at least 3 years in bibliometrics [48]. In Section 4, we focus on the results for 2013. Both other publication years allowed us to look at the stability of the results.
Table 1 shows the descriptive statistics both for the input and output from 2011 to 2013. The dataset is fairly heterogeneous as the difference between minimum and maximum indicates. Furthermore, the standard deviation is quite large compared to the mean. The distributions of the variables are not significantly skewed as mean and median are very close together. The development over time points out that research expenses increase whereas the average Ptop 1% peaked in 2012 and dropped considerably in 2013. The correlation coefficients between research expenses and Ptop 1% are relatively constant over time. All coefficients are about 0.6 implying a moderate positive relationship.

4. Results

Following the methods as outlined in Section 3.1, we estimated four efficiency scores for each university and year in our data set and obtained the corresponding efficiency rankings for 2011 to 2013.
In contrast, PFA requires the specification of parameters, which eventually influence the amount of super-efficient universities. The order-α approach requires α, the percentile of the set of peer universities used as the benchmark. Order-m requires m, the number of peer universities randomly drawn from the initial set of universities. Unless we set m = 50 or α = 100, where the partial frontier approaches converge to FDH, we find super-efficient universities by construction. Figure 2 shows the number of super-efficient universities for different values of m and α. We used data for the year 2013. It is clearly visible that with higher m or α values, respectively, the number of super-efficient universities becomes lower. Concerning m, the figure is quite stable beyond 35. We opted to set m = 40 and α = 95%, which yield 10 and 7 super-efficient universities, respectively.

4.1. Baseline Results

4.1.1. Results for 2013

Table 2 reports the efficiency scores with their corresponding rankings based on the data from 2013. The universities are sorted by their ranking positions in the THE Ranking 2015. In 2013, 48 universities are not efficient according to the DEA results. This number drops to 38 universities using the FDH approach. This is because both Harvard and Boston College dominate the estimated academic efficiency frontier: Harvard University due to its very high output values and Boston College due to its small input values relative to the outputs. With respect to the order-α framework, there are seven universities with a score larger than 1. This number is increased to 10 based on the order-m approach. In the majority of cases, the order-α approach yields higher scores compared to the order-m approach.
In the order-α framework and the order-m approach, Harvard University remains efficient with a score of 1.00 and is not denoted as super-efficient. However, Boston College is super-efficient with the highest corresponding score both for the order-α and order-m model.
Based on a Stochastic Frontier analysis, Agasisti and Johnes [33] also reported efficiency scores for various US universities, but with the number of bachelors and postgraduate degrees on the output side. Similar to our results, the authors found Harvard University at the top but Boston College is not among their 20 best universities.
Table 3 shows the coefficients for the correlation between the ranking positions of the universities in the THE Ranking 2015 and the results of the efficiency analyses. The results point out that the ranking positions from the efficiency analysis are correlated at a (very) low level compared to the correlations among the different results of the efficiency analyses. The results of the four efficiency approaches are highly correlated, implying that one can derive similar conclusions.

4.1.2. Stability of the Results over Time

Table 4 reports the rank correlations across time (2011, 2012 and 2013) for each approach of the efficiency analysis. They are all above 0.8, suggesting that the results are quite stable over the observed time period.

4.2. Adjusted Scores and Ranking Positions

4.2.1. Results for 2013

The results of the regression analyses are shown in Table 5. As dependent variables, the efficiency scores from Table 2 are used (results from the DEA, FDH, order-α approach, and order-m approaches). We estimated linear regressions because the residuals were approximately normally distributed (as tested with the sktest in Stata). The coefficients for all disciplines point out that a decrease in the share of publications is associated with higher efficiency scores. If expensive research is done by the university, its efficiency is decreasing. Thus, a high share of paper output especially in physical and health sciences—having the largest coefficients—is related to lower efficiency scores. Furthermore, the results in Table 5 demonstrate that private universities are more efficient than public universities. Many coefficients in the models are statistically not significant (which might be the result of the low numbers of universities in the study).
Subsequent to the regression models, we calculated efficiency scores for every university, which are adjusted by the influence of the independent variables. Thus, the scores are adjusted to the different institutional and field-specific profiles of the universities. It is worth noting that the adjusted scores are not predicted values, but institutional values for which the residuals from the regression analyses were added to the mean initial efficiency scores.
The adjusted ranking positions (based on the adjusted scores) are listed in Table 6 besides the initial ranking positions. Although both ranking positions are (highly) correlated (DEA: rs = 0.71, FDH: rs = 0.82, order-α: rs = 0.64, order-m: rs = 0.79), there are significant rank changes for some universities. For example, Harvard University shows a perfect rank position in the FDH; but if the score is adjusted by the independent variables in the regression model, its score decreases, leading to the 17th ranking position.

4.2.2. Stability of the Results over Time

Table 7 shows the Spearman rank correlation coefficients across time (2011, 2012 and 2013) for each approach of the efficiency analysis (adjusted scores). The coefficients are above or around 0.8, which demonstrate that the results are (more or less) stable over the publication years considered.

5. Discussion

Research evaluation is the backbone of modern science. The emergence of the modern science system is closely related to the introduction of the peer review process in assessments of research results [2]. Whereas output and impact assessments were initially at the forefront of assessments, efficiency measurements have become popular in recent years [22]. According to Moed and Halevi [11], research efficiency or productivity is measured by indicators that relate research output to input. The consideration of research input in research evaluation is obvious, since the output should be directly related to the input. The output is determined by the context in which research is undertaken [22,49]. In this study, we went one step further. We not only related input to output for universities, but also calculated adjusted efficiency scores, which consider the different institutional and field-specific profiles of the universities. For example, it is easily comprehensible that the input–output relations are determined by the disciplinary profiles of the universities.
The present study is based on a comprehensive dataset with input and output data for 50 US universities. As input, we used research expenses, and as output the number of (highly-cited) papers. The results of the DEA and FDH analysis show that Harvard University and Boston College can be called especially efficient—compared with many other universities. Similar results can be found in other efficiency studies including US institutions. Whereas the strength of Harvard University is its high output of (highly-cited) papers, the strength of Boston College is its small input. In the order-α and order-m frameworks, Harvard University remains efficient, but Boston College becomes super-efficient. Although Harvard University is well-known as belonging to the best universities in the world, the correlations between the ranking positions of the universities in the THE Ranking 2015 and the results of our efficiency analyses are at a relatively low level. Thus, the consideration of inputs puts a different complexion on institutional performance.
Besides the university rankings based on the different statistical approaches for efficiency analyses, we produced rankings using adjusted efficiency scores (subsequent to regression analyses). Here, for example, Harvard University’s ranking position fell. Although regression analyses have been used in many other efficiency studies, they have been commonly used to explain the differences in efficiency scores [22], but not to generate adjusted scores (for rankings). The adjusted rankings open up new possibilities for institutional performance measurements, as demonstrated by Bornmann, et al. [9]. They produced a covariate-adjusted ranking of research institutions worldwide in which single covariates are held constant. For example, the user of the ranking produced by Bornmann, et al. [9] is able to identify institutions with a very good performance (in terms of highly cited papers), despite a bad financial situation in the corresponding countries.
What are the limitations of the current study? Although we tried to realize an advanced design of efficiency analyses, the study is affected by several limitations that should be considered in future studies.
The first limitation is related to the numbers of indicators used. We included only one input and output indicator, respectively. One important reason for this restriction is the focus of this study on efficiency in research. However, many more indicators could be included in future studies (if the focus is broader and not limited to excellent research as in this study). The efficiency study of Bruffaerts, et al. [27], which also focuses on US universities, additionally included the number of PhD degrees as input indicators, as well as several environmental variables (e.g., university size and teaching load). In an overview of efficiency studies, Rhaiem [22] categorized possible research output indicators for efficiency analyses as follows: research outputs, research productivity indices and quality of research indicators. The categorizations for possible input indicators are: “Firstly, human capital category refers to academic staff and non-academic staff; secondly, physical capital category refers to productive capital (building spaces, laboratories, etc.); thirdly, research funds category encompasses budget funds and research income; fourthly, operating budget refers to income and current expenditures; fifthly, stock of cumulative knowledge regroups three sub-categories: knowledge embedded in human resources, knowledge embedded in machinery and equipment, and public involvement in R&D; sixthly, agglomeration effects category refers to regional effect and entrepreneurial environment” (p. 595).
The second limitation concerns the quality of the input data [14]. “Salary and investment financial structures differ hugely between countries, and salary levels differ hugely between functions, organizations and countries. To paraphrase Belgian surrealism: a salary is not a salary, while a research investment is not a research investment. Comparability (and hence validity) of the underlying data themselves not only is a challenge, it is a problem” [50]. We tried to tackle the problem in this study by using the data for all universities from one source: NCES. However, the comparability of the data for the different universities may remain a problem. Thus, Waltman, et al. [14] recommend that “scientometricians should investigate more deeply what types of input data are needed to construct meaningful productivity indicators, and they should explore possible ways of obtaining this data” (p. 673) in future studies.
The third limitation questions the general implementation of efficiency studies in the practice of research evaluation. The results of the study by Aagaard and Schneider [51] highlight many difficulties in explaining research performance (output and impact) as a linear function of input indicators. Bornmann and Haunschild [13] see efficiency in research as diametric to creativity and faulty incrementalism, which are basic elements of each (successful) research process. According to Ziman [1], “the post-academic drive to ‘rationalize’ the research process may damp down its creativity. Bureaucratic ‘modernism’ presumes that research can be directed by policy. But policy prejudice against ‘thinking the unthinkable’ aborts the emergence of the unimaginable” (p. 330).

Author Contributions

Conceptualization, K.W. and L.B.; data collection, F.d.M.A.; formal analysis, K.W. and L.B.; writing—original draft preparation, K.W. and L.B.; writing—review and editing, K.W. and L.B.

Funding

This research received no external funding.

Acknowledgments

We thank Alexandra Baumann for careful research assistance.

Conflicts of Interest

The authors declare no conflict of interest.

References

  1. Ziman, J. Real Science. What It Is, and What It Means; Cambridge University Press: Cambridge, UK, 2000. [Google Scholar]
  2. Bornmann, L. Scientific peer review. Annu. Rev. Inf. Sci. Technol. 2011, 45, 199–245. [Google Scholar] [CrossRef]
  3. Wilsdon, J.; Allen, L.; Belfiore, E.; Campbell, P.; Curry, S.; Hill, S.; Jones, R.; Kain, R.; Kerridge, S.; Thelwall, M.; et al. The Metric Tide: Report of the Independent Review of the Role of Metrics in Research Assessment and Management; Higher Education Funding Council for England (HEFCE): Bristol, UK, 2015. [Google Scholar]
  4. National Research Council. Furthering America’s Research Enterprise; The National Academies Press: Washington, DC, USA, 2014; p. 216. [Google Scholar]
  5. Tarango, J.; Hernandez-Gutierrez, P.Z.; Vazquez-Guzman, D. Evaluation of Scientific Production in Mexican State Public Universities (2007–2011) Using Principal Component Analysis. Prof. Inf. 2015, 24, 567–576. [Google Scholar] [CrossRef]
  6. Hazelkorn, E. Rankings and the Reshaping of Higher Education. The Battle for World-Class Excellence; Palgrave Macmillan: New York, NY, USA, 2011. [Google Scholar]
  7. Schmoch, U. The Informative Value of International University Rankings: Some Methodological Remarks. In Incentives and Performance; Welpe, I.M., Wollersheim, J., Ringelhan, S., Osterloh, M., Eds.; Springer International Publishing: New York, NY, USA, 2015; pp. 141–154. [Google Scholar]
  8. Daraio, C.; Bonaccorsi, A.; Simar, L. Rankings and university performance: A conditional multidimensional approach. Eur. J. Oper. Res. 2015, 244, 918–930. [Google Scholar] [CrossRef] [Green Version]
  9. Bornmann, L.; Stefaner, M.; de Moya Anegón, F.; Mutz, R. What is the effect of country-specific characteristics on the research performance of scientific institutions? Using multi-level statistical models to rank and map universities and research-focused institutions worldwide. J. Informetr. 2014, 8, 581–593. [Google Scholar] [CrossRef] [Green Version]
  10. Safón, V. What do global university rankings really measure? The search for the X factor and the X entity. Scientometrics 2013, 97, 223–244. [Google Scholar] [CrossRef]
  11. Moed, H.F.; Halevi, G. Multidimensional assessment of scholarly research impact. J. Assoc. Inf. Sci. Technol. 2015, 66, 1988–2002. [Google Scholar] [CrossRef] [Green Version]
  12. Abramo, G.; D’Angelo, C.A. A farewell to the MNCS and like size-independent indicators. J. Informetr. 2016, 10, 646–651. [Google Scholar] [CrossRef]
  13. Bornmann, L.; Haunschild, R. Efficiency of research performance and the glass researcher. J. Informetr. 2016, 10, 652–654. [Google Scholar] [CrossRef] [Green Version]
  14. Waltman, L.; van Eck, N.J.; Visser, M.; Wouters, P. The elephant in the room: The problem of quantifying productivity in evaluative scientometrics. J. Informetr. 2016, 10, 671–674. [Google Scholar] [CrossRef] [Green Version]
  15. Gralka, S.; Wohlrabe, K.; Bornmann, L. How to Measure Research Efficiency in Higher Education? Research Grants vs. Publication Output. J. High. Educ. Policy Manag. 2018, in press. [Google Scholar]
  16. Abramo, G.; D’Angelo, C. How do you define and measure research productivity? Scientometrics 2014, 101, 1129–1144. [Google Scholar] [CrossRef]
  17. Cazals, C.; Florens, J.P.; Simar, L. Nonparametric frontier estimation: A robust approach. J. Econom. 2002, 106, 1–25. [Google Scholar] [CrossRef]
  18. Aragon, Y.; Daouia, A.; Thomas-Agnan, C. Nonparametric frontier estimation: A conditional quantile-based approach. Econom. Theory 2005, 21, 358–389. [Google Scholar] [CrossRef]
  19. Lindsay, A.W. Institutional Performance in Higher-Education—The Efficiency Dimension. Rev. Educ. Res. 1982, 52, 175–199. [Google Scholar] [CrossRef]
  20. Bessent, A.M.; Bessent, E.W.; Charnes, A.; Cooper, W.W.; Thorogood, N.C. Evaluation of Educational-Program Proposals by Means of Dea. Educ. Adm. Q. 1983, 19, 82–107. [Google Scholar] [CrossRef]
  21. Worthington, A.C. An Empirical Survey of Frontier Efficiency Measurement Techniques in Education. Educ. Econ. 2001, 9, 245–268. [Google Scholar] [CrossRef] [Green Version]
  22. Rhaiem, M. Measurement and determinants of academic research efficiency: A systematic review of the evidence. Scientometrics 2017, 110, 581–615. [Google Scholar] [CrossRef]
  23. De Witte, K.; López-Torres, L. Efficiency in education: A review of literature and a way forward. J. Oper. Res. Soc. 2017, 68, 339–363. [Google Scholar] [CrossRef]
  24. Bonaccorsi, A.; Daraio, C.; Simar, L. Advanced indicators of productivity of universities. An application of robust nonparametric methods to Italian data. Scientometrics 2006, 66, 389–410. [Google Scholar] [CrossRef]
  25. Bonaccorsi, A.; Daraio, C.; Raty, T.; Simar, L. Efficiency and University Size: Discipline-Wise Evidence from European Universities; MPRA Paper 10265; University Library of Munich: Munich, Germany, 2007. [Google Scholar]
  26. De Witte, K.; Rogge, N.; Cherchye, L.; Van Puyenbroeck, T. Accounting for economies of scope in performance evaluations of university professors. J. Oper. Res. Soc. 2013, 64, 1595–1606. [Google Scholar] [CrossRef]
  27. Bruffaerts, C.; Rock, B.D.; Dehon, C. The Research Efficiency of US Universities: A Nonparametric Frontier Modelling Approach; Working Papers ECARES ECARES 2013-31; Universite Libre de Bruxelles: Bruxelles, Belgium, 2013. [Google Scholar]
  28. Gnewuch, M.; Wohlrabe, K. Super-efficiency of education institutions: An application to economics departments. Educ. Econ. 2018, in press. [Google Scholar] [CrossRef]
  29. Cohn, E.; Rhine, S.L.W.; Santos, M.C. Institutions of Higher-Education as Multi-Product Firms—Economies of Scale and Scope. Rev. Econ. Stat. 1989, 71, 284–290. [Google Scholar] [CrossRef]
  30. Harter, J.F.R.; Wade, J.A.; Watkins, T.G. An examination of costs at four-year public colleges and universities between 1989 and 1998. Rev. High. Educ. 2005, 28, 369–391. [Google Scholar] [CrossRef]
  31. Laband, D.N.; Lentz, B.F. Do costs differ between for-profit and not-for-profit producers of higher education? Res. High. Educ. 2004, 45, 429–441. [Google Scholar] [CrossRef]
  32. Sav, G.T. Stochastic Cost Inefficiency Estimates and Rankings of Public and Private Research and Doctoral Granting Universities. J. Knowl. Manag. Econ. Inf. Technol. 2012, 4, 11–29. [Google Scholar]
  33. Agasisti, T.; Johnes, G. Efficiency, costs, rankings and heterogeneity: The case of US higher education. Stud. High. Educ. 2015, 40, 60–82. [Google Scholar] [CrossRef]
  34. Titus, M.A.; Vamosiu, A.; McClure, K.R. Are Public Master’s Institutions Cost Efficient? A Stochastic Frontier and Spatial Analysis. Res. High. Educ. 2017, 58, 469–496. [Google Scholar] [CrossRef]
  35. Charnes, A.; Cooper, W.W.; Rhodes, E. Measuring the Efficiency of Decision-Making Units. Eur. J. Oper. Res. 1979, 3, 338–339. [Google Scholar] [CrossRef]
  36. Bogetoft, P.; Otto, L. Benchmarking with DEA, SFA and R; Springer: New York, NY, USA, 2011. [Google Scholar]
  37. Wilson, P.W.; Clemson, S.C. FEAR 2.0: A Software Package for Frontier Analysis with R; Department of Economics, Clemson University: Clemson, SC, USA, 2013. [Google Scholar]
  38. Deprins, D.; Simar, L.; Tulkens, H. Measuring Labor-Efficiency in Post Offices. In Public Goods, Environmental Externalities and Fiscal Competition; Chander, P., Drèze, J., Lovell, C.K., Mintz, J., Eds.; Springer US: Boston, MA, USA, 2006; pp. 285–309. [Google Scholar]
  39. Daraio, C.; Simar, L. Advanced Robust and Nonparametric Methods in Efficiency Analysis: Methodology and Applications; Springer: Heidelberg, Germany, 2007. [Google Scholar]
  40. Agasisti, T.; Wolszczak-Derlacz, J. Exploring efficiency differentials between Italian and Polish universities, 2001–2011. Sci. Public Policy 2015, 43, 128–142. [Google Scholar] [CrossRef]
  41. StataCorp. Stata Statistical Software: Release 14; Stata Corporation: College Station, TX, USA, 2015. [Google Scholar]
  42. Bornmann, L.; de Moya Anegón, F.; Mutz, R. Do universities or research institutions with a specific subject profile have an advantage or a disadvantage in institutional rankings? A latent class analysis with data from the SCImago ranking. J. Am. Soc. Inf. Sci. Technol. 2013, 64, 2310–2316. [Google Scholar] [CrossRef]
  43. Angeles, G.; Cronin, C.; Guilkey, D.K.; Lance, P.M.; Sullivan, B.A. Guide to Longitudinal Program Impact Evaluation; Measurement, Learning & Evaluation Project: Chapel Hill, NC, USA, 2014. [Google Scholar]
  44. Bonaccorsi, A. Knowledge, Diversity and Performance in Europe—An Higher Education: A Changing Landscape; Edvard Elgar: Cheltenham, UK, 2014. [Google Scholar]
  45. Eumida. Final Study Report: Feasibility Study for Creating a European University Data Collection; European Commission, Research Directorate-General C-European Research Area Universities and Researchers: Brussels, Belgium, 2009. [Google Scholar]
  46. Abramo, G.; D’Angelo, C.A.; Pugini, F. The measurement of Italian universities’ research productivity by a non parametric-bibliometric methodology. Scientometrics 2008, 76, 225–244. [Google Scholar] [CrossRef]
  47. Warning, S. Performance differences in German higher education: Empirical analysis of strategic groups. Rev. Ind. Organ. 2004, 24, 393–408. [Google Scholar] [CrossRef]
  48. Glänzel, W.; Schöpflin, U. A Bibliometric Study on Aging and Reception Processes of Scientific Literature. J. Inf. Sci. 1995, 21, 37–53. [Google Scholar] [CrossRef]
  49. Waltman, L.; van Eck, N.J. The need for contextualized scientometric analysis: An opinion paper. In Proceedings of the 21st International Conference on Science and Technology Indicator, Valencia, Spain, 14–16 September 2016; pp. 541–549. [Google Scholar]
  50. Glänzel, W.; Thijs, B.; Debackere, K. Productivity, performance, efficiency, impact—What do we measure anyway?: Some comments on the paper “A farewell to the MNCS and like size-independent indicators” by Abramo and D’Angelo. J. Informetr. 2016, 10, 658–660. [Google Scholar] [CrossRef]
  51. Aagaard, K.; Schneider, J.W. Research funding and national academic performance: Examination of a Danish success story. Sci. Public Policy 2016, 43, 518–531. [Google Scholar] [CrossRef]
1.
There are also parametric approaches available (e.g., the stochastic frontier analysis, SFA), which have several disadvantages too. One disadvantage is that they rely on distributional assumptions; a specific functional form is required. The potential endogeneity of inputs cannot be accounted for.
2.
3.
The data are from http://nces.ed.gov/ipeds/datacenter/InstitutionProfile.aspx?unitid=adafaeb2afaf. The database provides also research staff figures, which could have been considered additionally in our study. However, the reported figures do not seem to be consistent. In some cases, the reported research staff were far too low compared to the overall staff of a university. For other universities, numbers varied substantially over time.
4.
There are a few exceptions (n = 7) where the academic year differs slightly across years. We adjusted the figures accordingly.
5.
See http://www.scimagoir.com. We preferred Scopus over Web of Science data as the coverage of the Scopus database is much broader.
Figure 1. Graphical exposition of full and partial frontier efficiency analysis.
Publications 07 00004 g001
Figure 2. Number of super-efficient universities for different values of m and α.
Publications 07 00004 g002
Table 1. Descriptive statistics over time.
201120122013
Research ExpensesPtop 1%Research ExpensesPtop 1%Research ExpensesPtop 1%
Mean514254521277523225
Median482213483228477197
Standard Deviation289160298182303151
Minimum383537193624
Maximum12651002132111981372977
Notes. Descriptive statistics for the input and output are reported. Research expenses in Million Dollars.
Table 2. Efficiency scores and the corresponding rankings based on different approaches for measuring efficiency in 2013 (sorted by THE Ranking).
DEAFDHOrder-αOrder-m
THEUniversityScoreRankScoreRankScoreRankScoreRank
1California Institute of Technology0.68061.00011.26461.0595
2Harvard University1.00011.00011.00081.00011
3Stanford University0.382280.765200.765300.76523
4Massachusetts Institute of Technology0.268430.619310.619380.61935
5Princeton University0.473150.614320.866240.70429
6University of California, Berkeley0.414231.00011.00081.0009
7Yale University0.444180.720250.720340.73227
8University of Chicago0.577111.00011.07771.0236
9University of California, Los Angeles0.409240.897140.897200.89716
10Columbia University0.475141.00011.00081.00010
11Johns Hopkins University0.249450.584340.584410.58437
12University of Pennsylvania0.460171.00011.00081.00011
13University of Michigan, Ann Arbor0.359320.794170.794270.79419
14Duke University0.309350.766190.766290.76622
15Cornell University0.65671.00011.00081.0148
16North-western University, Evanston0.545131.00011.00081.0197
17Carnegie Mellon University0.381290.486400.892210.63934
18University of Washington0.354330.749230.749330.74925
19Georgia Institute of Technology0.208490.361480.456470.38949
20University of Texas, Austin0.313340.476420.602390.50742
21University of Illinois at Urbana-Champaign0.261440.349490.492450.40648
22University of Wisconsin, Madison0.225480.402460.402500.41347
23University of California, Santa Barbara0.61880.902131.00080.97414
24New York University0.273410.472430.472460.48443
25University of California, San Diego0.306360.761210.761310.76224
26Washington University in Saint Louis0.439190.760220.760320.77920
27University of Minnesota, Twin Cities0.240460.416440.448480.42546
28University of North Carolina, Chapel Hill0.364310.594330.594400.60536
29Brown University0.79941.00011.83421.3292
30University of California, Davis0.276400.512380.551420.52440
31Boston University0.78251.00011.41031.1563
32Pennsylvania State University0.192500.329500.416490.35450
33Ohio State University, Columbus0.386260.713260.879220.73826
34Rice University0.80531.00011.38341.1254
35University of Southern California0.468160.742240.939180.79918
36Michigan State University0.299370.477410.672360.52141
37University of Arizona0.283390.388470.547430.45044
38University of Notre Dame0.603100.856151.00080.93715
39Tufts University0.554120.689270.953170.77621
40University of California, Irvine0.414220.578350.815250.68030
41University of Pittsburgh0.289380.534370.658370.55438
42Emory University0.399250.625290.790280.66732
43Vanderbilt University0.431210.793180.977160.81817
44University of Colorado, Boulder0.432200.572360.806260.65733
45Purdue University0.383270.661280.932190.72128
46University of California, Santa Cruz0.61890.826161.36850.98213
47Case Western Reserve University0.272420.495390.698350.54439
48University of Rochester0.368300.620300.874230.67731
49Boston College1.00011.00013.01811.8561
50University of Florida0.237470.405450.511440.43545
Table 3. Spearman rank correlation coefficients for 2013.
THEDEAFDHorder-αorder-m
THE1.000
DEA0.0731.000
FDH0.2990.8401.000
order-α0.0350.9270.8901.000
order-m0.2050.8990.9800.9421.000
Table 4. Spearman rank correlations for each approach of efficiency analysis across time.
DEA FDH
201120122013 201120122013
20111.00 20111.00
20120.951.00 20120.841.00
20130.930.961.0020130.850.841.00
order-α order-m
20111.00 20111.00
20120.911.00 20120.861.00
20130.880.911.0020130.870.891.00
Table 5. Beta coefficients and t statistics of the regression models with the efficiency scores as dependent variable for 2013.
DEAFDHorder-αorder-m
Life sciences−0.45−01.20 *−00.46−00.99
(−01.90)(−02.41)(−00.65)(−01.83)
Physical sciences−01.43 *−03.65 *−01.39−02.99
(−02.26)(−02.52)(−00.67)(−01.91)
Social sciences−00.35−01.02 *−00.17−00.74
(−01.90)(−02.36)(−00.27)(−01.54)
Health sciences−01.08 *−02.60 *−01.08−02.16
(−02.51)(−02.53)(−00.73)(−01.95)
Private state0.18 ***0.140.33 **0.21 *
(3.94)(1.77)(2.89)(2.48)
Constant0.34 ***0.63 ***0.69 ***0.65 ***
(10.36)(10.38)(7.65)(8.82)
Universities50505050
Notes. t statistics in parentheses. * p < 0.05, ** p < 0.01, *** p < 0.001.
Table 6. Initial efficiency rank positions and adjusted rank positions in 2013 (sorted by adjusted DEA scores).
UniversityDEADEA Adjust.FDHFDH Adjust.order-αorder-α Adjust.order-morder-m Adjust.
Harvard University111178171116
Brown University42162121
Rice University33154546
Boston University54193638
University of California, Santa Barbara85133811147
University of California, Santa Cruz96161453133
California Institute of Technology67176454
Tufts University12827231782118
Boston College191191212
Cornell University71018822814
University of California, Los Angeles2411141207165
Ohio State University, Columbus261226132292612
University of California, Irvine2213353125143021
University of Michigan, Ann Arbor3214171227101910
Northwestern University, Evanston131514821711
University of North Carolina, Chapel Hill3116332840333630
University of Pittsburgh3817372437153820
Purdue University2718281519132815
University of Notre Dame101915118471523
University of Colorado, Boulder2020363526263334
University of Chicago1121120732624
University of Pennsylvania17221108191113
University of Southern California1623242218301827
Washington University in Saint Louis1924222932282025
Vanderbilt University2125181816181719
University of California, Davis4026382642204022
Emory University2527293428253233
University of Arizona3928474043364438
University of California, Berkeley23291281699
Georgia Institute of Technology4930483247294932
University of Florida4731453044274529
University of California, San Diego3632212131122417
University of Minnesota, Twin Cities4633444148404641
University of Texas, Austin3434423839434244
University of Rochester3035303623233135
Columbia University14361168371028
University of Washington3337232533312526
University of Wisconsin, Madison4838464250414740
Case Western Reserve University4239394435243936
Michigan State University3740413336424143
Yale University1841254334462745
University of Illinois at Urbana-Champaign4442494645454846
Carnegie Mellon University2943404521383442
Johns Hopkins University4544343941353737
Duke University3545192729342231
Stanford University2846203730392339
Princeton University1547324824482948
Pennsylvania State University5048504749495049
New York University4149435046504350
Massachusetts Institute of Technology4350314938443547
Table 7. Spearman rank correlations for the adjusted scores from each approach across time.
DEA FDH
201120122013 201120122013
20111.00 20111.00
20120.921.00 20120.651.00
20130.910.931.00020130.750.721.00
order-α order-m
20111.00 20111.00
20120.861.00 20120.761.00
20130.880.891.0020130.820.821.00

