Article

Forecasting the Scientific Production Volumes of G7 and BRICS Countries in a Comparative Analysis

Department of Engineering and Science, Universitas Mercatorum, 00186 Rome, Italy
Publications 2025, 13(1), 6; https://doi.org/10.3390/publications13010006
Submission received: 5 December 2024 / Revised: 15 January 2025 / Accepted: 3 February 2025 / Published: 7 February 2025

Abstract

:
This study applies ARIMA models to forecast scientific production trends among G7 (Canada, France, Germany, Italy, Japan, the United Kingdom, and the United States) and BRICS (Brazil, Russia, India, China, and South Africa) countries using Scopus data from 1996 to 2023. The analysis shows that G7 countries maintain steady growth driven by established research infrastructures, while BRICS nations, particularly China, display accelerated growth due to substantial investments in R&D. The forecasts indicate that China could reach over 2,000,000 indexed scientific publications annually by 2030, potentially reshaping the global research landscape. These findings provide valuable insights for policymakers and research institutions, highlighting the shifting dynamics of global scientific leadership and emphasizing the importance of sustained investment in research to remain competitive.

1. Introduction

Scientific research output serves as a pivotal metric for assessing a country’s progress in innovation, knowledge generation, and economic growth (Pinto & Teixeira, 2020). This perspective is well-supported in the literature, as numerous studies have highlighted the critical role of research productivity in driving national competitiveness and long-term economic advancement. For instance, Furman et al. (2002) emphasized that the ability to produce and apply new knowledge is a key determinant of national innovative performance, which in turn supports long-term economic growth. Similarly, Mansfield (1991) highlighted the positive correlation between research productivity and industrial competitiveness, suggesting that countries investing in scientific research are better positioned to adapt to technological advancements. Furthermore, it is well-established that knowledge generation is central to economic systems in the knowledge economy. As argued by Chen and Dahlman (2005), research outputs—measured by publications, patents, and innovation indices—contribute to knowledge dissemination, which enhances economic productivity and societal progress. Countries within the G7 (Canada, France, Germany, Italy, Japan, the United Kingdom, and the United States) and BRICS (Brazil, Russia, India, China, and South Africa) hold dominant roles in global scientific production, yet they follow distinct paths shaped by their unique economic conditions, historical legacies, and policy frameworks. Understanding these divergent trajectories, particularly through predictive analyses, is crucial for anticipating the evolution of global scientific leadership, resource allocation, and collaborative dynamics (Bouabid et al., 2016). The existing literature shows that G7 countries have traditionally led in scientific output and innovation-driven policies, supported by sustained investments in higher education and research infrastructure (Hatemi-J et al., 2016; European Commission, 2024). This has positioned them as central hubs in the international research ecosystem, fostering collaboration networks and driving advancements across a wide range of disciplines. However, in recent decades, BRICS countries have significantly expanded their research capacities, particularly China and India, which have rapidly grown in terms of scientific output and publication volume, driven by substantial government funding, strategic initiatives, and an increasing emphasis on STEM education (Woolston, 2023; Marginson, 2022). This shift has pointed to the scientific production gap between the G7 and BRICS, making it imperative to analyze and forecast the potential impacts on global knowledge distribution and innovation power. Despite the wealth of studies analyzing scientific production across global powers (e.g., G7 and BRICS), existing research often focuses on historical trends or comparative analyses of current output without delving into predictive dynamics that anticipate future shifts in scientific leadership. The present study addresses this gap with the following research hypothesis:
I.
What are the characteristics of scientific production growth in the last thirty years within G7 and BRICS countries?
II.
What are the growth forecasts for these countries by 2030?
For this analysis, I applied time-series methodology, specifically the Autoregressive Integrated Moving Average (ARIMA) models at Scopus data for the period from 1996 to 2023. The findings will contribute to the literature on global research dynamics and provide a basis for strategic planning that supports balanced and sustainable growth in global scientific production. Such insights are crucial for policymakers, funding agencies, and academic institutions as they adapt to an increasingly multipolar scientific landscape where traditional hierarchies are continuously reshaped.

2. Materials and Methods

2.1. Data Description

To achieve the objectives of this study, I utilized a longitudinal dataset from the Scopus database, covering the period from 1996 to 2023. Scopus provides a comprehensive record of global scientific publications across disciplines, making it a reliable source for examining historical trends in research output. As highlighted by Pranckutė (2021), Scopus indexes a greater number of unique sources not covered by Web of Science, offering a more comprehensive dataset. While the content indexed in Web of Science (WoS) and Scopus shows significant overlap, Scopus has been found to provide additional coverage of sources, particularly in multidisciplinary areas and non-English language publications. This dataset includes annual counts of publications for each country, facilitating a robust time-series analysis of scientific productivity. Prior to the analysis of the time series, the countries under study were grouped based on two dimensions: Gross Domestic Expenditure on Research and Development (GERD) as a percentage of Gross Domestic Product (GDP) and the number of publications per capita. The data for GERD and population were obtained from the “Science, Technology and Innovation” and “Demographic and Socio-Economic” datasets of the UNESCO Institute for Statistics, respectively (UNESCO Institute for Statistics, 2024). The data refer to the year 2020, as it is the most recent year available for all the countries under consideration.

2.2. Methodology

For the purpose of forecasting, I applied the Autoregressive Integrated Moving Average (ARIMA) model, a widely used statistical method in time-series analysis in several fields due to its versatility in handling various trends. ARIMA models are especially effective in forecasting based on past observations by utilizing three main components: Autoregression (AR), which captures the influence of previous values on the current value; Integration (I), which addresses non-stationarity by differencing the data to achieve stability; and moving average (MA), which models the relationship between the observation and a residual error from a moving average model applied to lagged observations (Shumway et al., 2000). Mathematically, an ARIMA model is represented as ARIMA(p,d,q), where p denotes the order of the autoregressive terms; d represents the number of differencing operations needed to make the data stationary; and q signifies the order of the moving average terms. In the specific case of scientific production, ARIMA model has the following form:
φ p B d Y t = θ q ( B ) ϵ t
where
  • Y t : scientific production at time t; φ p B : autoregressive polynomial of degree p; θ q ( B ) : moving average polynomial of degree q; d = 1 B d : differencing operator of order d; B = backshift operator, such that B Y t = Y t 1 ; ϵ t = error terms distributed as withe noise ~N (0; σ2).
To fit the ARIMA models to my dataset, I used the forecast package in R (Hyndman et al., 2020), a powerful tool for time-series analysis and forecasting that automates the model selection process, ensuring the most appropriate ARIMA parameters are chosen based on the Akaike Information Criterion (AIC) and other statistical tests (Hyndman & Khandakar, 2008). The auto.arima() function in forecast evaluates potential combinations of parameters (p,d,q) and selects the optimal model by minimizing the AIC value, which balances model fit with parsimony to avoid overfitting. Using the forecast function, I generated predictions of scientific output trends for each G7 and BRICS country up to the year 2030. Through diagnostic checks such as the Ljung-Box test, I ensured that the residuals of the fitted models approximated white noise, indicating a good model fit. To validate the forecast accuracy, I performed out-of-sample testing by reserving a portion of the dataset for model evaluation, comparing forecasted values against actual data points in recent years. The performance of the ARIMA models was assessed using metrics such as Mean Absolute Percentage Error (MAPE) and Root Mean Squared Error (RMSE), which provide insights into the model’s predictive accuracy. ARIMA is a robust and widely used tool for time-series forecasting, but it has notable limitations. One key assumption of ARIMA is that the data must be stationary, meaning that its statistical properties, such as mean and variance, remain constant over time. The stationarity requirement is addressed through the d (Integration) parameter of the model, which applies differencing to remove trends and stabilize variance in the data. However, this process may not fully capture complex underlying patterns. Additionally, ARIMA models are unable to account for exogenous factors, such as political or economic changes, that can significantly influence scientific production. This reliance on historical data trends limits its capacity to adapt to sudden, external disruptions or shifts in research funding and priorities.

3. Main Literature Review

Previous research has demonstrated the effectiveness of time-series models, such as ARIMA, in forecasting bibliometric trends. However, the literature remains relatively limited, with many studies focusing on local contexts or specific applications without addressing broader aspects of scientific research production. For example, Khamdamov et al. (2008) applied an ARIMA(2,0,0) model to forecast scientific research funding in Uzbekistan’s higher education system, analyzing historical data from 2008 to 2022. Their findings highlighted stable growth trends in research funding, even amidst disruptions like the COVID-19 pandemic, and underscored ARIMA’s robustness in handling non-stationary time series. Similarly, Song and Cao (2022) used ARIMA models to predict bibliometric indicators, such as the number of publications and citation metrics, in Chinese Library and Information Science journals. While their study achieved strong predictive accuracy, it was limited by its narrow focus on specific journals. Expanding on this work, Esh (2024) compared ARIMA and Exponential Smoothing with machine learning methods, including Random Forest Regression and Gradient Boosting, to forecast citation patterns in artificial intelligence research. The study revealed that Exponential Smoothing and Random Forest models were particularly effective in capturing trends and nonlinear relationships, offering valuable insights into the strengths and limitations of different forecasting approaches. Other studies have taken a broader view of scientific production, focusing less on predictive methods and more on long-term patterns and global dynamics. King (2004) analyzed global scientific impact through bibliometric measures, identifying disparities in research output and influence. His work introduced innovative metrics, such as citation intensity (citations per GDP), to evaluate the efficiency of research investments. Smaller nations like Switzerland and the Netherlands were shown to outperform larger economies in terms of citation efficiency, highlighting the importance of strategic research funding and international collaborations. Similarly, Marginson (2011) examined the “Confucian Model” of higher education in East Asia, which integrates strong state control, household investments, and competitive academic systems. Their findings demonstrated how countries like China, South Korea, and Singapore have achieved exceptional growth in research output and global influence in science and technology. Bornmann and Mutz (2015) provided a historical perspective on scientific production, identifying distinct growth phases from 1650 to 2012. Their study highlighted the acceleration of global research output after World War II and its subsequent slowdown post-2000 due to database limitations and citation saturation. Monroy and Diaz (2018) expanded this analysis by examining how political, economic, and social factors shape global research dynamics. Using a Vector Auto-Regressive (VAR) model, they explored mutual influences between countries, emphasizing differences in research priorities, with Western nations focusing on medicine and Eastern countries, such as China and India, prioritizing engineering and technology. Finally, Shashnov and Kotsemir (2018) analyzed the research landscape of BRICS countries, using bibliometric indicators from 2001 to 2015 to investigate publication activity, thematic structures, and international collaborations. Their study highlighted the growing influence of BRICS nations in global knowledge production and identified opportunities for intra-BRICS collaboration in specific thematic areas. These studies collectively provide a robust foundation for understanding the dynamics of scientific production, the effectiveness of forecasting models, and the interplay of political, economic, and cultural factors in shaping global research trends.

4. Results and Discussion

4.1. Countries Description

Figure 1 sets a foundation for the time-series analysis of scientific output volume across G7 and BRICS countries. Countries with higher GERD and research intensity are likely to maintain or enhance their research production in the coming years, given the consistent funding support. It illustrates a comparative analysis of G7 and BRICS countries in terms of scientific productivity relative to population and research investment as a percentage of GDP. On the x-axis, I report the ratio of scientific publications to the total population for each country, derived from Scopus data on publications and UNESCO’s UIS population data for 2020. This metric serves as an indicator of research intensity per capita. On the y-axis, the Gross Domestic Expenditure on Research and Development (GERD) as a percentage of GDP reflects each country’s commitment to funding research relative to its economic capacity. The red dashed lines represent the median values for both axes, providing a benchmark for comparison. Countries located in the top-right quadrant exhibit both high research intensity and substantial R&D investment, whereas those in the bottom-left quadrant display lower values on both indicators.
The analyzed countries could be regrouped into four groups. The United States, Germany, and the United Kingdom fall within the quadrant characterized by high research intensity and investment, demonstrating both a high publication-to-population ratio and substantial GERD as a percentage of GDP. This positioning reflects the robust scientific infrastructure, established research institutions, and consistent government and private sector investment that characterize these countries. France also appears in the same quadrant but with a more moderate per capita publication output and investment in R&D. Japan stands out with a high GERD percentage but a comparatively lower publication-to-population ratio than countries in the top-right quadrant. This positioning could indicate a focus on high-impact research or industrial R&D activities, where productivity is driven by quality rather than quantity. Canada and Italy are characterized by moderate investment (their GERD percentages are closer to the average) but with a relatively high research intensity. These countries may achieve considerable output per capita with relatively lower R&D investment, likely due to efficiencies in research institutions or targeted funding policies. BRICS countries—India, Brazil, Russia, South Africa, and China—primarily occupy the quadrant characterized by lower per capita research output and GERD percentage. China, however, stands out within the BRICS group as its GERD approaches the average, reflecting increased investments in recent years. This trend suggests that China is prioritizing R&D as part of its growth strategy, and its research intensity may rise if these investments continue. India, with the lowest values on both axes, reflects significant potential for growth in both R&D funding and scientific output as its economy and research infrastructure expand.

4.2. Trends of Scientific Production

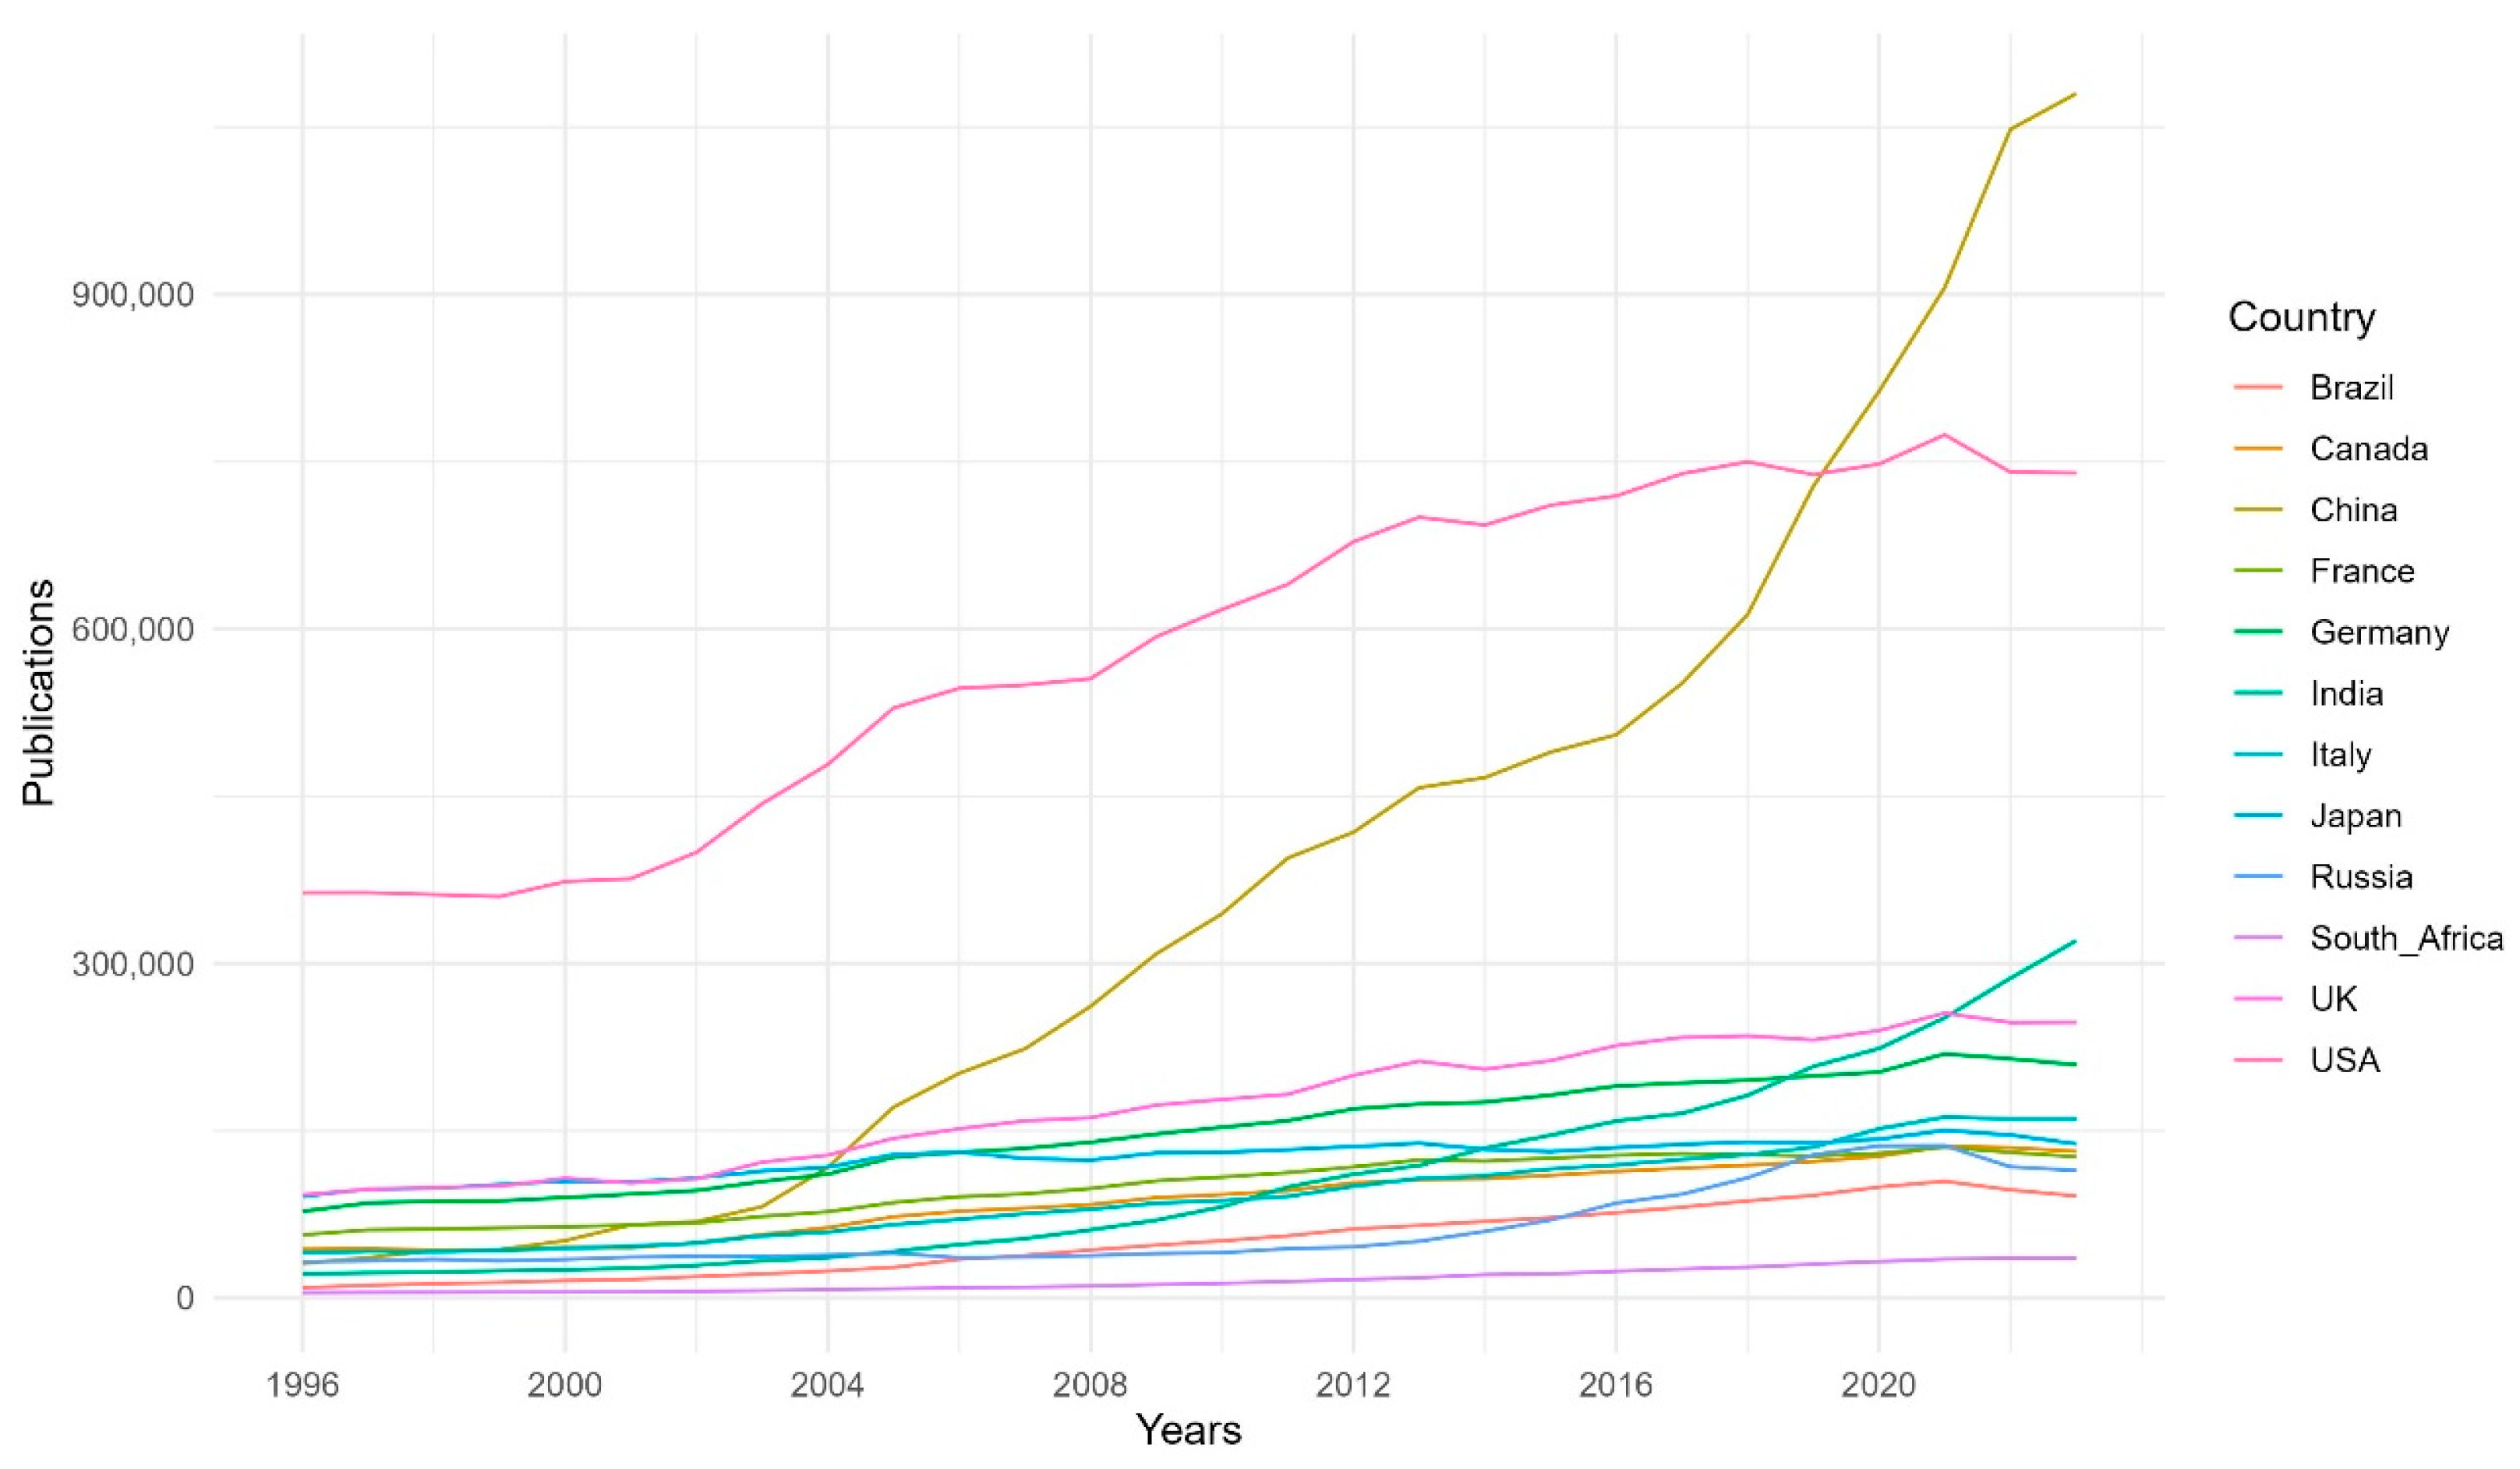
Figure 2 presents the time series of scientific publications indexed by Scopus for G7 and BRICS countries from 1996 to 2022, providing a visual representation of trends in research output across these major economies. The y-axis represents the total number of publications (in thousands), while the x-axis covers the years in the study period. Each country’s trajectory is represented by a distinct colored line, allowing for a comparative analysis of scientific output trends over time.
China’s publication output exhibits an exponential growth pattern, particularly from the mid-2000s onward. By 2022, China leads all countries in publication volume, overtaking the United States around 2018 (Zhu & Liu, 2020). This trajectory reflects China’s substantial investments in research and development, as well as policies aimed at boosting scientific productivity and global research collaboration. The United States, historically a leader in scientific output, has shown consistent growth over the observed period. However, unlike China’s rapid increase, the U.S. growth rate is relatively linear, reflecting a mature research environment with stable, although not accelerating, growth. The plateauing of U.S. output around the 2020s may suggest a stabilization in publication volume, possibly due to shifts in funding priorities or changes in scientific publishing dynamics. Other G7 countries, such as the United Kingdom, Germany, and Japan, also show growth trends, albeit at a slower pace than China and the United States. These countries maintain moderate and steady increases in publication volume, aligning with their established research infrastructures and consistent, though moderate, increases in research funding. France, Italy, and Canada follow similar patterns, although at lower total publication volumes. Among the BRICS countries, India shows a steady upward trend, reflecting its growing investment in science and technology and an emphasis on increasing research capacity. Brazil and Russia, however, display relatively slower growth rates, remaining towards the lower end of the publication scale. The trend of publications from South Africa shows a steady increase, maintaining a moderate growth rate compared to other countries. These patterns could reflect economic constraints, as well as structural challenges in these countries’ research and development ecosystems.
Japan, in contrast to the other G7 countries, exhibits a more stagnant growth rate. This stability may indicate a mature research environment with limited expansion in publication output, potentially due to demographic factors or shifts in focus towards high-impact but lower-quantity research outputs. The figure highlights the divergent trajectories of G7 and BRICS countries in terms of scientific output. China’s steep growth underscores its ambition to become a global leader in science, while G7 countries exhibit more incremental increases consistent with established research systems. BRICS countries other than China show moderate growth, with India demonstrating the highest publication output among them, reflecting increasing efforts to boost scientific output. The slowdown in growth observed in several countries in 2020 may, at least in part, be explained by the unprecedented challenges researchers faced in carrying out their work during the COVID-19 pandemic, which negatively impacted academic productivity and international collaboration (Gao et al., 2021). The trends observed in Figure 2 suggest that China’s rapid growth could reshape global research dynamics, potentially shifting the balance of scientific influence toward Asia. Meanwhile, the stable yet positive trends in G7 countries indicate a sustained role in global research, albeit with less acceleration in growth compared to China.

4.3. Arima Models Fitting Results for Scientific Production (1996–2023)

Table 1 summarizes the ARIMA models fitted to the time series of scientific publication volumes for G7 and BRICS countries. The Akaike Information Criterion (AIC) and Bayesian Information Criterion (BIC) are provided for each model, allowing for an evaluation of model fit and complexity. Lower AIC and BIC values indicate better-fitting models with a balance between goodness-of-fit and parsimony.
Most countries in this analysis were best represented by a relatively simple ARIMA(0,1,1) model with drift, as seen in Canada, France, the USA, Italy, and Brazil. This model, which includes a differencing approach along with a moving average component and a linear trend, suggests moderate and steady growth in publication volumes for these countries. The simplicity of the model reflects a stable growth pattern without complex underlying dynamics, where recent changes in publication volumes impact future values, but only in a straightforward way. In contrast, the UK, Germany, and Japan were well-suited to an even simpler model, ARIMA(0,1,0), with drift, essentially a random walk with drift. This configuration implies that these countries’ scientific outputs grow steadily without requiring additional moving averages or autoregressive terms to capture more intricate patterns. This simplicity points to stable and continuous growth in publication volumes, following a linear trajectory over time. Japan’s model reflects a mature scientific environment, where the volume of publications increases incrementally rather than exhibiting a pronounced upward trend. China and South Africa stand out with a distinctly more complex model, ARIMA(1,2,0). The inclusion of an autoregressive component alongside second-order differencing indicates nonlinear and accelerated growth in scientific production. This complexity likely captures the rapid increases and shifts in China’s publication patterns, driven by aggressive investments in research and development and a strong ambition to lead globally in scientific output. Similarly, South Africa’s model reflects more nuanced growth, potentially influenced by variability in research funding and capacity-building efforts. India’s time series is effectively modeled with ARIMA(0,2,0), utilizing second-order differencing without any moving average or autoregressive components. This setup suggests a growth trajectory that is strongly influenced by shifts in trend, indicating an accelerating rate of scientific production. India’s publication volume has likely increased in spurts, reflecting periods of intensified research activity or investment. Russia’s best-fit model, ARIMA(1,1,0), includes a first-order autoregressive term, implying that current publication volumes are influenced by recent past values in a more directly self-dependent pattern. This approach suggests that Russia’s scientific output grows by building on recent gains, indicating a steady but self-reinforcing trend. The fitted ARIMA models provide valuable insights into each country’s publication trends and allow for the forecasting of future scientific output based on past dynamics. For countries with simpler models (such as ARIMA(0,1,0) or ARIMA(0,1,1)), publication volumes are expected to grow steadily in line with historical trends. However, for countries with more complex models, particularly China and India, the forecasts may reflect accelerating or nonlinear growth trajectories. These differences highlight varying stages of development in scientific infrastructure and publication strategies across G7 and BRICS countries, underscoring the importance of tailored approaches to forecasting scientific production.

4.4. Arima Models Post-Estimation

Table 2 presents the evaluation metrics for ARIMA models fitted for various countries, using indicators such as AIC, BIC, MAE, RMSE, MAPE, and the Shapiro–Wilk p-value to assess model performance and residual normality.
Canada and Italy achieved the lowest AIC and BIC values among the G7 nations, reflecting an optimal balance between model fit and simplicity. Similarly, South Africa and Brazil’s model demonstrated low AIC and BIC among the BRICS nations, suggesting efficient representation of its publication trends with minimal complexity. By contrast, China’s model exhibited comparatively higher AIC and BIC values, indicative of the added complexity needed to capture its dynamic and rapidly evolving publication output. In terms of forecast accuracy, the focus is placed on MAPE due to its scale-independent nature, which allows for meaningful comparisons despite the differing magnitudes of publication volumes among countries. While RMSE and MAE are included for completeness, the emphasis on MAPE is justified by its ability to provide a clear relative measure of model performance. Brazil (3.854%) and China (6.045%) exhibit the highest MAPE values, suggesting significant relative errors in forecasting their publication trends. These high values likely reflect the challenges of capturing rapid and nonlinear growth patterns in these countries. Russia (5.364%) and India (3.254%) also show relatively elevated MAPE values, which may indicate higher variability or irregular growth in their publication outputs. In contrast, countries such as France (2.053%) and the USA (2.345%) have lower MAPE values, reflecting more stable and predictable trends. Similarly, Canada (2.666%) and Japan (2.524%) demonstrate relatively low MAPE scores, indicating that their publication trajectories are easier to model. South Africa (2.469%) achieves one of the lowest MAPE values in the analysis, highlighting the accuracy of its model despite its smaller overall publication volume. The normality of errors is almost always ensured (Shapiro–Wilk test). Canada (0.692), Japan (0.322), and France (0.318) have high p-values, indicating that the residuals are close to normally distributed, thus validating the reliability of the ARIMA models for these countries. On the other hand, Brazil, Russia, and South Africa have p-values less than 0.001, suggesting that the residuals are not normally distributed, which may indicate potential model misspecifications or outliers that could affect forecast reliability. Italy’s relatively low p-value (0.044) also suggests some deviations from normality, though it is not as severe as Brazil or Russia.

4.5. Arima Models for Forecasting (2024–2030)

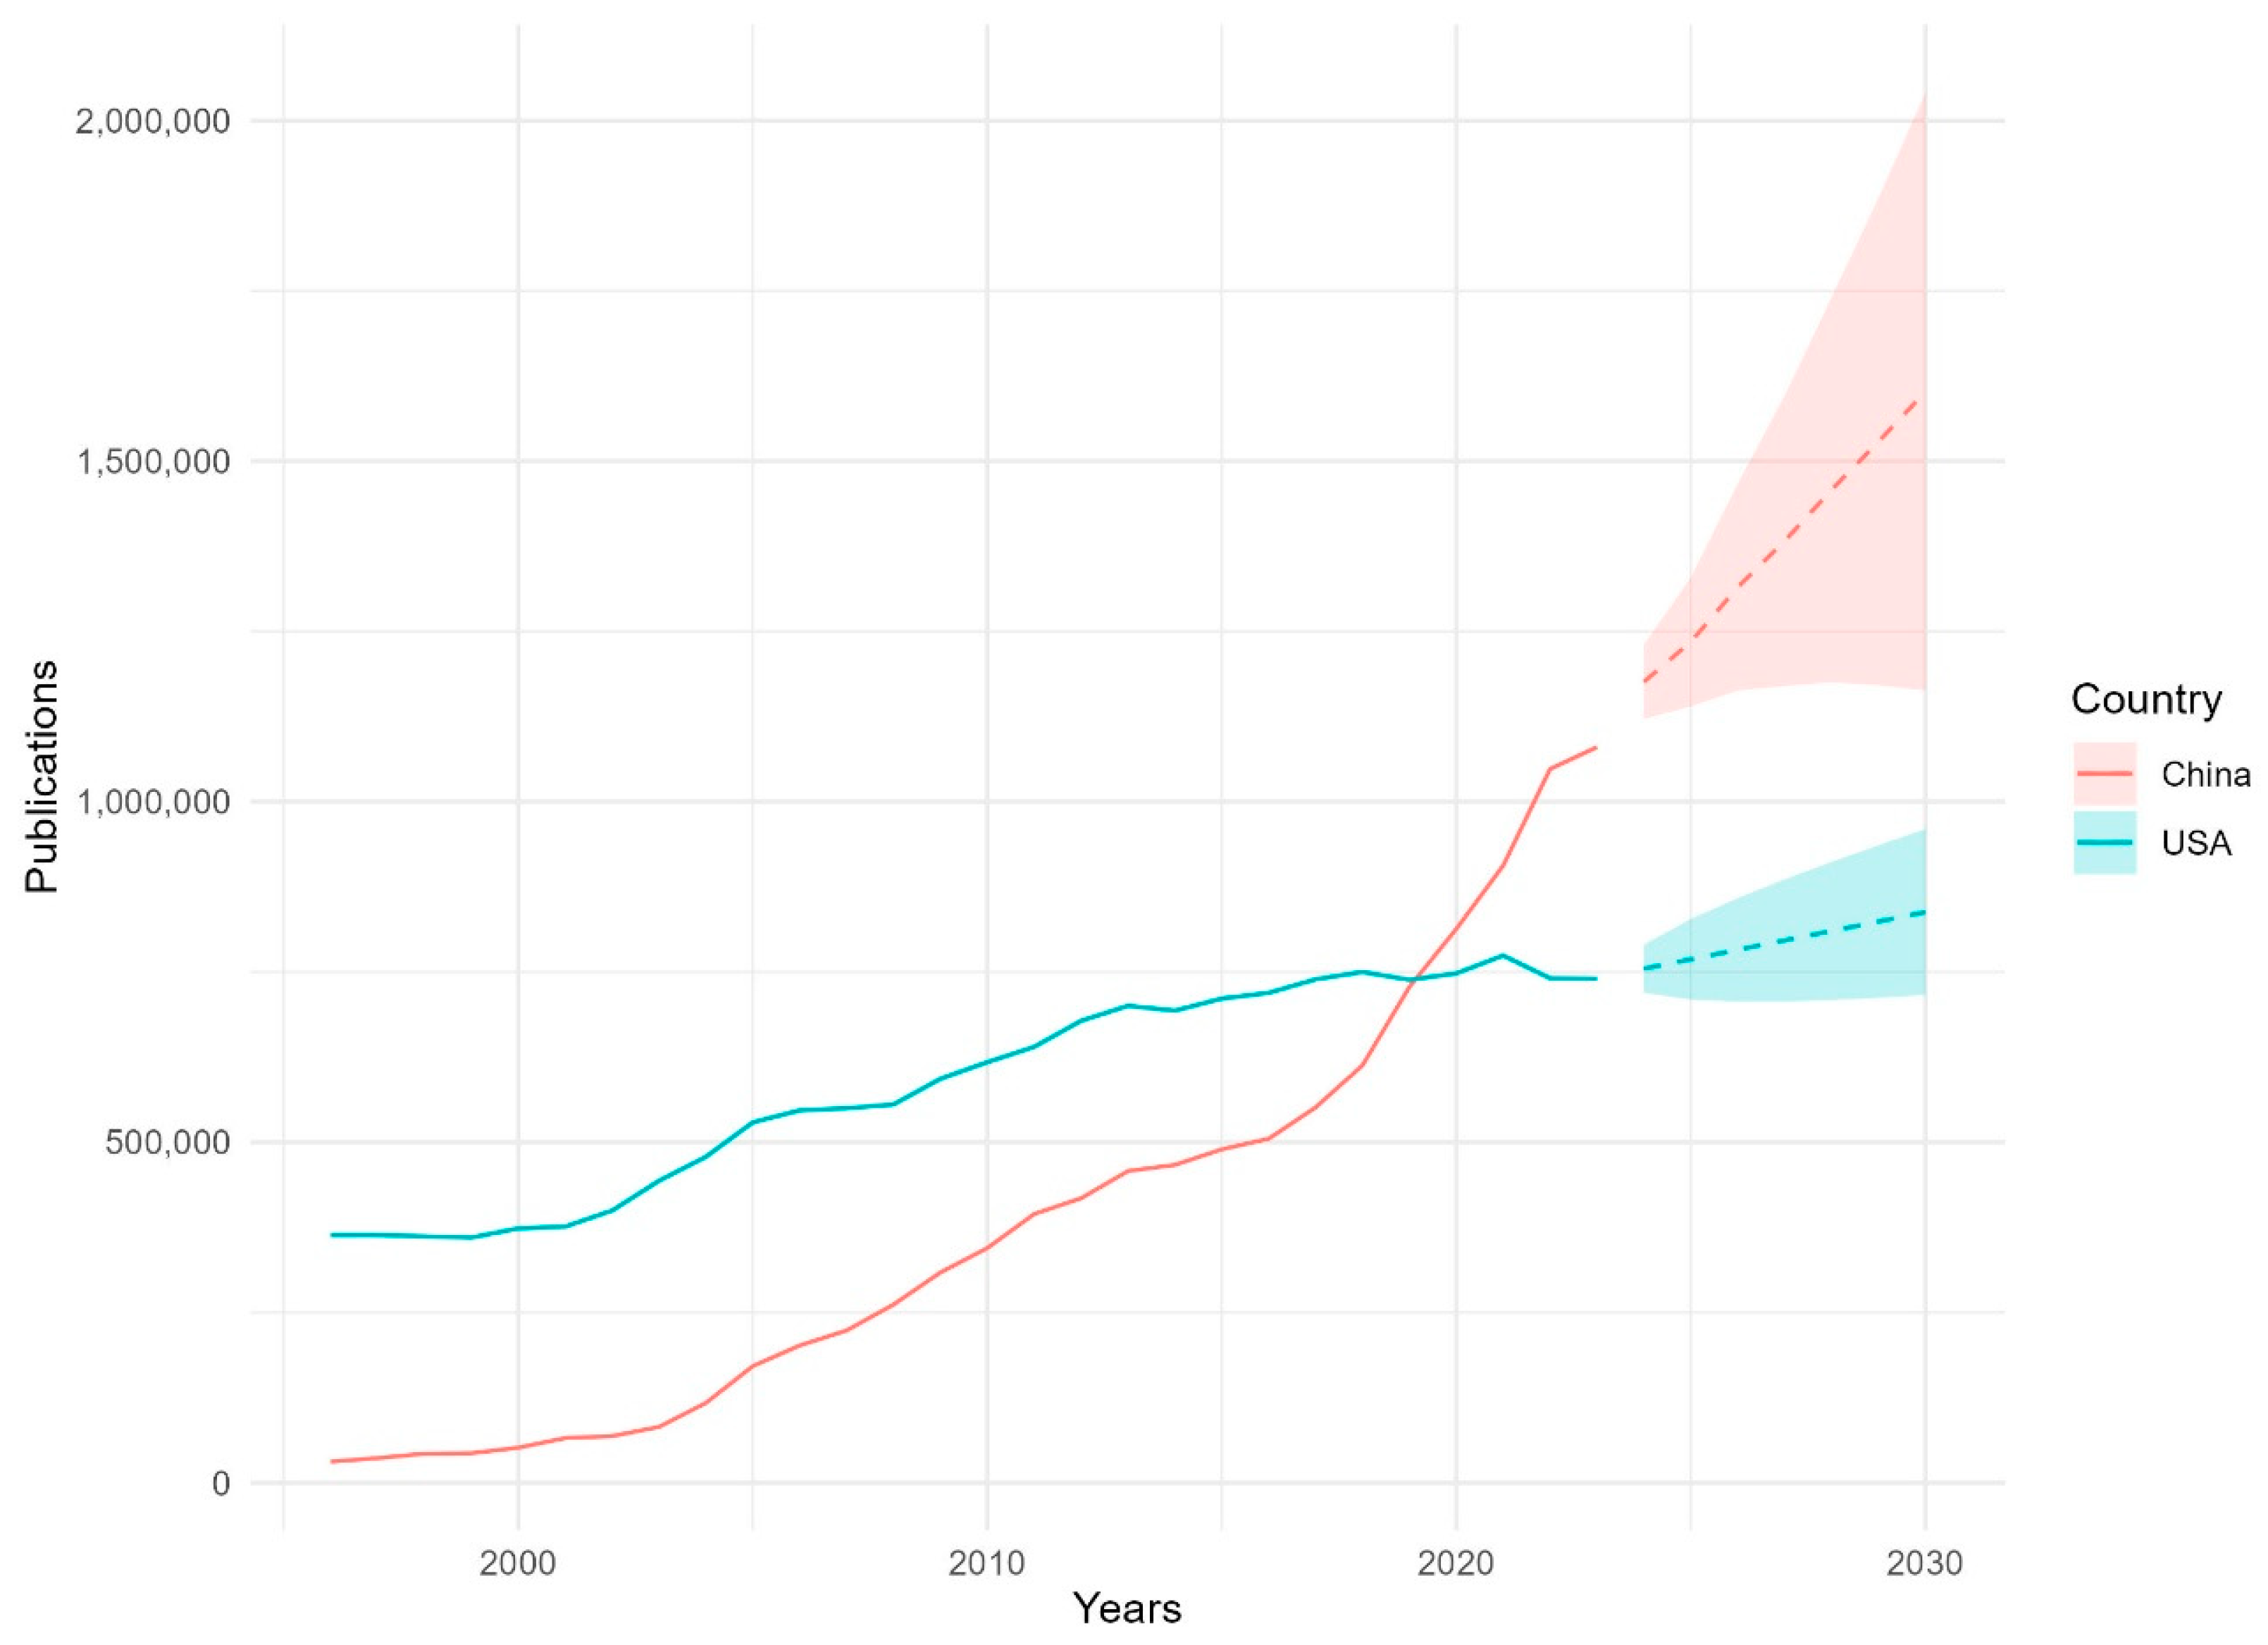
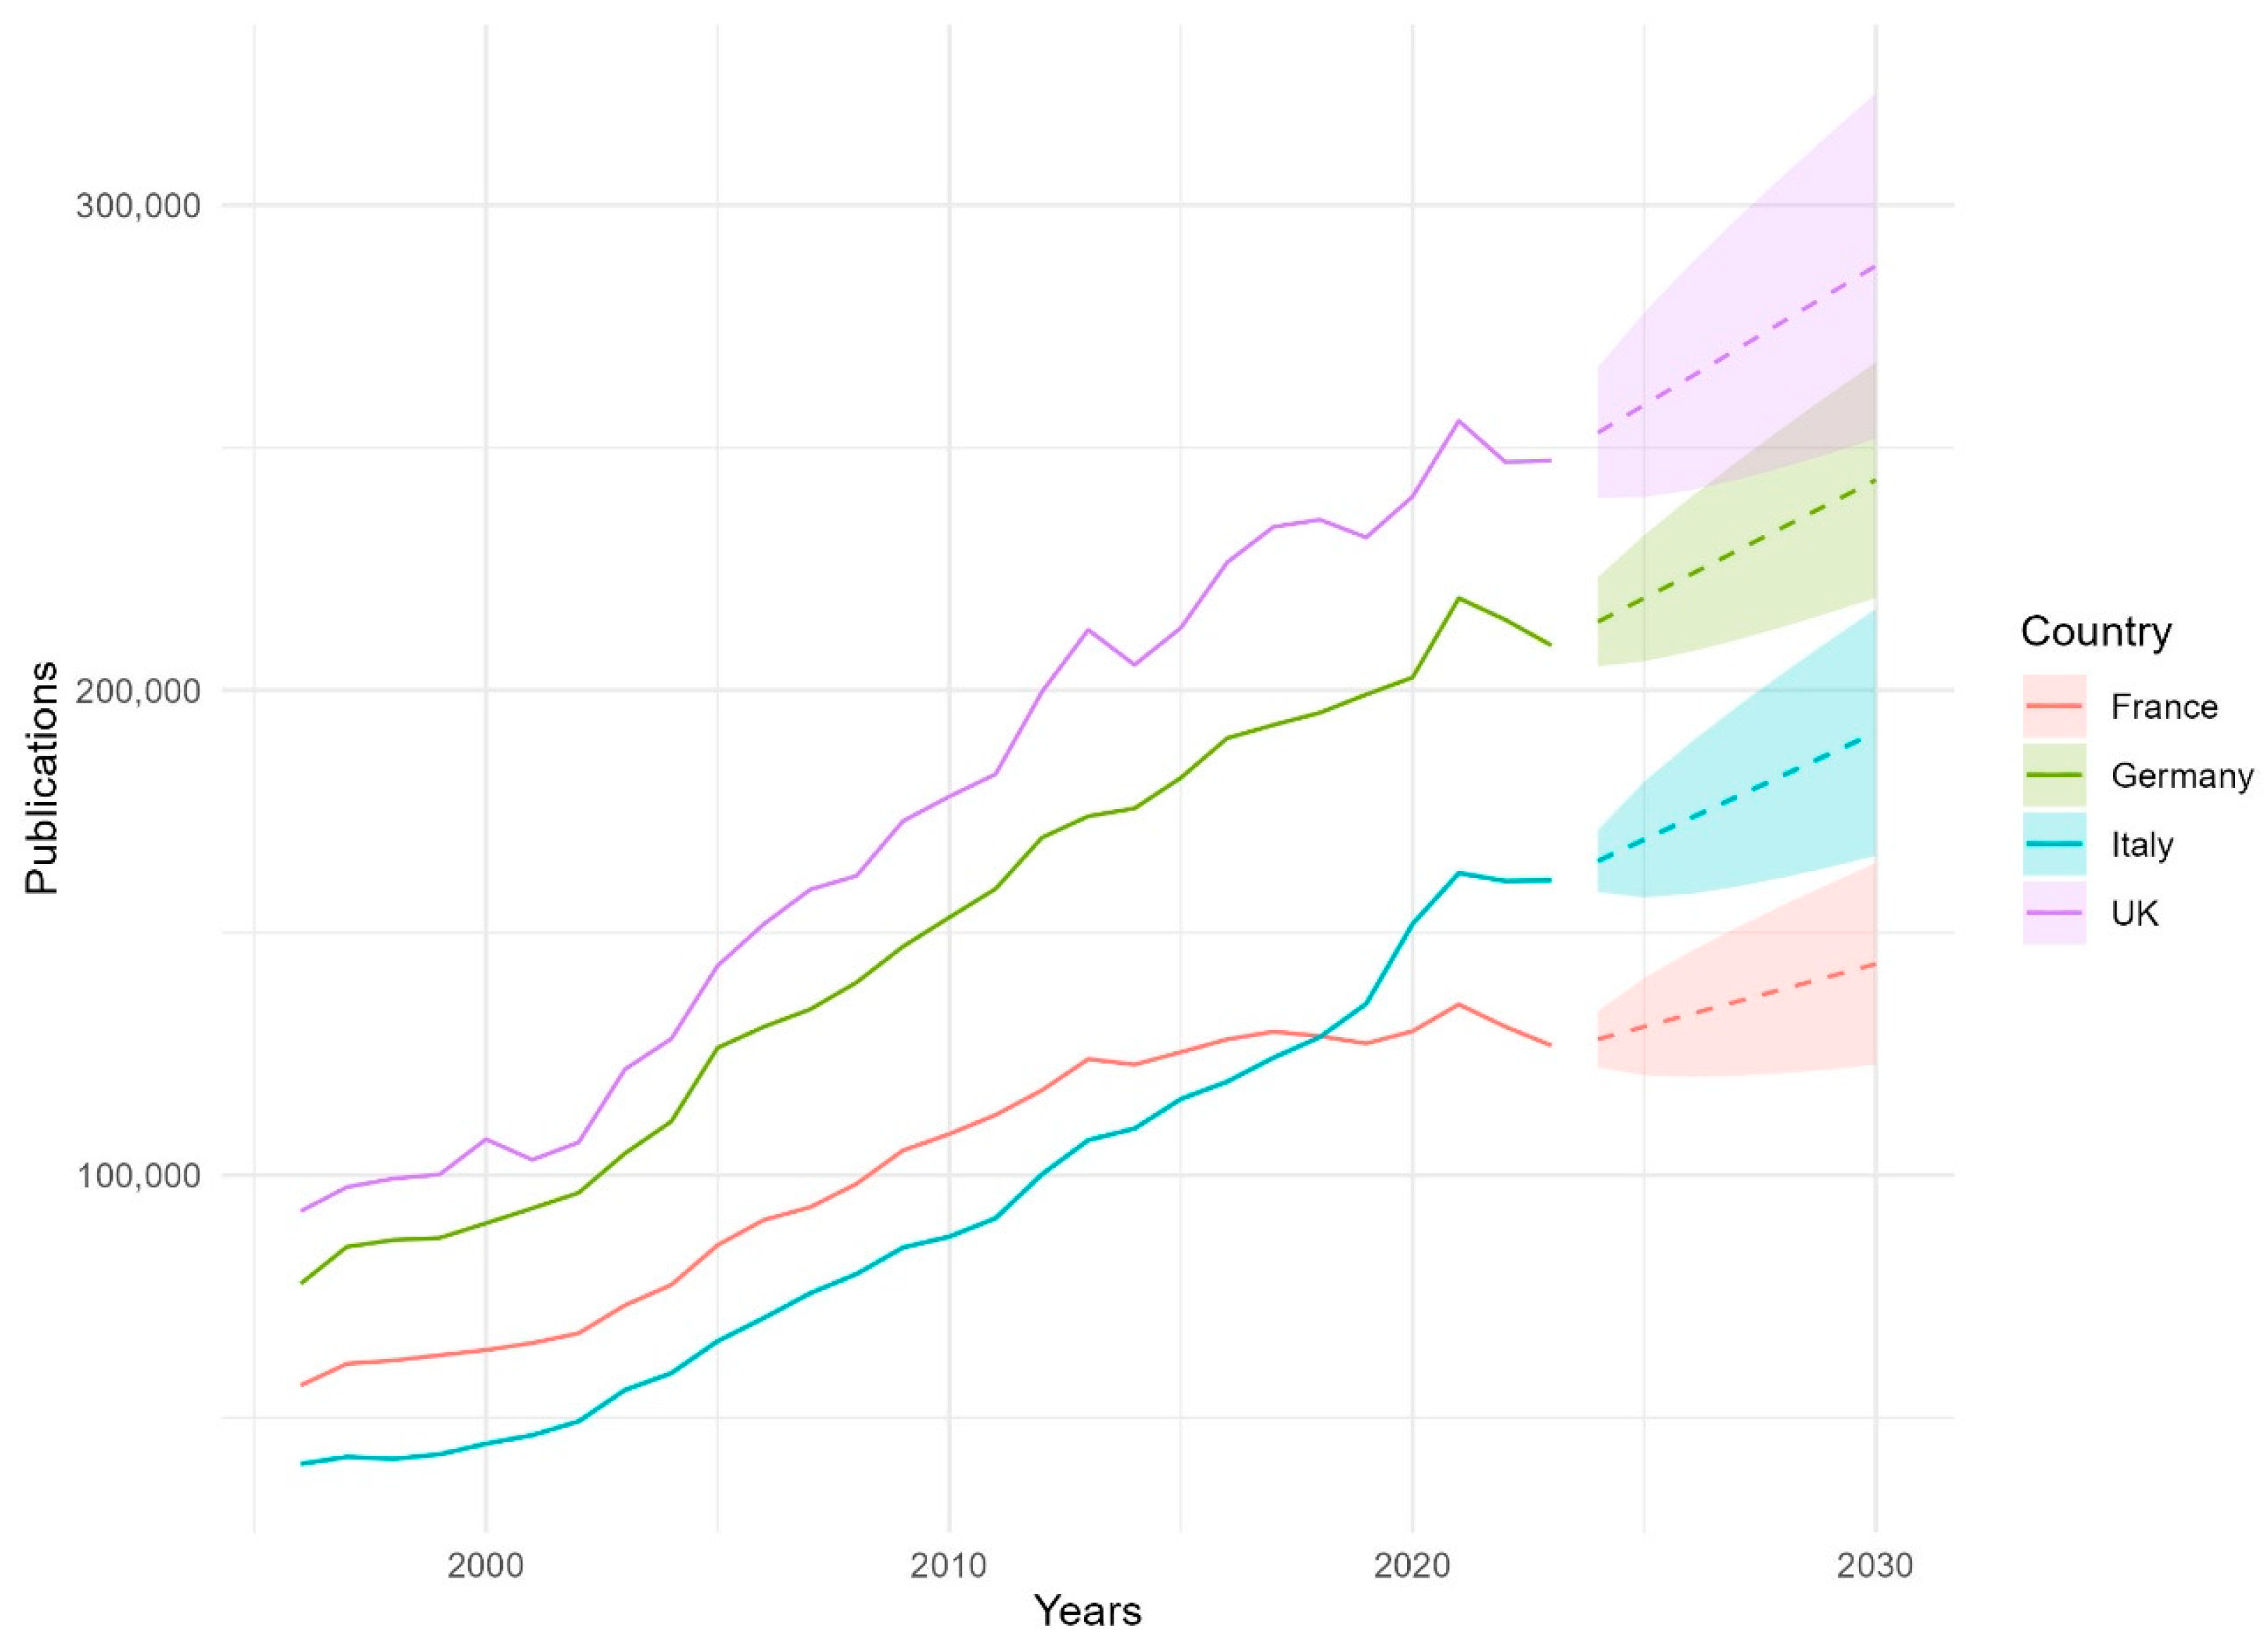
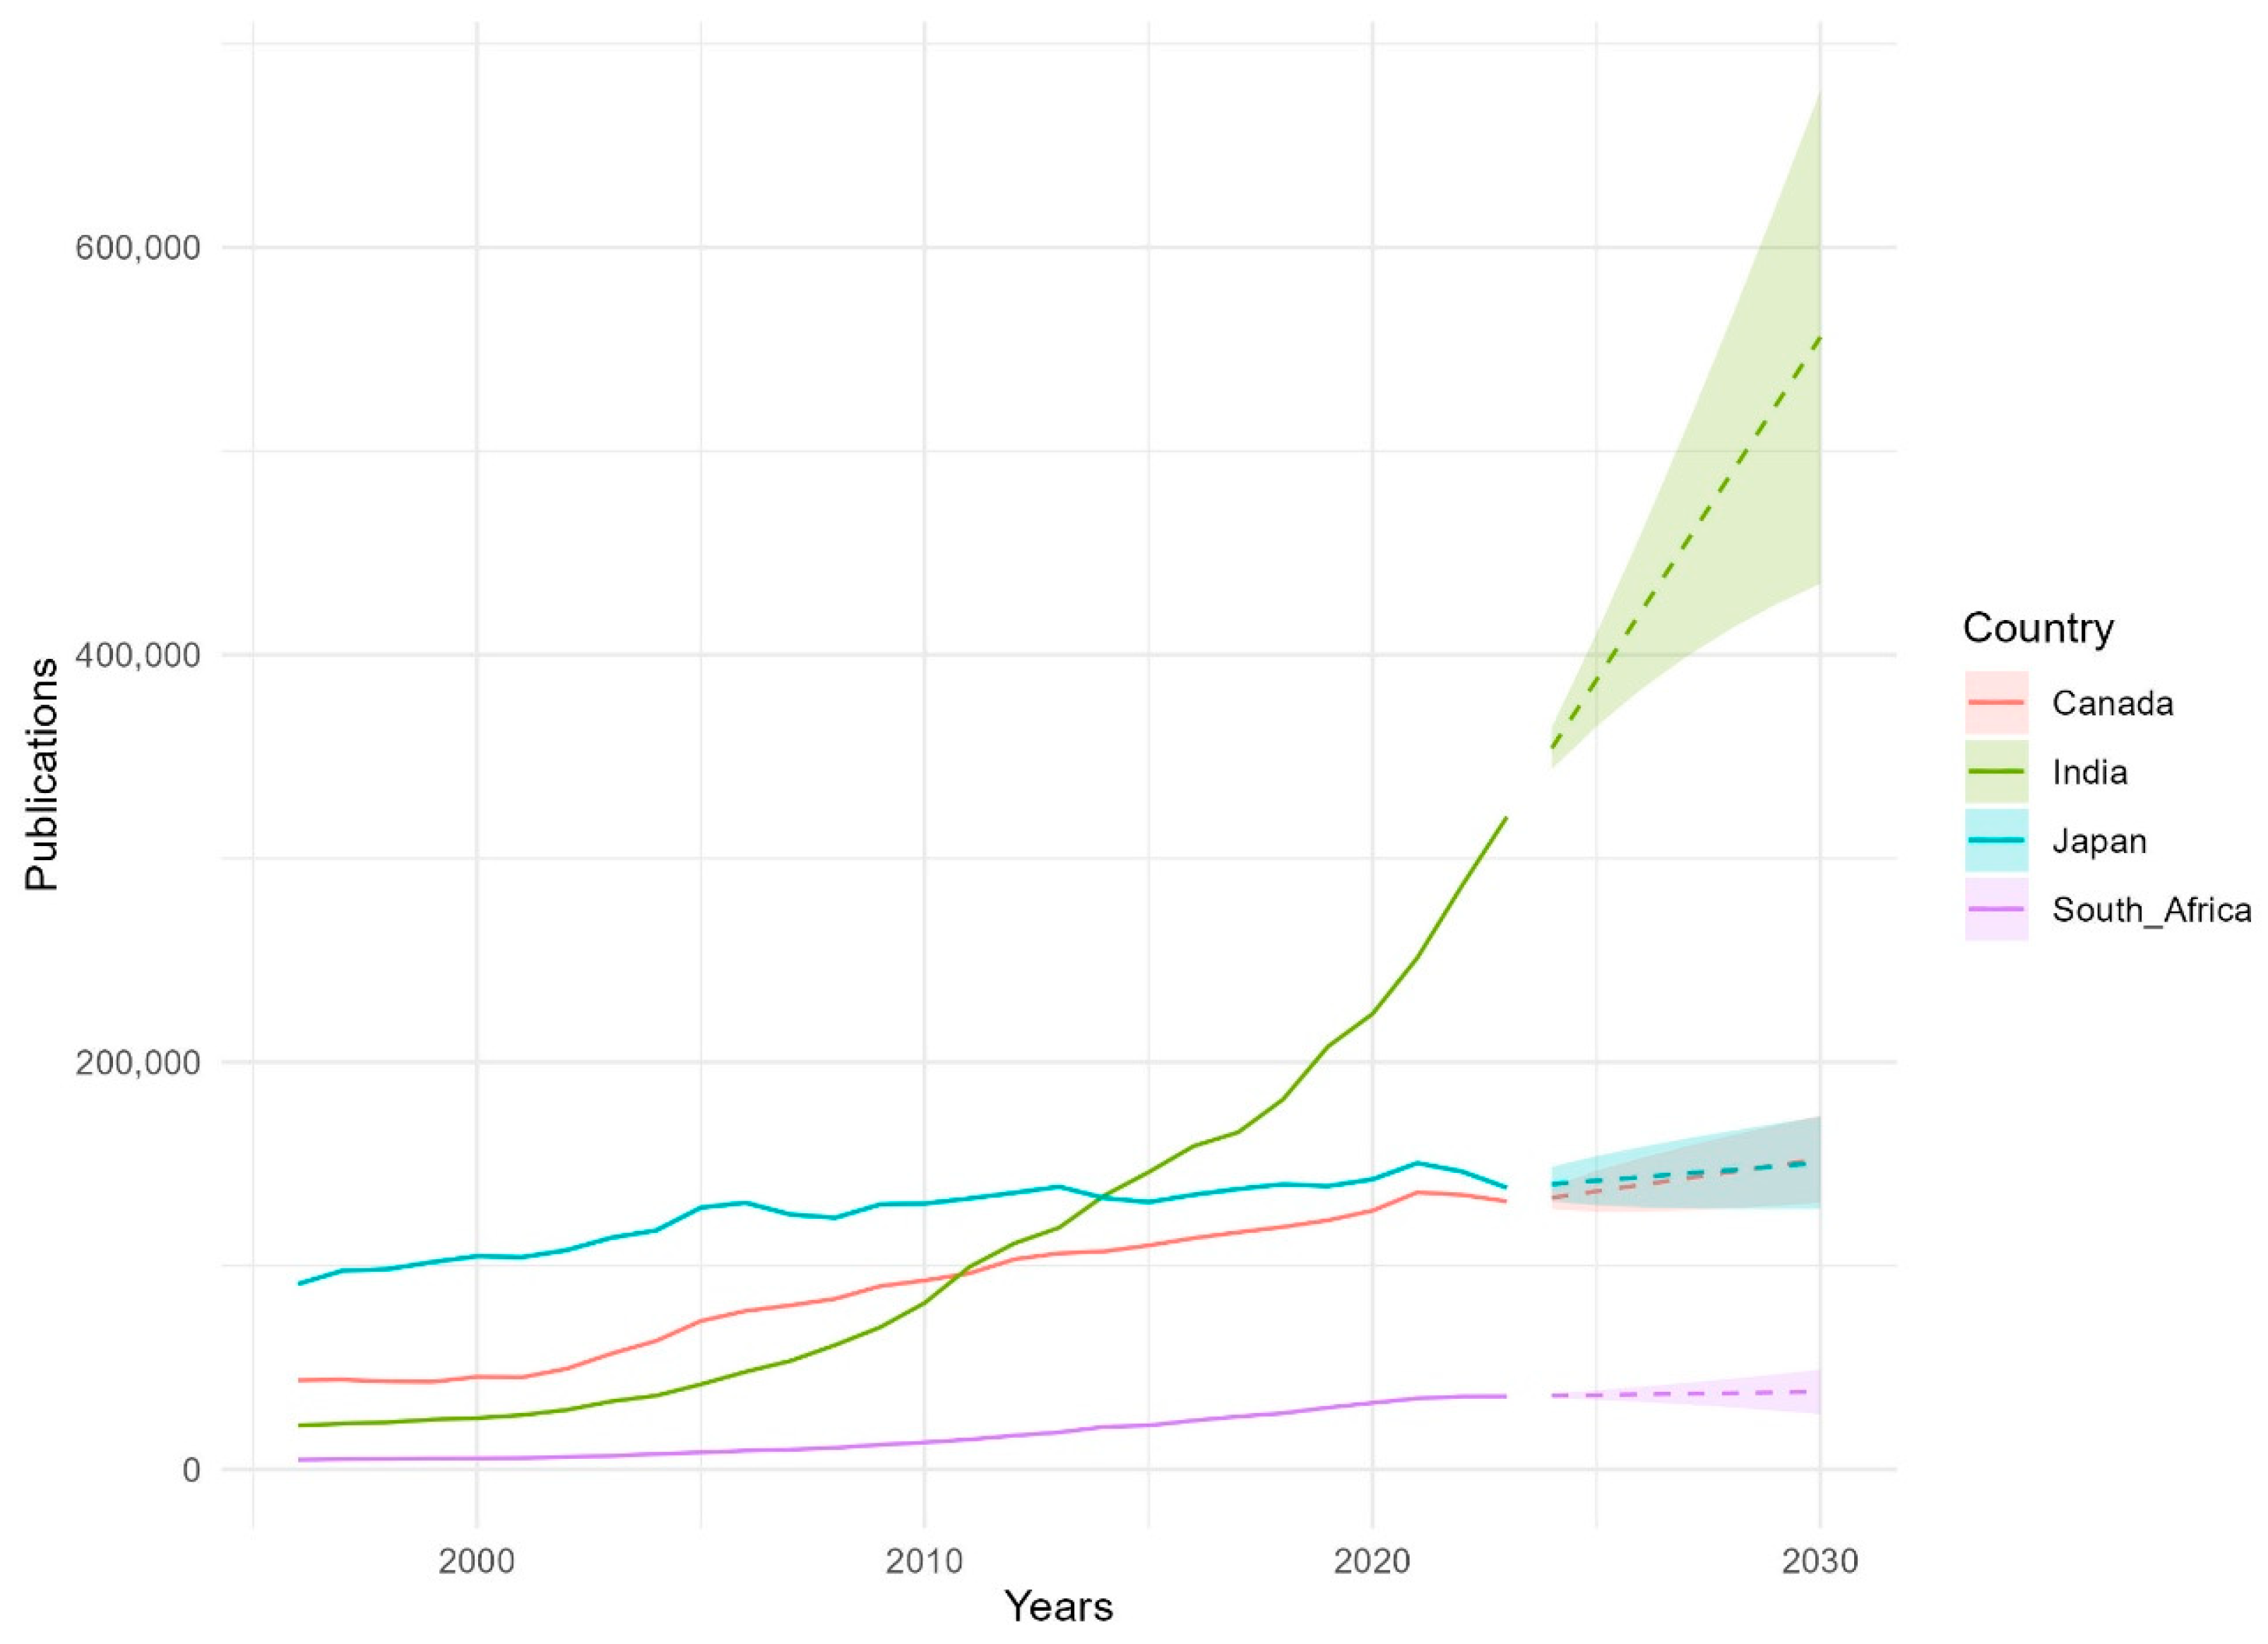
This section presents the forecasted scientific publication volumes for G7 and BRICS countries from 2024 to 2030, based on ARIMA models fitted to historical data from 1996 to 2023. Each line represents a country’s forecasted trajectory, with a 95% confidence interval shaded around the projection, providing a visual representation of uncertainty in each prediction.
The G7 and BRICS countries were grouped based on their initial volume of scientific publications. Figure 3 presents the trajectory of scientific publications volumes for the United States and China. The dashed lines illustrate the forecasted number of publications for China and the USA, while the shaded regions represent the confidence intervals associated with these projections. China’s forecasted publication volume continues its steep upward trend, potentially surpassing 2 million publications by 2030. The large confidence interval indicates a significant degree of uncertainty in this trajectory, reflecting the nonlinear and rapid growth observed in recent years. This growth can be attributed to a combination of strategic national policies, increased R&D investments, and international collaborations. Government initiatives, such as the “863 Program” (Zhi & Pearson, 2017), have prioritized innovation in critical areas, including artificial intelligence, renewable energy, and biotechnology. These policies are supported by a robust increase in R&D funding, which has surpassed 2.5% of GDP in recent years, positioning China among the global leaders in research expenditure. Additionally, China has heavily invested in modernizing its higher education and research infrastructure, creating a network of “Double First-Class” universities (Yue et al., 2021) aimed at achieving global academic excellence. Internationally, China has fostered collaborations through joint research projects, partnerships with western universities, and programs encouraging the return of Chinese scholars from abroad. Such efforts have amplified China’s research visibility and contributed to its nonlinear growth trajectory. This wide interval may be due to potential fluctuations in research investment or policy shifts that could accelerate or decelerate growth. The forecast for the United States shows a relatively stable trend, with only a slight increase in publication volume. This aligns with its more mature scientific output and stable research funding structure (Brint & Carr, 2017; Horta & Veloso, 2007; Ioannidis et al., 2014; Morgan et al., 2022). The narrower confidence interval suggests higher certainty in this projection, as the U.S. has historically shown steady growth without large fluctuations (Tollefson & Van Noorden, 2024).
The United Kingdom, Germany, and France (Figure 4) all show a similar pattern of modest growth. Their confidence intervals are relatively narrow, indicating consistent historical trends that are likely to continue in a stable manner. The United Kingdom leads in terms of publication volume, with a consistent upward trajectory. The narrow confidence interval suggests a stable and reliable research output moving forward. This is indicative of the UK’s robust research infrastructure and ongoing investments in research and development, even amidst recent political challenges such as Brexit (Highman et al., 2023). Germany also demonstrates strong growth, maintaining a steady rise in publication output. Its confidence interval remains narrow, indicating a predictable and stable trend, likely due to sustained public and private sector (Soares, 2024; Pinz et al., 2021; Wagner et al., 2021) support for research activities. France shows a gradual yet consistent increase in publications, closely tracking the trends of Germany and the UK. The narrow confidence interval for France suggests continued stability, supported by its well-established research institutions and long-term investment strategies (Carpentier & Courtois, 2024). Italy, on the other hand, shows significant progress, surpassing France in publication volume around 2018. This shift reflects Italy’s increased focus on enhancing its research output through targeted policies and investments (Bratti et al., 2021). Italy’s forecast shows a similar increase in publication volume, with a slightly broader confidence interval.
India shows a significant and sharp upward trend in the number of publications, especially after 2010, surpassing both Canada and Japan by a substantial margin, indicating rapid growth in its research output (Figure 5). This growth was driven by a combination of ambitious national policies and an increasing emphasis on international collaborations. Government initiatives, such as the Science, Technology, and Innovation Policy (STIP) (Sattiraju & Janodia, 2024), have played a pivotal role in building a robust research infrastructure. Significant investments in priority areas such as space exploration, renewable energy, and biotechnology have further bolstered India’s global research profile. For instance, the Indian Space Research Organization (ISRO) (Singh, 2022) has demonstrated remarkable success in cost-effective space missions, garnering international recognition. India has also leveraged international collaborations to accelerate its scientific growth. Programs such as the Indo-US Science and Technology Forum (IUSSTF) (Neureiter & Cheetham, 2013) and partnerships with organizations like CERN have facilitated knowledge exchange and joint research projects. Moreover, India’s active participation in multilateral platforms like BRICS and its collaborations with G7 nations have enabled the country to access advanced technologies and expand its research networks. However, challenges persist, including limited R&D expenditure (around 0.7% of GDP) and disparities in research output across regions and institutions. Addressing these issues by increasing funding and investment in research infrastructure and higher education (Rana et al., 2022; Aithal & Aithal, 2020; Tilak & Kumar, 2022), fostering industry–academia partnerships, and enhancing STEM education could help India sustain its upward trajectory in global scientific production and further contribute to addressing pressing global challenges. Nevertheless, India’s forecast shows a moderate upward trajectory, with a slightly wider confidence interval compared to other G7 nations, indicating some uncertainty in its growth. In contrast, Canada and Japan have demonstrated relatively stable and moderate growth in their scientific output, reflecting their emphasis on long-term sustainability rather than rapid expansion. Canadian policies place a strong focus on innovation-driven research (Atkinson & Zhang, 2024), particularly in areas like artificial intelligence, renewable energy, and health sciences. International collaborations play a significant role in Canada’s research strategy, with partnerships and joint projects under organizations like the recent Horizon Europe Programs. These efforts enhance Canada’s integration into global research networks, contributing to its stable trajectory of scientific output. Similarly, Japan’s growth in scientific production is underpinned by its commitment to long-term research sustainability and quality. National policies, such as the Fifth Science and Technology Basic Plan (Arimoto, 2024), emphasize innovation in advanced technologies, including robotics, quantum computing, and environmental sustainability. Japan has also cultivated strong ties with global research institutions through programs like the Sakura Science Program and collaborations with organizations such as the OECD and UNESCO. However, Japan faces challenges such as an aging academic workforce and declining numbers of younger researchers entering STEM fields (Fuyuno, 2012), which may slow future growth. Addressing these challenges through targeted policies to support early-career researchers and enhance international research mobility could help sustain Japan’s influence in global scientific production. Projections beyond 2023 suggest that both Canada and Japan will maintain their steady trajectories, driven by their strategic focus on innovation, quality, and global collaboration. By continuing to prioritize sustainable funding, fostering international partnerships, and addressing workforce challenges, these nations can remain competitive in the evolving landscape of global scientific research. South Africa occupies a unique position within the BRICS group, being the smallest economy yet demonstrating notable strengths in certain areas of scientific research. The country’s focus on health sciences (Mayosi et al., 2012), including HIV/AIDS and tuberculosis research, reflects its societal needs and global contributions. South Africa has also invested heavily in large-scale research infrastructure, such as the Square Kilometre Array (SKA) project (Labate et al., 2022), which positions it as a global leader in radio astronomy. However, South Africa’s scientific growth is constrained by systemic issues, including disparities in access to education and limited R&D funding, which remains around 0.8% of GDP, below the global average. The country also faces challenges in retaining skilled researchers (Nwadiuko et al., 2021), with many professionals emigrating in search of better opportunities, further exacerbating the “brain drain” issue. Strengthening STEM education and fostering inclusive policies to reduce barriers for underrepresented groups in research could address some of these challenges. Additionally, enhancing regional and international collaborations, particularly within Africa, could help South Africa leverage its strategic position as a scientific hub on the continent. The confidence interval (shaded region) around the forecast indicates low variability, suggesting that the model predicts with relatively high certainty that publication volumes will follow a linear trajectory. This stable and incremental growth may reflect South Africa’s steady progress in scientific output, supported by consistent but limited resources or infrastructure (Ramoutar-Prieschl & Hachigonta, 2020).
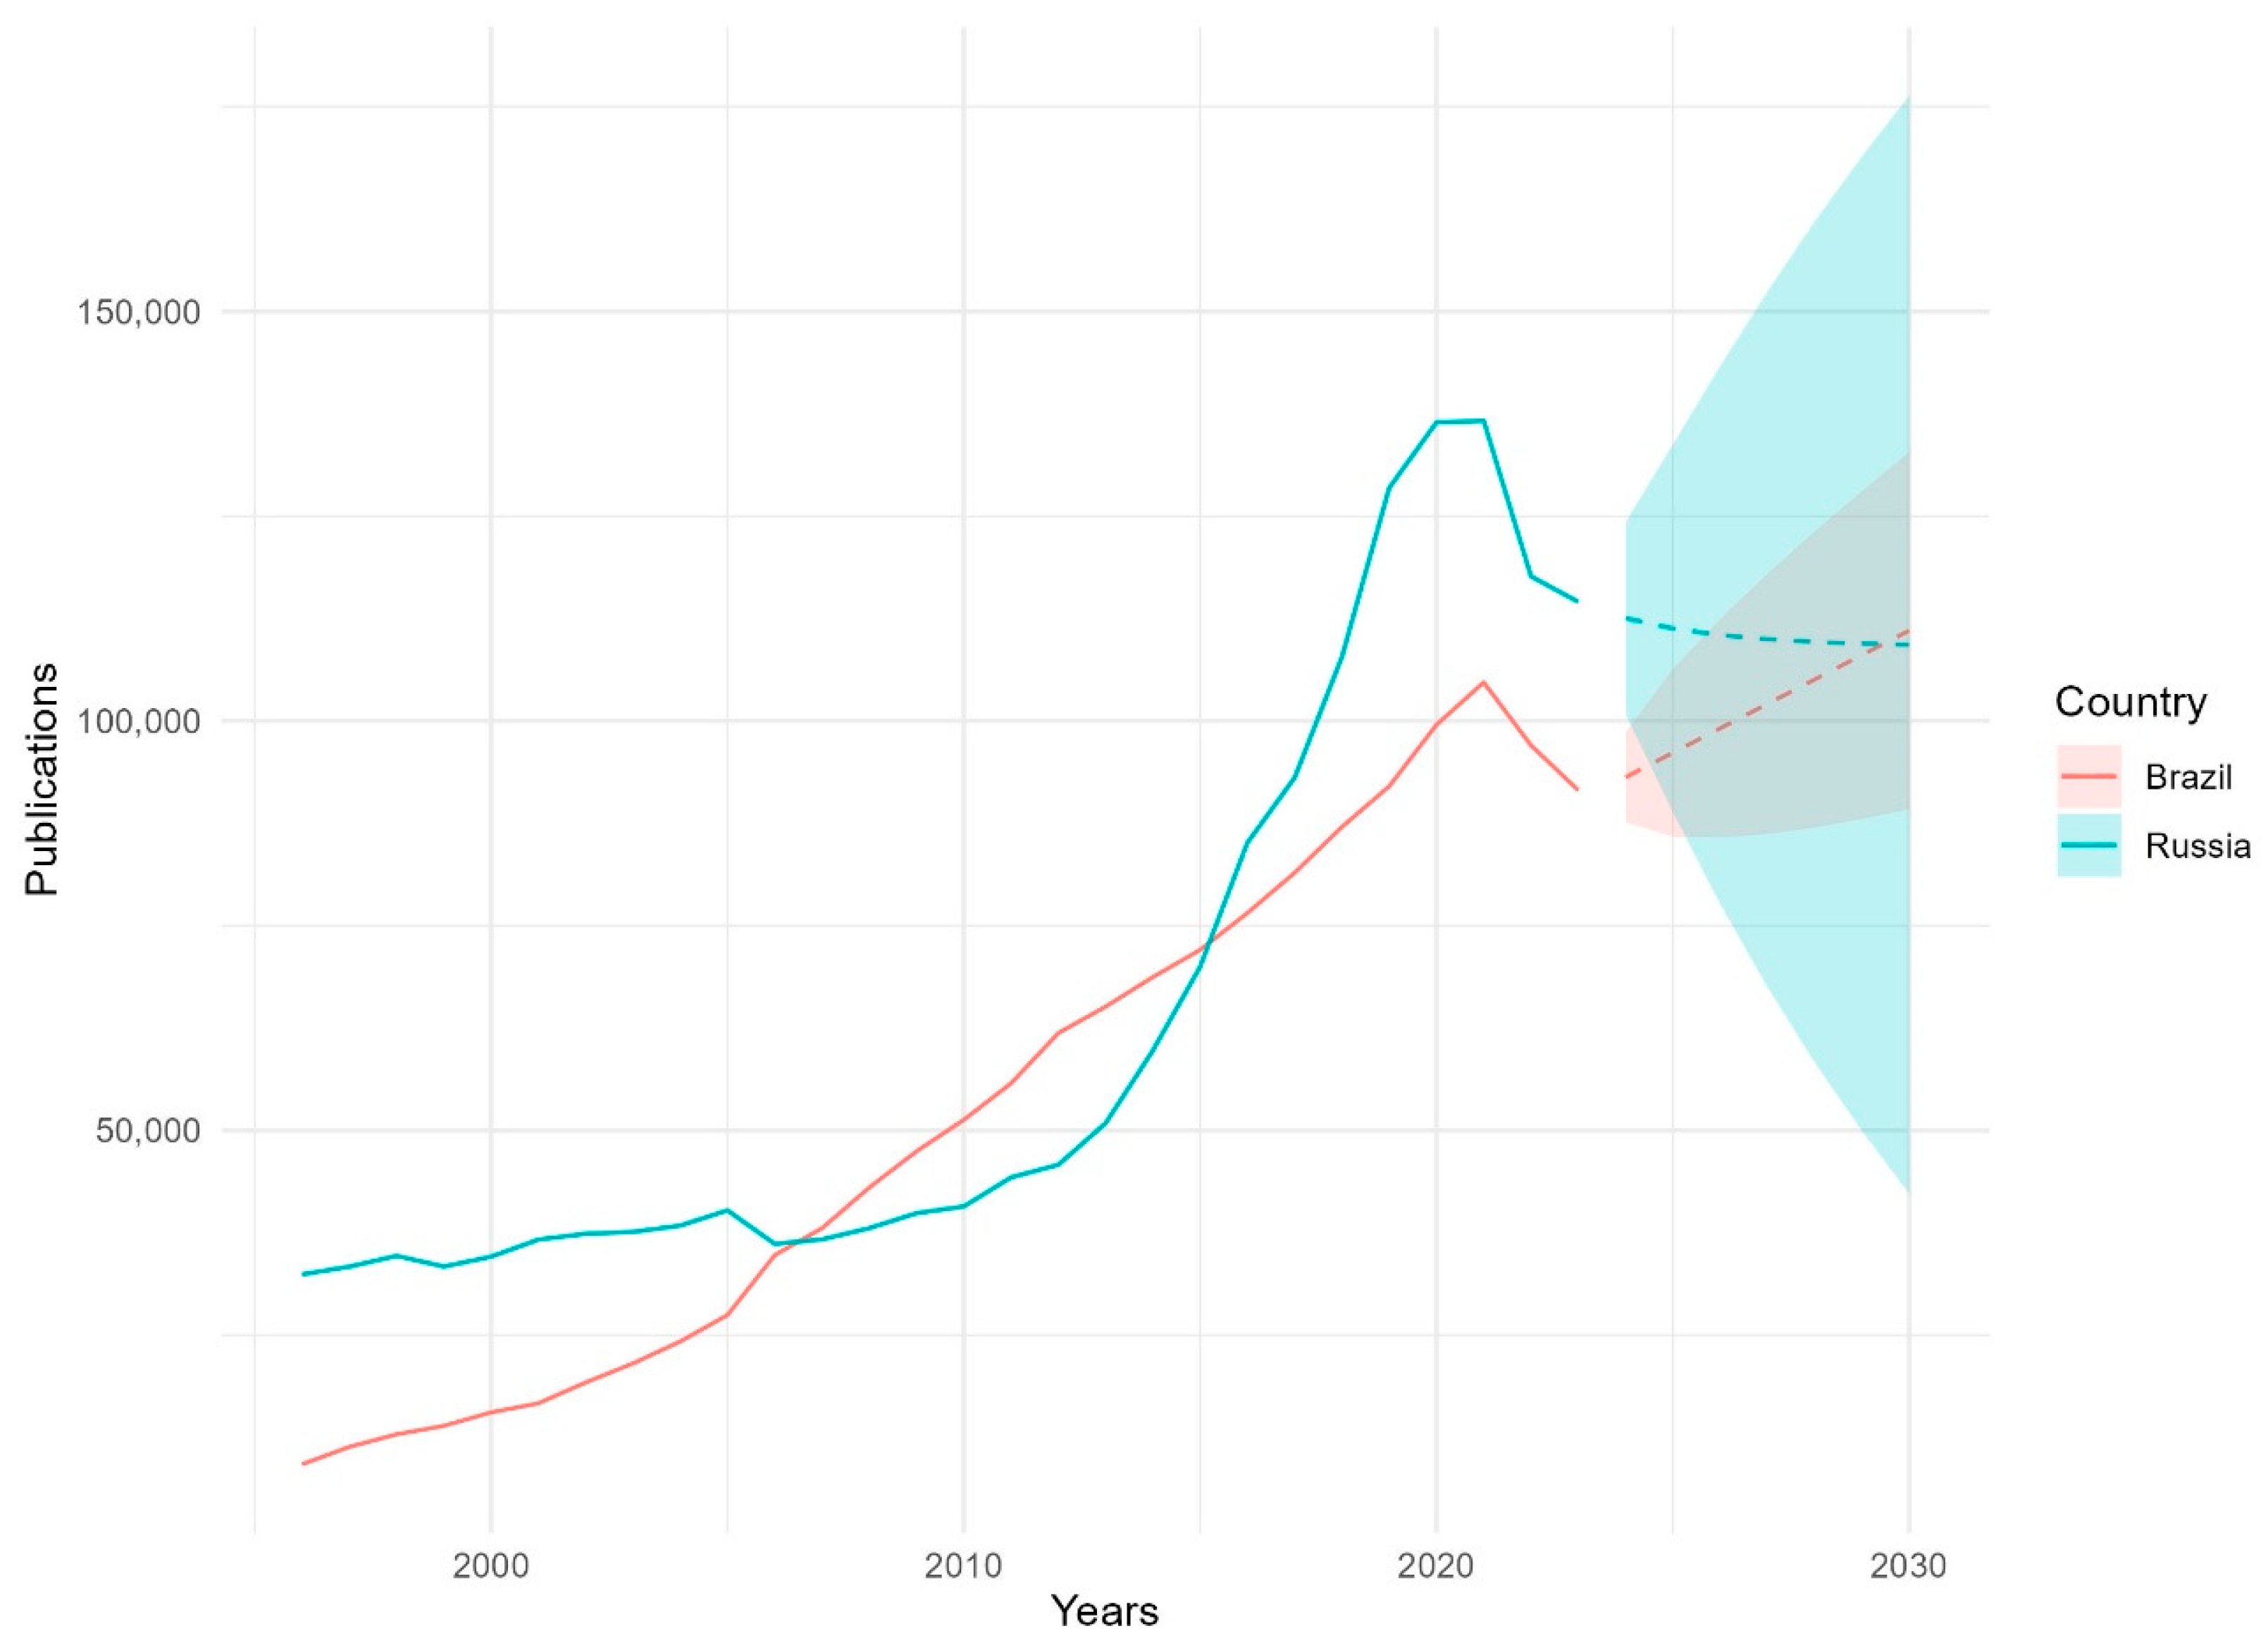
Russia shows a rapid increase in the number of publications up until around 2015, followed by a noticeable decline (Figure 6). Russia’s scientific output has faced significant challenges due to economic, geopolitical, and institutional factors. Prolonged economic constraints, exacerbated by international sanctions and declining revenues from energy exports, have limited the country’s investment in research and development, which remains below 1% of GDP. Additionally, the stagnation of research infrastructure and reduced funding for universities have hindered the ability of Russian institutions to compete globally. The “brain drain” phenomenon, with many skilled researchers seeking opportunities abroad, further undermines Russia’s scientific capacity. International collaborations, which could mitigate some of these challenges, have diminished due to geopolitical tensions, isolating Russian researchers from major global networks and funding opportunities. These factors collectively contribute to the slower and uneven growth in Russia’s scientific production, contrasting sharply with the accelerated progress observed in countries like China. The confidence intervals in the projections (shaded areas) reveal higher uncertainty for Russia, reflecting the unpredictability of how ongoing conflicts may influence its scientific landscape in the future (Makkonen & Mitze, 2023). Brazil, on the other hand, shows a more steady and consistent growth in publications, particularly between 2000 and 2020. While the rate of growth is not as steep as Russia’s initial surge, Brazil has managed to sustain a positive trajectory. However, after 2020, there is a slight dip, possibly reflecting economic and political challenges within the country. As the largest economy in South America, Brazil has made significant investments in higher education and research through initiatives such as the Science Without Borders Program, which has supported thousands of researchers in gaining international experience. Additionally, Brazil’s strengths in fields such as health, environmental sciences, and physics reflect its natural resources and policy priorities (McManus et al., 2024). However, Brazil faces persistent challenges that hinder its scientific potential. Economic instability, combined with reduced public spending on research in recent years, has constrained growth. The proportion of GDP allocated to R&D remains below 1.5%, and the reliance on government funding has made Brazil’s research system vulnerable to political and economic fluctuations. Furthermore, limited collaboration between universities and industries has slowed innovation (Silva et al., 2021). Strengthening these partnerships and diversifying funding sources could enhance Brazil’s competitiveness in the global research landscape. Despite these challenges, Brazil’s potential for growth remains significant, especially if it capitalizes on its strong international academic collaborations and natural advantages. Nevertheless, the projections for Brazil suggest a stable or mildly increasing trend moving forward.
In summary, the forecasts indicate that China is likely to dominate global scientific output by 2030 if its current growth continues, while the United States and other G7 countries will experience stable but moderate increases. BRICS countries, particularly Brazil and Russia, appear constrained in their growth, suggesting persistent disparities in scientific output among these countries. India, with a moderate growth trajectory, may emerge as a notable contributor if it continues to enhance its research capabilities. These projections underscore the divergent paths of G7 and BRICS countries in scientific production. While G7 countries maintain stable and consistent growth, BRICS countries display more variability, with China leading an accelerated growth trend and other BRICS nations following at a slower pace. The confidence intervals highlight the influence of external factors such as research funding, policy changes, and economic conditions, which may shape the global landscape of scientific production in the coming decade.

5. Implications and Conclusions

5.1. Key Findings

This study presents a comparative analysis of scientific production trends between G7 and BRICS countries, utilizing ARIMA models to forecast future output. The analysis revealed clear differences in the trajectories of these two groups: G7 nations generally exhibit steady, linear growth in scientific output, largely sustained by their established research infrastructures and consistent investments in higher education. In contrast, BRICS countries, particularly China, display accelerated and nonlinear growth, driven by substantial increases in research funding and strategic national initiatives. The forecasts indicate that, if current trends persist, China may surpass the threshold of 2,000,000 yearly indexed publications by 2030, potentially reshaping global research dynamics. Other BRICS countries, like India, are also on an upward trajectory, although at a more moderate pace, while Brazil and Russia face growth challenges, possibly due to economic and geopolitical constraints. Among G7 countries, the United States, Germany, and the United Kingdom are expected to maintain their leading positions, with relatively stable growth rates and narrower confidence intervals in the forecasts. Italy shows a moderate yet consistent increase, while Japan and Canada display more gradual growth patterns, reflecting their focus on research quality and sustainability over quantity.

5.2. Implications and Policy Recommendations

To address the disparities between the G7 and BRICS countries, this study emphasizes the need for targeted strategies. For BRICS nations, bridging gaps in research infrastructure and fostering international collaborations with leading research economies are essential to sustaining their growth trajectories. Policies promoting STEM (Science, Technology, Engineering, and Mathematics) education could play a transformative role in cultivating a skilled workforce capable of driving scientific innovation. For instance, initiatives aimed at increasing access to higher education, modernizing university facilities, and fostering industry–academia partnerships could significantly enhance research productivity. Similarly, addressing issues of academic workforce migration—both “brain drain” in BRICS countries and “brain gain” in G7 countries—is critical for ensuring long-term growth and balanced development in global research output. Creating incentives for researchers to stay within their home countries, such as competitive salaries, research funding opportunities, and collaborative networks, can help mitigate these challenges. Among G7 countries, the focus should remain on sustaining their competitive edge by reinforcing investments in cutting-edge fields such as artificial intelligence, renewable energy, and biotechnology while fostering diversity and inclusion in research environments. Collaborative programs, particularly with BRICS nations, could enhance knowledge transfer and encourage joint research initiatives that tackle global challenges such as climate change, public health, and technological innovation.

5.3. Study Limitations

Despite these valuable insights, the study has some limitations that must be acknowledged. First, the reliance on bibliometric data exclusively from the Scopus database may not fully capture the entirety of scientific output, especially in countries where research is often published in non-indexed or regional journals. This could introduce a bias, particularly for BRICS nations with diverse publication practices. Second, the study does not account for the evolution of Scopus itself over the years analyzed, including changes in the number of indexed journals and the inclusion of new sources, which may influence trends in scientific output. Additionally, while ARIMA models are effective for short- to medium-term forecasting, they may not adequately account for sudden shifts in research policies, changes in funding priorities, or external shocks such as geopolitical tensions, which can significantly alter scientific production trends. The model’s assumptions of linearity and stationarity may not fully reflect the complexities of the global research landscape.

5.4. Future Research and Contributions to the Literature

Future research could address these limitations by integrating additional data sources, such as Web of Science or national databases, to provide a more comprehensive view of scientific output. Further studies could also explore the impact of international collaborations, policy changes, and economic conditions on scientific productivity, using a combination of quantitative and qualitative methods to gain deeper insights into the drivers of scientific growth. The findings from this study contribute to the literature on global research dynamics by highlighting both the opportunities and challenges faced by G7 and BRICS countries. These insights are crucial for policymakers, funding agencies, and academic institutions as they navigate an evolving and increasingly competitive scientific landscape, allowing for more informed strategies to support balanced and sustainable growth in global research output. The findings from this study contribute to the literature on global research dynamics by highlighting both the opportunities and challenges faced by G7 and BRICS countries. These insights are crucial for policymakers, funding agencies, and academic institutions as they navigate an evolving and increasingly competitive scientific landscape, allowing for more informed strategies to support balanced and sustainable growth in global research output.

Funding

This research received no external funding.

Data Availability Statement

The data from Scopus used in this study were analyzed and represented graphically; however, due to licensing restrictions, these data cannot be made publicly available. In contrast, the UNESCO data utilized in this research are freely accessible and can be obtained from the UIS.STAT database at http://data.uis.unesco.org (accessed on 2 February 2025).

Conflicts of Interest

The author declares no conflicts of interest.

References

  1. Aithal, P. S., & Aithal, S. (2020). Implementation strategies of higher education part of national education policy 2020 of India towards achieving its objectives. International Journal of Management, Technology, and Social Sciences (IJMTS), 5(2), 283–325. [Google Scholar] [CrossRef]
  2. Arimoto, T. (2024). The transformation of science, technology and innovation (STI) policy in Japan. Asia Pacific Business Review, 30(3), 485–498. [Google Scholar] [CrossRef]
  3. Atkinson, R., & Zhang, L. (2024). Assessing Canadian innovation, productivity, and competitiveness. ITIF. [Google Scholar]
  4. Bornmann, L., & Mutz, R. (2015). Growth rates of modern science: A bibliometric analysis based on the number of publications and cited references. Journal of the Association for Information Science and Technology, 66(11), 2215–2222. [Google Scholar] [CrossRef]
  5. Bouabid, H., Paul-Hus, A., & Larivière, V. (2016). Scientific collaboration and high-technology exchanges among BRICS and G-7 countries. Scientometrics, 106, 873–899. [Google Scholar] [CrossRef]
  6. Bratti, M., Tindaro, C., Lippo, E., Nappi, C. A., & Turri, M. (2021). The effect of research evaluation exercises on research output: Fifteen years of evidence from Italy. Politica Economica, 37(1), 13–42. [Google Scholar] [CrossRef]
  7. Brint, S., & Carr, C. E. (2017). The scientific research output of US research universities, 1980–2010: Continuing dispersion, increasing concentration, or stable inequality? Minerva, 55, 435–457. [Google Scholar] [CrossRef]
  8. Carpentier, V., & Courtois, A. (2024). Higher education and the public good in France. Higher Education, 89, 223–238. [Google Scholar] [CrossRef]
  9. Chen, D. H., & Dahlman, C. J. (2005). The knowledge economy, the KAM methodology and World Bank operations. (World Bank Institute Working Paper, 37256). World Bank. [Google Scholar]
  10. Esh, M. (2024). Predicting future citations from AI publication trends: A comparative analysis of forecasting models. The Serials Librarian, 85, 155–168. [Google Scholar] [CrossRef]
  11. European Commission. (2024). Science, research and innovation performance of the EU 2024 report. Available online: https://research-and-innovation.ec.europa.eu/knowledge-publications-tools-and-data/publications/all-publications/science-research-and-innovation-performance-eu-2024-report_en (accessed on 2 February 2025).
  12. Furman, J. L., Porter, M. E., & Stern, S. (2002). The determinants of national innovative capacity. Research Policy, 31(6), 899–933. [Google Scholar] [CrossRef]
  13. Fuyuno, I. (2012). Numbers of young scientists declining in Japan. Nature News. [Google Scholar] [CrossRef]
  14. Gao, J., Yin, Y., Myers, K. R., Lakhani, K. R., & Wang, D. (2021). Potentially long-lasting effects of the pandemic on scientists. Nature Communications, 12(1), 6188. [Google Scholar] [CrossRef]
  15. Hatemi-J, A., Ajmi, A. N., El Montasser, G., Inglesi-Lotz, R., & Gupta, R. (2016). Research output and economic growth in G7 countries: New evidence from asymmetric panel causality testing. Applied Economics, 48(24), 2301–2308. [Google Scholar] [CrossRef]
  16. Highman, L., Marginson, S., & Papatsiba, V. (2023). Higher education and research: Multiple negative effects and no new opportunities after Brexit. Contemporary Social Science, 18(2), 216–234. [Google Scholar] [CrossRef]
  17. Horta, H., & Veloso, F. M. (2007). Opening the box: Comparing EU and US scientific output by scientific field. Technological Forecasting and Social Change, 74(8), 1334–1356. [Google Scholar] [CrossRef]
  18. Hyndman, R. J., & Khandakar, Y. (2008). Automatic time series forecasting: The forecast package for R. Journal of Statistical Software, 27, 1–22. [Google Scholar] [CrossRef]
  19. Hyndman, R. J., Athanasopoulos, G., Bergmeir, C., Caceres, G., Chhay, L., O’Hara-Wild, M., Petropoulos, F., Razbash, S., Wang, E., Yasmeen, F., Garza, F., Girolimetto, D., Ihaka, R., R Core Team, Reid, D., Shaub, D., Tang, Y., Wang, X., & Zhou, Z. (2020). Package ‘forecast’. Available online: https://cran.r-project.org/web/packages/forecast/forecast.pdf (accessed on 4 February 2025).
  20. Ioannidis, J. P., Boyack, K. W., & Klavans, R. (2014). Estimates of the continuously publishing core in the scientific workforce. PLoS ONE, 9(7), e101698. [Google Scholar] [CrossRef] [PubMed]
  21. Khamdamov, S. J., Makhmudov, S., Talapova, N. B., Mamadiyarov, Z., Rejapova, N. B., & Valieva, S. K. (2008). Forecasting the growth of scientific research funding in Uzbekistan’s higher education system: An ARIMA model approach. Current Dynamics in Business and Economics: Theoretical Approaches and Empirical Discoveries, 257. [Google Scholar]
  22. King, D. A. (2004). The scientific impact of nations. Nature, 430(6997), 311–316. [Google Scholar] [CrossRef]
  23. Labate, M. G., Waterson, M., Alachkar, B., Hendre, A., Lewis, P., Bartolini, M., & Dewdney, P. (2022). Highlights of the square kilometre array low frequency (SKA-LOW) telescope. Journal of Astronomical Telescopes, Instruments, and Systems, 8(1), 011024. [Google Scholar] [CrossRef]
  24. Makkonen, T., & Mitze, T. (2023). Geopolitical conflicts, sanctions and international knowledge flows: EU–Russia collaboration during the Ukraine crisis. The World Economy, 46(10), 2926–2949. [Google Scholar] [CrossRef]
  25. Mansfield, E. (1991). Academic research and industrial innovation. Research Policy, 20(1), 1–12. [Google Scholar] [CrossRef]
  26. Marginson, S. (2011). Higher education in East Asia and Singapore: Rise of the Confucian model. Higher Education, 61, 587–611. [Google Scholar] [CrossRef]
  27. Marginson, S. (2022). Global science and national comparisons: Beyond bibliometrics and scientometrics. Comparative Education, 58(2), 125–146. [Google Scholar] [CrossRef]
  28. Mayosi, B. M., Lawn, J. E., Van Niekerk, A., Bradshaw, D., Karim, S. S. A., & Coovadia, H. M. (2012). Health in South Africa: Changes and challenges since 2009. The Lancet, 380(9858), 2029–2043. [Google Scholar] [CrossRef]
  29. McManus, C., Baeta Neves, A. A., Audy, J. N., & Prata, A. T. (2024). Public research institutes in Brazil: Evidence of research and innovation impact. Innovation: The European Journal of Social Science Research, 1–23. [Google Scholar] [CrossRef]
  30. Monroy, S. E., & Diaz, H. (2018). Time series-based bibliometric analysis of the dynamics of scientific production. Scientometrics, 115, 1139–1159. [Google Scholar] [CrossRef]
  31. Morgan, A. C., LaBerge, N., Larremore, D. B., Galesic, M., Brand, J. E., & Clauset, A. (2022). Socioeconomic roots of academic faculty. Nature Human Behaviour, 6(12), 1625–1633. [Google Scholar] [CrossRef]
  32. Neureiter, N. P., & Cheetham, M. (2013). The Indo-US science and technology forum as a model for bilateral cooperation. Science & Diplomacy, 2(4). Available online: https://www.sciencediplomacy.org/editorial/2013/indo-us-science-and-technology-forum-model-for-bilateral-cooperation (accessed on 5 December 2024).
  33. Nwadiuko, J., Switzer, G. E., Stern, J., Day, C., & Paina, L. (2021). South African physician emigration and return migration, 1991–2017: A trend analysis. Health Policy and Planning, 36(5), 630–638. [Google Scholar] [CrossRef]
  34. Pinto, T., & Teixeira, A. A. (2020). The impact of research output on economic growth by fields of science: A dynamic panel data analysis, 1980–2016. Scientometrics, 123(2), 945–978. [Google Scholar] [CrossRef]
  35. Pinz, A., Roudyani, N., & Thaler, J. (2021). Public-private partnerships as instruments to achieve sustainability-related objectives: The state of the art and a research agenda. Sustainable Public Management, 3–24. [Google Scholar] [CrossRef]
  36. Pranckutė, R. (2021). Web of Science (WoS) and Scopus: The titans of bibliographic information in today’s academic world. Publications, 9(1), 12. [Google Scholar] [CrossRef]
  37. Ramoutar-Prieschl, R., & Hachigonta, S. (2020). Management of research infrastructures: A South African funding perspective (p. 103). Springer Nature. [Google Scholar] [CrossRef]
  38. Rana, S., Verma, S., Haque, M. M., & Ahmed, G. (2022). Conceptualizing international positioning strategies for Indian higher education institutions. Review of International Business and Strategy, 32(4), 503–519. [Google Scholar] [CrossRef]
  39. Sattiraju, V. K., & Janodia, M. D. (2024). Analysis of science, technology and innovation (STI) policies of India from 1958 to 2020. Journal of Science and Technology Policy Management, 15(6), 1691–1708. [Google Scholar] [CrossRef]
  40. Shashnov, S., & Kotsemir, M. (2018). Research landscape of the BRICS countries: Current trends in research output, thematic structures of publications, and the relative influence of partners. Scientometrics, 117(2), 1115–1155. [Google Scholar] [CrossRef]
  41. Shumway, R. H., Stoffer, D. S., & Stoffer, D. S. (2000). Time series analysis and its applications (Vol. 3, p. 4). Springer. [Google Scholar] [CrossRef]
  42. Silva, D. R. D. M., Lucas, L. O., & Vonortas, N. S. (2021). Internal barriers to innovation and university-industry cooperation among technology-based SMEs in Brazil. In The Influence of Internal Barriers on Open Innovation (pp. 31–59). Routledge. [Google Scholar] [CrossRef]
  43. Singh, M. K. (2022). Scholarly efforts of Indian Space Research Organisation during 2002–2021: Mapping and Visualization. Library Waves, 8(1), 1–18. [Google Scholar]
  44. Soares, F. L. D. T. (2024). The role of the private sector in the promotion of the sustainable development agenda: A study case of Japan and Germany [Ph.D. thesis, Universidade de Brasília]. Available online: http://repositorio2.unb.br/jspui/handle/10482/48393 (accessed on 5 December 2024).
  45. Song, Y., & Cao, J. (2022). An ARIMA-based study of bibliometric index prediction. Aslib Journal of Information Management, 74(1), 94–109. [Google Scholar] [CrossRef]
  46. Tilak, J. B., & Kumar, A. G. (2022). Policy changes in global higher education: What lessons do we learn from the COVID-19 pandemic? Higher Education Policy, 35(3), 610. [Google Scholar] [CrossRef] [PubMed]
  47. Tollefson, J., & Van Noorden, R. (2024). The US is the world’s science superpower—But for how long? Nature, 634(8035), 770–774. [Google Scholar] [CrossRef]
  48. UNESCO Institute for Statistics. (2024). UIS.STAT database. Available online: http://data.uis.unesco.org (accessed on 4 February 2025).
  49. Wagner, M., Schaltegger, S., Hansen, E. G., & Fichter, K. (2021). University-linked programmes for sustainable entrepreneurship and regional development: How and with what impact? Small Business Economics, 56, 1141–1158. [Google Scholar] [CrossRef]
  50. Woolston, C. (2023). What China’s leading position in natural sciences means for global research. Nature, 620(7973), 2–5. [Google Scholar] [CrossRef] [PubMed]
  51. Yue, X., Feng, Y., & Ye, Y. (2021). A model of sustainable leadership for leaders in double first-class universities in China. International Journal of Higher Education, 10(3), 187–201. [Google Scholar] [CrossRef]
  52. Zhi, Q., & Pearson, M. M. (2017). China’s hybrid adaptive bureaucracy: The case of the 863 program for science and technology. Governance, 30(3), 407–424. [Google Scholar] [CrossRef]
  53. Zhu, J., & Liu, W. (2020). Comparing like with like: China ranks first in SCI-indexed research articles since 2018. Scientometrics, 124(2), 1691–1700. [Google Scholar] [CrossRef]
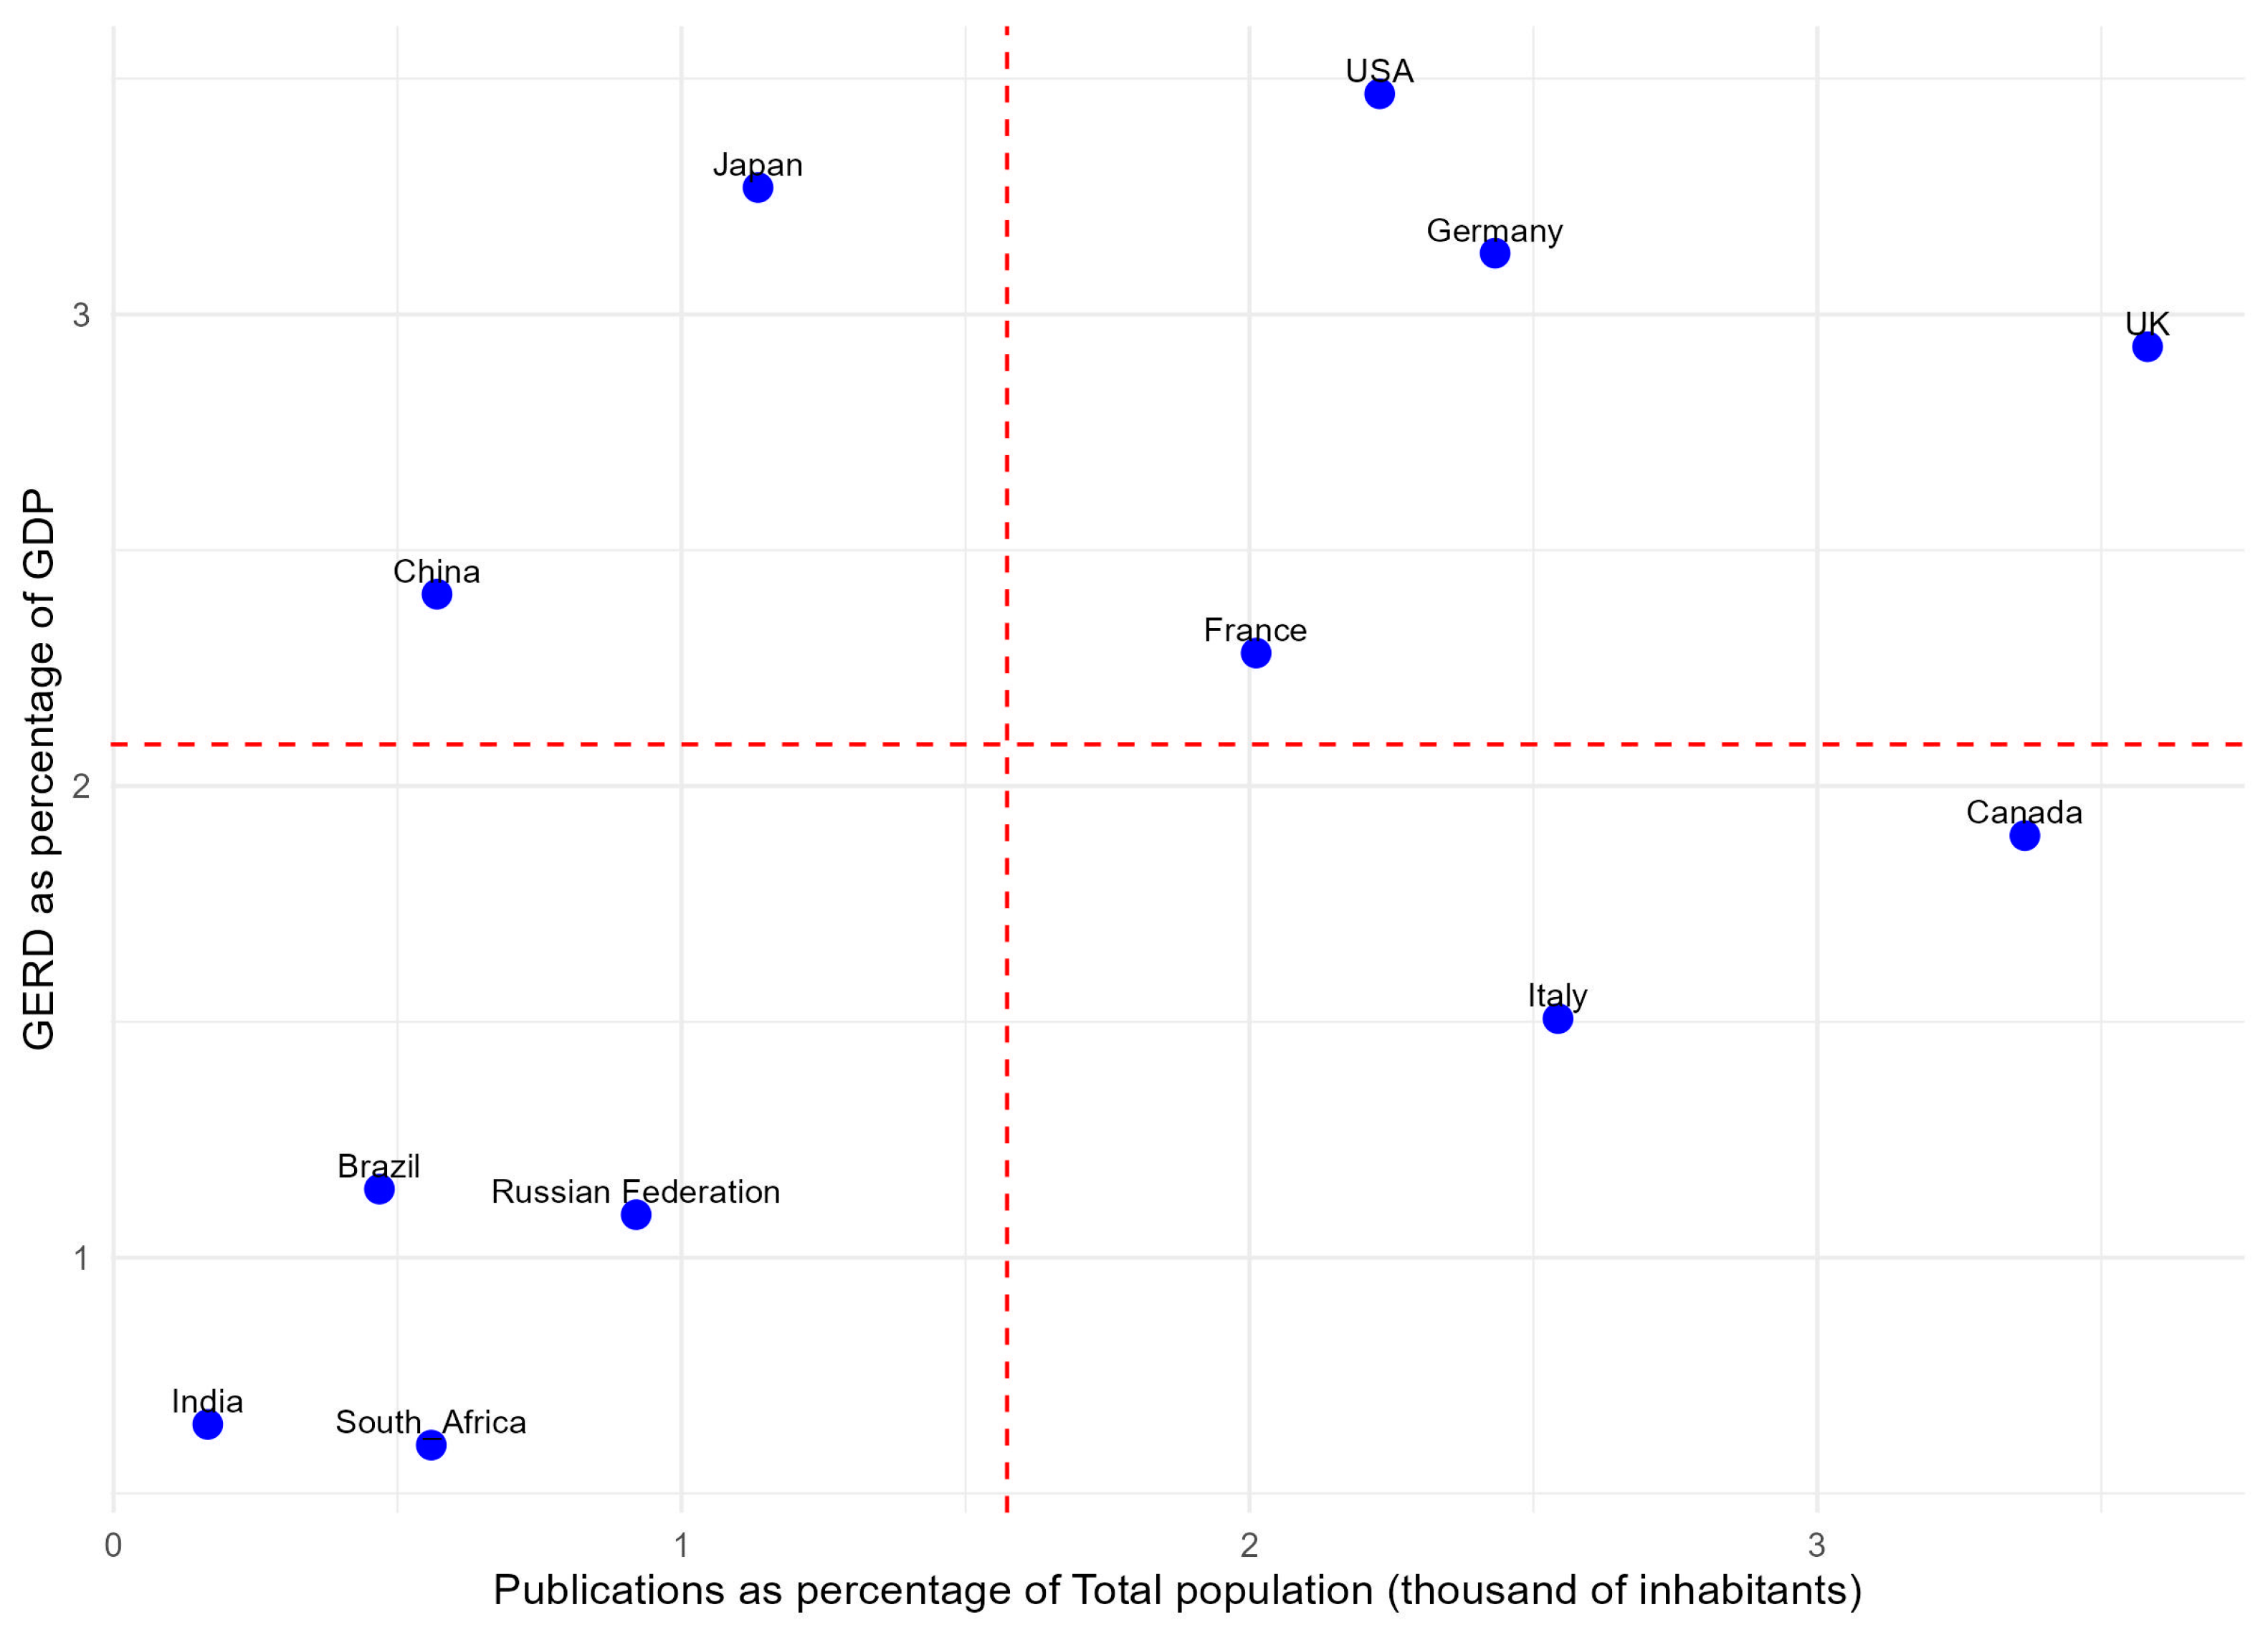
Figure 1. Clusters of countries for publications per person and GERD as percentage of GDP.
Publications 13 00006 g001
Figure 2. Trends of scientific publications of analyzed countries from 1996 to 2023.
Publications 13 00006 g002
Figure 3. Forecasted scientific publications volumes for United States and China (2024–3030).
Publications 13 00006 g003
Figure 4. Forecasted scientific publications volumes for United Kingdom, Germany, France, and Italy (2024–3030).
Publications 13 00006 g004
Figure 5. Forecasted scientific publications volumes for Canada, India, and Japan (2024–3030).
Publications 13 00006 g005
Figure 6. Forecasted scientific publications volumes for Russia and Brazil (2024–3030).
Publications 13 00006 g006
Table 1. ARIMA models and coefficients fitted by country.
Country ModelCoefficients
ar(1)ma(1)drift
CanadaARIMA(0,1,1) with drift0.541 3164.865
FranceARIMA(0,1,1) with drift 0.4102585.340
UKARIMA(0,1,0) with drift 5731.630
USAARIMA(0,1,1) with drift 0.35213,845.626
ItalyARIMA(0,1,1) with drift 0.5724418.526
JapanARIMA(0,1,0) with drift 1749.926
GermanyARIMA(0,1,0) with drift 4873.704
BrazilARIMA(0,1,1) with drift 0.5652983.144
ChinaARIMA(1,2,0)−0.581
IndiaARIMA(0,2,0)
RussiaARIMA(1,1,0)0.637
South AfricaARIMA(1,2,0)−0.481
Table 2. ARIMA post-estimation analysis by country.
CountryAICBICMAERMSEMAPEShapiro Test (p-Value)
Canada509.671513.5582001.4152653.7022.6660.692
France512.198516.0862095.4862789.2342.0530.318
UK556.625559.2175192.1156612.2713.0450.519
USA609.672613.55913,034.91116,976.2862.3450.329
Italy517.795521.6822360.5663081.6782.8540.044
Japan532.173534.7653207.3514204.3162.5240.322
Germany536.015538.6063233.8524514.3092.2100.084
Brazil509.647513.5341688.0402650.6453.8540.000
China609.283611.80017,260.02626,269.5176.0450.014
India520.923522.1813655.9395030.6273.2540.349
Russia549.644552.2363857.3805754.7035.3640.004
South Africa414.208416.724427.635618.6622.4690.006
Disclaimer/Publisher’s Note: The statements, opinions and data contained in all publications are solely those of the individual author(s) and contributor(s) and not of MDPI and/or the editor(s). MDPI and/or the editor(s) disclaim responsibility for any injury to people or property resulting from any ideas, methods, instructions or products referred to in the content.