1. Introduction
The collection and storage of scientific information have undergone significant advancements with the evolution of technology. However, the exponential growth of scientific production has gradually rendered some traditional methods inefficient (
Morales-Alarcón et al., 2024). Each year, over 8.8 million experts worldwide produce more than 2.5 million new research publications, reflecting an impressive annual growth rate of 8% to 9% (
Morales-Alarcón et al., 2024). Broadly, there are two primary methods for disseminating knowledge in published works: depositing them in subscription-based repositories or making them available as open research in Open Access (OA) repositories. The latter approach is increasingly dominating knowledge dissemination, as major publishing companies are shifting from traditional subscription-based models to OA or hybrid models (
Turgel & Chernova, 2024). This openness is quickly becoming the norm, supported by many leading universities transitioning to an open development model, steadily increasing their OA publications and prioritizing the transition (
Turgel & Chernova, 2024). Moreover, a significant benefit of publishing in OA is that these articles tend to receive more citations than their subscription-based counterparts, while authors also experience reduced processing times and quicker receipt of initial citations (
Abdin & De Pretis, 2024). Furthermore, developed countries like Japan have already announced that all publicly funded research will be made freely available (
Ikarashi, 2023). This trend is one of the primary reasons why our research focuses on OA repositories while still considering subscription-based journals. There is a wide variety of OA repositories, including arXiv, bioRxiv, chemRxiv, medRxiv, SSRN, PsyArXiv, HAL, Preprints.org, EarthArXiv, OSF, and EpiPreprints. Many of these repositories are accessible through an application programming interface (API) that facilitates data extraction and automation, as exemplified by the arXiv API (
arXiv API Access, 2025), which is incorporated into our framework.
Recent studies have demonstrated that AI can accelerate systematic literature reviews, enhance article selection, and reduce the manual workload involved in indexing (
de la Torre-López et al., 2023). Accurate indexing is essential for ensuring that information is categorized and easily retrievable. It requires consistent terminology; a clear hierarchical structure; and, when necessary, the use of automated tools to manage large datasets efficiently (
Manning et al., 2008;
Sarthi et al., 2024). Effective indexing demands careful attention to elements such as titles, abstracts, summaries, and tables of contents, as outlined in the ISO 5963 (
International Organization for Standardization, 1985) and UNE 50-121-91 standards, the latter specifically applying to Spanish-language documents (
Asociación Española de Normalización y Certificación, 1991).
Models based on natural language processing (NLP) and deep learning have led to significant improvements in the organization of scientific information, facilitating easier access and classification (
Musslick et al., 2025). Although automation has optimized several stages of the process, challenges persist in terms of model interpretability and the need for human oversight to ensure the quality of the processed information.
The evaluation of information retrieval systems dates back to Cyril Cleverdon’s development of precision and recall metrics (
Cleverdon, 1984). This measurement is particularly important given the inherent subjectivity, as the overlap between terms assigned by different individuals can vary between 30% and 60% (
Cleverdon, 1984). Cleverdon’s work, which quantified the proportion of relevant documents among the retrieved documents, became a foundational contribution in the 1960s (
Jaiswal et al., 2024).
Knowledge management continues to be a critical aspect of the scientific community, enabling the efficient acquisition, construction, and communication of information (
Zamiri & Esmaeili, 2024). In this context, the development of automated tools for collecting and analyzing scientific literature represents a strategic advance that can improve the effectiveness and efficiency of knowledge production.
A systematic review aims to identify and describe the current state of the art (SOTA) and AI techniques employed to represent and infer knowledge, enabling the efficient manipulation of text and the ability to learn from large datasets (
de la Torre-López et al., 2023). These techniques are particularly beneficial for tasks that are labor-intensive or repetitive for humans, such as analyzing scientific literature. Manually preparing and writing a systematic literature review (SLR) requires substantial time and effort, as it involves strategic planning, the performance of literature searches and analyses, and the reporting of findings (
de la Torre-López et al., 2023). Additionally, scientific cartography, or science mapping, offers valuable tools for visualizing and analyzing relationships, trends, and structures within scientific disciplines. Tools like VOSviewer (
Kirby, 2023) allow for graphical representations of geographic distribution, researcher collaborations, areas of interest, and the evolution of research topics.
A recent and highly significant development in the field of NLP is the emergence of large language models (LLMs) such as ChatGPT-4.5, Claude 3.5, Gemini 1.5, DeepSeek-R1, Meta-Llama 2, which have dramatically transformed the landscape of NLP (
Alkhamissi et al., 2023;
Miao & Holmes, 2023). The literature highlights several prompt engineering techniques applied to LLMs for academic document analysis, including the use of structured and context-specific prompts, each tailored for particular information-processing tasks (
Liu et al., 2023). However, studies have documented a decrease in efficiency when LLMs are tasked with more complex assignments (
Alshami et al., 2023;
Schick & Schütze, 2021). Furthermore, the accuracy of these models is highly dependent on the design of task-specific prompts (
Vatsal & Dubey, 2024). Different tasks demand varying levels of information and constraints to guide the LLM in producing the intended output (
Sivarajkumar et al., 2024). As such, it is essential to design precise, relevant prompts rather than relying on generic or vague instructions, which can lead to confusion or erroneous results (
Alshami et al., 2023;
Sivarajkumar et al., 2024). Another challenge is inherent in the very nature of large-scale models like GPT-3, which, although capable of learning effectively from few examples, require substantial computational resources for training and operation (
Wu et al., 2021). A notable comparison can also be drawn with the work of
Ofori-Boateng et al. (
2024), which introduced a fully automated method for keyword extraction. While this approach helps identify relevant terms, our research builds upon it by embedding keywords within the specific context of the academic field, thereby improving the accuracy of document selection. The performance of our system highlights its ability to retrieve a large volume of relevant documents with high accuracy, comparing favorably with existing approaches in the literature. However, achieving a balance between accuracy and completeness remains a persistent challenge.
1.1. State-of-the-Art Selection Using Artificial Intelligence
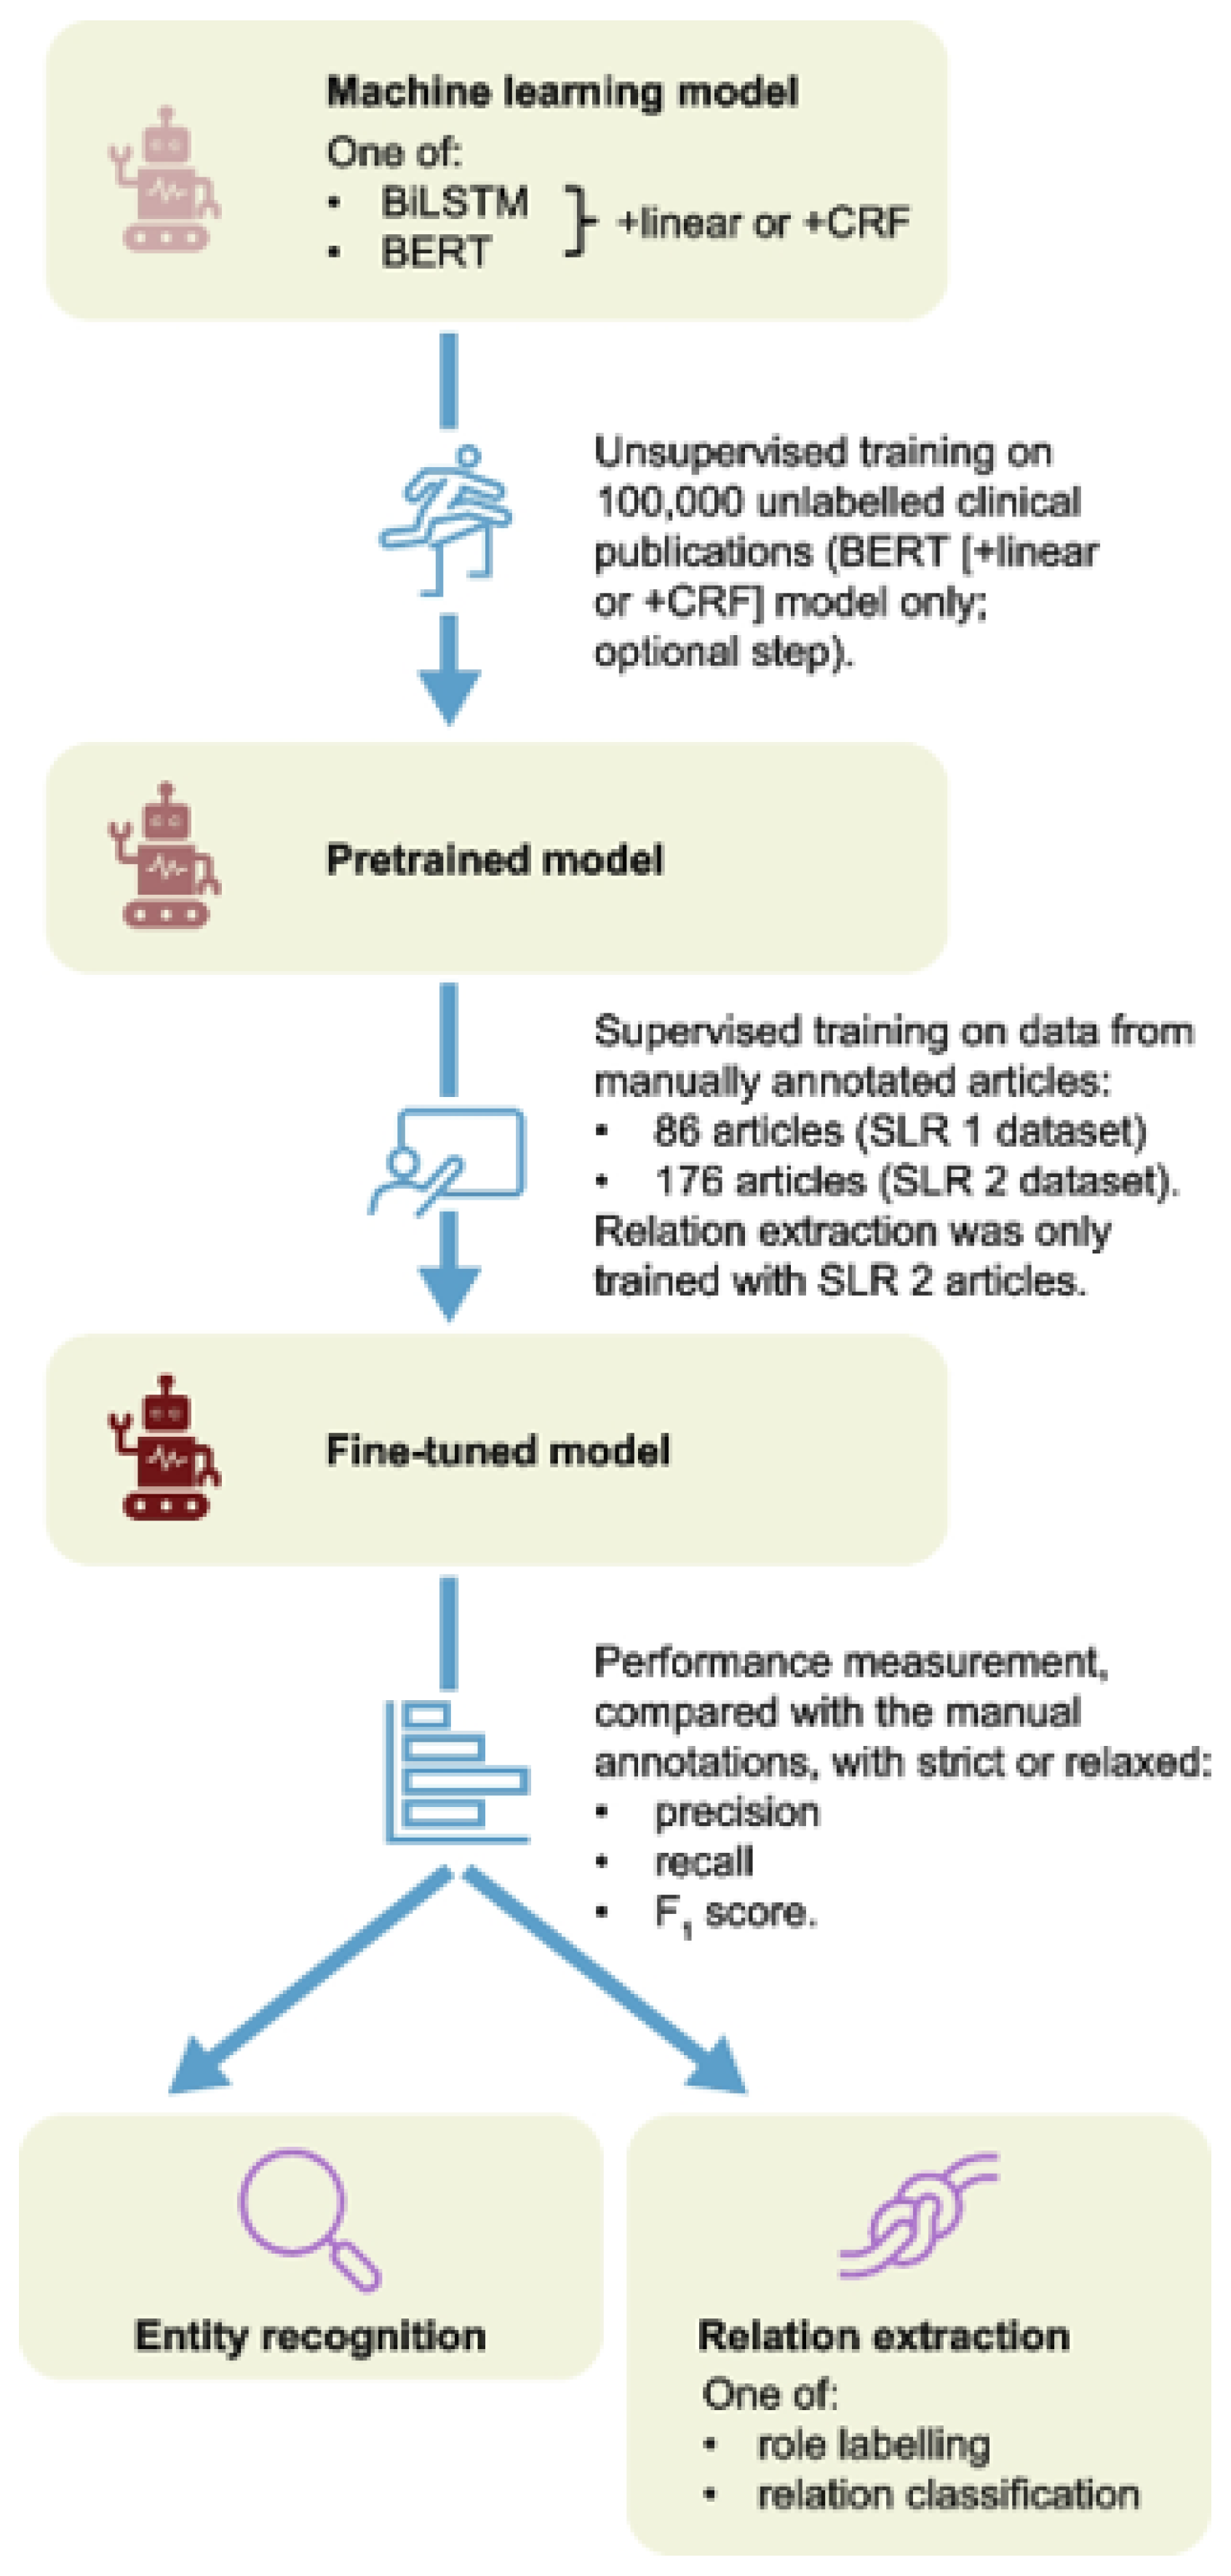
Panayi et al. (
2023) assessed the use of advanced NLP models such as BERT and BiLSTM for the automated extraction of data from scientific publications related to systematic literature reviews (SLRs) in oncology and Fabry disease. The methodology is illustrated in
Figure 1. Manual annotations of keyword were used to train the models, which were then compared with human annotations to assess their accuracy. Additionally, BERT was pre-trained with biomedical literature, and entity classification was optimized using a CRF model, with the
Score metric employed to evaluate performance. The results indicated that the pre-trained BERT+CRF model performed best in entity recognition, achieving an accuracy of 73% in oncology and 70% in Fabry disease (
Panayi et al., 2023). The model showed higher accuracy in identifying key clinical metrics, although it had lower precision in extracting treatment doses. On the other hand, the relationship classification model based on BERT achieved over 90% accuracy in cases with sufficient examples of relationships between biomedical entities (
Panayi et al., 2023). These findings suggest that, with further adjustments, machine learning could become a key tool for the automated extraction of data in systematic reviews, significantly optimizing processing times and reducing the manual workload involved in analyzing large volumes of scientific literature.
Despite advances in the automation of the building of cutting-edge technology, traditional methods of searching for and classifying information still require a considerable investment of time (
Joseph & Ravana, 2024). Traditional methods like pooling, sampling, and using evaluation metrics for large document collection are time-consuming and have higher computational costs (
Joseph & Ravana, 2024). Recent research has shown that integrating artificial intelligence into these processes can significantly improve efficiency (
Golinelli et al., 2022). The COKE (COVID-19 Knowledge Extraction) project showcases the power of artificial intelligence in enhancing the systematic review of scientific literature (
Golinelli et al., 2022). By leveraging machine reading models, deep learning, and sentence classification, the system effectively organizes large volumes of information into a structured format, enabling quicker and more informed decision making in high-uncertainty situations like the COVID-19 pandemic (
Golinelli et al., 2022).
The implementation of advanced NLP and semantic clustering techniques has significantly improved the accuracy of identifying relevant information within large scientific datasets (
Golinelli et al., 2022). Likewise, it has been discussed how the automation of scientific practice, through machine learning and deep learning tools, has made it possible to optimize knowledge management and improve the reproducibility of scientific studies (
Musslick et al., 2025). However, the need for human supervision in these processes is also noted, since data interpretation remains a critical factor for decision making in research (
Musslick et al., 2025).
1.2. Selecting the State of the Art (SOTA) of a Patent Using a Textual Similarity Search
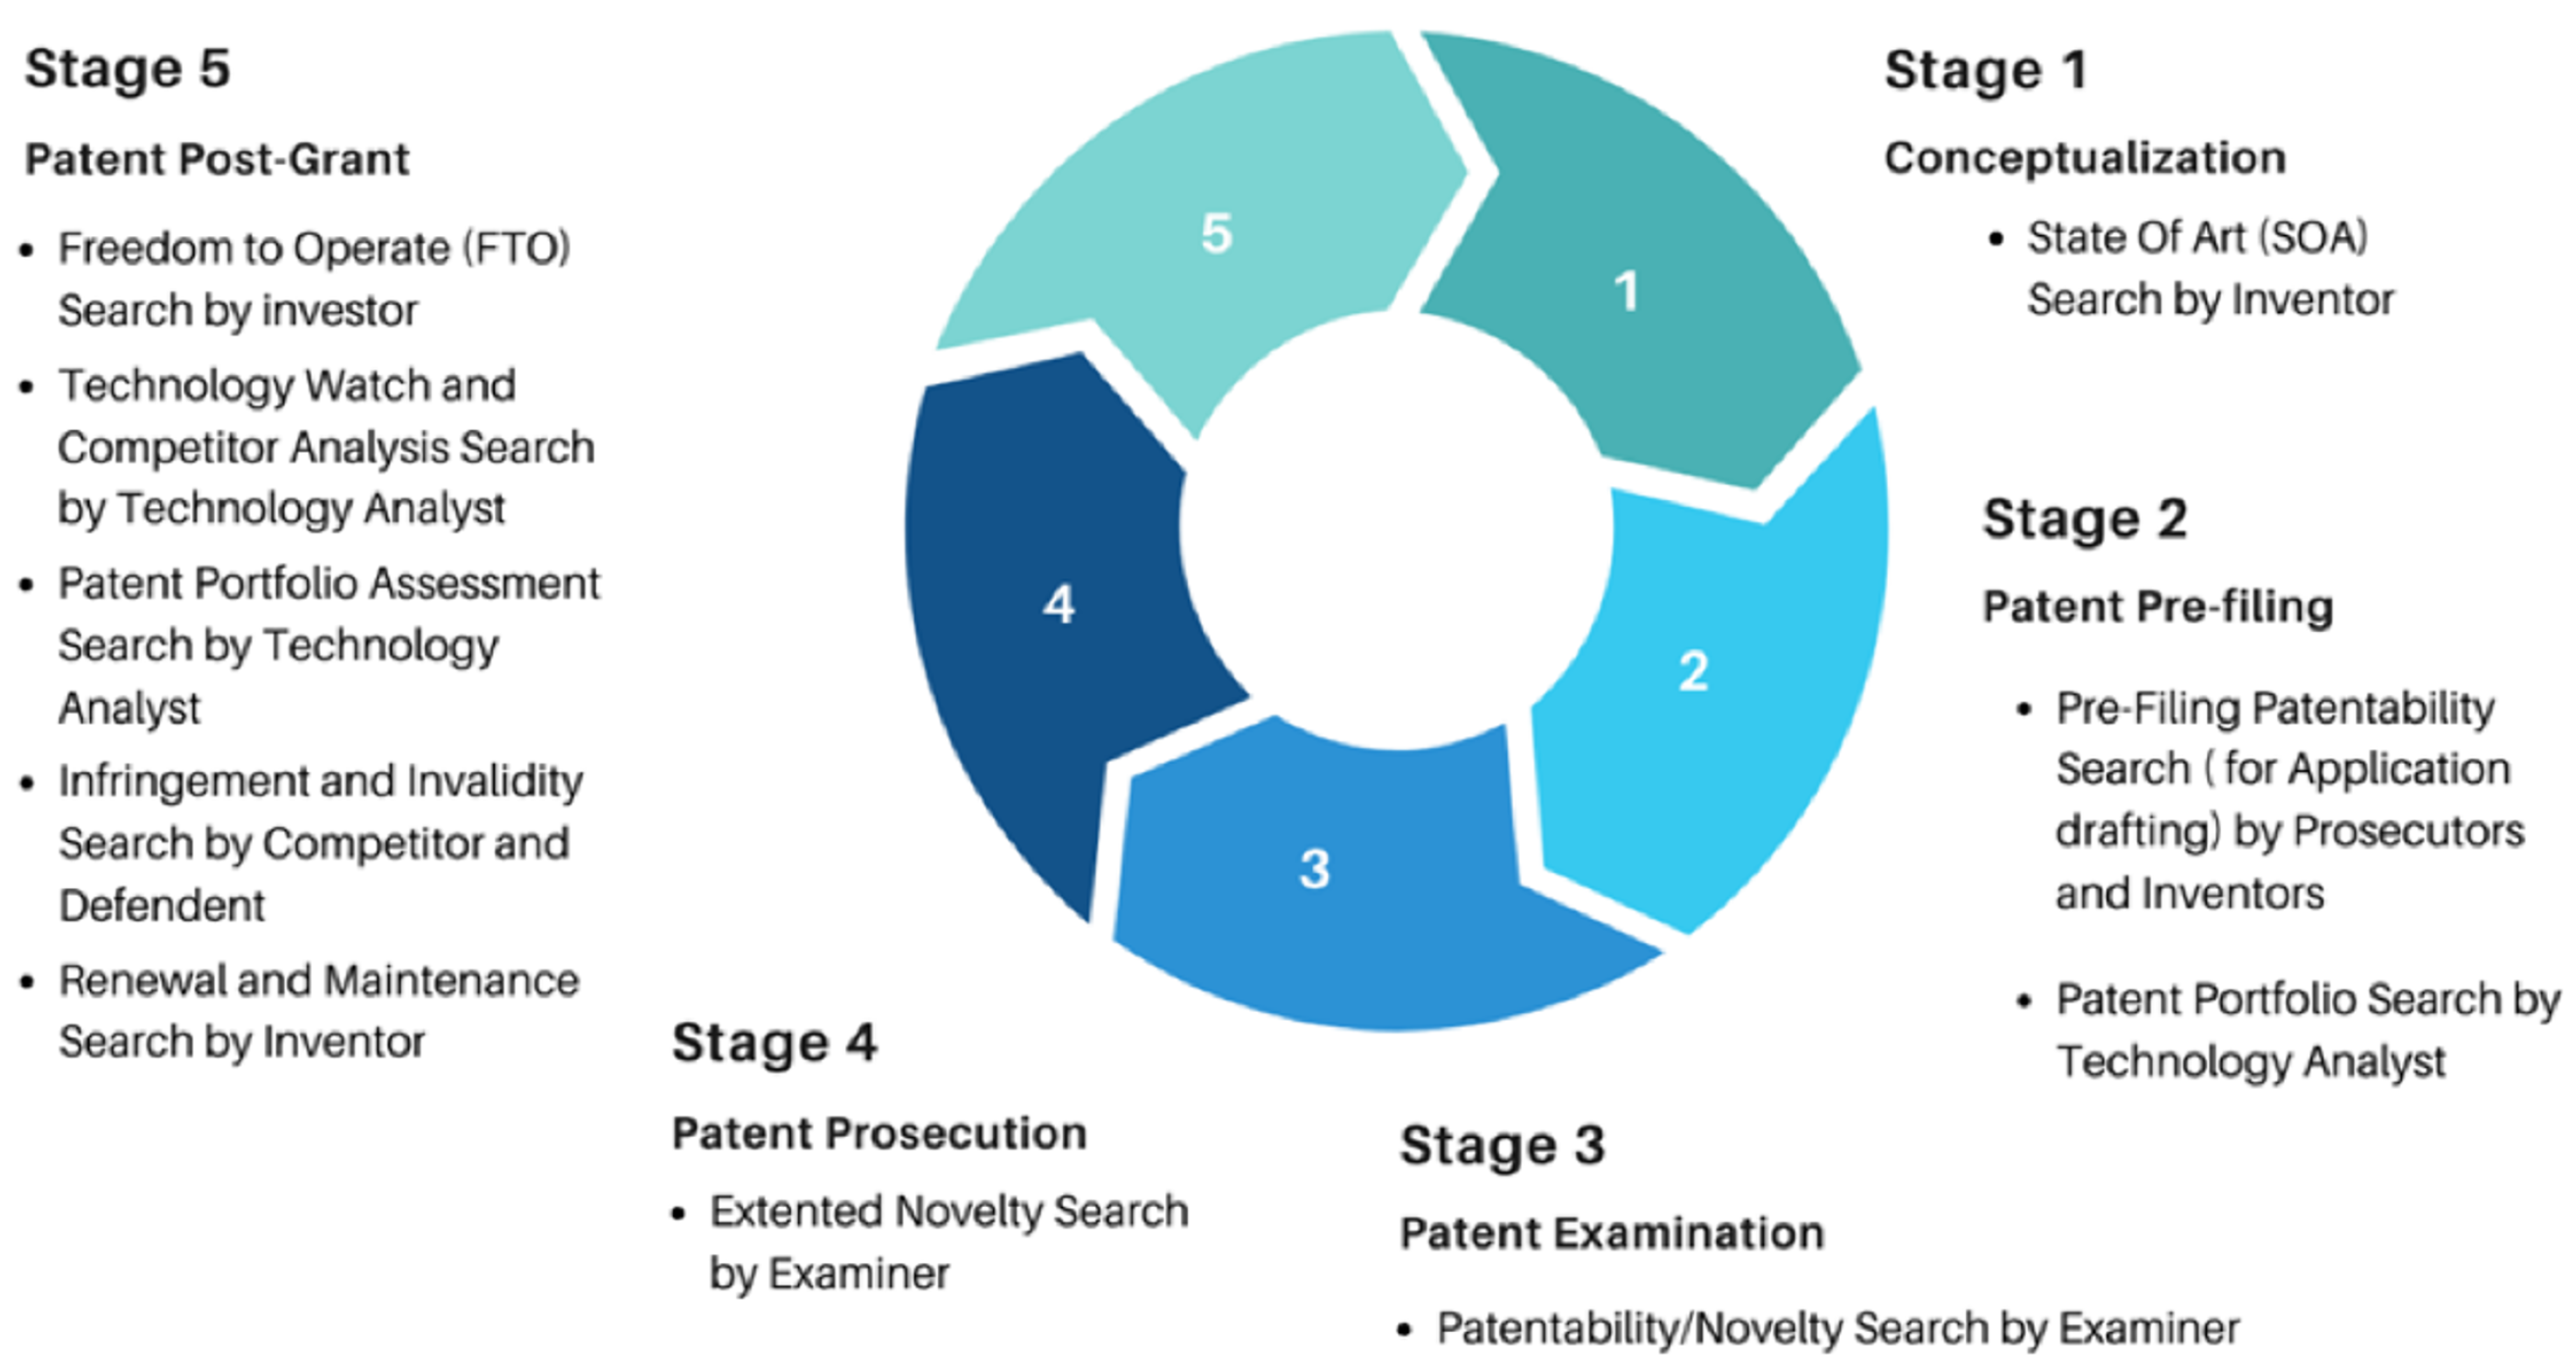
The method shown in
Figure 2 focuses on the automated search for and selection of patents. It provides a detailed analysis of the strategies applied over the past decade for prior art retrieval in patents, with particular emphasis on advancements in NLP techniques and semantic search (
Ali et al., 2024). Moreover, it addresses the main challenges affecting the accuracy and coverage of these searches and discusses potential future directions to enhance the effectiveness of information retrieval systems in this domain (
Ali et al., 2024).
Systematic literature reviews have proven to be key tools for analyzing recent advancements and trends in patent information retrieval (
Ali et al., 2024). In this context, various types of searches are necessary throughout the life cycle of a patent, from its conceptualization to its post-grant management.
Figure 2 illustrates the key stages where patent information retrieval is required, including the initial search for the SOTA, the evaluation of patentability during the pre-application and examination stages, and technological monitoring and portfolio assessment in the post-grant phase (
Ali et al., 2024).
Recent research underlines the need to apply advanced NLP and machine learning techniques for tasks such as article selection and full-text analysis, identifying challenges in transparency and replicability (
Jiang et al., 2024). Likewise, in the same article, it was shown that extended language models can transform the collection and synthesis of information in scientific reviews, significantly reducing manual workload and improving accuracy in extracting key data (
Jiang et al., 2024).
In this paper, a method that helps researchers quickly find relevant articles by searching for specific keywords in abstracts from scientific repositories is presented. To differentiate the term keywords, which is often used at the end of the article abstract, from keywords found in the abstract itself or in other metadata, such as the body of the article, in its title, etc., we refer to this term from now on as source words. The intention is to create a summary of articles based on the number of times these source words appear, making it easier to identify important texts for research. The algorithm saves time by overcoming challenges like finding synonyms and handling subjective terms.
1.3. Aim and Scope
The aim of this research is to automate the process of gathering relevant articles to construct a comprehensive SOTA review in a specific field of knowledge. This is achieved by automating keyword searches within article abstracts, using an innovative algorithm that identifies the most relevant articles based on the frequency of source words. Unlike previous studies exploring the automation of systematic reviews in scientific literature through the use of artificial intelligence, our approach stands out by incorporating more efficient indexing via the generation of key terms and the systematic organization of documents.
The scope of the research is extensive, with manuscripts sourced from both subscription-based scientific repositories, such as Scopus, Web of Science, and IEEE Xplore, and open-access repositories accessed via API (e.g., arXiv). Additionally, specific search criteria, including impact factor (IF), open access (OA) status, and JCR journal classification, are incorporated into the approach. These criteria are considered indicative but not exhaustive.
1.4. Framework
The methodological steps involved in the proposed framework to find and choose pertinent articles to build the SOTA are shown in
Figure 3. Defining the research problem and knowledge structure constitutes the initial step of our framework. This step establishes the criteria for selecting the
source words, which are essential components for conducting an organized bibliographic search.
The selection of source words should prioritize terms that capture the core semantics of the topic while avoiding ambiguous or overly generic words. The identification of source words and their synonyms includes (1) defining the problem and its scope, (2) identifying the key concepts of the problem, (3) selecting the main areas of knowledge and their subtopics, and (4) generating source words and synonyms for each subtopic.
The next step is the search for and gathering of scientific data, which is done in two complementary ways: automatically by using an Application Programming Interface (API) in the arXiv repository (
arXiv API Access, 2025) and manually by consulting a variety of specialized academic repositories. This two-pronged strategy ensures thorough and organized coverage of the study’s pertinent literature. The first research database, also known as the study population is then created, consisting, in our case, of 650 articles in total. The algorithm presented in his article is applied to the articles that comprise the initial database of the study to determine the documents that will comprise the study’s final database; simultaneously, a panel of experts conducts a validation process that is applied to a statistical sample that is chosen at random with a 90% confidence level. The
Score metric, which is a measure of precision and recall in the analysis of outcomes, is determined as a result of this validation. The procedure ends with the selection of papers deemed relevant, which serve as a crucial foundation for the development of the SOTA. In turn, papers that are deemed irrelevant or unrelated to the study’s goals are identified and discarded by the expert panel.
The proposed framework helps researchers in the selection of literature for the SOTA. The proposed algorithm is applied until the researcher has a collection of information that he considers important for his research, only by searching in scientific repositories, without reading each article in depth. A technical sheet is then prepared in table format, usually in Excel, which includes columns for the title and abstract of each article. The algorithm performs specific source word searches in the abstracts listed in the table, recording the rows in which such words are found. This procedure is repeated with all the defined source words, and the algorithm generates a summary with the source words found in each article. The texts selected as part of the SOTA are those with the highest number of source-word matches, allowing the user to decide the selection threshold.
The proposed algorithm significantly facilitates the identification of the SOTA by addressing challenges such as identifying synonyms or abstract terms related to the
source words, thee subjectivity of terms assigned by different people, and the time needed to identify relevant information. In our case of study, the algorithm was applied to develop a system that assesses wine quality based on the analysis of color. Based on the research objectives and expert opinion, five key areas were defined: structural equations, sensory analysis, food and beverages, colorimetry, and artificial intelligence. For each of these areas,
source words were established that the algorithm used to search in the abstracts of the selected articles. The employed methodology is further explained in
Section 2.
This manuscript is organized as follows.
Section 1 provides a review of the SOTA and a presentation of our framework.
Section 2 presents the methodology of the framework, whose results of application to a case study are presented in
Section 3. Finally, the conclusions, limitations, and future work are described in
Section 5.
3. Results
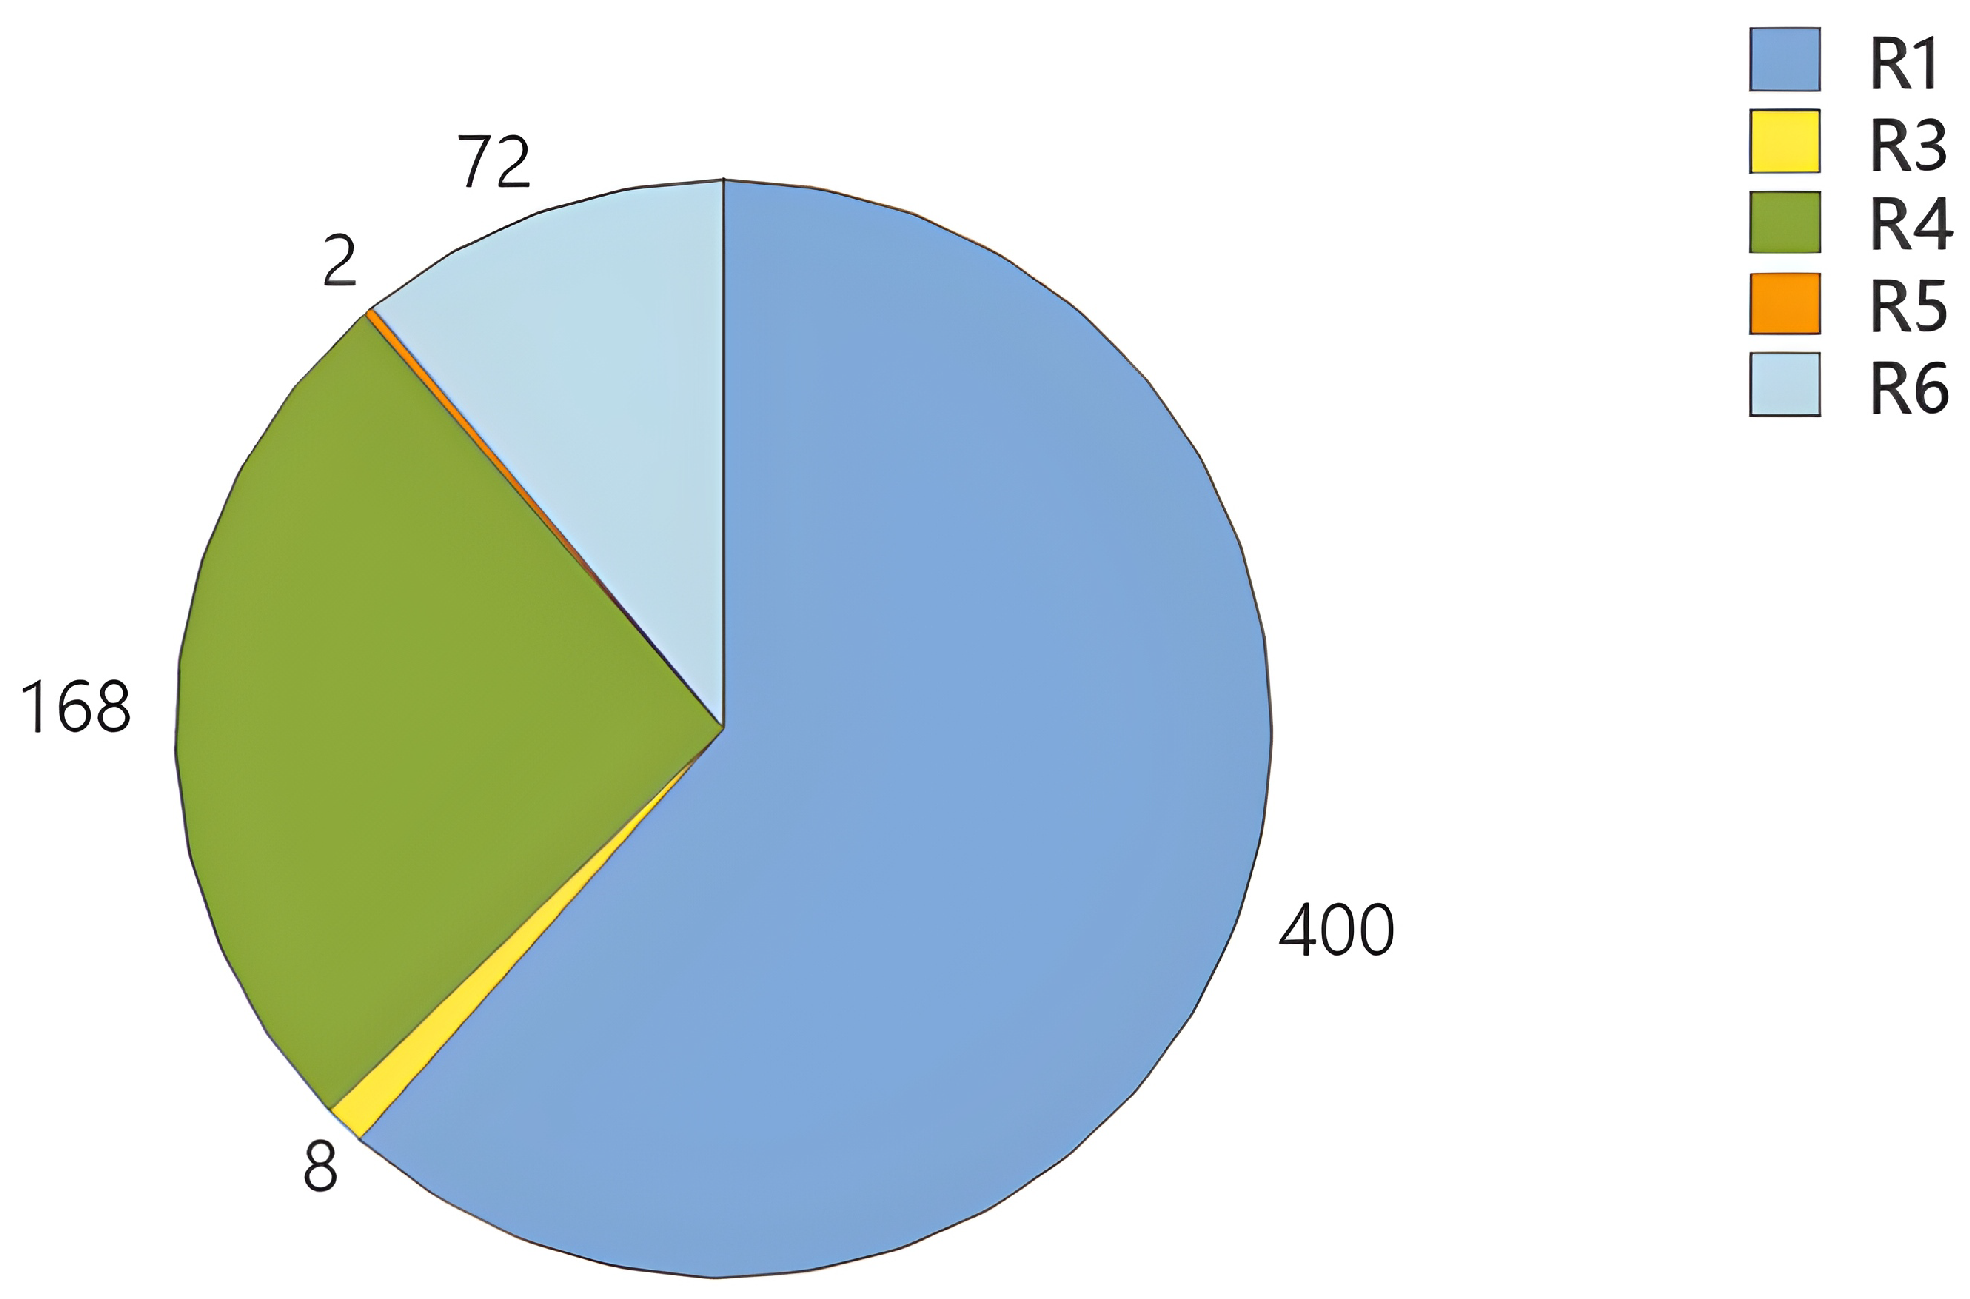
After searching for
source words using the Algorithm 1, they were related to each classification rule as shown in
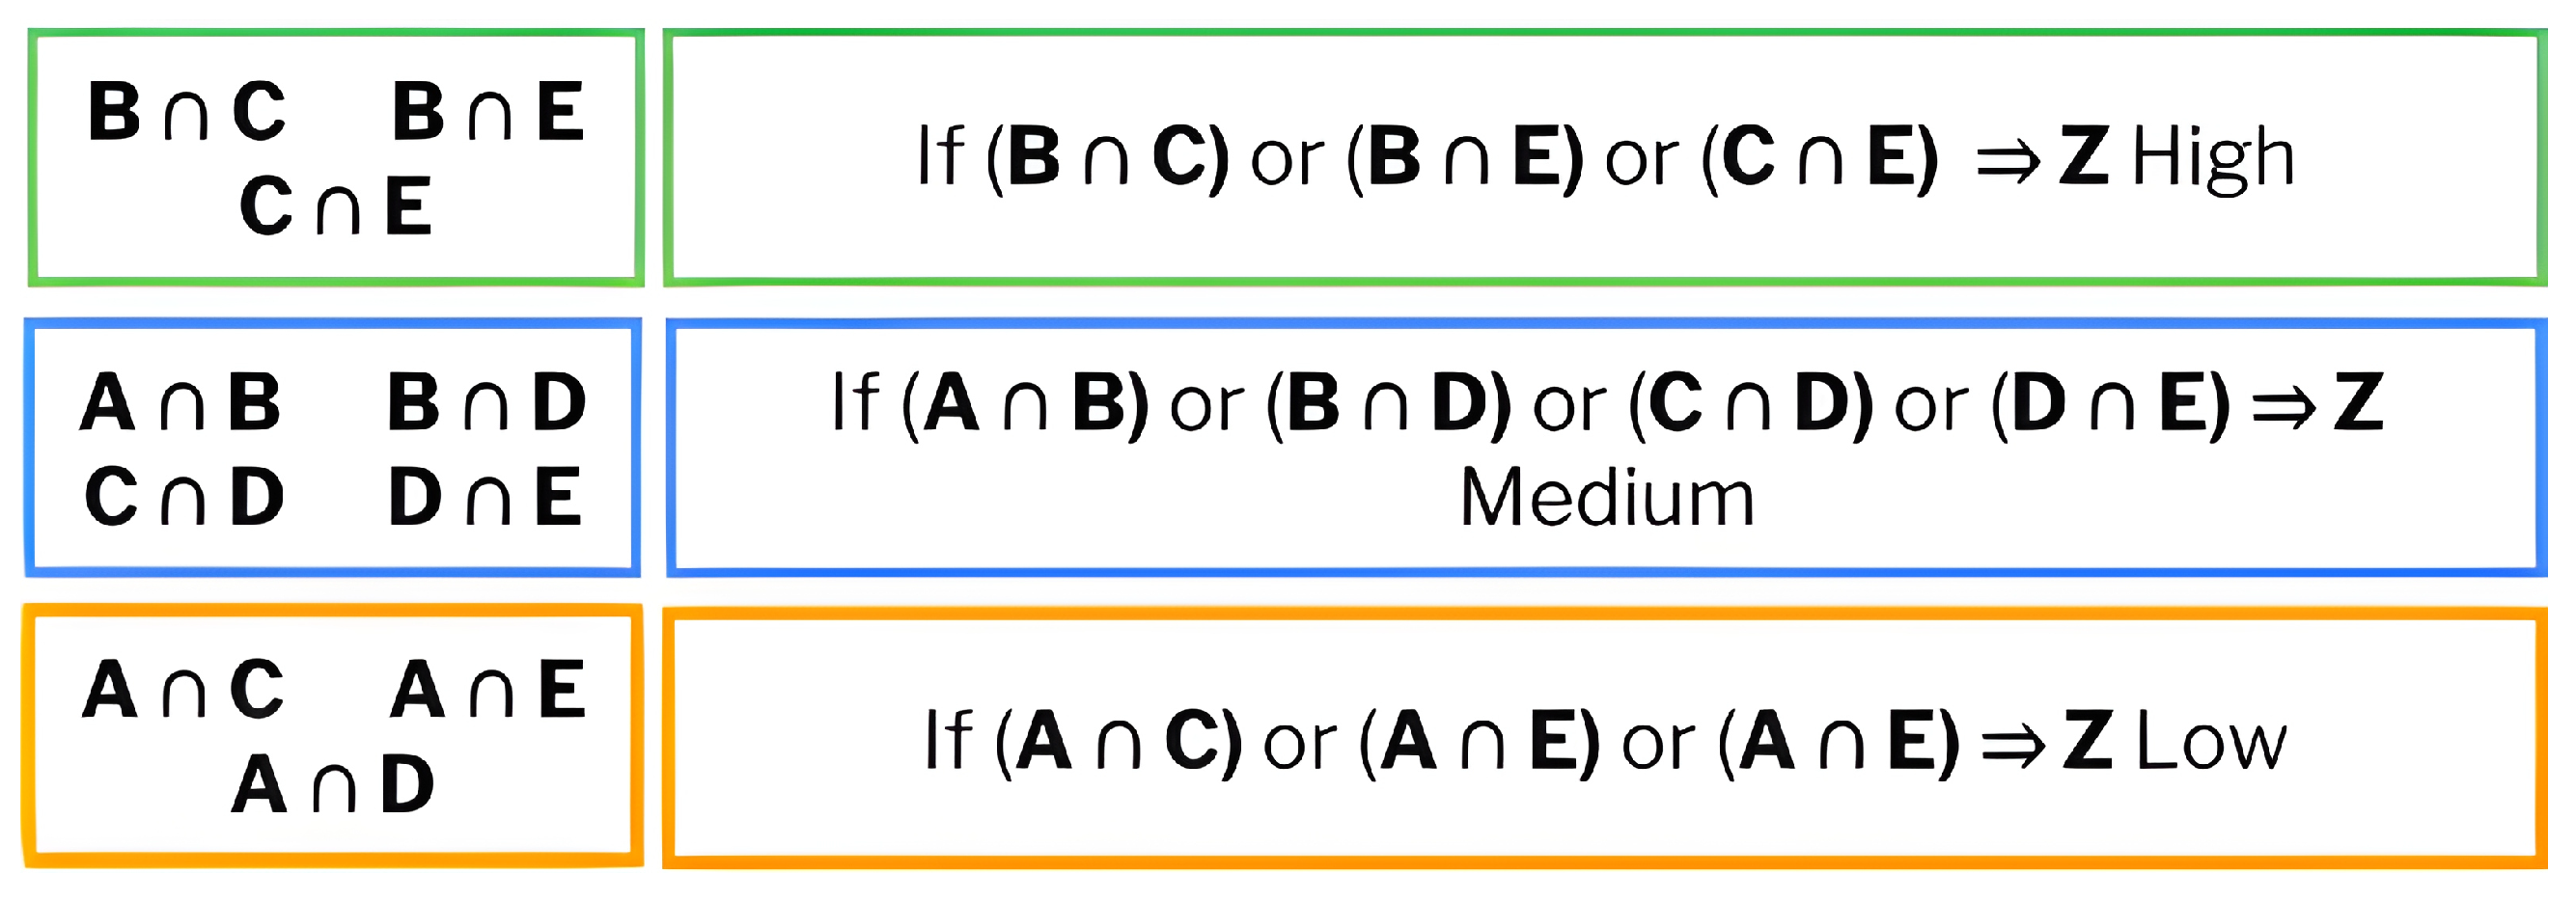
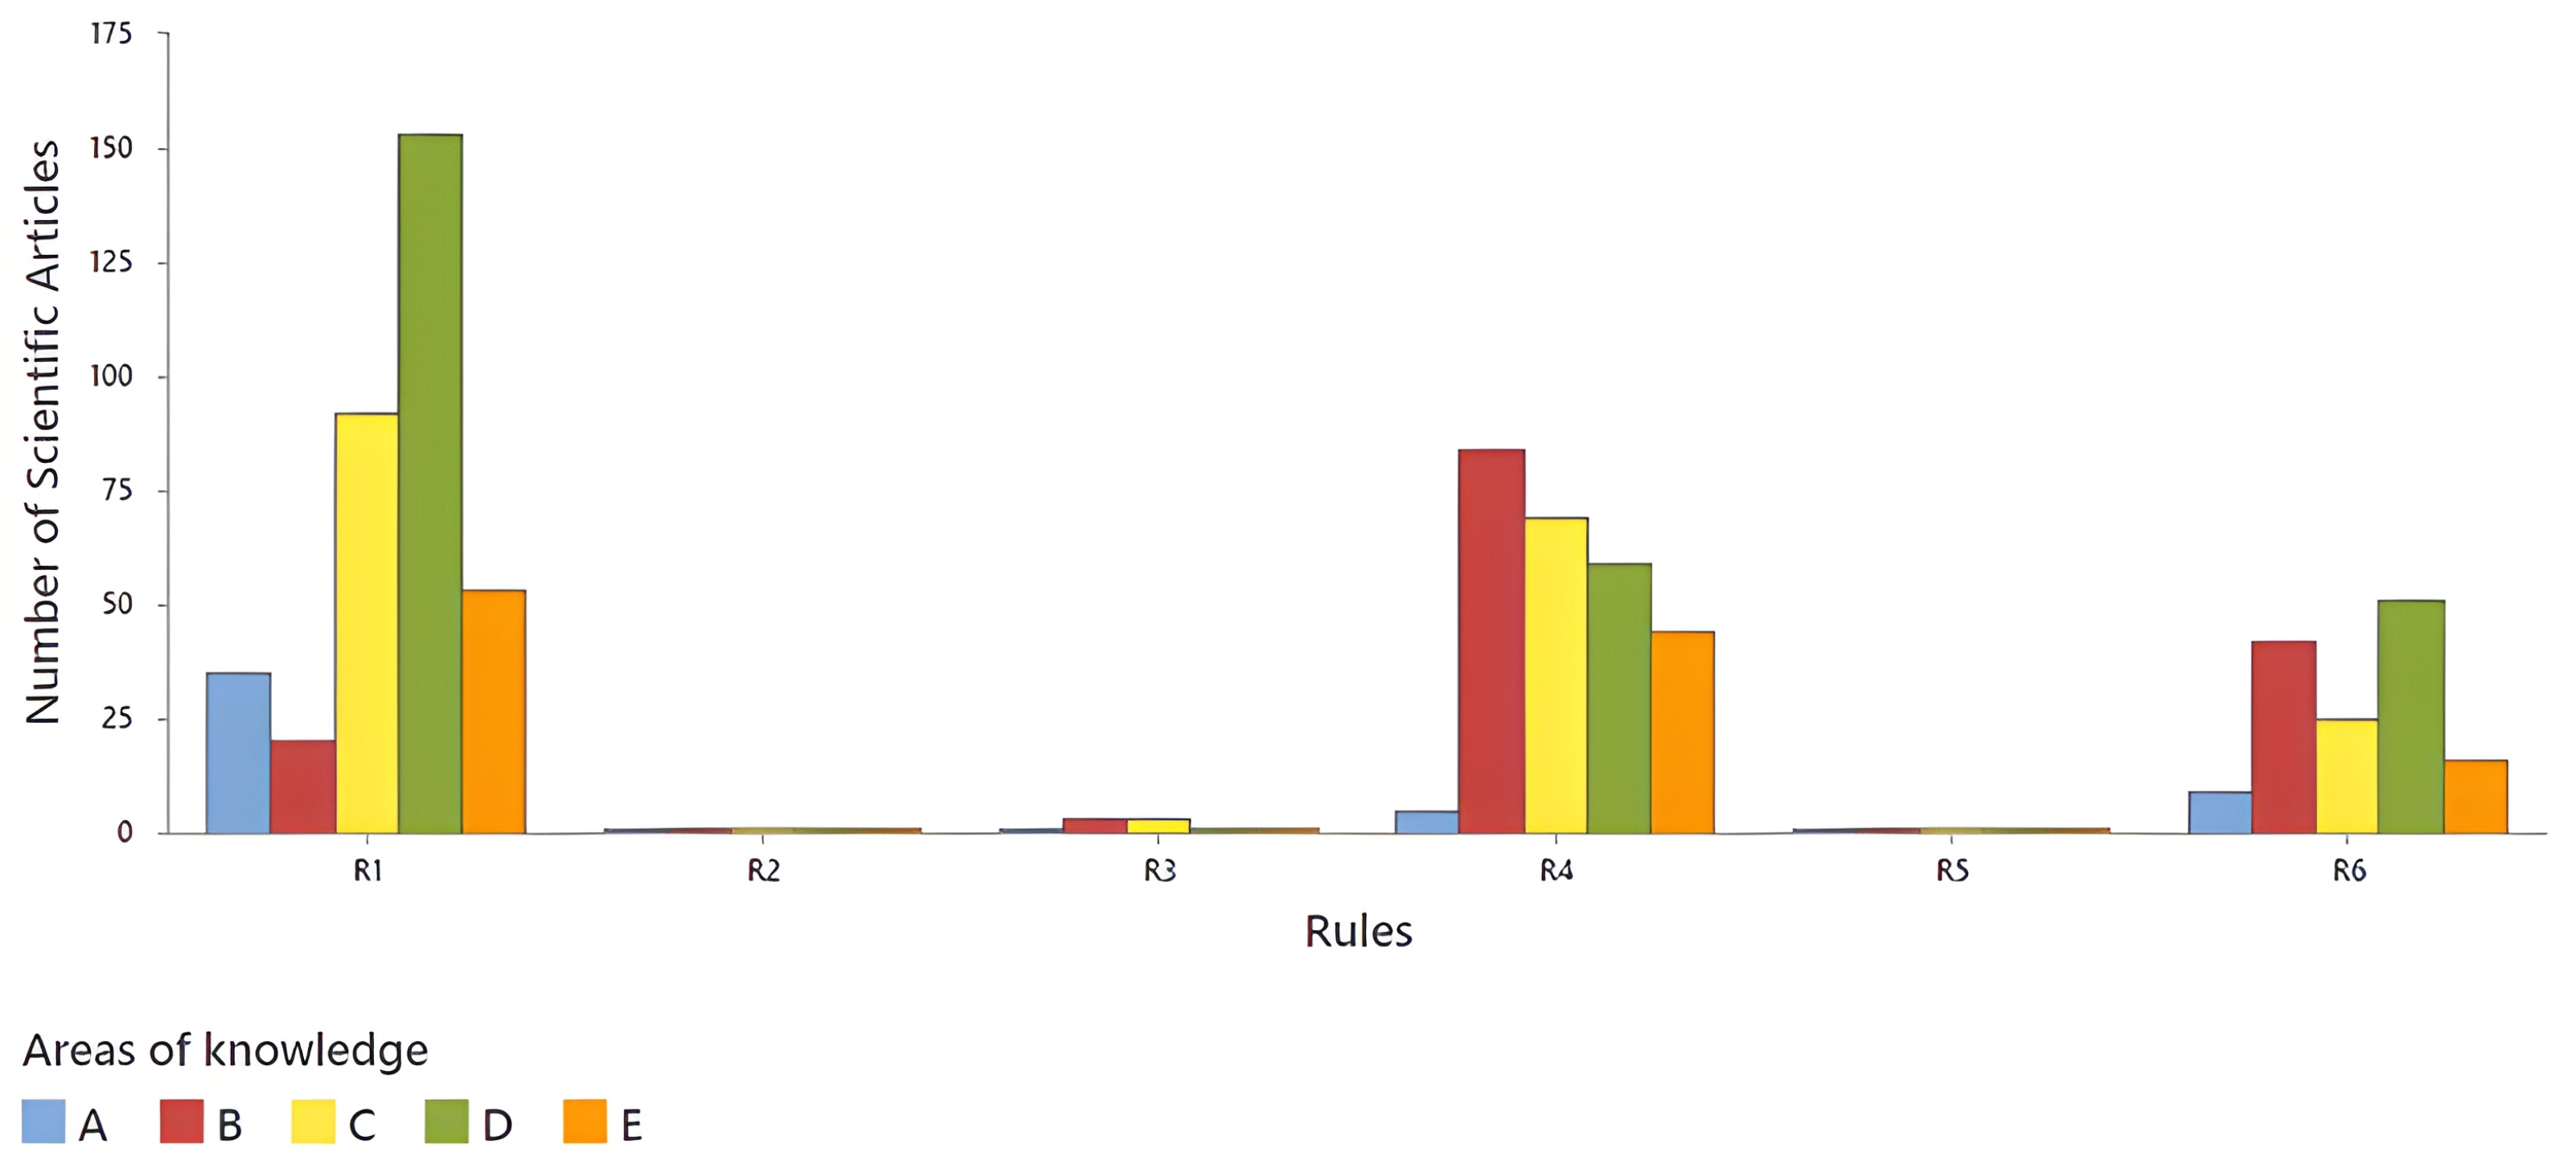
Figure 7, where the distribution of the number of scientific articles according to the classification rules (R1 to R6) and areas of knowledge (A, B, C, D, and E) is shown.
Each area of knowledge is represented by a color: structural equations (A) in blue, sensory analysis (B) in red, food and beverages (C) in yellow, colorimetry (d) in green, and artificial intelligence (E) in orange.
For an article to be relevant to this research, it must cover three knowledge areas. It is important to note that in some cases, several source words belonging to the same area were found in the same article, suggesting a closer relationship with the research topic. It can be observed that rules R1 and R5 presented the highest number of articles, while R2, R3, and R4 presented very low values. In R1, area of knowledge “D” (green) dominates, with the highest number of articles, followed by “C” (yellow) and “E” (orange). These data indicate that certain rules concentrate scientific production in specific areas, while others present a lower number of articles in all categories.
The frequency of the appearance of
source words in each knowledge area was analyzed. The analysis was performed for each classification rule, starting with the evaluation of the articles contained in R1 (
Figure 8,
Figure 9,
Figure 10,
Figure 11 and
Figure 12 are presented in this paper as examples).
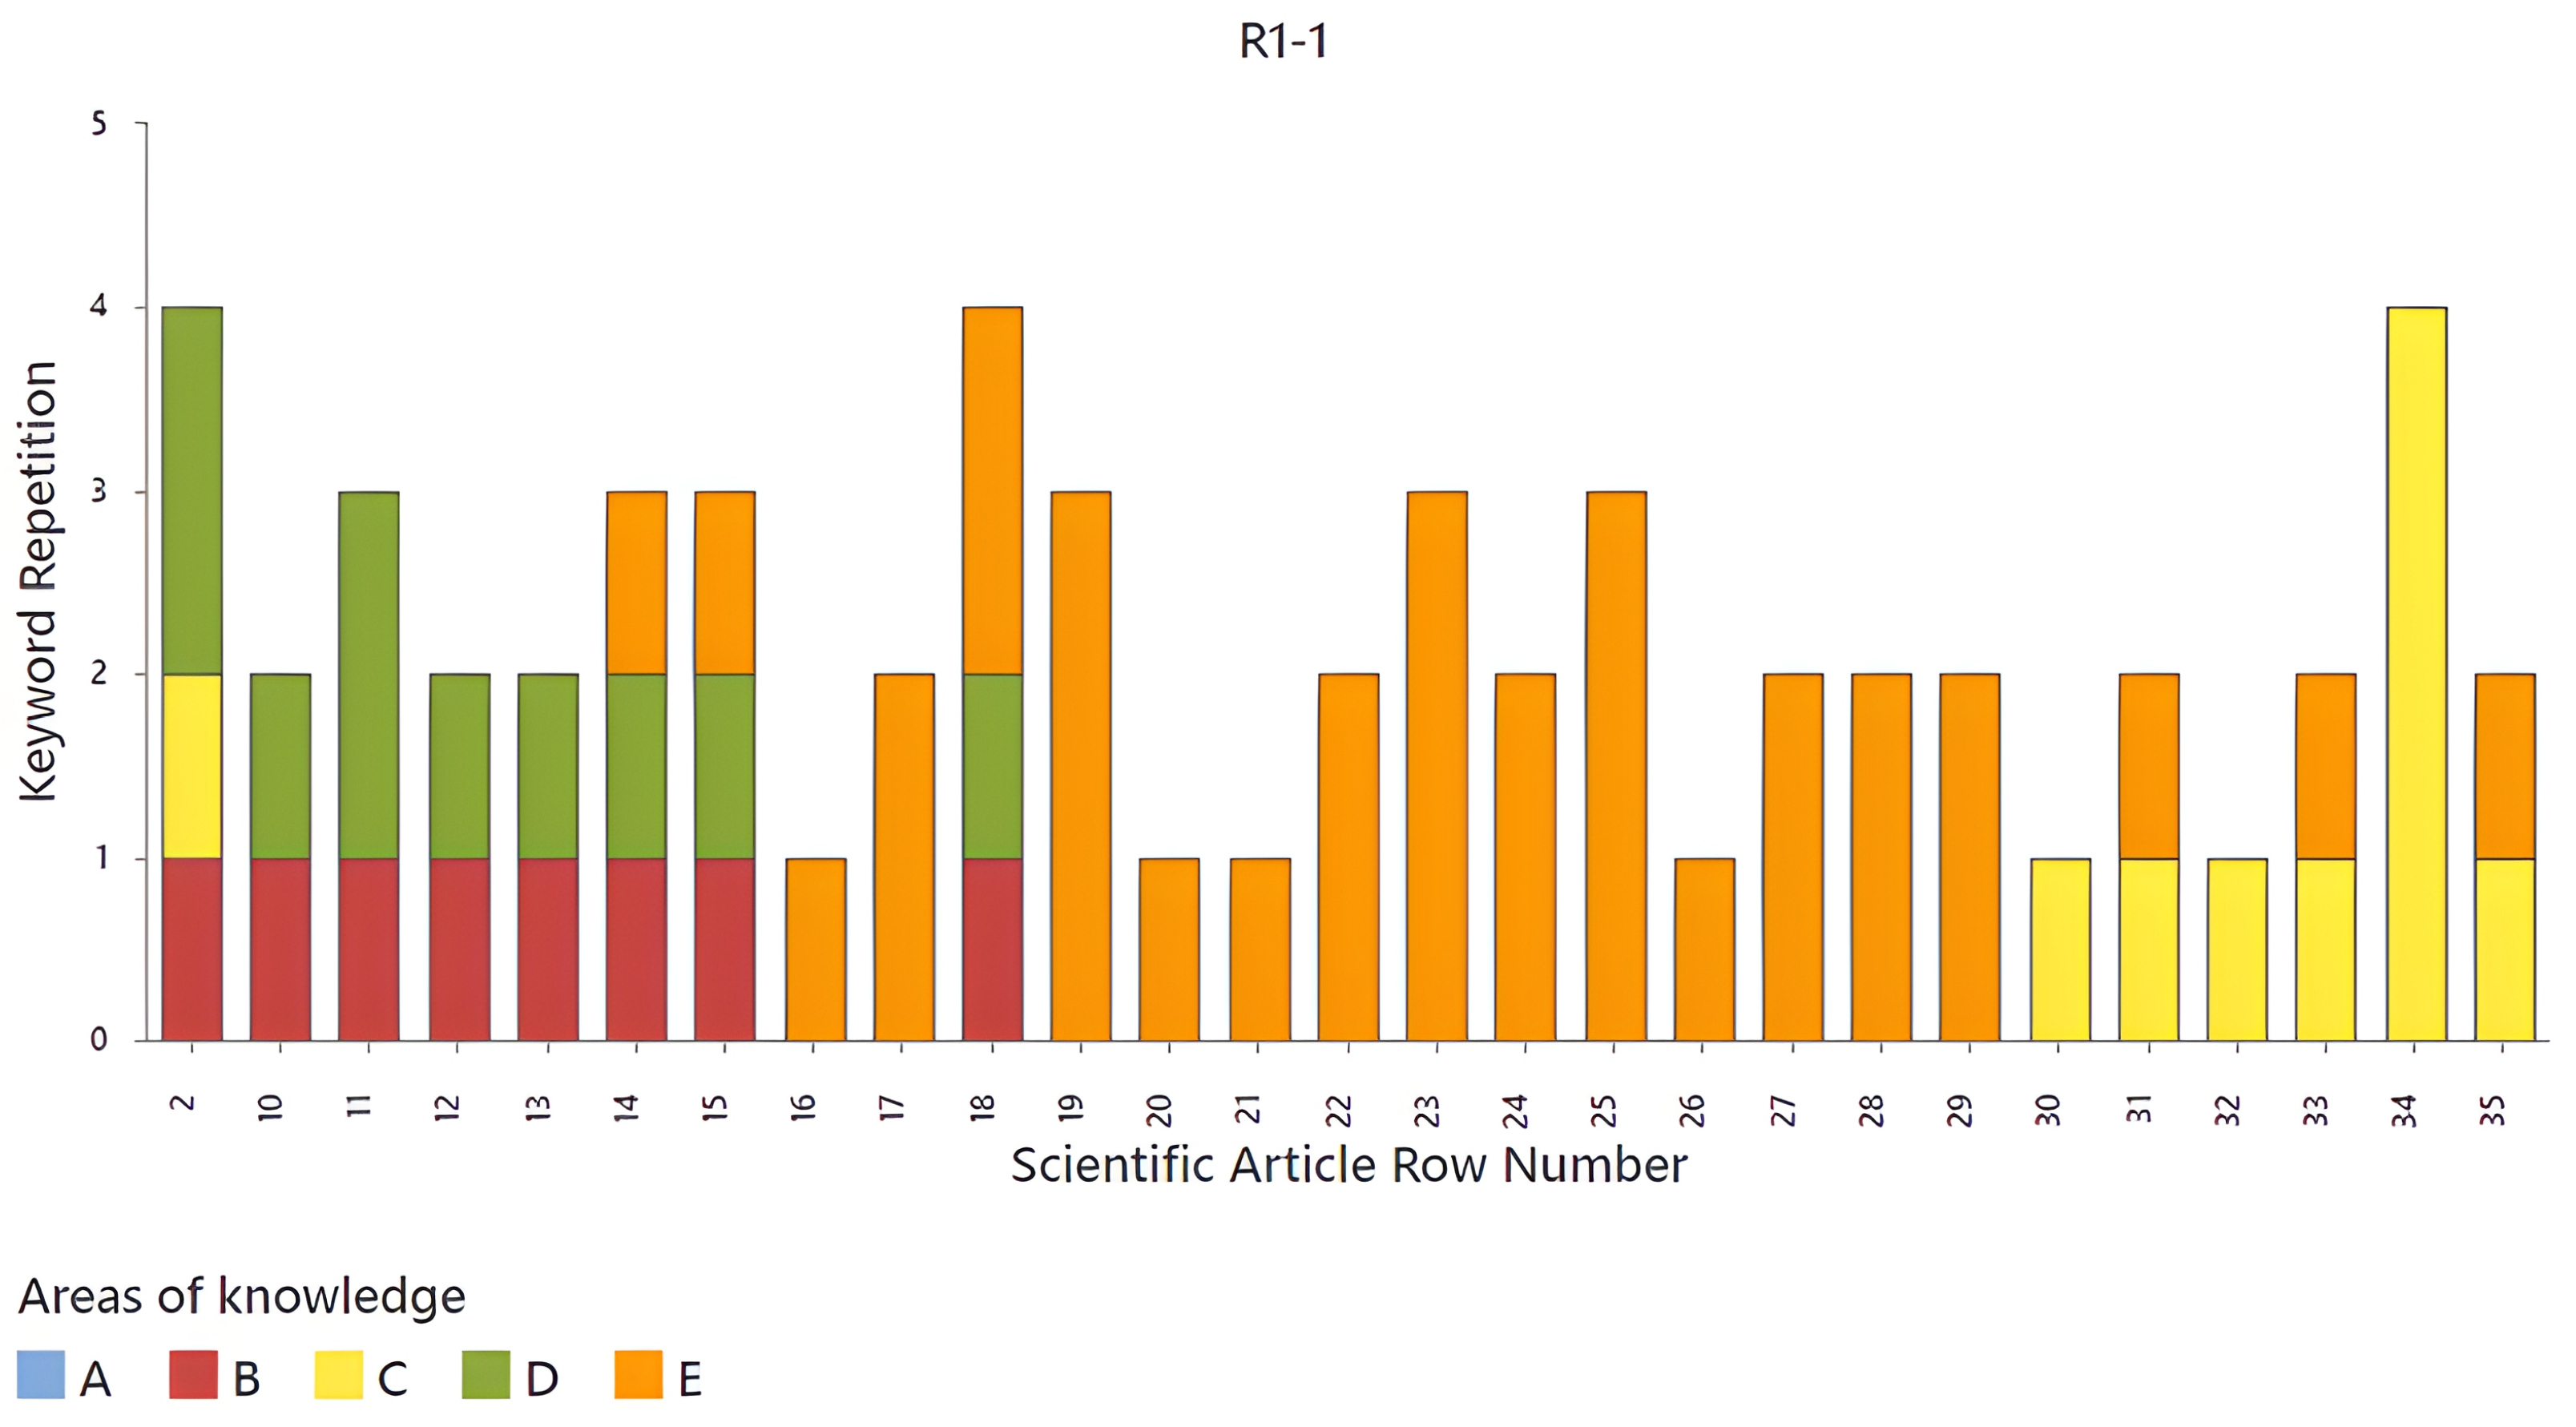
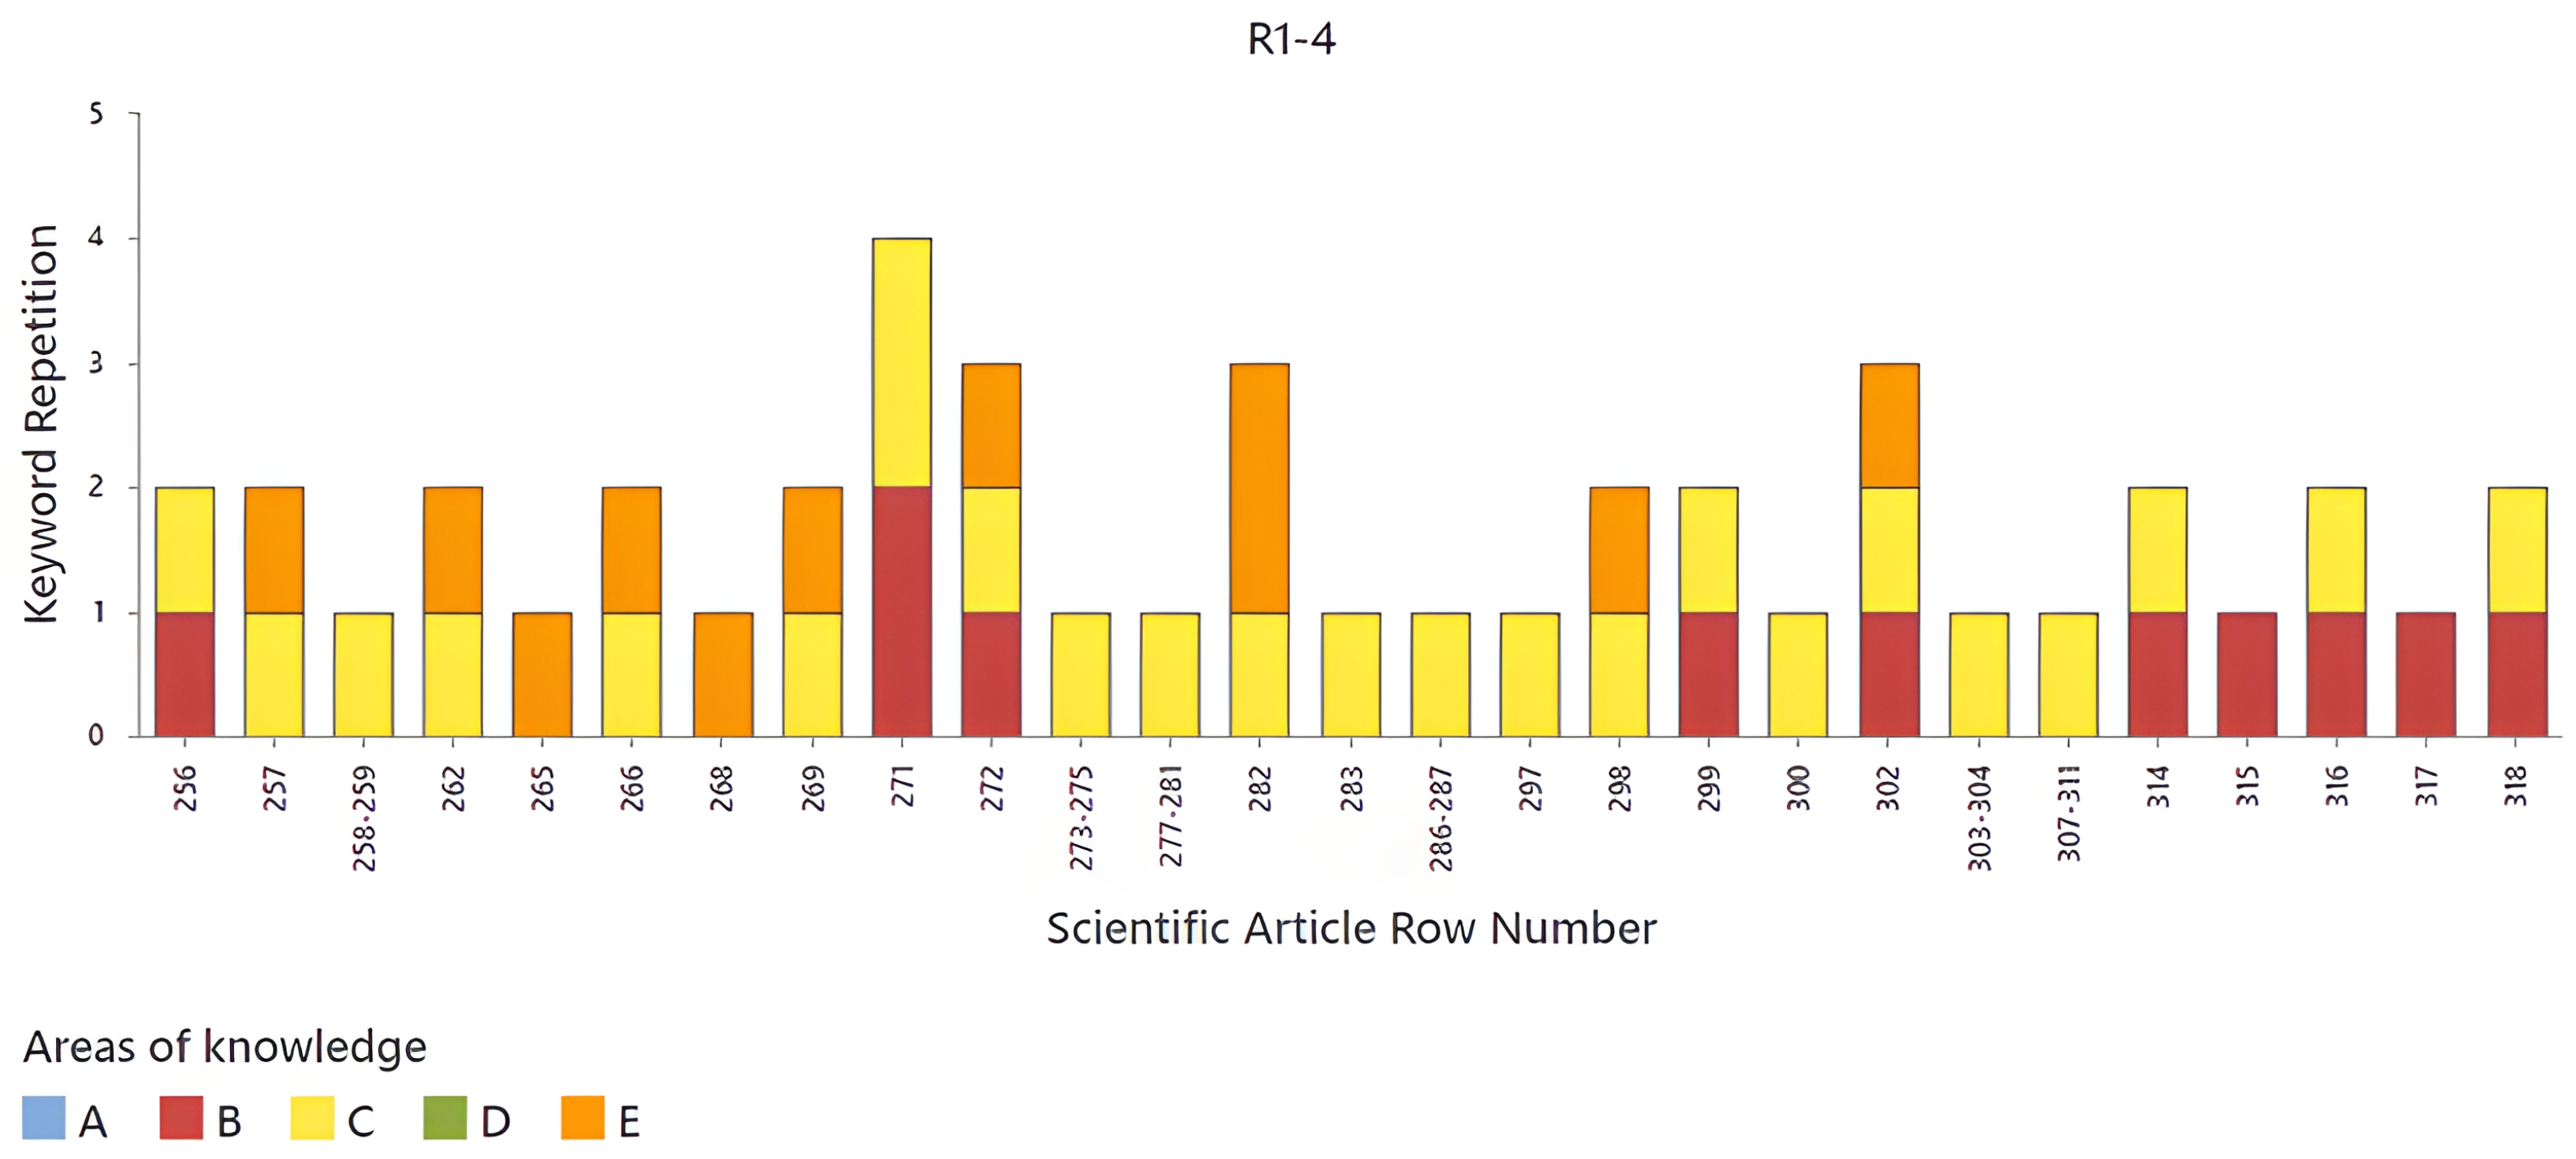
Figure 8,
Figure 9,
Figure 10,
Figure 11 and
Figure 12 show stacked bars displaying the repetition of
source words in different scientific articles, identified by their row number on the X-axis. Each bar represents an article and is segmented into five knowledge areas (A, B, C, D, and E), differentiated by colors. It can be observed that the frequency of
source-word repetition varies between articles, with some reaching up to four repetitions, while others have lower values. Knowledge areas D and E seem to be predominant in most articles, while C and B have lower levels of representation. Furthermore, it can be noticed that, in certain rows, such as 34 and 18, there is a higher concentration of
source words compared to others. This analysis allows for the identification of the distribution of
source words within articles according to the different knowledge areas, providing a structured view of the thematic classification in this dataset. The first article to highlight in
Figure 8 is located in row 2, since it covers knowledge areas B, C, and D. The next articles to highlight are those in rows 14, 15, and 18, which cover areas B, D, and E.
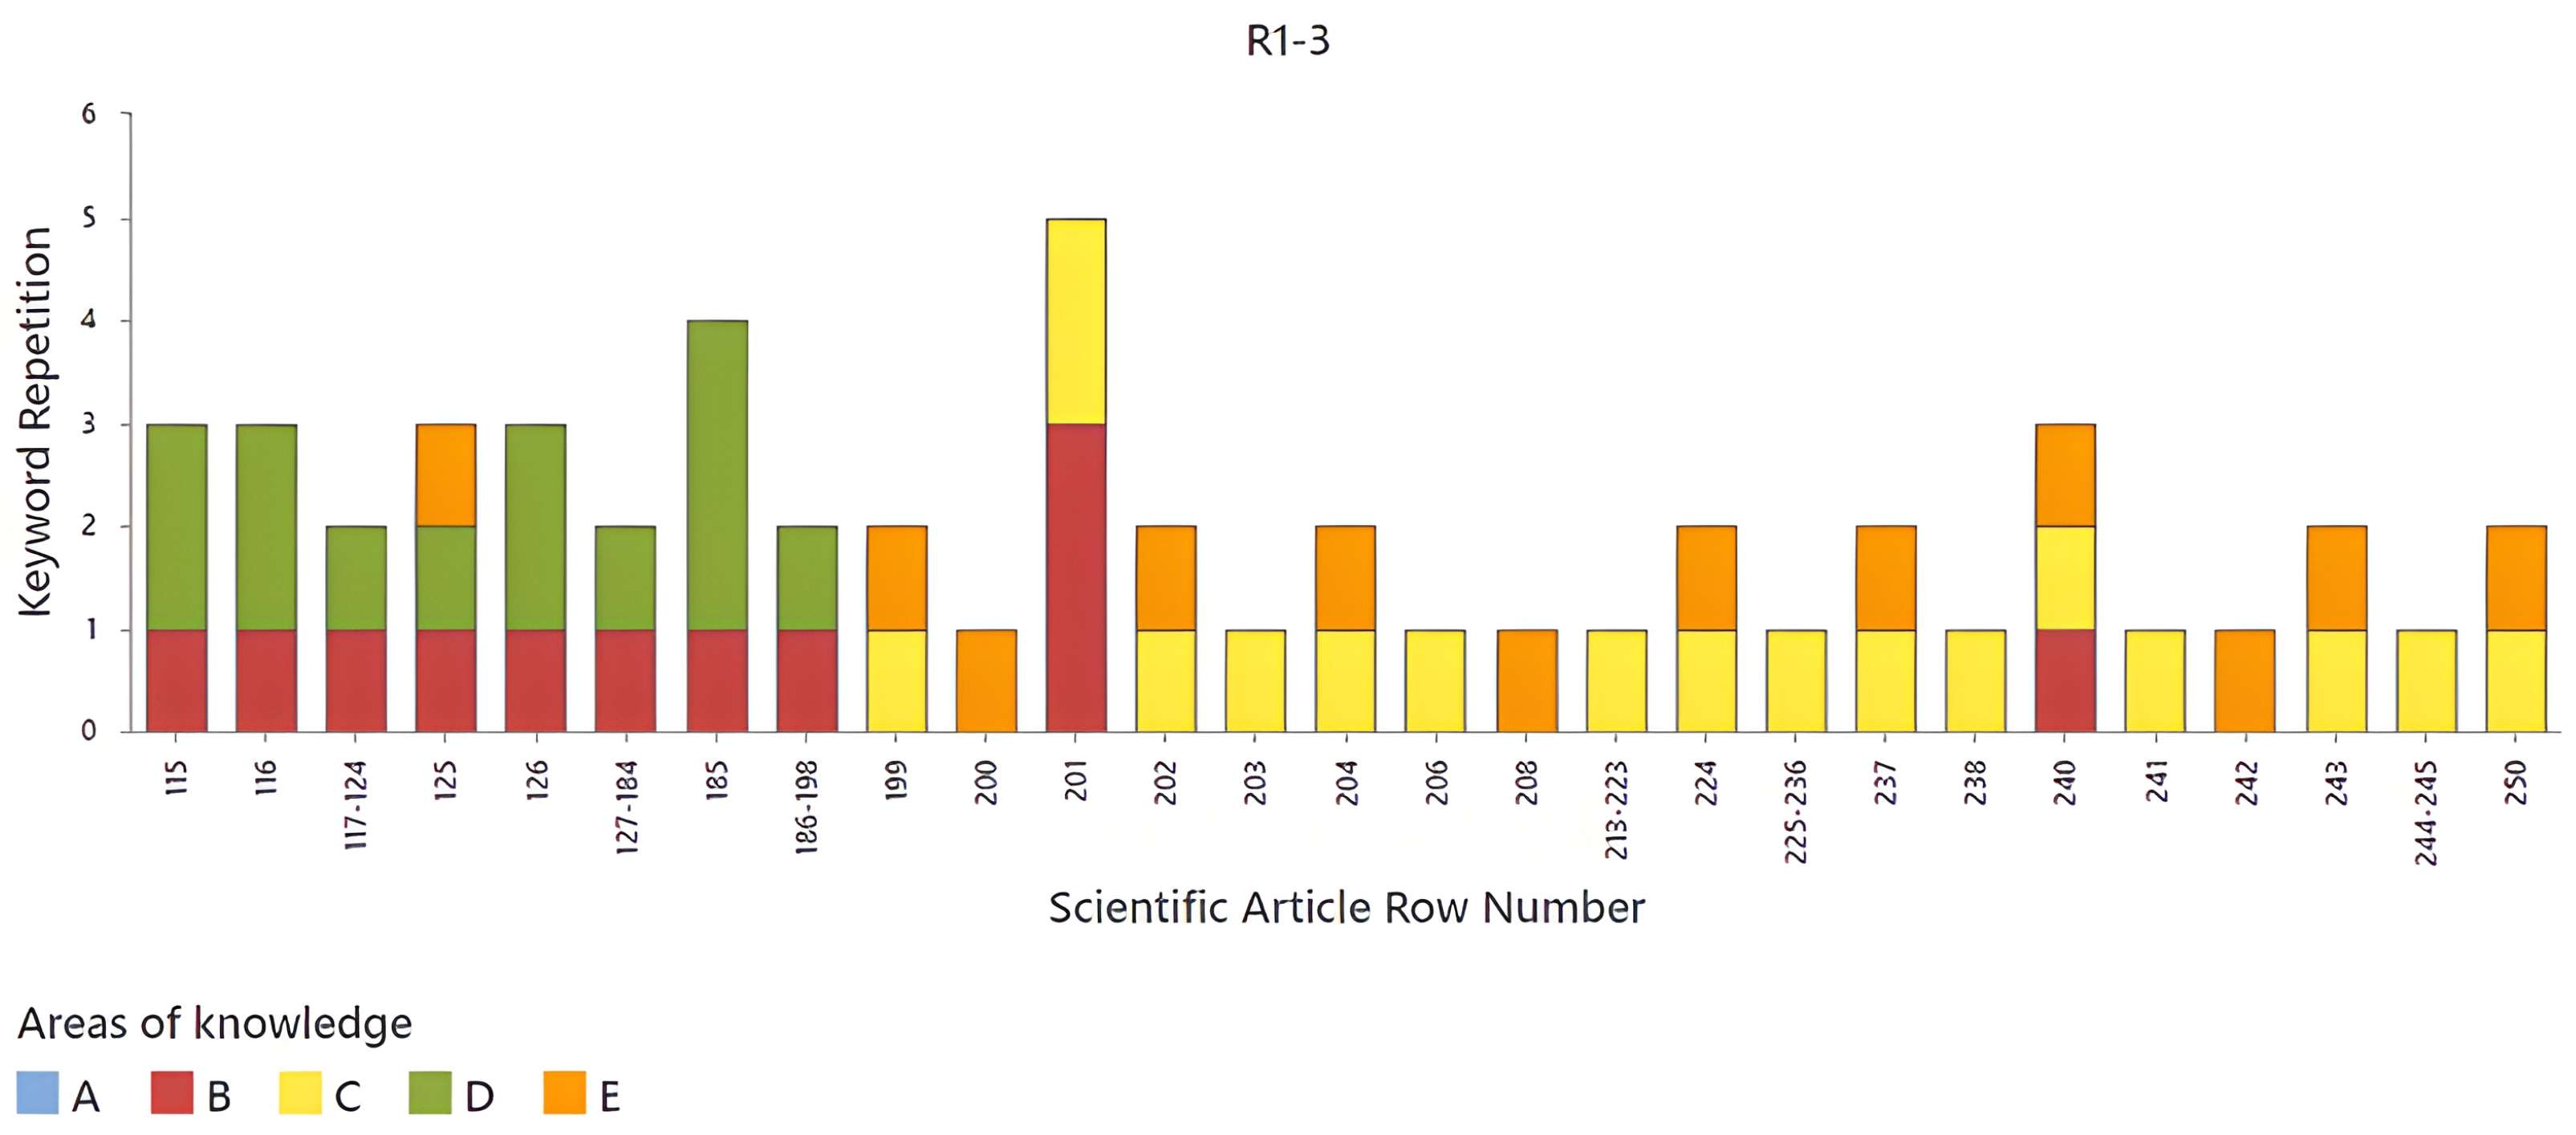
In
Figure 9 and
Figure 10, it can be observed that most of the articles present combinations of two knowledge areas. In
Figure 9, the most recurrent are C and E in the first half of the graph and B and D in the second half, and the opposite occurs for
Figure 10. The articles corresponding to rows 57, 81, 125, and 240 stand out, since they contain three knowledge areas simultaneously, suggesting a greater interdisciplinarity in these studies. The variability in the repetition of
source words and the combination of areas allow for the identification of trends in the thematic classification of the analyzed articles. In
Figure 11, it can be observed that most of the articles present combinations of three areas of knowledge (B, C, and E). The articles corresponding to rows 272 and 302 stand out, since they contain three areas of knowledge simultaneously, suggesting a greater interdisciplinarity in these studies. In
Figure 12, it can be observed that most of the articles are represented by area of knowledge A. However, in this dataset, no article stands out, since none presents three areas of knowledge.
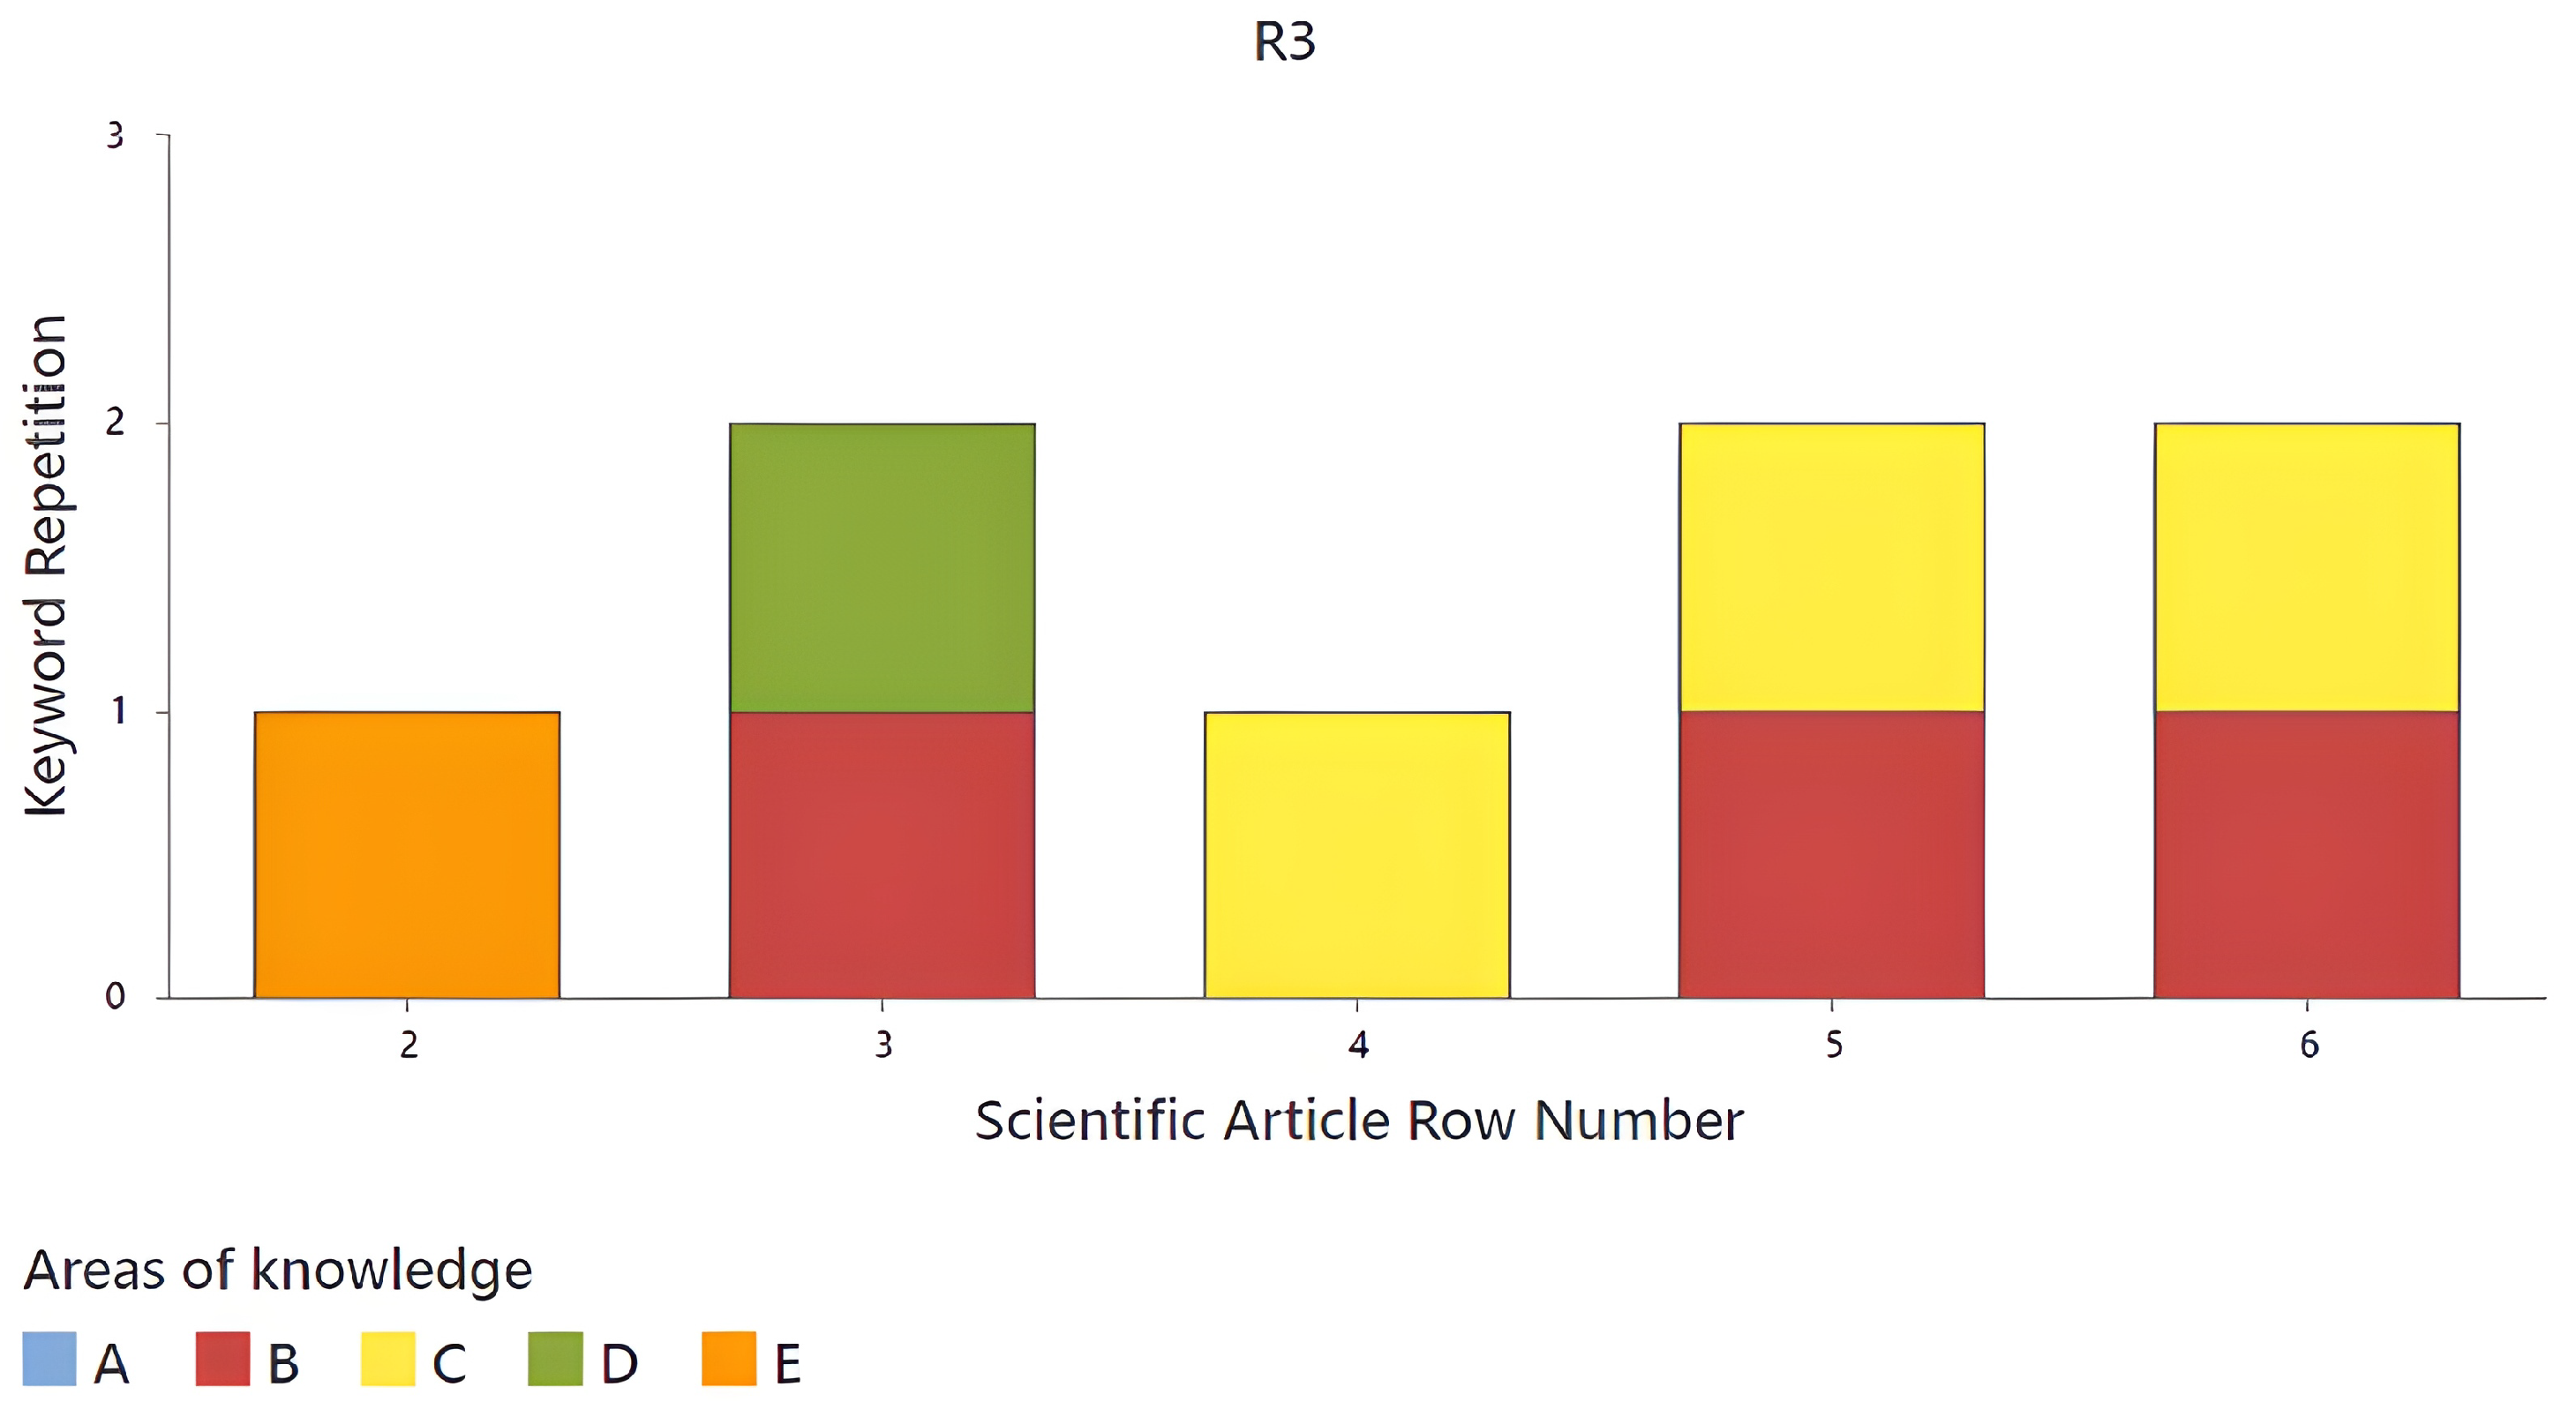
The second rule lacks information, as no article is found, so the next to be analyzed is R3 (
Figure 13). The content of articles for this rule is small, with only six in total. Of these, the following stand out: the article corresponding to row three, which presents
source words in areas B and D, and the articles in rows 5 and 6, which cover areas B and C, with a
source words in each. It is important to note that the most prominent knowledge area represented in this rule is sensory analysis (B). However, since these articles do not cover three knowledge areas, they are not considered important for this research.
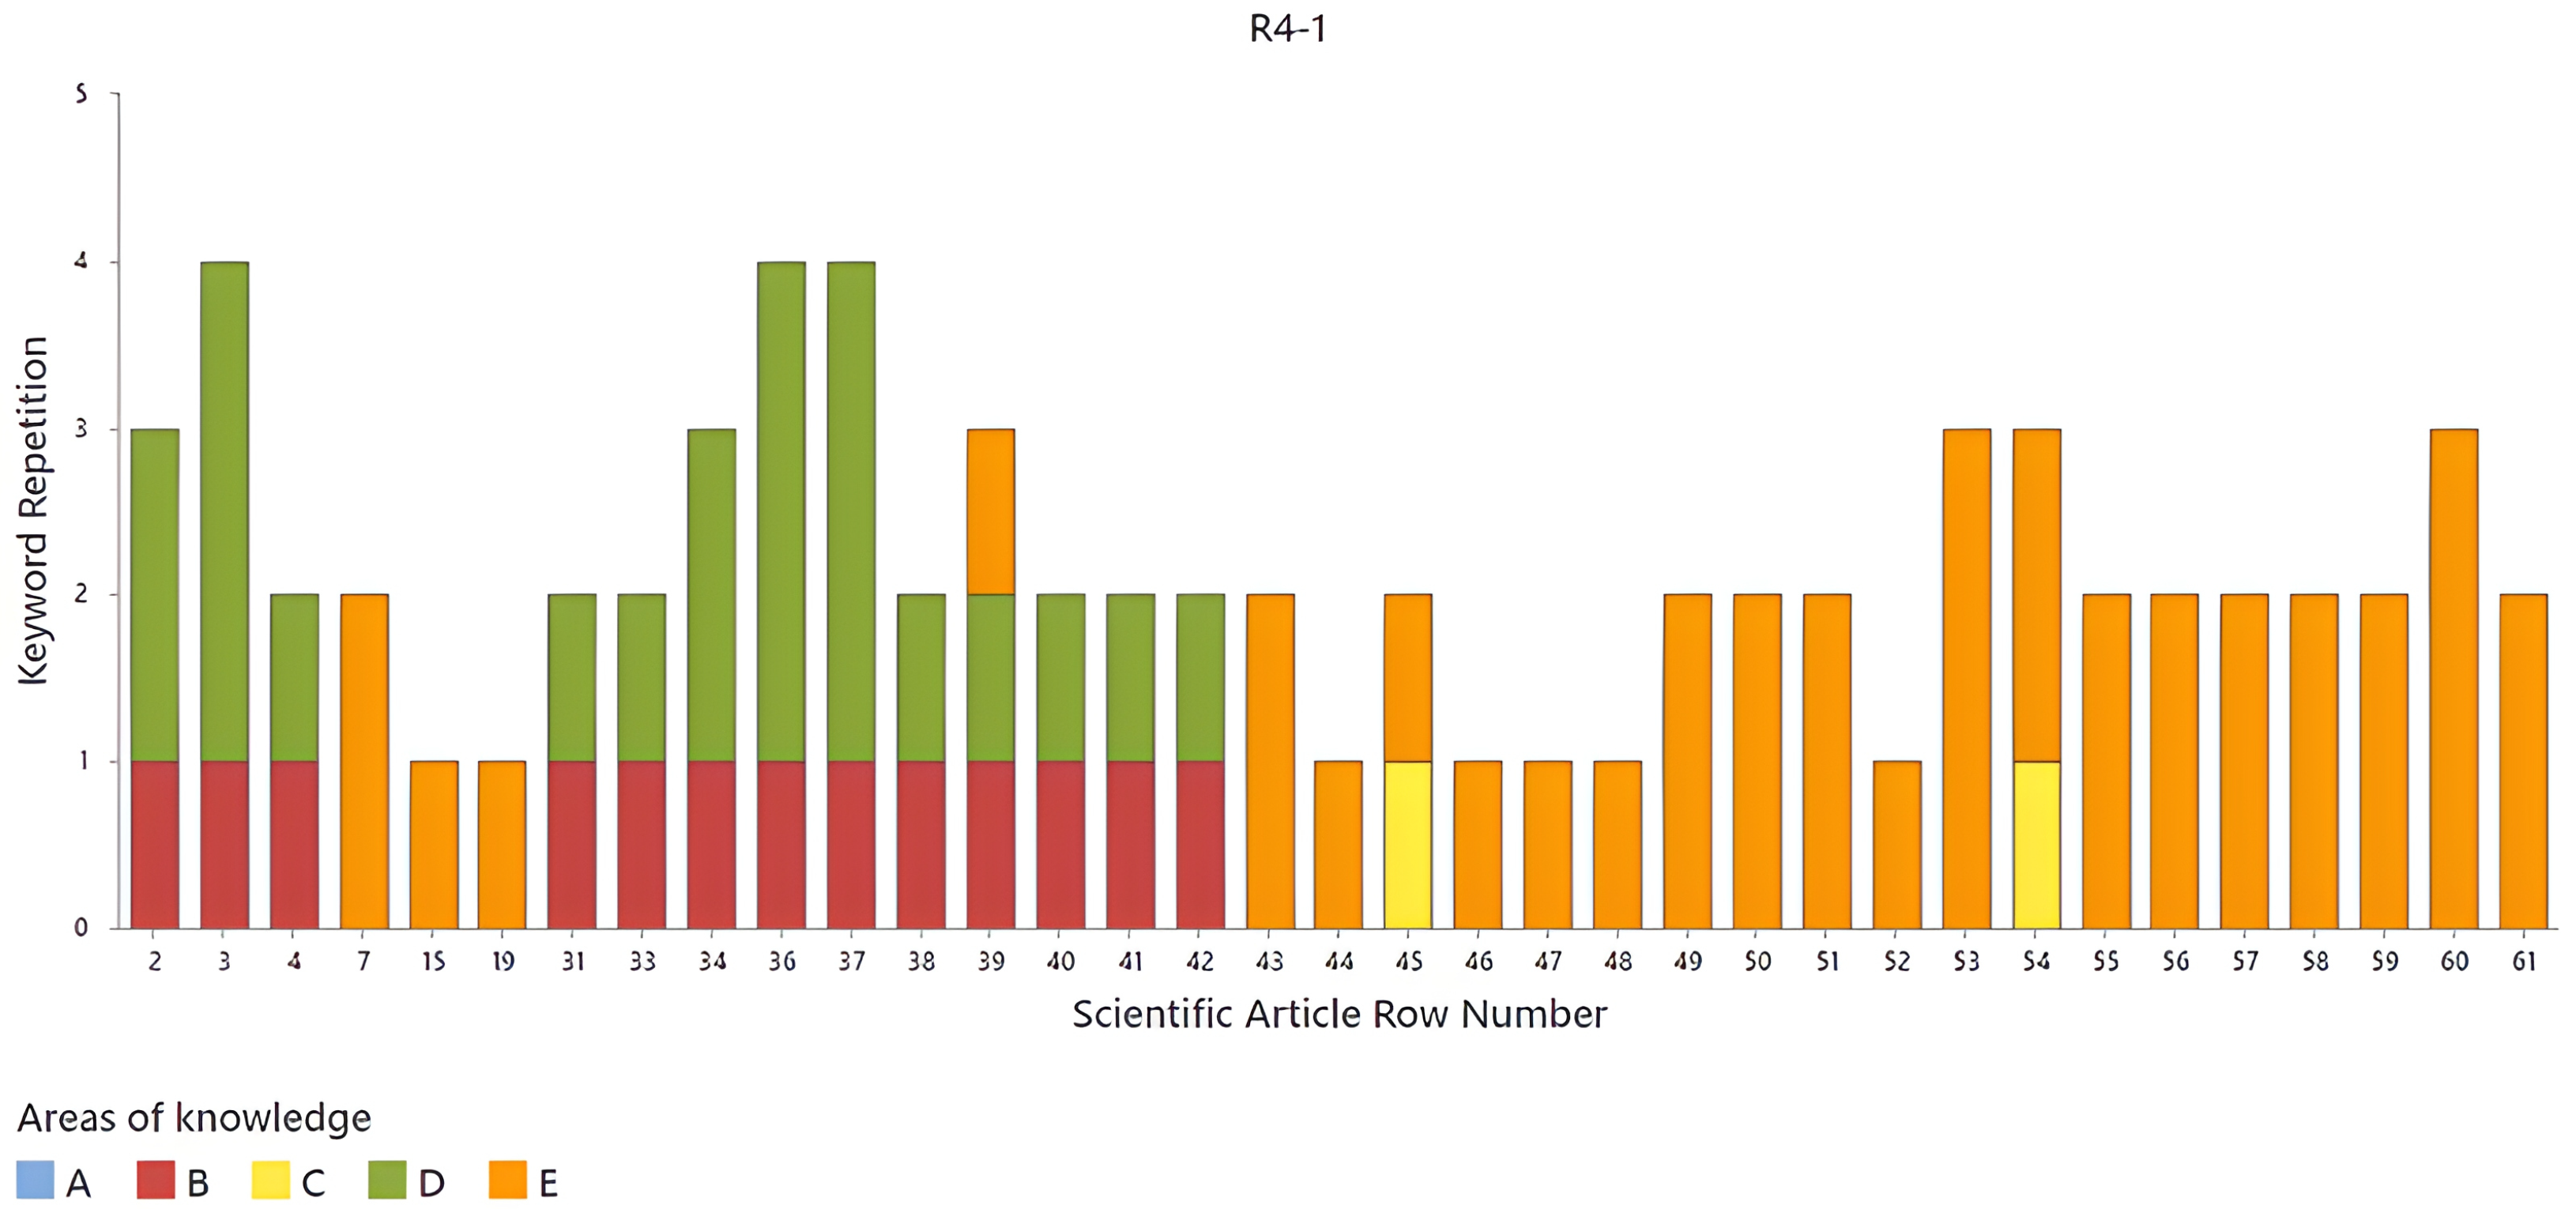
The next rule to be analyzed is R4. Most of the literature is found in this rule, so it is necessary to represent the analysis in three figures. The first set observed in
Figure 14 comprises articles presented between row 1 and row 61 of the Excel sheet. It is worth mentioning that the articles where no
source words was found are omitted. Among this set of articles, the one in row 39 stands out, with
source words in each of the three areas of knowledge—B, D, and E. Therefore, it is evident that in this set, the areas of knowledge are sensory analysis (B), colorimetry (D), and artificial intelligence (E).
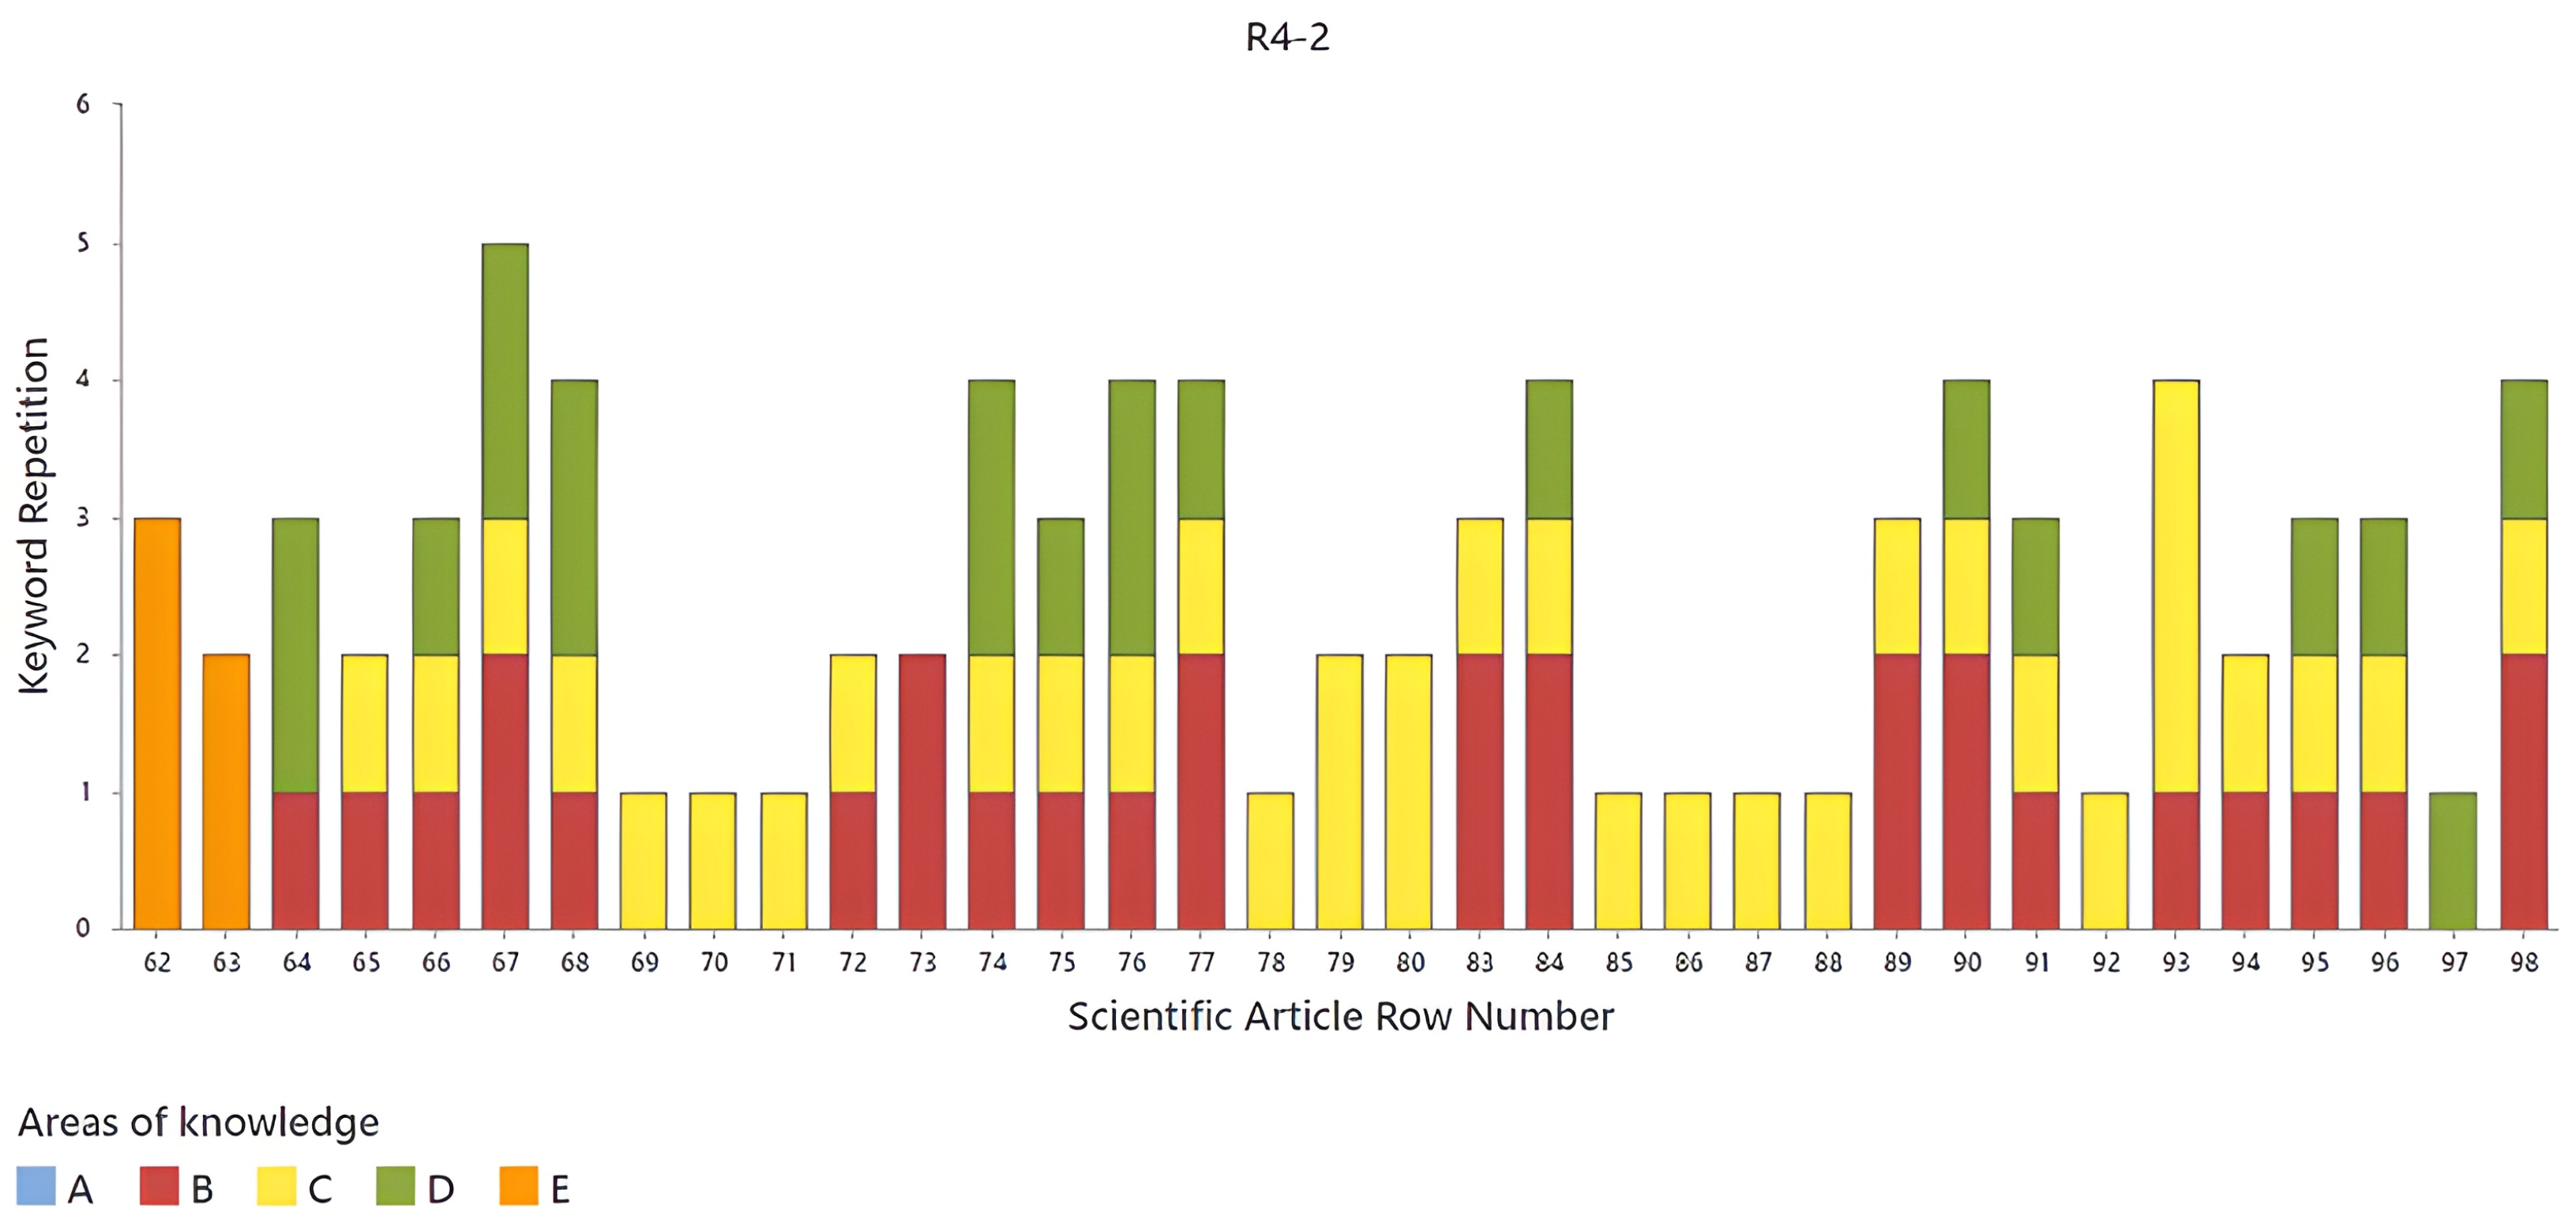
Continuing with the analysis of R4,
Figure 15 shows the second set of articles. This set includes the articles from row 62 to row 98. Likewise, the articles in which no
source words were found in the abstract are omitted. In this set, several articles stand out that encompass three areas of knowledge (B, C, and D). These articles are found in rows 66, 67, 68, 74, 75, 76, 77, 84, 90, 91, 95, 96, and 98. From this set, a total of thirteen important articles for the research were obtained, covering the areas of knowledge of sensory analysis (B), food and beverages (C), and colorimetry (D).
To conclude the analysis of R4,
Figure 16 shows the third cluster of articles. This cluster is represented by the articles from rows 99 to 135, omitting the articles where no
source words were found. It can be observed that most of the articles contained in this cluster cover three areas of knowledge. These areas of knowledge are the same as the for the previous cluster (B, C, and D). In addition, in this set of articles, there is one in row (134) that does not contain area of knowledge D; however, it does contain area of knowledge A, which corresponds to structural equations. This shows that the main topics are structural equations (A), sensory analysis (B), food and beverages (C), and colorimetry (D).
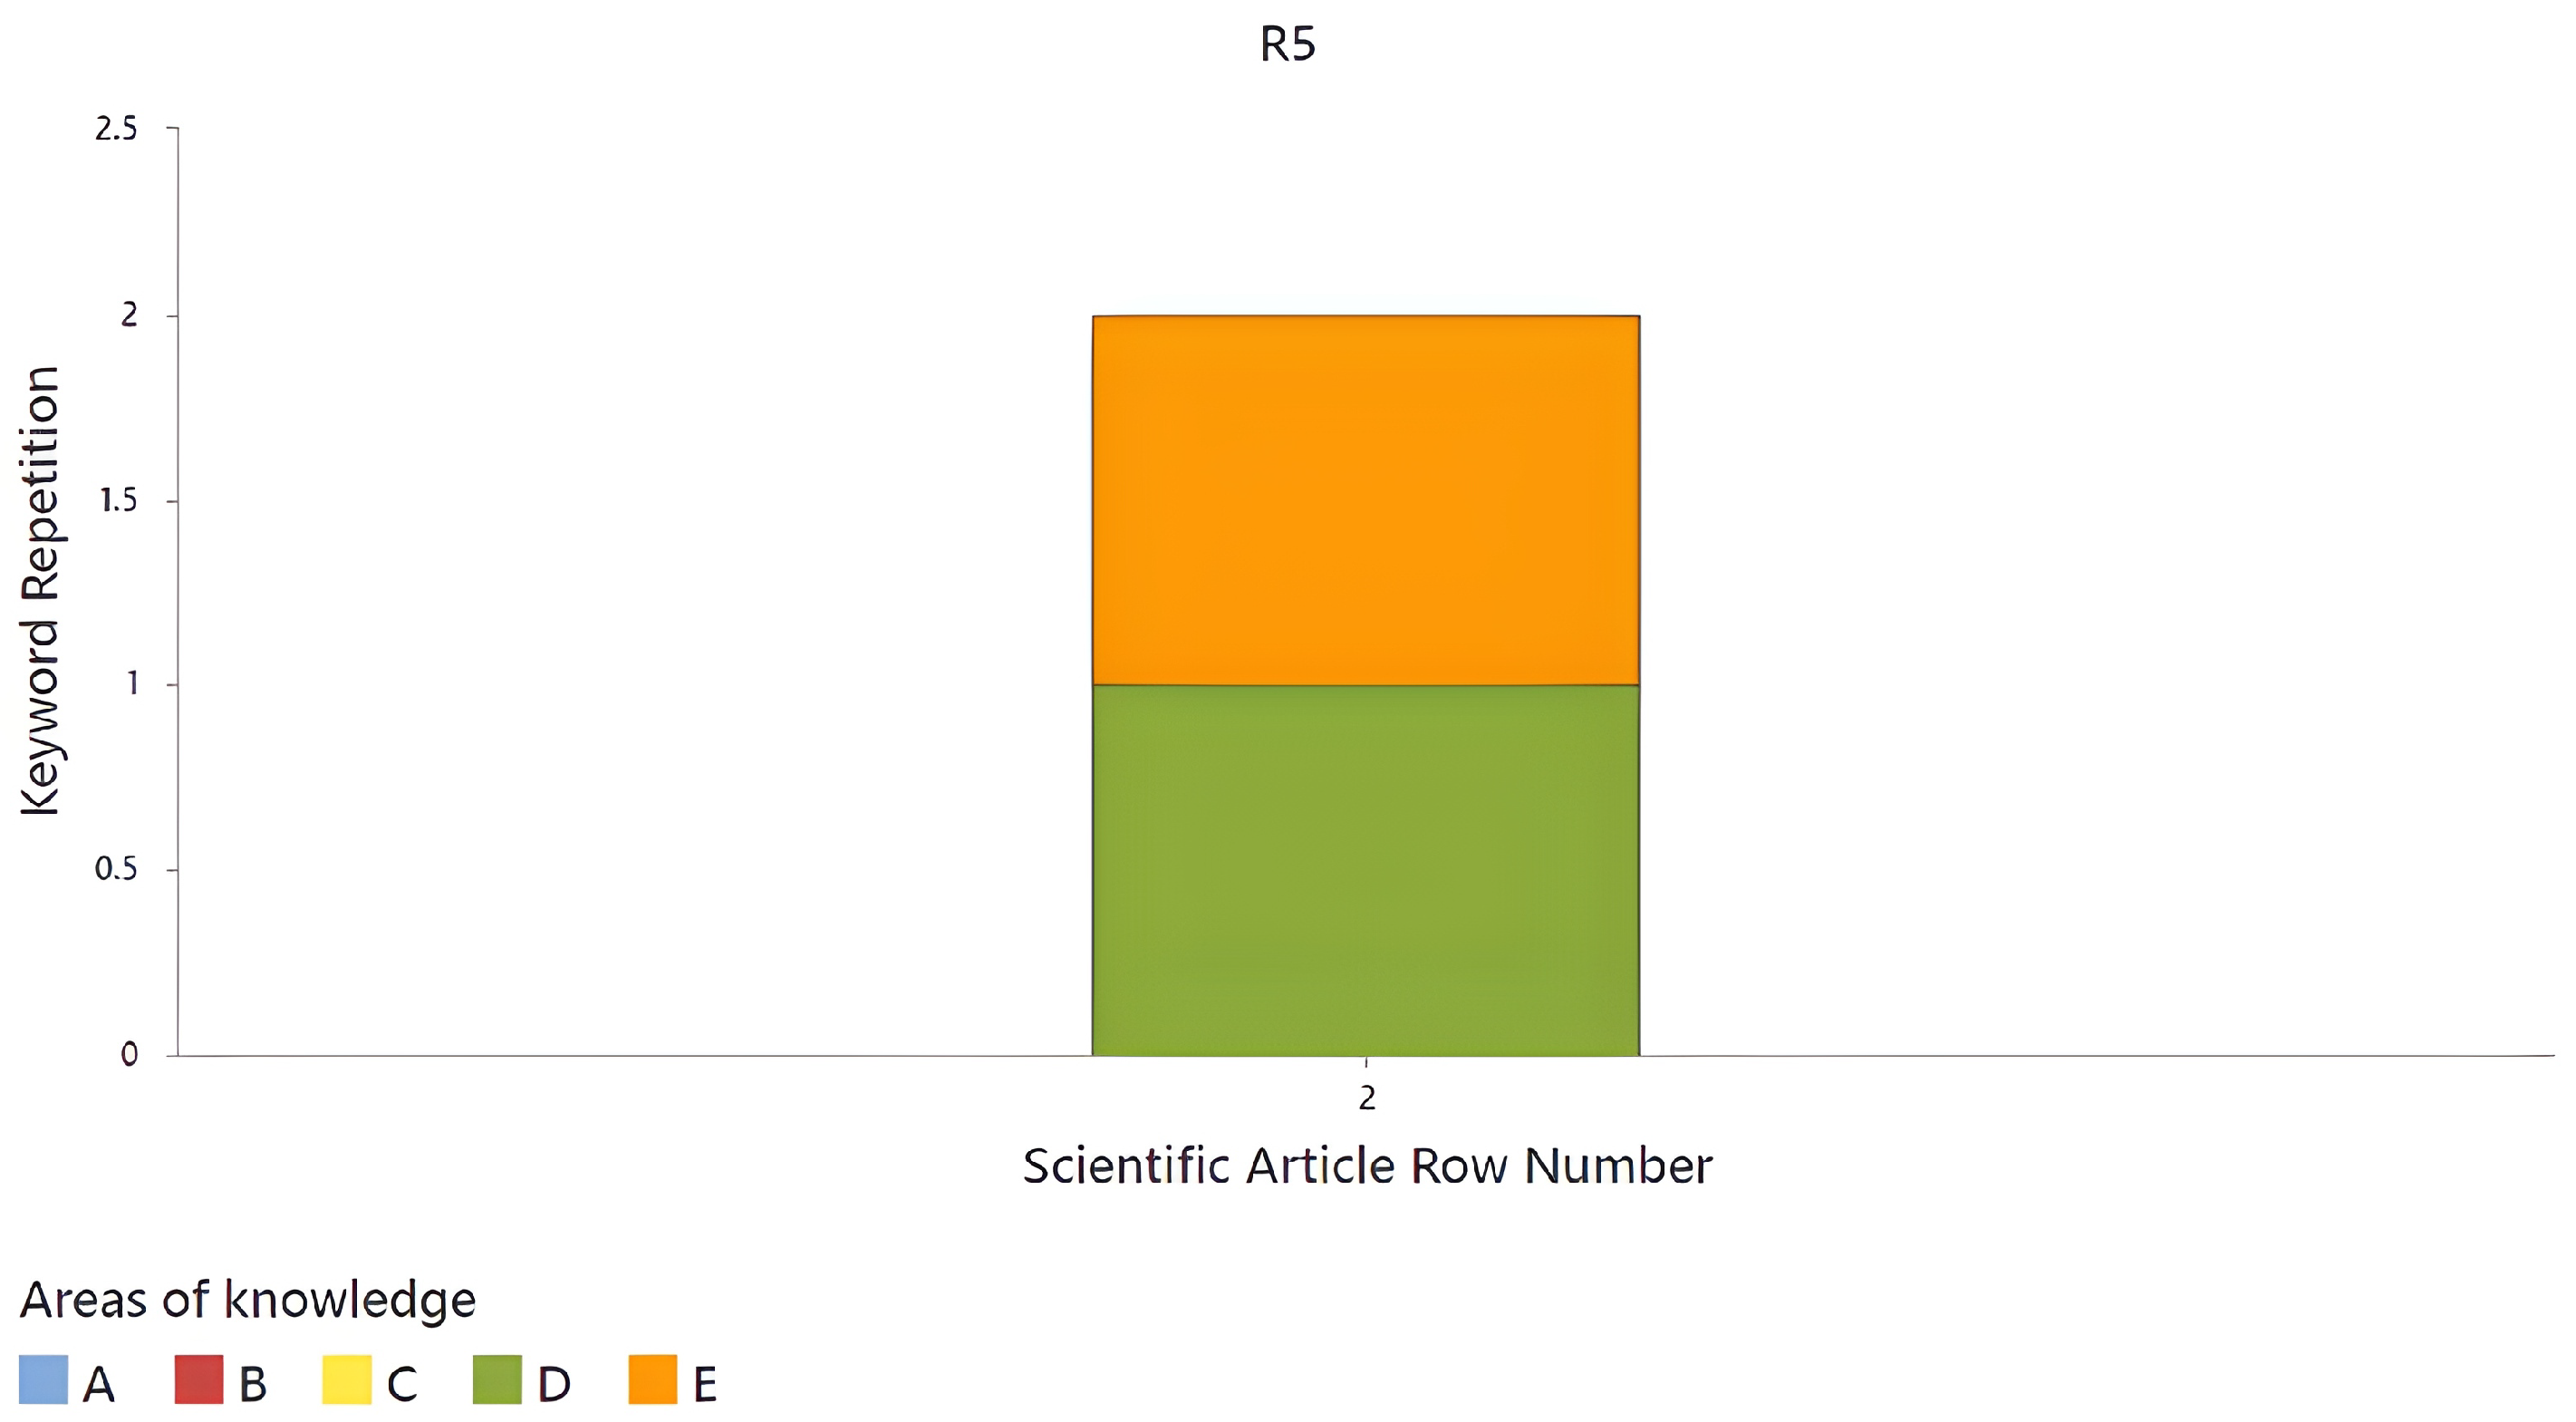
In the following rule (R5), there is only one article (
Figure 17), and the identified
source words belong to the areas of colorimetry and artificial intelligence (D and E, respectively). This article only covers two areas of knowledge; therefore, it is not considered important for the research.
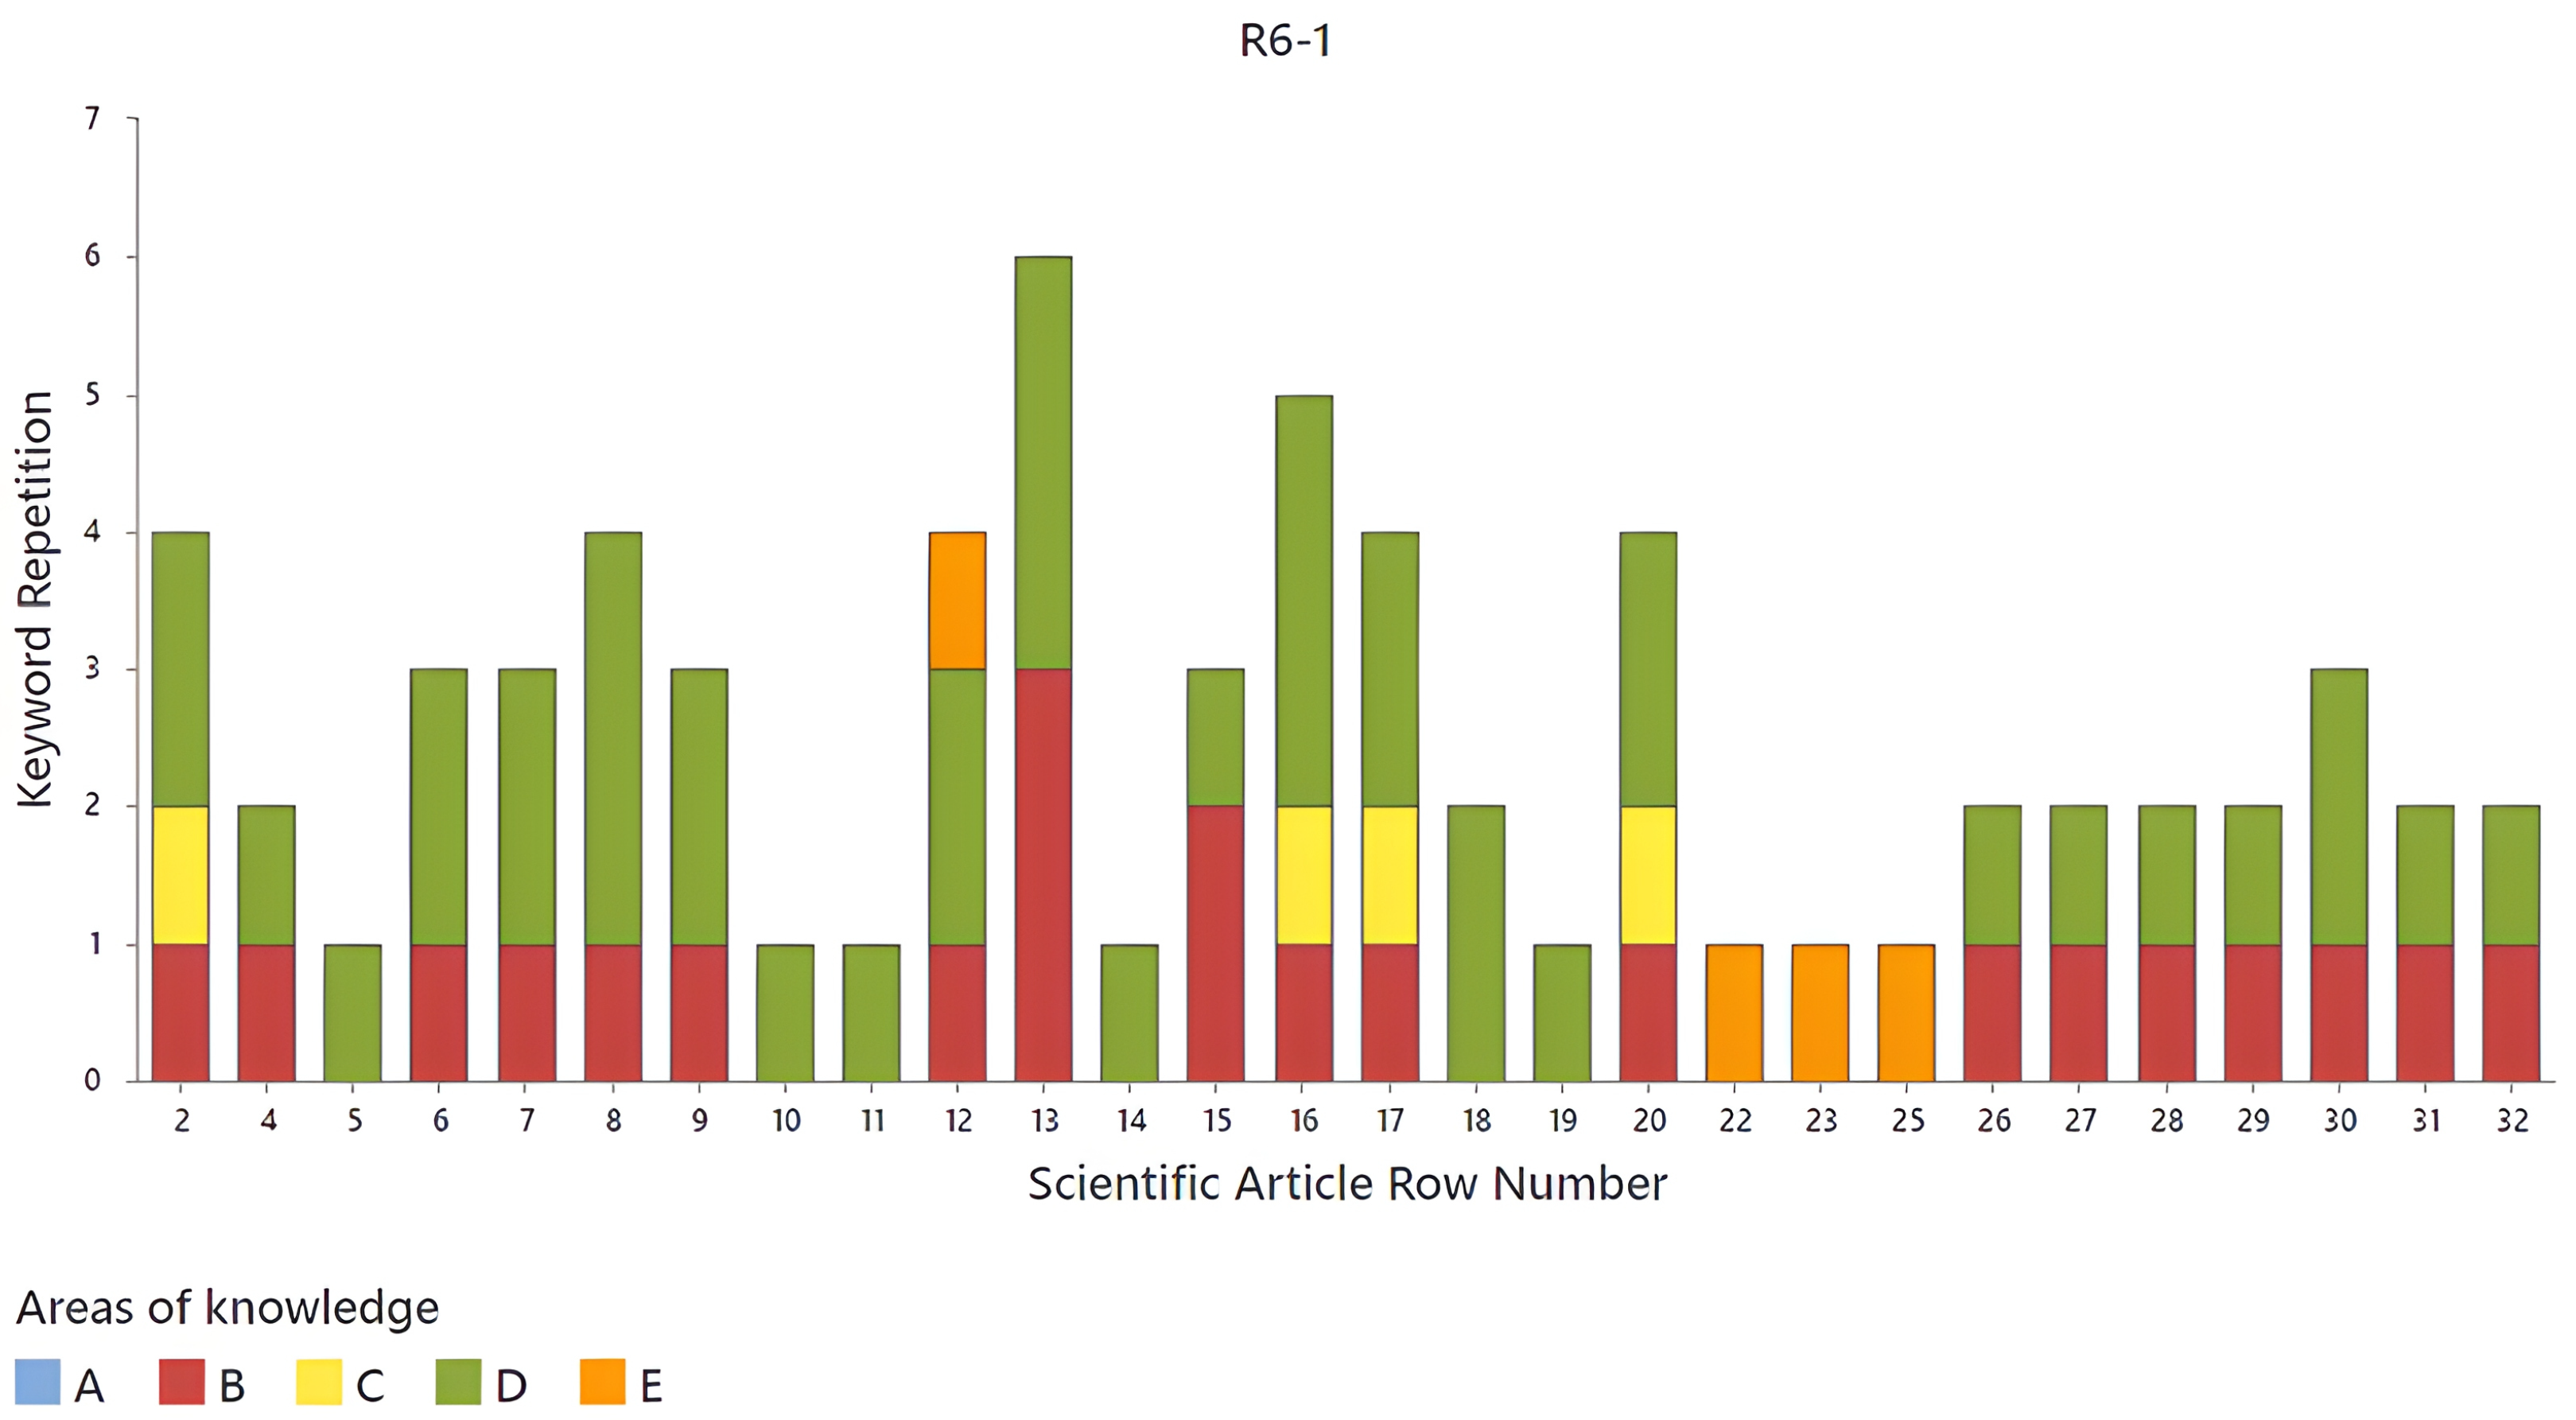
Finally, the analysis of R6 is presented. This analysis is divided into two sets of articles (
Figure 18 and
Figure 19), the first of which contains the articles from rows 2 to 32 and the second of which contains the articles from rows 33 to 61. In both sets, the articles in which no
source words were found were omitted. The articles with the greatest relevance for this research that belong to the first set (
Figure 18) are the articles corresponding to rows 2, 12, 16, 17, and 20. These articles cover three areas of knowledge; the article in row 12 covers areas B, D, and E, and the remaining articles ones cover areas B, C, and D.
The second set of R6 articles is shown in
Figure 19. It can be observed that the articles to be highlighted are those in rows 44, 45, 46, 49, 51, 53, and 55, covering the same three areas of knowledge: B, C, and D.
Therefore, for R6, the areas of knowledge are sensory analysis (B), food and beverages (C), colorimetry (D), and artificial intelligence (E). Comparing the analysis of each rule with
Figure 9, it is evident that, in both instances, the areas of sensory analysis (B), food and beverages (C), and colorimetry (D) are those that present the greatest repetition of
source words. This indicates that the majority of the located literature is linked to these three areas in particular.
3.1. Accuracy of a Classification Model
The Score is a metric used to evaluate the accuracy of a classification model by combining two fundamental measures—precision and recall—into a single value. It is considered a balanced measure between these two metrics that is especially useful when the data in the classes are imbalanced, meaning there is a dominant class. The reason for using the harmonic mean instead of the arithmetic mean between precision and recall is that the harmonic mean gives more weight to lower values. This means that the Score is low if either of these two metrics is low, penalizing models that are imbalanced between precision and recall. Mathematically, the Score is defined as the harmonic mean between precision and recall.
The formula is expressed as follows:
where
Precision measures how accurate a model’s positive predictions are. It is defined as the number of true positives divided by the total number of positive predictions:
Recall measures the ability of the model to identify all positive cases. It is calculated as the number of true positives divided by the total number of true positives and false negatives:
The case study considers a database with a total of 650 articles to be classified into two classes: articles relevant to a specific research topic and articles not relevant to the specific research topic. A panel of specialists in the field of the research topic, consisting of researchers (professors and PhD students), was consulted to review the database and obtain a benchmark classification of the articles it contains.
Table 7 provides an overview of the profiles of the expert panel, while
Table 8 outlines their professional backgrounds, average age, and gender distribution.
The process of reviewing 650 articles requires time and monetary resources, which are limited in research. Therefore, classical statistics were used to review a portion of the 650 articles, selected as a random sample with 90% confidence and a margin of error of 0.05, in order to infer the results to the entire database. Thus, based on the sample size calculation, 100 articles were reviewed, selected through simple random sampling. The statistical approach for calculating the sample size was binomial, since only two classes were considered with the parameters shown in
Table 9.
3.2. Score Calculation
3.2.1. Defining the Ranking of Relevant Articles as a Success
In this case,
is the number of articles that the algorithm classifies as relevant when they really are, that is, the experts classified them as such;
is be the number of articles that the algorithm classifies as relevant when the experts classified them as not relevant; and
is the number of articles that the algorithm classified as not relevant when the experts determined that they were. For the case study, the truth table and the corresponding calculations are given in
Table 10:
3.2.2. Defining the Classification on Non-Relevant Articles as a Success
In this case,
is the number of articles that the algorithm classified as not relevant when they are truly not relevant, i.e., the experts classified them as such;
is the number of articles that the algorithm classifies as not relevant when the experts classified them as relevant; and
is the number of articles that the algorithm classified as relevant when the experts determined that they were not, i.e., not relevant. For the case study, the truth table and the corresponding calculations are given in
Table 11:
The results indicate that when the selection of non-relevant articles is defined as “success”, the
Score is higher than when the selection of relevant articles is defined as “success”. Based on these data and the fact that the panel selected more relevant articles than the algorithm, it can be concluded that one of the following three approaches will have to be implemented in future research: i. train the algorithm to make it more flexible, ii. perform a stricter review by the panel, or ii. both strategies simultaneously. Lastly, it can be said that the algorithm can be used to filter out the articles that a human reviewer would deem irrelevant during the early phases of research. Finally,
Table 12 shows a summary of the articles that were important for this research.
4. Discussion
In the case study, five knowledge areas with research-relevant
source words were identified for literature selection. The database was sourced from subscription-based scientific repositories and the open-access arXiv repository via an API (
arXiv API Access, 2025). The search was structured using six classification rules (R1–R6) based on three criteria: impact factor (IF), open access (OA), and JCR journal ranking. The most represented knowledge areas included colorimetry, food and beverages, and sensory Analysis. Some classification rules were found to have fewer articles, indicating that certain rules are more influential or easier to meet. The repetition of
source words played a key role in prioritizing articles, suggesting areas of greater research interest.
The figures representing the analysis of the articles in each classification rule demonstrate the thematic diversity of the selected articles, suggesting a multidisciplinary approach. These results confirm the effectiveness of the applied selection rules in identifying articles that contribute meaningfully to the SOTA. Out of 650 articles retrieved from the computerized search, 51 were deemed relevant for SOTA development (
Table 12). By filtering approximately 92% of the literature, the analysis focuses on high-quality studies with a greater scientific impact.
The application of the classification rules and the analysis of the repetitiveness of the source words ensure that the SOTA is based on relevant and up-to-date research, enhancing the reliability and depth of the theoretical analysis. However, the classification rules can be adjusted to meet the specific needs of each research project, as well as the number of source words and/or knowledge areas found in each article to determine their relevance.
The research was deemed satisfactory, particularly regarding the accuracy of the methodology. This was demonstrated by the high
Score achieved in discarding non-relevant articles, which outperformed similar approaches that utilize large language models (LLMs), such as the work reported by
Alshami et al. (
2023). While their approach achieved an
Score of 0.80 in identifying “not related” classes, our methodology reached an
Score of 0.83 for the task of discarding non-relevant articles. Although these results are promising, further work is required to conduct more accurate comparisons, as the studies differ in discipline. Therefore, future work should focus on cross-domain validation to enhance the robustness of the findings. Despite these positive outcomes, several areas for improvement were identified, underscoring the limitations of the framework. These include the following:
The framework’s performance depends on the quality of the input data, which is influenced by the completeness and structure of the metadata or abstracts in the repositories. Inaccurate or poorly structured data may negatively impact system performance.
The accuracy of the system show that irrelevant documents could occasionally be retrieved, leading to unrelated information. To address this, an additional manual filtering phase, conducted by a panel of experts, is necessary.
Manual extraction of information is still required for subscription-based articles, even though APIs can automate the process, as seen with the arXiv repository. However, subscription-based repositories like IEEE Xplore, WoS, and Scopus require institutional access.
Future work will also focus on including additional repositories, such as bioRxiv, chemRxiv, medRxiv, PsyArXiv, and HAL, to enhance generalization across different areas. It will also aim to improve semantic extraction by implementing natural language processing (NLP) using open-source multimodal large language models (LLMs) and compare performance with related approaches.


 ,
, 


