Article

The Influence of International Collaboration on the Scientific Impact in V4 Countries

1
Doctoral School of Regional and Business Administration Sciences, Széchenyi István University, Egyetem Square 1, H-9026 Győr, Hungary
2
Innovation Center, Semmelweis University, Baross Strett 22, H-1085 Budapest, Hungary
3
Department of Social Communication, University of Public Service, Ludovika Square 2, H-1083 Budapest, Hungary
4
Globalization Competence Center, Széchenyi István University, Egyetem Square 1, H-9026 Győr, Hungary
5
Department of International and Applied Economics, Széchenyi István University, Egyetem Square 1, H-9026 Győr, Hungary
*
Author to whom correspondence should be addressed.
Publications 2022, 10(4), 35; https://doi.org/10.3390/publications10040035
Submission received: 20 August 2022 / Revised: 14 September 2022 / Accepted: 26 September 2022 / Published: 28 September 2022
(This article belongs to the Special Issue Research Data and Data Papers)

Abstract

:
Several strategies are used by researchers and research facilities to increase their scientific production and consequent research quality. Bibliometric records show that coauthorship and the number of participating organizations in research publications are steadily increasing; however, the effect of collaboration varies across disciplines, and the corresponding author’s country appears to influence research impact. This finding inspired our research question for this study: How does international cooperation affect scientific impact, and does the affiliation of corresponding authors influence citation impact indicators at the level of individual publications? To this end, we provide a comparative evaluation of research articles published in Q1 journals among Visegrad Group countries (Czech Republic, Hungary, Poland and Slovakia) in Medical and Health sciences between 2017 and 2021. The study investigates the relationship between collaboration type (national vs. international) and scientific impact (impact factor of the journal and category normalized citation impact or research papers), as well as the impact of the country of the corresponding author’s affiliation on quantitative quality of individual papers. We show that Q1 research papers in international collaboration have a higher scientific impact than papers published in national partnerships. Moreover, the corresponding authors’ country of affiliation significantly affects scientific impact.

1. Introduction

The publication pattern of researchers is significantly changing, resulting in a sharp increase in the total number of publications each year [1]. According to Bornamm et al. (2015) [2], the global scientific publication output shows an annual growth rate of ~3%. The increasing availability of digital data on scholarly publishing and consequent indicators—number of papers, measurement of scientific impact, coauthorship, national and international collaborations, analysis of affiliations—offers the opportunity to analyse the patterns of scientific publication and its relationship to scientific impact [3]. Scientific impact indicators play a prominent role in evaluating scientific output [4], and researchers consider them when using the appropriate journal for publishing [5]. The Journal Impact Factor (JIF) from the Journal Citation Reports (JCR) (Clarivate Analytics) is one of the most frequently used scientific indicators to evaluate research performance. Because of the incomparability within different research areas and scientific fields, JIF quartiles have been introduced and used to evaluate research output [4,6]. JIF quartiles are calculated for each journal in a given subject category and reflect the journal’s impact factor distribution. To this end, journals can be divided into four quartiles: Q1 represents the top 25% impact factor distribution; Q2 the middle-high position, between 25–50%; Q3 the middle-low distribution, between 50 to TOP 75%; and Q4 the lowest position (bottom 25%) [5]. JIF provides quick information on the impact and prestige of a journal where researchers publish; moreover, from the perspective of researchers, publication in highly ranked journals provides not only recognition but plays a crucial role in the performance-based funding of public research [5,7]. However, scholars also argue that JIF is not an appropriate measurement for the prestige or performance of individual papers as the JIF is calculated for the journals, not for the published papers [8,9]. Thus, in bibliometric research, it is also usual to calculate papers’ performance based on the citations they receive, and researchers can benchmark papers’ impact by field-weighted citation impact (FWCI) or category normalized citation impact (CNCN) that considers not just the number of citations but also citation trends in a given discipline [10,11]. In our current research, we measure papers’ impacts through journal prestige (quartiles and JIF) and category normalized citation impact (CNCN).
International collaborations are thought to be excellent means to improve the quality of scientific research and the resulting scientific output. In particular, scholars have shown that internationally coauthored research papers have a significantly higher impact than their counterparts prepared in national collaboration [12,13]. The prestige of institutions is closely related to the quantity and quality of research papers, and faculties at prestigious institutions tend to have more scientific outputs, receive more citations and obtain more scientific awards [14]. The driving forces beyond research internationalization and international copublication from the perspective of individual organizations are findability, accessibility, interoperability and reusability [15,16,17]. However, at the level of researchers, international collaborations are motivated by an increased proportion of research papers in high-quality journals, greater research impact, increased reputation of the organization, higher visibility and opportunities for multidisciplinary research, as well a better chance to obtain funding for further research projects [18,19,20,21].
International collaborations are on the rise. However, there is an existing gap in knowledge production and scientific impact between high- and low-income countries [22]. The US, UK, Canada, Australia and Europe have a remarkably high scientific output (Bornmann et al., 2011; Cash-Gibson et al., 2018). China is in a special position, as in terms of research production it is catching up with—or in some fields, even surpassing—the US, but in terms of citations, it still lags behind the Euro-American hub [23]. However, as measured in Scimago Country Rankings, China receives more citations than the US, primarily because of the huge number of publications and self-citations. In contrast, the average number of citations/document is still considerably lower in China than in the US and in most European countries.
North America and Europe receive 42.3% and 35.3% of the world’s citations, respectively [24], and the cumulative citation inequalities are on the rise across natural sciences, medical sciences and agricultural sciences [25]. For instance, based on the Scimago Journal Rankings in the Medicine subject area, Europe and the United States published 477,669 (30.75%) and 296,782 (19.11%) research papers and received 726,466 (37.51%) and 365,203 (18.85%) citations, respectively. To this end, international collaboration can be particularly important for developing and low-income countries. Exemplarily, low-income nations are more likely to form international collaborations than researchers from wealthier countries. The most frequent international collaborating partners of low-income and lower-middle-income countries are researchers from the USA, China, Germany and France [26].
The scientific world is divided into the ‘haves’ (or the industrialized world) and the ‘have nots’ (or the developing world), and at least five different concepts must be taken into account when talking about research collaboration and research output: (1) science itself, (2) publishers, (3) the role of nation states, (4) world power structures and (5) the research themselves. Countries beyond the Western world are typically held to be disadvantaged when it comes to scholarly publications, especially in their representation in top-tier international journals. Moreover, as the “Matthew effect for countries” phenomenon suggests, already successful countries can further raise their advantages over the underrepresented regions by receiving more research funds, brain drain and a possible bias toward research conducted at elite universities [27].
Indeed, the gap between the ‘haves’ and the ‘have nots’ is constantly widening, reflected in the existing disparity of scientific research papers in top journals [25,28]. However, the world’s share of scientific publications—the top 1 and top 10% most highly cited scientific publications—show remarkable differences also among developed (high-income) countries. According to the Science, Research and Innovation Performance of the EU 2020 report [29], the EU and China are the global leaders in scientific output (number of research papers), and the United States is the leader in scientific impact (citations). Although the EU remains in the leading position regarding the share of scientific research papers worldwide in 2018, a positive correlation was found between the scientific quality and investment cost in EU countries. Thus, strong differences persist between European countries’ performance. For example, whilst the Netherlands, Denmark and Luxemburg provided 15.3, 15.1, and 13.7% of the top 10% most highly cited scientific publications in 2016, the Visegrad Group countries were characterized by 6.2% (Hungary), 5.2% (Poland), 5.1% (Czech Republic) and 5.0% (Slovakia). This tendency is also captured at the level of top 1% scientific outputs, being 1.57%, 1.56% and 1.35% for the Netherlands, Denmark and Belgium, and 0.72 (Slovakia), 0.44% (Hungary), 0.39% (Czech Republic) and 0.29% (Poland) for the Visegrad Group countries.
As part of the higher education transformation, scientific performance and quality of scientific research have changed since the 2000s. In the Visegrad Group (V4) countries (Czech Republic, Hungary, Slovakia, Poland), the academic structure follows the Central-Eastern European model, and the European trends in science are increasingly visible. The 2000s witnessed a transformation of higher education systems in the region under the process of Europeanization [30]. This transformation includes an increasing struggle for regional research and higher education internationalization. Universities and research institutions started to follow policies emphasizing the importance of international excellence, measured by global university rankings [31]. Consequently, international collaboration and publishing in indexed international journals became mandatory in many research universities in Central and Eastern Europe [32].
However, not all V4 countries collaborate at the same level. According to Szuflita-Żurawska and Basińsk (2021) [33], whilst Poland is the most productive of the V4 countries in terms of publication output and citation between 2010 and 2019, Hungary is a leader among V4 countries in international scientific collaborations.
Our goal is to provide the first up-to-date cross-country comparison of publication performance of the V4 countries in the light of national and international collaboration. As medical scientific research has become increasingly global, cross-national and collaborative, we performed a field-specific analysis of publication outputs among all four V4 countries. Input data for the OECD 3 Medical and Health Sciences category were obtained from the Web of Science Core Collection and Web of Science InCites database between 2017 and 2021. First, we focused on the publication activity of the V4 countries with special attention to papers published in Q1–Q4 JIF quartile journals. Next, we analysed the scientific impact of articles published in Q1 journals as a function of collaboration type (e.g., research output in national or international collaboration). In addition, for all V4 countries we evaluated the scientific impact of internationally coauthored research papers in Q1 journals by considering the affiliate country of corresponding authors.
In terms of practical application, our approach can highlight how the research output and scientific impact are affected by national and international collaborations in V4 countries.

2. Materials and Methods

The bibliometric analysis was based on observed data from the Web of Science InCites (InCites) and the Web of Science Core Collection (WoS) databases. Data collection was performed on the 25 April 2022. In InCites, four different specifications were used: (1) time period—between 2017 and 2021; (2) location type—one of the V4 countries; (3) research area—OECD-based, 3 Medical and Health Sciences; (4) document type—article. With this approach, the InCites database allowed us to download seven different data sheets for all countries: (1) all records, (2) domestic collaborations, (3) international collaborations, (4–7) Q1–Q4 JIF quartile. The accession number of research papers was used to obtain data from the WoS database. All derived data for V4 countries (Czech Republic, CZ; Hungary, HU; Slovakia, SK; Poland, PL) were aggregated into separate spreadsheets and aligned with the structure of downloaded datasets. The final four datasheets contained the following data used for further investigation: cooperation type (national or international collaboration), JIF, category normalized citation impact (CNCN), the JIF quartile (Q1–Q4), as well as the affiliation country of the corresponding author. When more than one corresponding author was included in the datasheet, the affiliation of the first corresponding author was used. Research papers with one author were not included in the study.
For qualitative analysis of research outputs, the total number of research articles and the proportion of research papers in national and international collaboration were calculated for all Q1–Q4 quartiles for all V4 countries. As a next step, we used the JIF [34] and category normalized citation impact (CNCI) [35] as indicators of scientific impact. The median values of JIF and CNCI were calculated for national and international collaborations, plotted against V4 countries and within the countries against Q1–Q4 JIF quartile.
The affiliation of the corresponding authors was observed for each international Q1 research paper. Based on the number of research papers, we selected the top 10 collaborating countries for each V4 country and calculated the median number of JIF and CNCI for each collaborating region.
Before any pairwise statistical analysis and correlation, each measurement’s normality was assessed using the Shapiro–Wilk test. In all cases, normal distribution was rejected. Therefore we selected U Mann–Whitney nonparametric test to compare pairwise groups statistically. Statistical analysis and data visualizations were performed using Origin Pro 2022 (Student version) and JMP (R) Pro data analysis and graphing software.

3. Results

3.1. Publication Output of V4 Countires

After the InCites search, 53,540 research articles were retrieved in the field of Medical and Health Sciences (OECD categorization). After discarding research papers with only one author, 52,767 research papers remained. Figure 1 shows that Poland has the highest number of total research papers (n = 28,999), followed by Czech Republic (n = 11,545), Hungary (n = 8948) and Slovakia (n = 3275). We observed the share of articles in each quartile journal: Czech Republic: Q1 = 40.26%, Q2 = 26.16%, Q3 = 15.49%, Q4 = 19.06%; Hungary: Q1 = 40.53%, Q2 = 27.05%, Q3 = 14.22%, Q4 = 18.18%; Poland: Q1 = 33.99%, Q2 = 25.99%, Q3 = 19.40%, Q4 = 20.62%; Slovakia: Q1 = 30.74%, Q2 = 22.98%, Q3 = 21.83%, Q4 = 24.43%.
The distribution of Q1–Q4 research articles had a similar trend among all V4 countries, with the predominance of Q1 papers. On the cumulative level, the total number of research papers decreased with the increasing quartile (from Q1 to Q4), supported by the negative linear correlation coefficient (Cc) between the growing quartile number and the number of research outputs (Cc Cz = −0.87, Cc HU = −0.88, Cc PL = −0.91, Cc SK = −0.65).
When research papers were divided into two subgroups, (1) national collaboration and (2) international collaboration, we found remarkable differences in the total number of research outputs assigned to the Q1–Q4 JIF quartiles (Table 1). The total number of Q1 research papers published in international collaboration was higher than the Q1 publications in national collaboration. Moreover, the number of research papers in international collaboration decreased with the increasing JIF quartile (from Q1 to Q4) (Cc Cz = −0.93, Cc HU = −0.95, Cc PL = −0.95, Cc SK = −0.92). On the other hand, the number research papers in national collaboration showed an opposite tendency: the number of research papers increased with the JIF quartile (Cc Cz = 0.65, Cc HU = 0.45, Cc PL = 0.74, Cc SK = 0.99) (Figure 1).
These results have two clear implications. First, around 36% of analysed documents were published in Q1 journals (40% for Cz, 40% for Hungary, 33% for Poland and 30% for Slovakia). This is the highest ratio compared to those observed in Q2, Q3 and Q4 research papers. Second, the expected probability of publishing in Q1 journals is higher in international collaborations than in national collaborations. Moreover, the relationship between the increasing JIF quartile and the proportion of research articles is inverse for international and national collaborations.

3.2. Research Papers in International Collaboration Have a Higher Scientific Impact

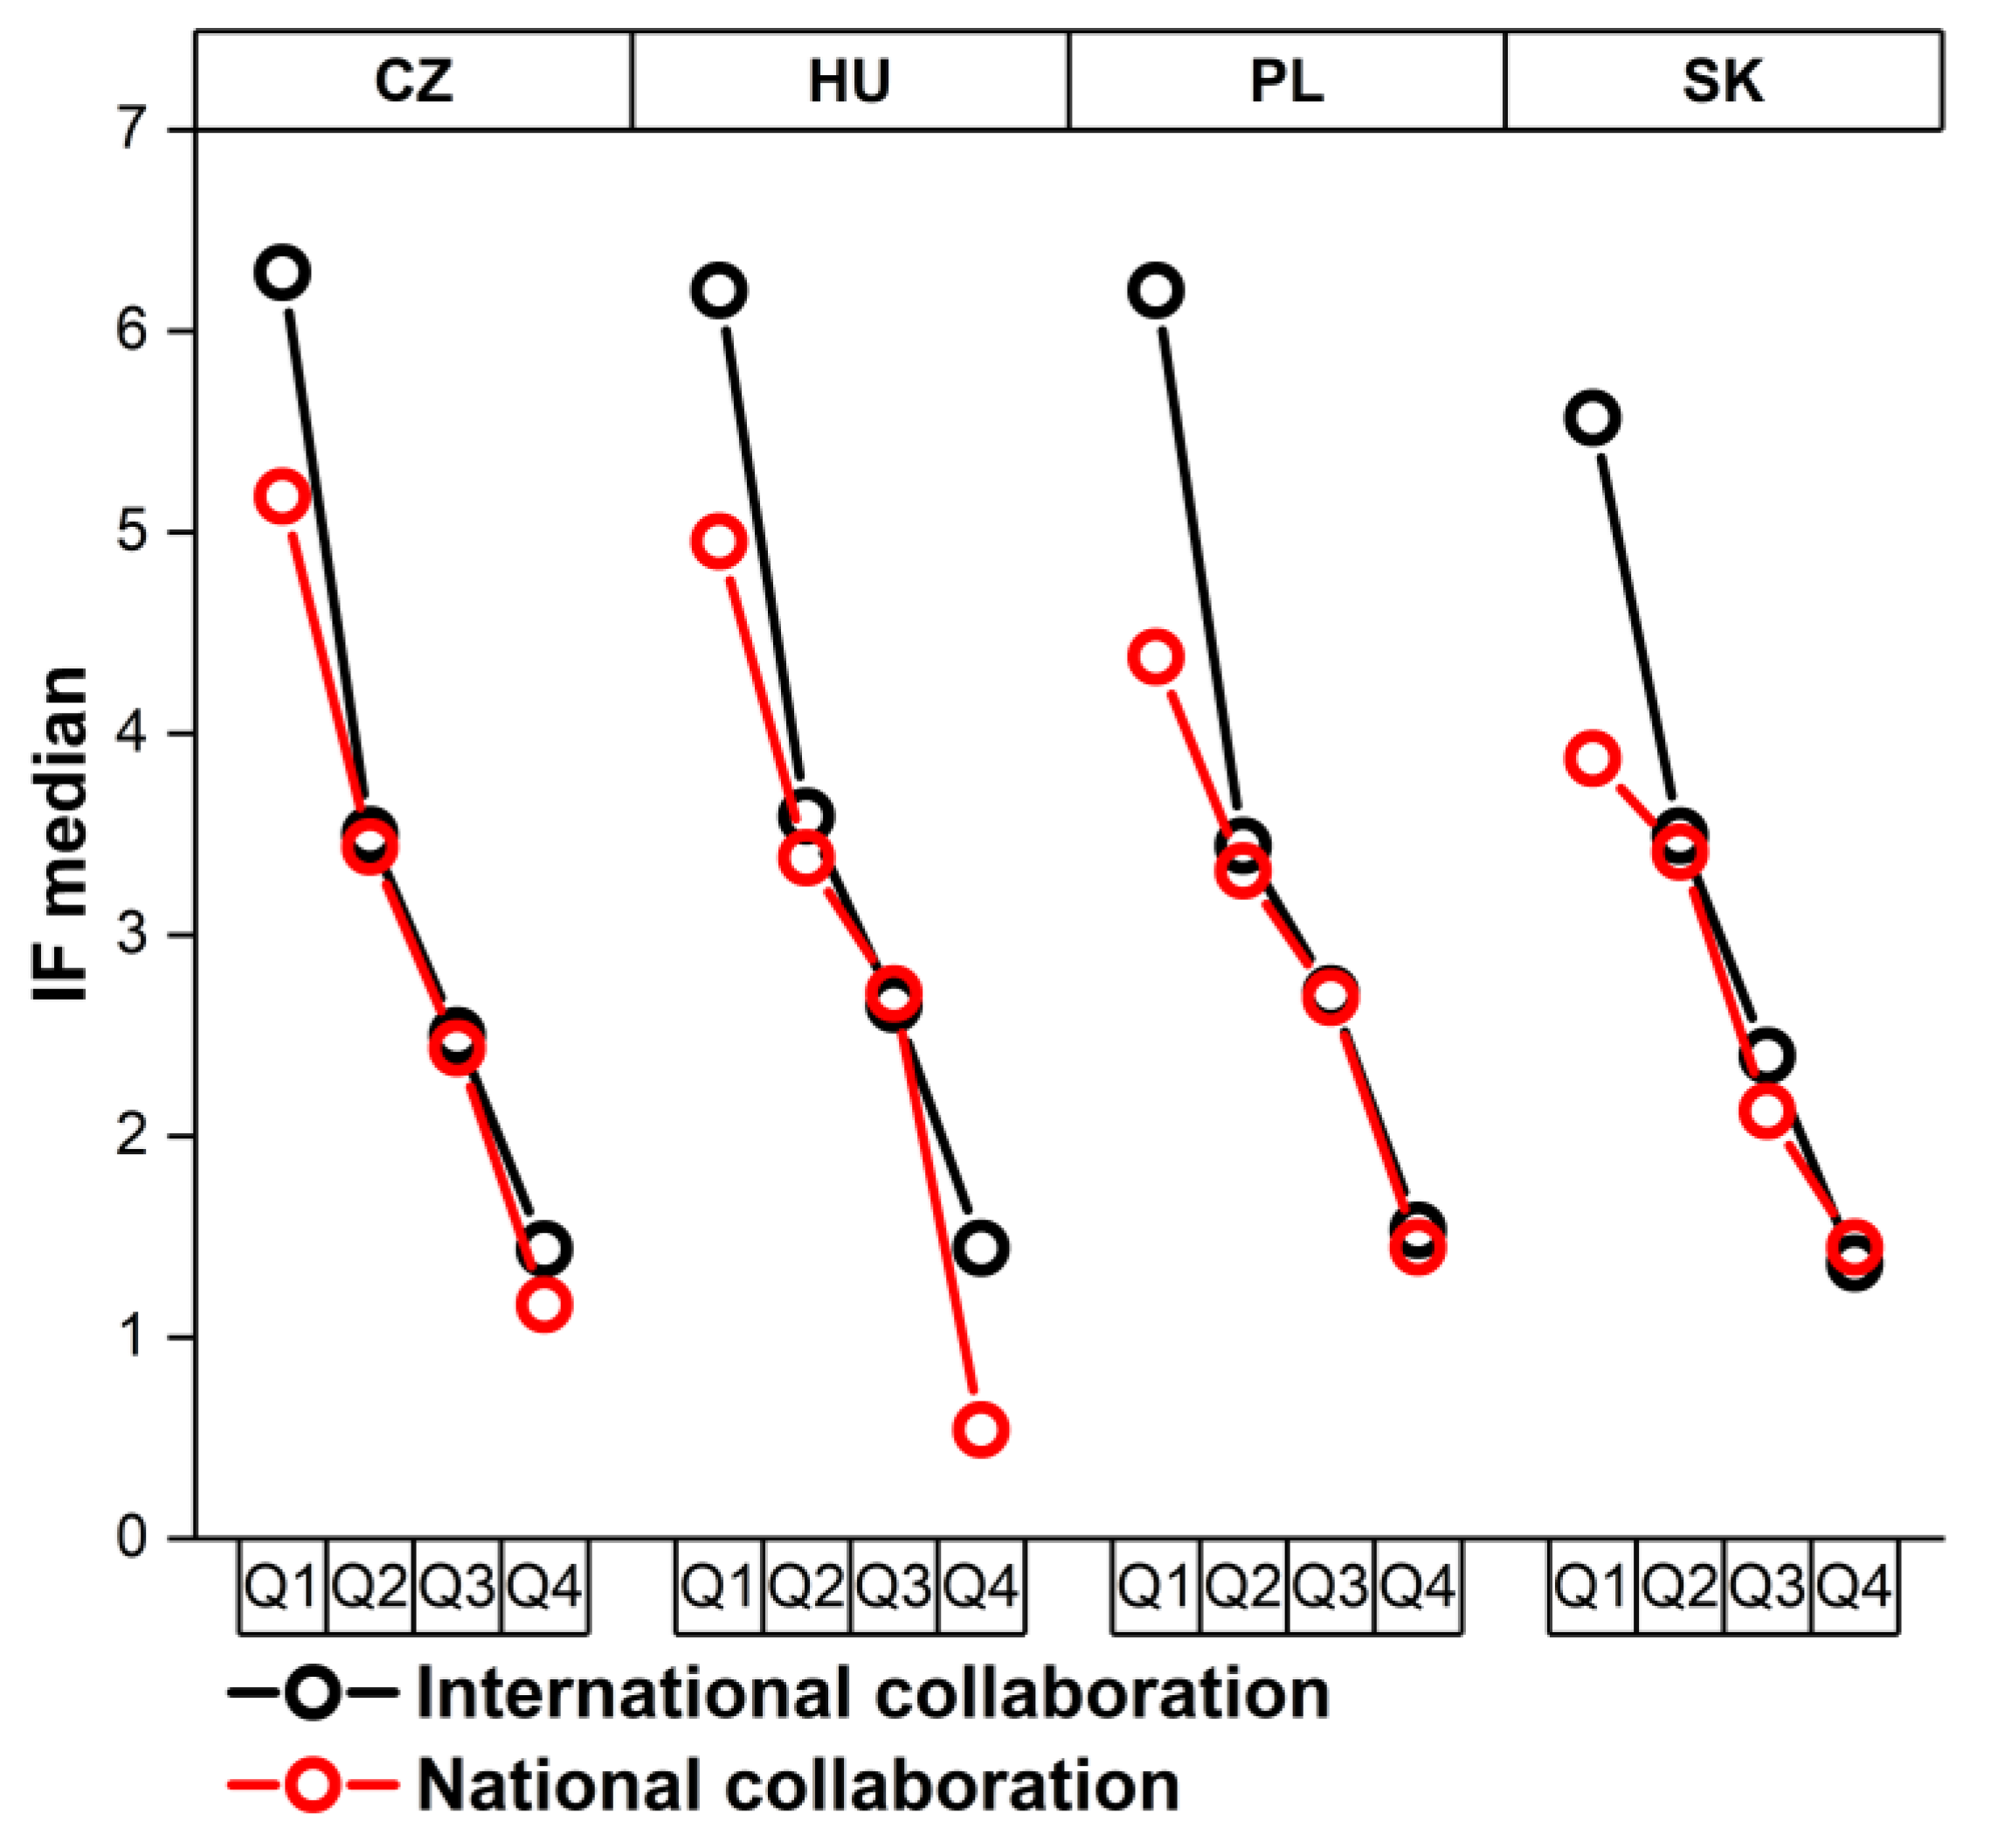
It is necessary to note that the total number of research papers in Q1–Q4 journals is not equal. We have seen that the share of research papers in Q1 journals is higher than 25% for all V4 countries and international and national collaborations. However, our interest was to analyse scientific impact indicators for all JIF quartiles as a function of collaboration type (international vs national collaboration). To this end, for each JIF quartile, the impact factor and category normalized citation impact were used and plotted against the collaboration type: international collaboration vs national collaboration. Although the JIF corresponds to the journal’s impact factor distribution within a particular category, we supposed that there might be differences within the JIF quartile between research papers published in international and national collaboration. Our analysis supported this assumption (Figure 2). Research papers in international collaboration received a higher impact factor in all Q1–Q4 JIF quartiles than articles published in national partnership (except Q4 papers in Slovakia). The statistical analysis revealed that at the level of the V4 countries, Q1 papers in international collaboration had significantly higher impact factors than papers published in national partnership (Table 2). Moreover, except for Slovakia, this significant difference was also captured among Q2 and Q4 publications. On the contrary, Q3 papers showed a significant difference only in the case of Slovakia.
Although the impact factor of a journal is a well-known citation metric, one can argue that there is a lack of correlation between their values and the real importance of research articles [36]. Therefore, as an additional indicator, we used the category normalized citation impact (CNCI) as a standard indicator reflecting the observed and expected citation count ratio [37].
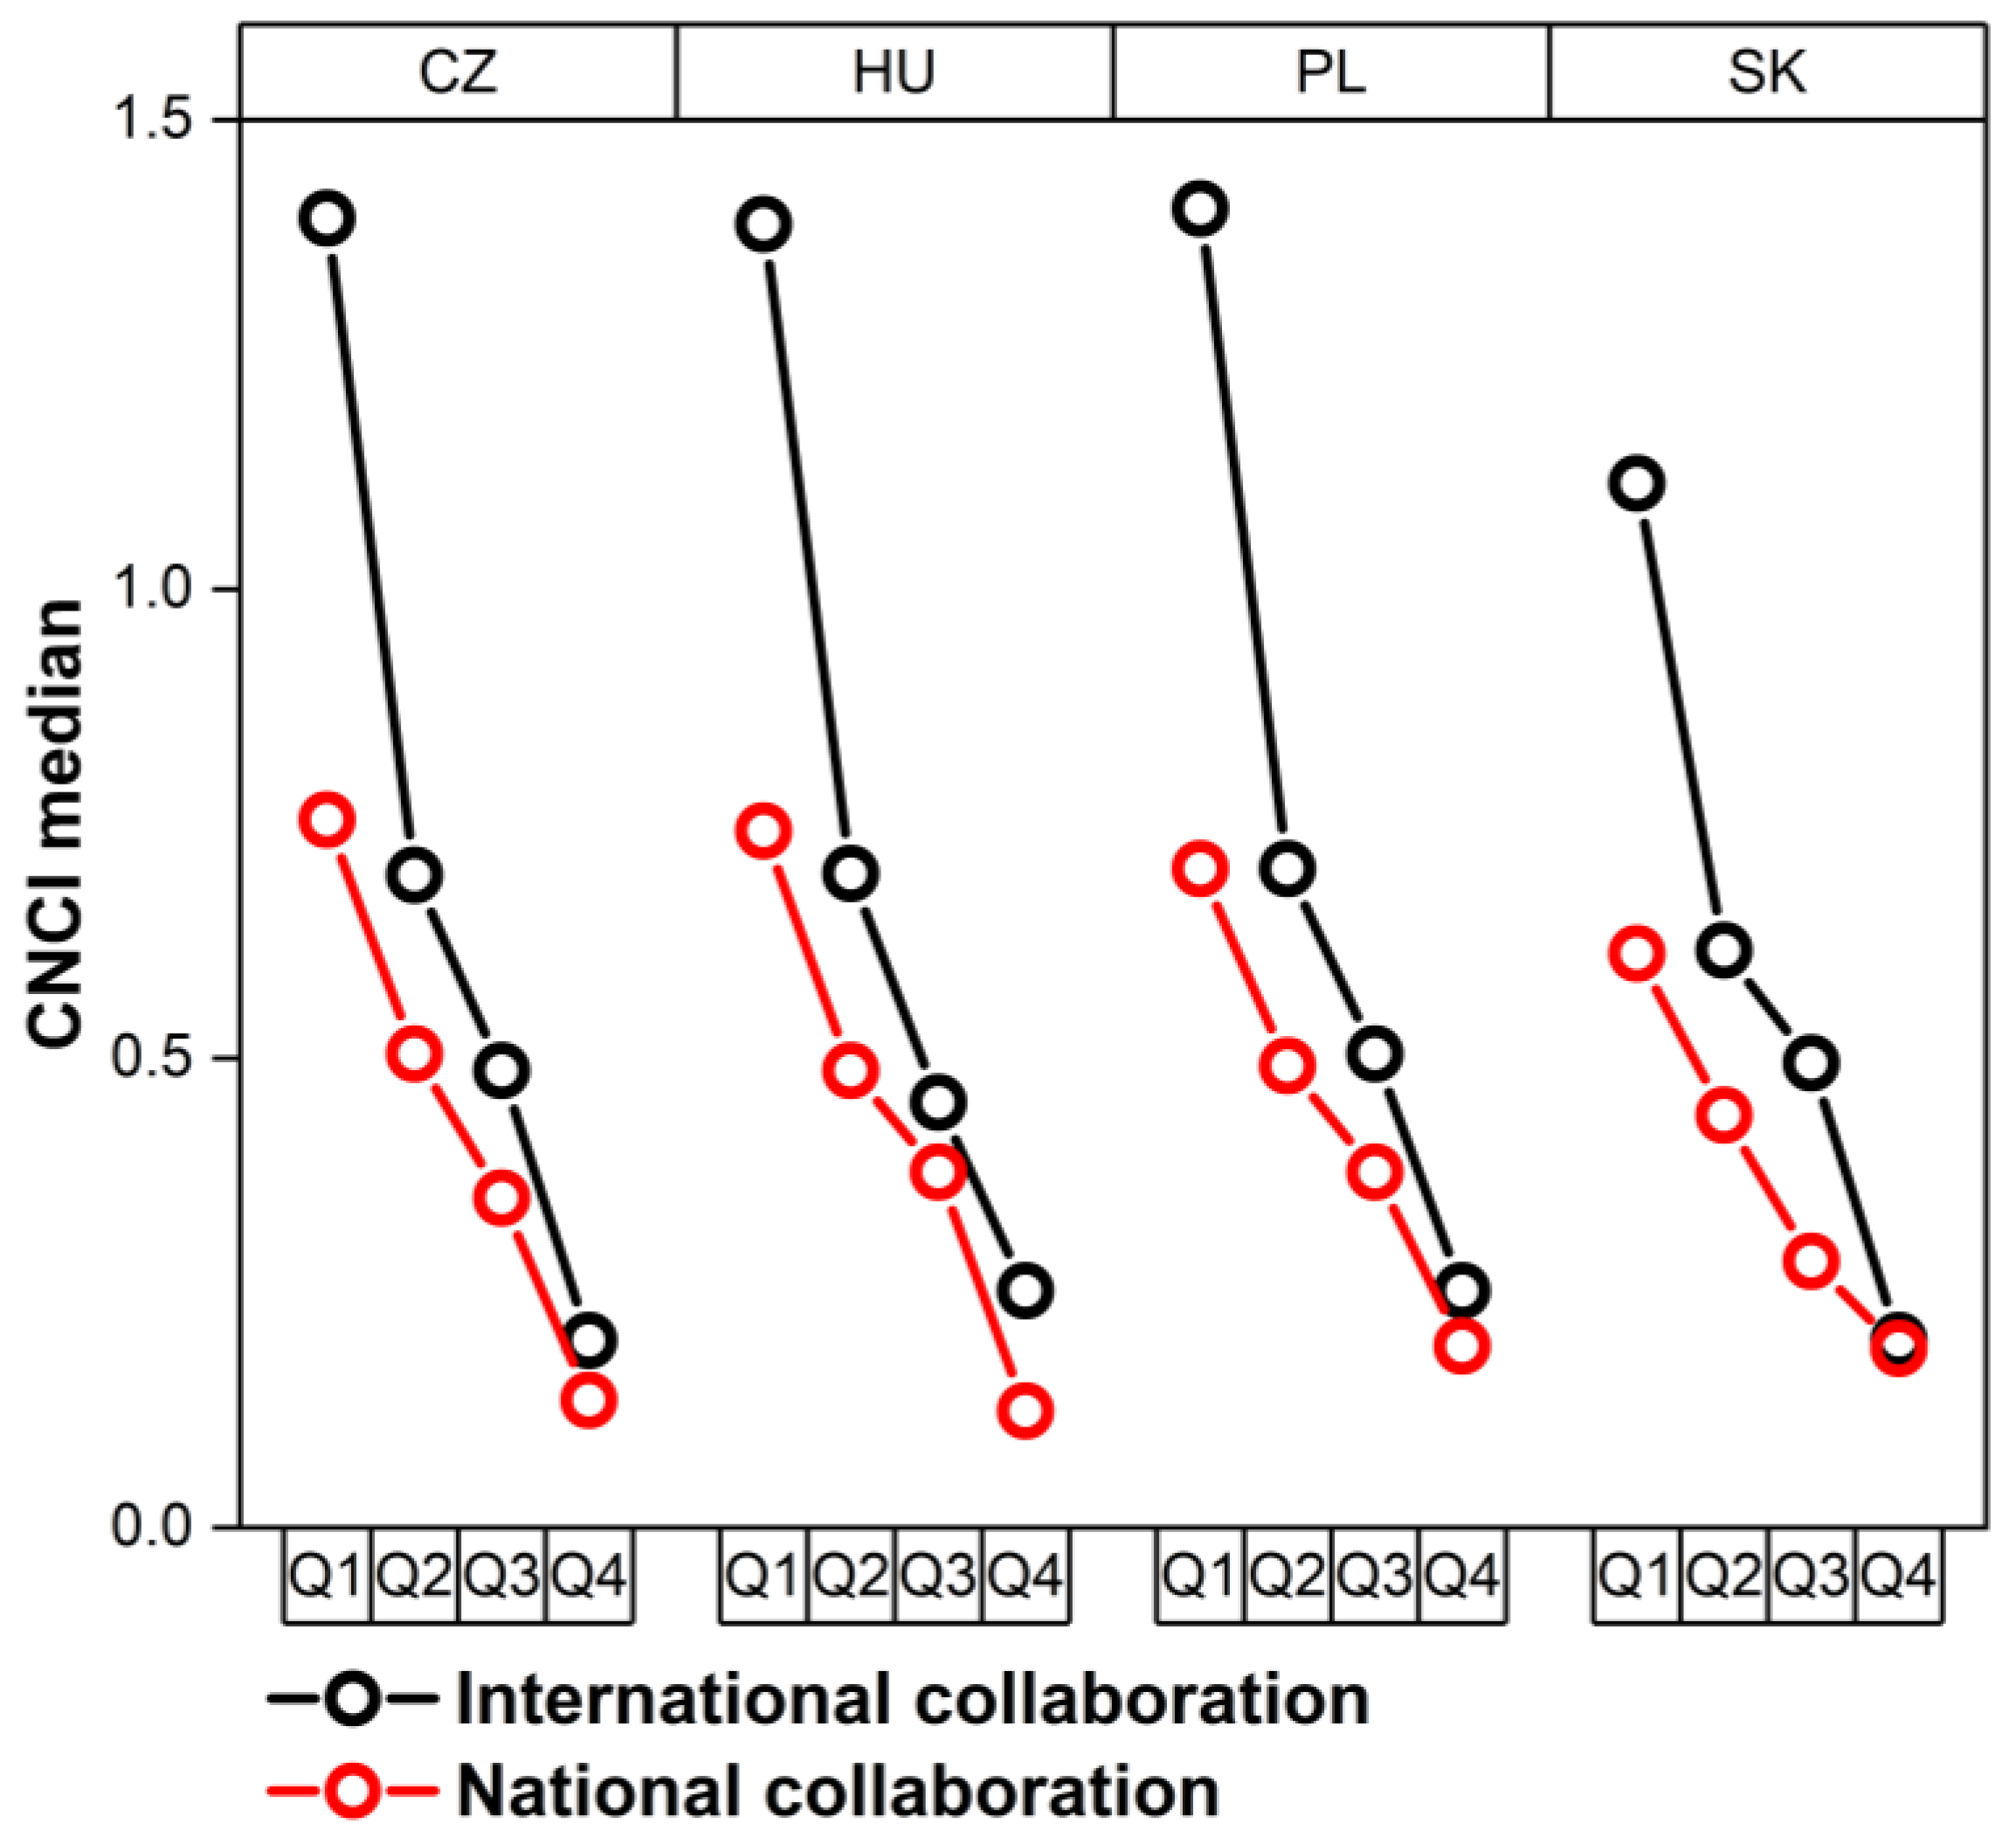
The CNCI median values are illustrated in Figure 3. The higher value in median CNCI for international collaborations is broadly similar to all V4 countries. The mean CNCI for both Q1–Q4 JIF quartiles is significantly higher in international collaborations than in national partnerships (Table 3); moreover, the median value of CNCI in both international and national collaborations shows a decreasing trend with the increasing number of JIQ quartiles. The correlation coefficient ranged between −0.95 and −0.95 (***, p < 0.001).
These results support previous scholars’ findings that international collaboration generally produces a higher scientific impact [12,18,38,39]. However, there are substantial differences in the share of such scientific impact regarding JIF quartiles.

3.3. Influence of the Corresponding Author’s Country of Origin on Scientific Impact in International Collaboration

Considering that scientific impact depends on the collaboration type, we verified whether there is a statistically significant difference in both impact factor and category normalized citation impact based on the country of origin of corresponding authors. As the corresponding author is usually the principal owner of the research results from the perspective of intellectual property [40,41], their affiliation was used as a baseline for further analysis. To this end, for each Q1 paper published in international collaboration, we collected the country affiliation for each corresponding author [42] and demonstrated how the top 10 affiliated countries influence scientific impact. The paper counts for analysed countries for all V4 nations are summarized in Table 4.
During 2017–2021, 10,607 papers were analysed: 2934 for the Czech Republic, 2335 for Hungary, 4736 for Poland and 602 for Slovakia. Altogether, 15 countries were represented as the top 10 collaborating partners for the V4 countries, based on the national affiliation of corresponding authors. According to the online World Bank database, all analysed countries belong to high-income countries. Of these 15 countries, 11 are members of the European Union (Austria, Belgium, Czech Republic, France, Germany, Hungary, Italy, Netherlands, Poland, Slovakia and Spain), 2 are European countries (England and Switzerland) and 3 are North American countries (Canada and USA).
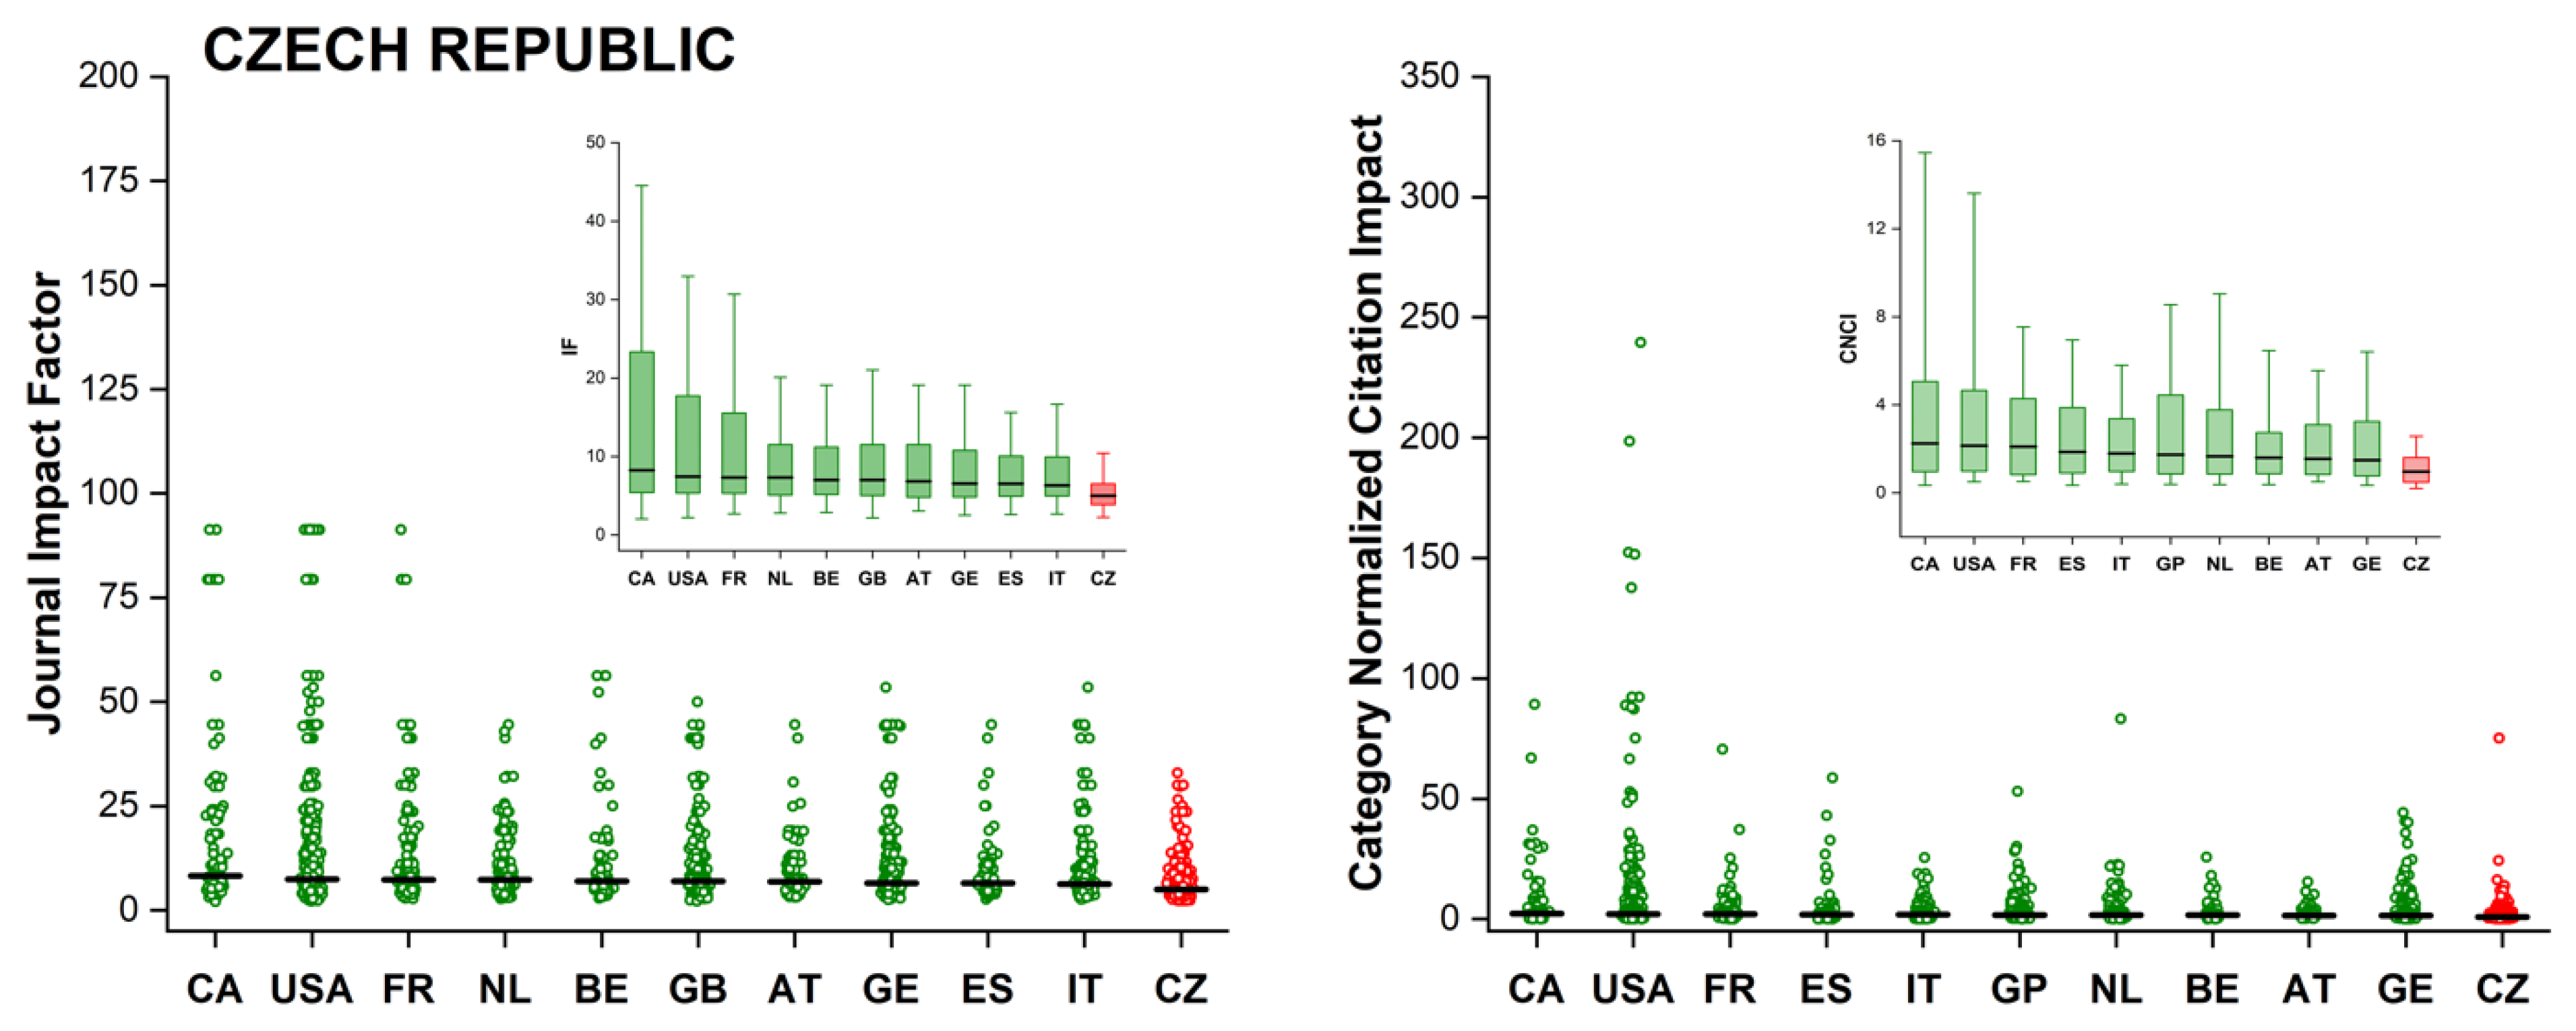
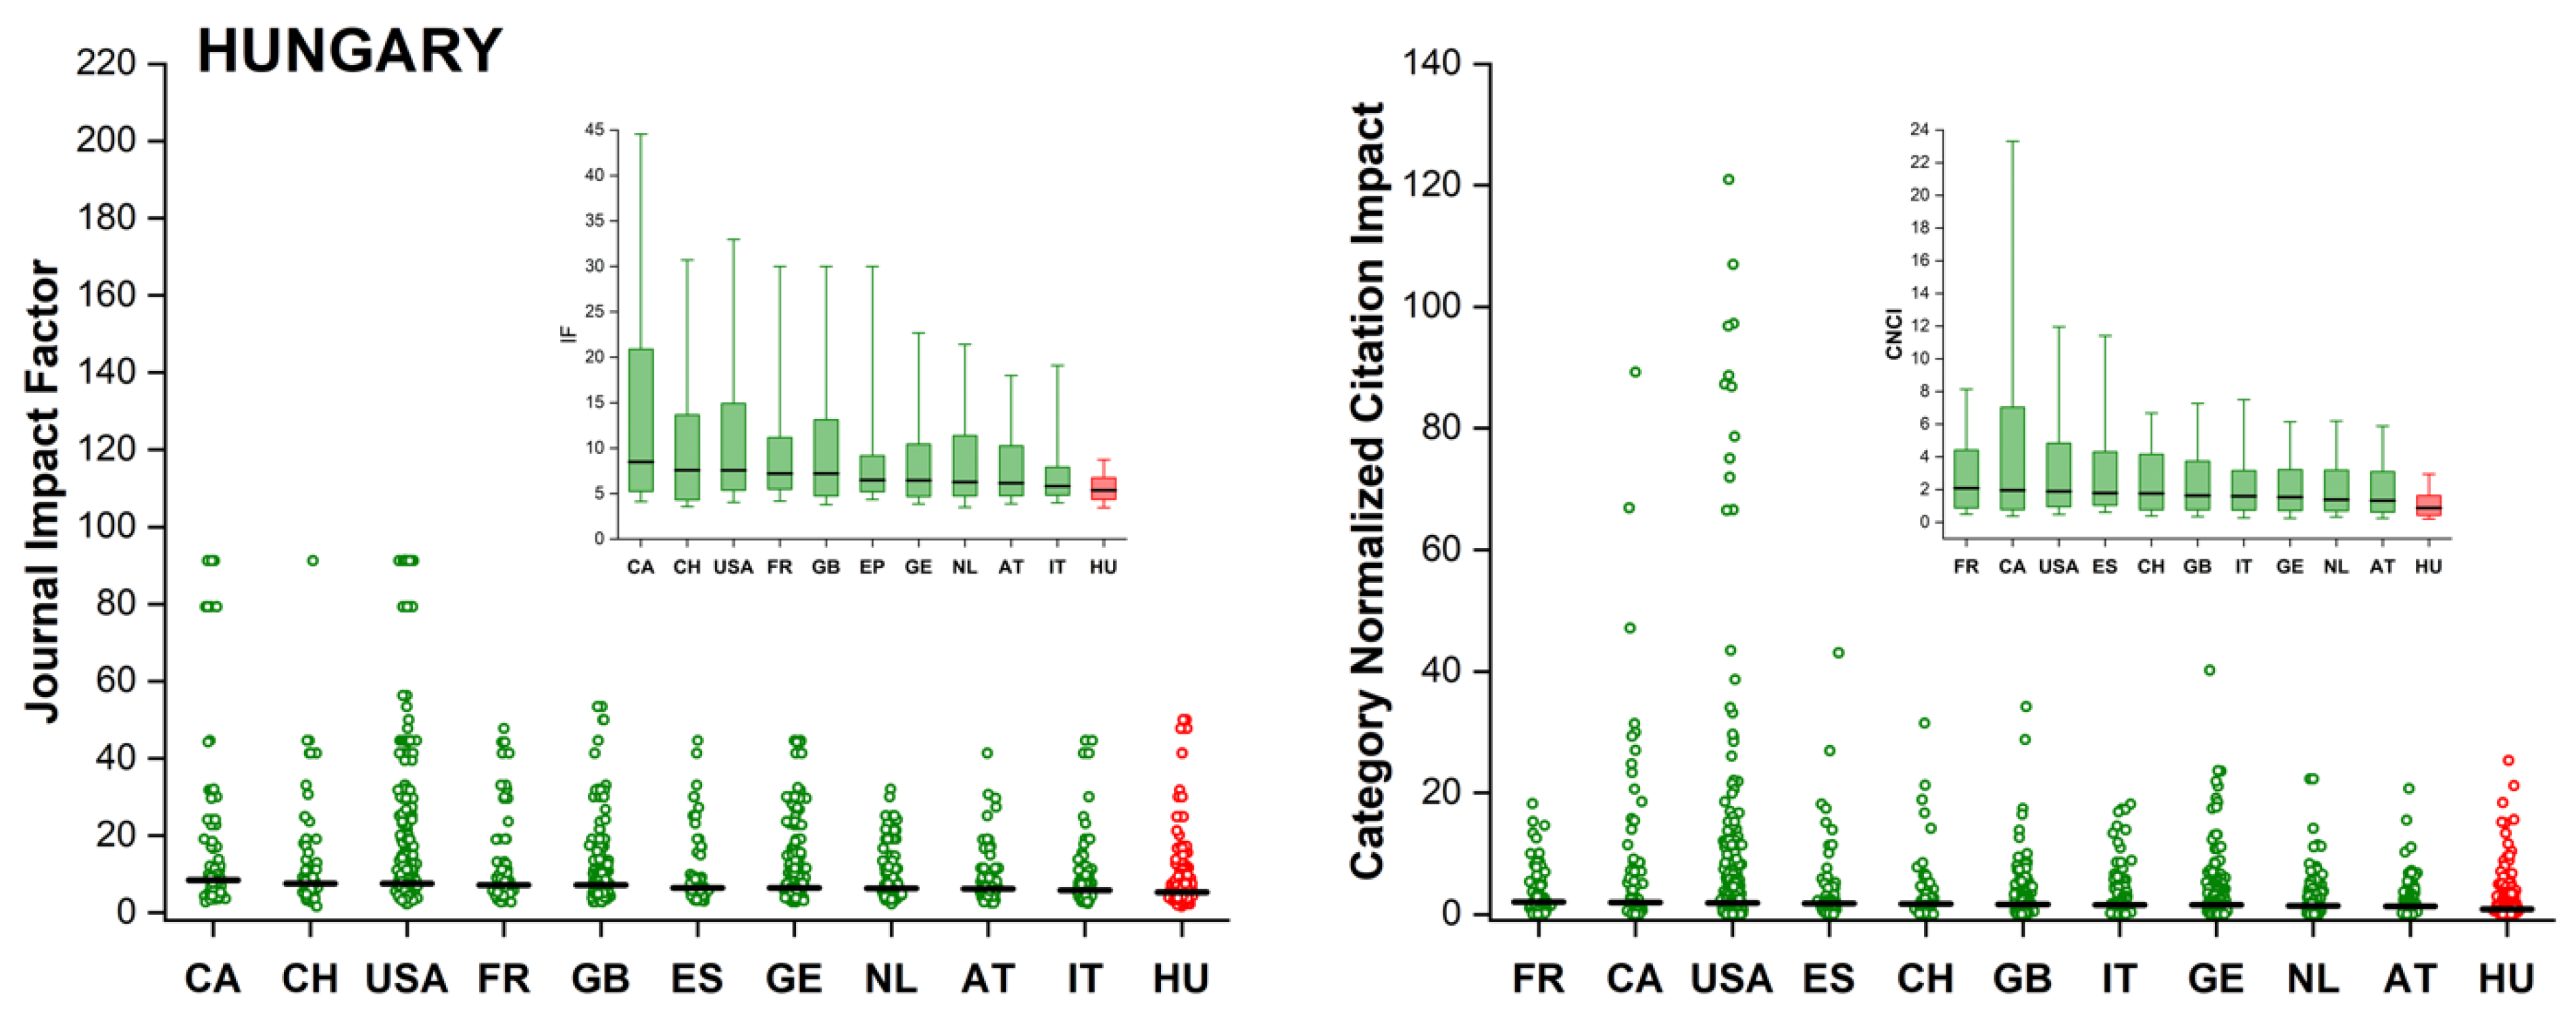
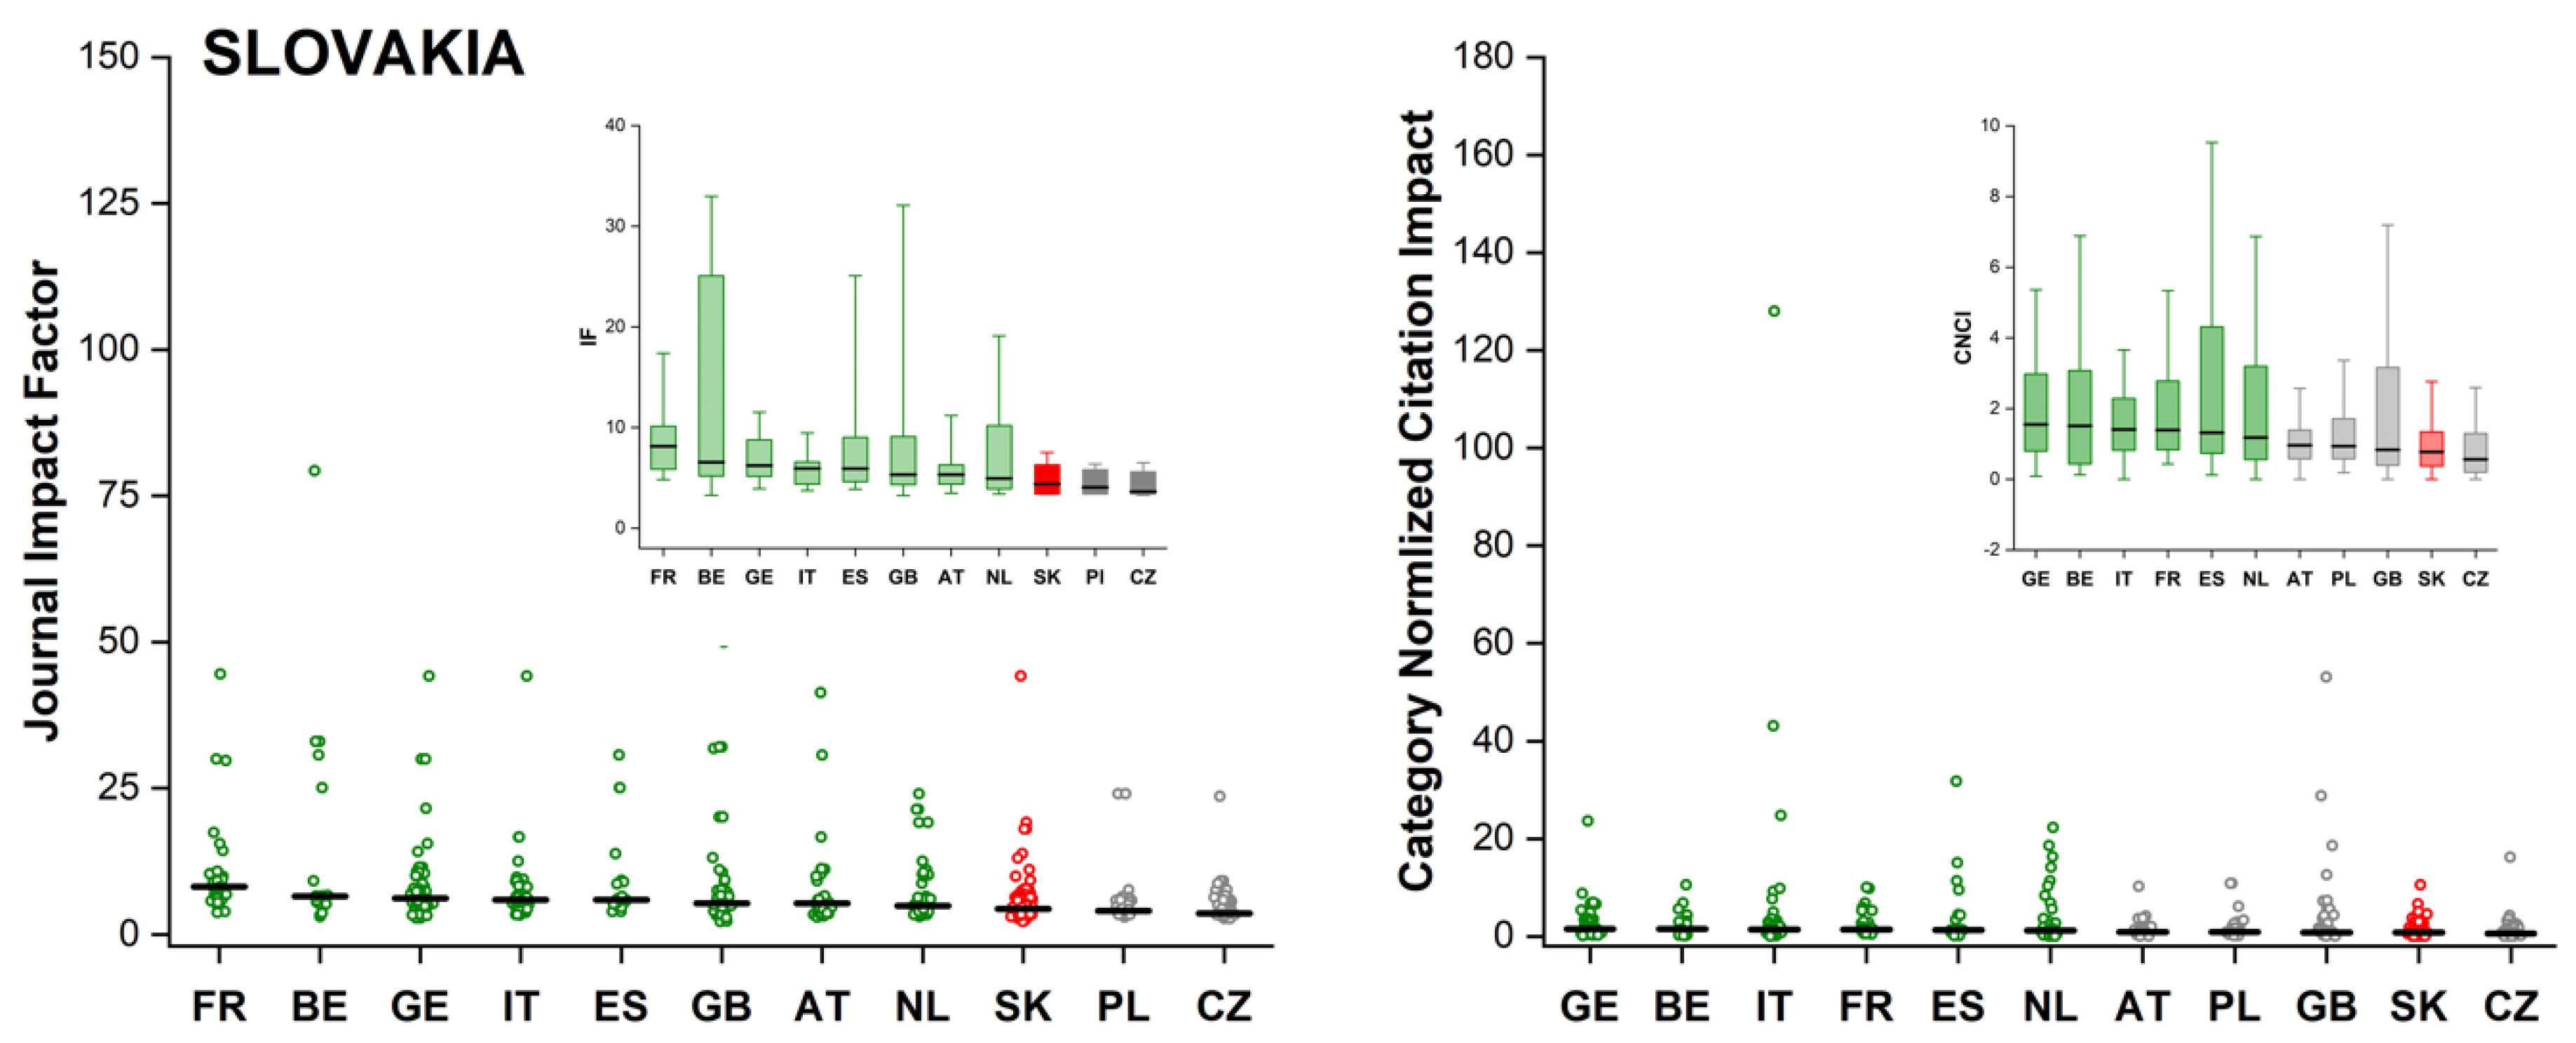
After identifying the affiliated country of corresponding authors, we plotted the impact factor and category normalized citation impact in the order of the observed highest median value. Then, according to the nonparametric distribution of data, the pairwise Wilcoxon test was used to compare values between the given V4 and analyse the top 10 affiliated countries. Czech Republic (Figure 4), Hungary (Figure 5) and Poland (Figure 6) have the lowest median value of impact factor and category normalized citation impact compared to the top 10 analysed countries. Moreover, these differences are statistically significant. Slovakia (Figure 7) was the only country having a higher impact factor (9th place from 11) and a higher category normalized citation impact (10th from 11). In the case of Slovakia, the difference was not significant for all of the top 10 countries (not significant impact factor differences for Poland and the Czech Republic, not significant category normalized citation impact differences for Austria, Poland, England and the Czech Republic). In general, these results suggest that the scientific impact of research papers published in Q1 journals is highly influenced by the country of origin of the corresponding author. Impact factor and the category normalized citation impact were plotted against the country of origin of the corresponding authors. Open circles represent the observed JIF and CNCI values; the black line corresponds to the calculated median value. Red open circles represent the analysed V4 country; green open circles represent countries with an observed significant difference; open grey circles represent no significant difference between the V4 and the compared country. For each V4 country, the order of plotted countries corresponds to the calculated median value. Insets: For better visibility, the same results were plotted as a box plot. The black line corresponds to the median value, the bottom and top lines show the 1st and 3rd quartile and the whiskers show 10–90% outliers. Abbreviations: AT = Austria, BE = Belgium, CA = Canada, Ch = Switzerland, CZ = Czech Republic, ES = Spain, GB = England, FR = France, GE = Germany, HU = Hungary, IT = Italy, NL = the Netherlands, PL = Poland, SK = Slovakia, USA = United States.

4. Discussion

The introduction and adoption of JIF quartiles are often used as a potential tool to conduct research evaluation. Having more articles in the top JIF classes can be equated with higher research performance. A JIF quartile is independent of other contextual information and indicators. However, JIF quartiles face an intrinsic problem: the difference between quartile boundary JIF values are small, and different quartiles do not necessarily mean different scientific impacts [43]. Even so, we have shown that V4 countries in medical science publish with a higher probability in Q1 journals than in Q2–Q4 between 2017–2021. The share of Q1 publications varied from 30.74 to 40.26%, respectively, among V4 countries; moreover, we found a negative correlation between the growing JIF quartile (decreasing prestige) and the number of published papers. This trend is similar to those observed in Brazil, South Korea, Germany, Spain, the USA and England [44]. A possible explanation of this trend is the use of JIF quartiles in research and researcher evaluation: having more research papers in the top JIF Q1 journals is equated with higher research performance, prestige and recognition.
However, research papers in high JIF quartiles do not necessarily mean higher scientific impact. The collaboration across different organizations and relationships between different national and international scientific networks are in a good position to achieve better performance measures [38,42,45]. This is also true at the level of V4 countries. We have shown that internationally coauthored research papers tend to have a higher scientific impact at the impacts of impact factor and category normalized citation, especially at the level of articles in Q1 and Q2 ranked journals. As reported by several other studies, international collaboration positively impacts the quality of research papers [4,35,42].
To gain a more precise understanding of the effect of international collaboration on research impact, we divided international Q1 research papers for each V4 country based on the country affiliation of the corresponding author [42]. Analysing the papers published between 2017 and 2021 in medical and health science revealed that the scientific impact is significantly dependent on the country of origin of the corresponding author. The trend was consistent across the Czech Republic, Hungary, Poland and Slovakia: V4 institutions have a higher scientific impact when the corresponding author is affiliated with a non-V4 country. Although several factors might influence scientific performance, it seems that V4 countries benefit from foreign institutions’ leadership. The country of origin of the corresponding author can provide additional information relevant to international collaboration. It is important to note that this study did not examine additional variables such as the research and development expenditure of collaborating countries or the possibility of publication bias or citation bias [46,47,48].
These results provide several other possibilities for further research in relation to international collaboration and research output. A deeper analysis should be developed considering the relationship between scientific impact and international leadership. Although the V4 countries belong to high-income countries, international collaborations are asymmetrical around several nations [49]. This suggests that the author’s country of affiliation as an indicator of scientific cooperation and leadership needs a deeper insight.

Author Contributions

Conceptualization, Z.K., G.P.S., K.C., E.L. and M.D.; methodology, Z.K., M.D. and L.K.; software, Origin Pro 2022 (Student Version) and JMP (R) Pro.; validation, Z.K., M.D. and G.P.S.; resources, Z.K. and L.K.; writing—original draft preparation, Z.K.; writing—review and editing, Z.K. and M.D.; visualization, Z.K.; supervision, K.C., E.L. and G.P.S. All authors have read and agreed to the published version of the manuscript.

Funding

This work was supported by the 2019-1.2.1-EGYETEM-ÖKO_2019-00013 project implemented with the support provided by the Ministry of Innovation and Technology of Hungary from the National Research, Development and Innovation Fund, funded under the 2019-1.2.1-.EGYETEMI ÖKO funding scheme.

Data Availability Statement

There were no original, raw data generated for this manuscript. Research paper quantitative data were observed from the Web of Science InCites and Web of Science Core Collection databases. For more details on data collection, see Section 2.

Conflicts of Interest

The authors declare no conflict of interest.

References

  1. Fire, M.; Guestrin, C. Over-Optimization of Academic Publishing Metrics: Observing Goodhart’s Law in Action. GigaScience 2019, 8, giz053. [Google Scholar] [CrossRef] [PubMed]
  2. Bornmann, L.; Mutz, R. Growth Rates of Modern Science: A Bibliometric Analysis Based on the Number of Publications and Cited References: Growth Rates of Modern Science: A Bibliometric Analysis Based on the Number of Publications and Cited References. J. Assoc. Inf. Sci. Technol. 2015, 66, 2215–2222. [Google Scholar] [CrossRef]
  3. Fortunato, S.; Bergstrom, C.T.; Börner, K.; Evans, J.A.; Helbing, D.; Milojević, S.; Petersen, A.M.; Radicchi, F.; Sinatra, R.; Uzzi, B.; et al. Science of Science. Science 2018, 359, eaao0185. [Google Scholar] [CrossRef] [PubMed]
  4. Waltman, L. A Review of the Literature on Citation Impact Indicators. J. Informetr. 2016, 10, 365–391. [Google Scholar] [CrossRef]
  5. Miranda, R.; Garcia-Carpintero, E. Comparison of the Share of Documents and Citations from Different Quartile Journals in 25 Research Areas. Scientometrics 2019, 121, 479–501. [Google Scholar] [CrossRef]
  6. Campanario, J.M.; Cabos, W. The Effect of Additional Citations in the Stability of Journal Citation Report Categories. Scientometrics 2014, 98, 1113–1130. [Google Scholar] [CrossRef]
  7. Gorraiz, J.; Ulrych, U.; Glänzel, W.; Arroyo-Machado, W.; Torres-Salinas, D. Measuring the Excellence Contribution at the Journal Level: An Alternative to Garfield’s Impact Factor. Scientometrics 2022. [Google Scholar] [CrossRef]
  8. Ali, M.J. Questioning the Impact of the Impact Factor. A Brief Review and Future Directions. Semin. Ophthalmol. 2022, 37, 91–96. [Google Scholar] [CrossRef]
  9. Kurmis, A.P. Understanding the Limitations of the Journal Impact Factor. J. Bone Jt. Surg. 2003, 85, 2449–2454. [Google Scholar] [CrossRef]
  10. Purkayastha, A.; Palmaro, E.; Falk-Krzesinski, H.J.; Baas, J. Comparison of Two Article-Level, Field-Independent Citation Metrics: Field-Weighted Citation Impact (FWCI) and Relative Citation Ratio (RCR). J. Informetr. 2019, 13, 635–642. [Google Scholar] [CrossRef]
  11. Waltman, L.; van Eck, N.J. Field Normalization of Scientometric Indicators. In Springer Handbook of Science and Technology Indicators; Glänzel, W., Moed, H.F., Schmoch, U., Thelwall, M., Eds.; Springer Handbooks; Springer International Publishing: Cham, Switzerland, 2019; pp. 281–300. ISBN 978-3-030-02510-6. [Google Scholar]
  12. Abramo, G.; D’Angelo, C.A.; Solazzi, M. The Relationship between Scientists’ Research Performance and the Degree of Internationalization of Their Research. Scientometrics 2011, 86, 629–643. [Google Scholar] [CrossRef]
  13. Lancho-Barrantes, B.S.; Guerrero-Bote, V.P.; de Moya-Anegón, F. Citation Increments between Collaborating Countries. Scientometrics 2013, 94, 817–831. [Google Scholar] [CrossRef]
  14. Way, S.F.; Morgan, A.C.; Larremore, D.B.; Clauset, A. Productivity, Prominence, and the Effects of Academic Environment. Proc. Natl. Acad. Sci. USA 2019, 116, 10729–10733. [Google Scholar] [CrossRef]
  15. Cardoso, P.; Fukushima, C.S.; Mammola, S. Quantifying the International Collaboration of Researchers and Research Institutions. MetaArXiv 2021. [Google Scholar] [CrossRef]
  16. Chan, W.W.Y.; Dimmock, C. The Internationalization of Universities: Globalist, Internationalist and Translocalist Models. J. Res. Int. Educ. 2008, 7, 184–204. [Google Scholar] [CrossRef]
  17. De Wit, H.; Altbach, P.G. Internationalization in Higher Education: Global Trends and Recommendations for Its Future. Policy Rev. High. Educ. 2021, 5, 28–46. [Google Scholar] [CrossRef]
  18. Adams, J. The Fourth Age of Research. Nature 2013, 497, 557–560. [Google Scholar] [CrossRef]
  19. Beaver, D. deB The Many Faces of Collaboration and Teamwork in Scientific Research: Updated Reflections on Scientific Collaboration. COLLNET J. Scientometr. Inf. Manag. 2013, 7, 45–54. [Google Scholar] [CrossRef]
  20. Fanelli, D.; Larivière, V. Researchers’ Individual Publication Rate Has Not Increased in a Century. PLoS ONE 2016, 11, e0149504. [Google Scholar] [CrossRef]
  21. Sonnenwald, D.H. Scientific Collaboration. Annu. Rev. Inf. Sci. Technol. 2007, 41, 643–681. [Google Scholar] [CrossRef]
  22. Skopec, M.; Issa, H.; Reed, J.; Harris, M. The Role of Geographic Bias in Knowledge Diffusion: A Systematic Review and Narrative Synthesis. Res. Integr. Peer Rev. 2020, 5, 2. [Google Scholar] [CrossRef] [PubMed]
  23. Gomez, C.J.; Herman, A.C.; Parigi, P. Leading Countries in Global Science Increasingly Receive More Citations than Other Countries Doing Similar Research. Nat. Hum. Behav. 2022, 6, 919–929. [Google Scholar] [CrossRef] [PubMed]
  24. Bornmann, L.; Stefaner, M.; de Moya Anegón, F.; Mutz, R. What Is the Effect of Country-Specific Characteristics on the Research Performance of Scientific Institutions? Using Multi-Level Statistical Models to Rank and Map Universities and Research-Focused Institutions Worldwide. J. Informetr. 2014, 8, 581–593. [Google Scholar] [CrossRef]
  25. Nielsen, M.W.; Andersen, J.P. Global Citation Inequality Is on the Rise. Proc. Natl. Acad. Sci. USA 2021, 118, e2012208118. [Google Scholar] [CrossRef]
  26. Cary, M.; Rockwell, T. International Collaboration in Open Access Publications: How Income Shapes International Collaboration. Publications 2020, 8, 13. [Google Scholar] [CrossRef]
  27. Bonitz, M.; Bruckner, E.; Scharnhorst, A. Characteristics and Impact of the Matthew Effect for Countries. Scientometrics 1997, 40, 407–422. [Google Scholar] [CrossRef]
  28. Salager-Meyer, F. Scientific Publishing in Developing Countries: Challenges for the Future. J. Engl. Acad. Purp. 2008, 7, 121–132. [Google Scholar] [CrossRef]
  29. European Commission. Directorate General for Research and Innovation. Science, Research and Innovation Performance of the EU, 2020: A Fair, Green and Digital Europe; Publications Office: Luxembourg, 2020. [Google Scholar]
  30. Dobbins, M. Higher Education Policies in Central and Eastern Europe; Palgrave Macmillan: London, UK, 2011; ISBN 978-1-349-33199-4. [Google Scholar]
  31. Dobbins, M.; Kwiek, M. Europeanisation and Globalisation in Higher Education in Central and Eastern Europe: 25 Years of Changes Revisited (1990–2015). Eur. Educ. Res. J. 2017, 16, 519–528. [Google Scholar] [CrossRef]
  32. Kwiek, M. Poland: A Decade of Reforms (2010–2020). Int. High. Educ. 2021, 106, 36–38. [Google Scholar] [CrossRef]
  33. Szuflita-Żurawska, M.; Basińska, B.A. Visegrád Countries’ Scientific Productivity in the European Context: A 10-year Perspective Using Web of Science and Scopus. Learn. Publ. 2021, 34, 347–357. [Google Scholar] [CrossRef]
  34. Yegros-Yegros, A.; Rafols, I.; D’Este, P. Does Interdisciplinary Research Lead to Higher Citation Impact? The Different Effect of Proximal and Distal Interdisciplinarity. PLoS ONE 2015, 10, e0135095. [Google Scholar] [CrossRef] [PubMed]
  35. Milojević, S. Nature, Science, and PNAS: Disciplinary Profiles and Impact. Scientometrics 2020, 123, 1301–1315. [Google Scholar] [CrossRef]
  36. Borchardt, R.; Moran, C.; Cantrill, S.; Oh, S.A.; Hartings, M.R. Perception of the Importance of Chemistry Research Papers and Comparison to Citation Rates. PLoS ONE 2018, 13, e0194903. [Google Scholar] [CrossRef] [PubMed]
  37. Szomszor, M.; Adams, J.; Fry, R.; Gebert, C.; Pendlebury, D.A.; Potter, R.W.K.; Rogers, G. Interpreting Bibliometric Data. Front. Res. Metr. Anal. 2021, 5, 628703. [Google Scholar] [CrossRef] [PubMed]
  38. Adams, J.; Gurney, K.A. Bilateral and Multilateral Coauthorship and Citation Impact: Patterns in UK and US International Collaboration. Front. Res. Metr. Anal. 2018, 3, 12. [Google Scholar] [CrossRef]
  39. Adams, J.D.; Black, G.C.; Clemmons, J.R.; Stephan, P.E. Scientific Teams and Institutional Collaborations: Evidence from U.S. Universities, 1981–1999. Res. Policy 2005, 34, 259–285. [Google Scholar] [CrossRef]
  40. McNutt, M.K.; Bradford, M.; Drazen, J.M.; Hanson, B.; Howard, B.; Jamieson, K.H.; Kiermer, V.; Marcus, E.; Pope, B.K.; Schekman, R.; et al. Transparency in Authors’ Contributions and Responsibilities to Promote Integrity in Scientific Publication. Proc. Natl. Acad. Sci. USA 2018, 115, 2557–2560. [Google Scholar] [CrossRef]
  41. Yu, J.; Yin, C. The Relationship between the Corresponding Author and Its Byline Position: An Investigation Based on the Academic Big Data. J. Phys. Conf. Ser. 2021, 1883, 012129. [Google Scholar] [CrossRef]
  42. Smith, M.J.; Weinberger, C.; Bruna, E.M.; Allesina, S. The Scientific Impact of Nations: Journal Placement and Citation Performance. PLoS ONE 2014, 9, e109195. [Google Scholar] [CrossRef]
  43. Vȋiu, G.-A.; Păunescu, M. The Lack of Meaningful Boundary Differences between Journal Impact Factor Quartiles Undermines Their Independent Use in Research Evaluation. Scientometrics 2021, 126, 1495–1525. [Google Scholar] [CrossRef]
  44. Orbay, K.; Miranda, R.; Orbay, M. Invited Article: Building Journal Impact Factor Quartile into the Assessment of Academic Performance: A Case Study. Particip. Educ. Res. 2020, 7, 1–13. [Google Scholar] [CrossRef]
  45. Dusdal, J.; Powell, J.J.W. Benefits, Motivations, and Challenges of International Collaborative Research: A Sociology of Science Case Study. Sci. Public Policy 2021, 48, 235–245. [Google Scholar] [CrossRef]
  46. Edwards, H.A.; Schroeder, J.; Dugdale, H.L. Gender Differences in Authorships Are Not Associated with Publication Bias in an Evolutionary Journal. PLoS ONE 2018, 13, e0201725. [Google Scholar] [CrossRef] [PubMed]
  47. Opthof, T. The Significance of the Peer Review Process against the Background of Bias: Priority Ratings of Reviewers and Editors and the Prediction of Citation, the Role of Geographical Bias. Cardiovasc. Res. 2002, 56, 339–346. [Google Scholar] [CrossRef]
  48. Paris, G.; De Leo, G.; Menozzi, P.; Gatto, M. Region-Based Citation Bias in Science. Nature 1998, 396, 210. [Google Scholar] [CrossRef]
  49. Chinchilla-Rodríguez, Z.; Sugimoto, C.R.; Larivière, V. Follow the Leader: On the Relationship between Leadership and Scholarly Impact in International Collaborations. PLoS ONE 2019, 14, e0218309. [Google Scholar] [CrossRef] [Green Version]
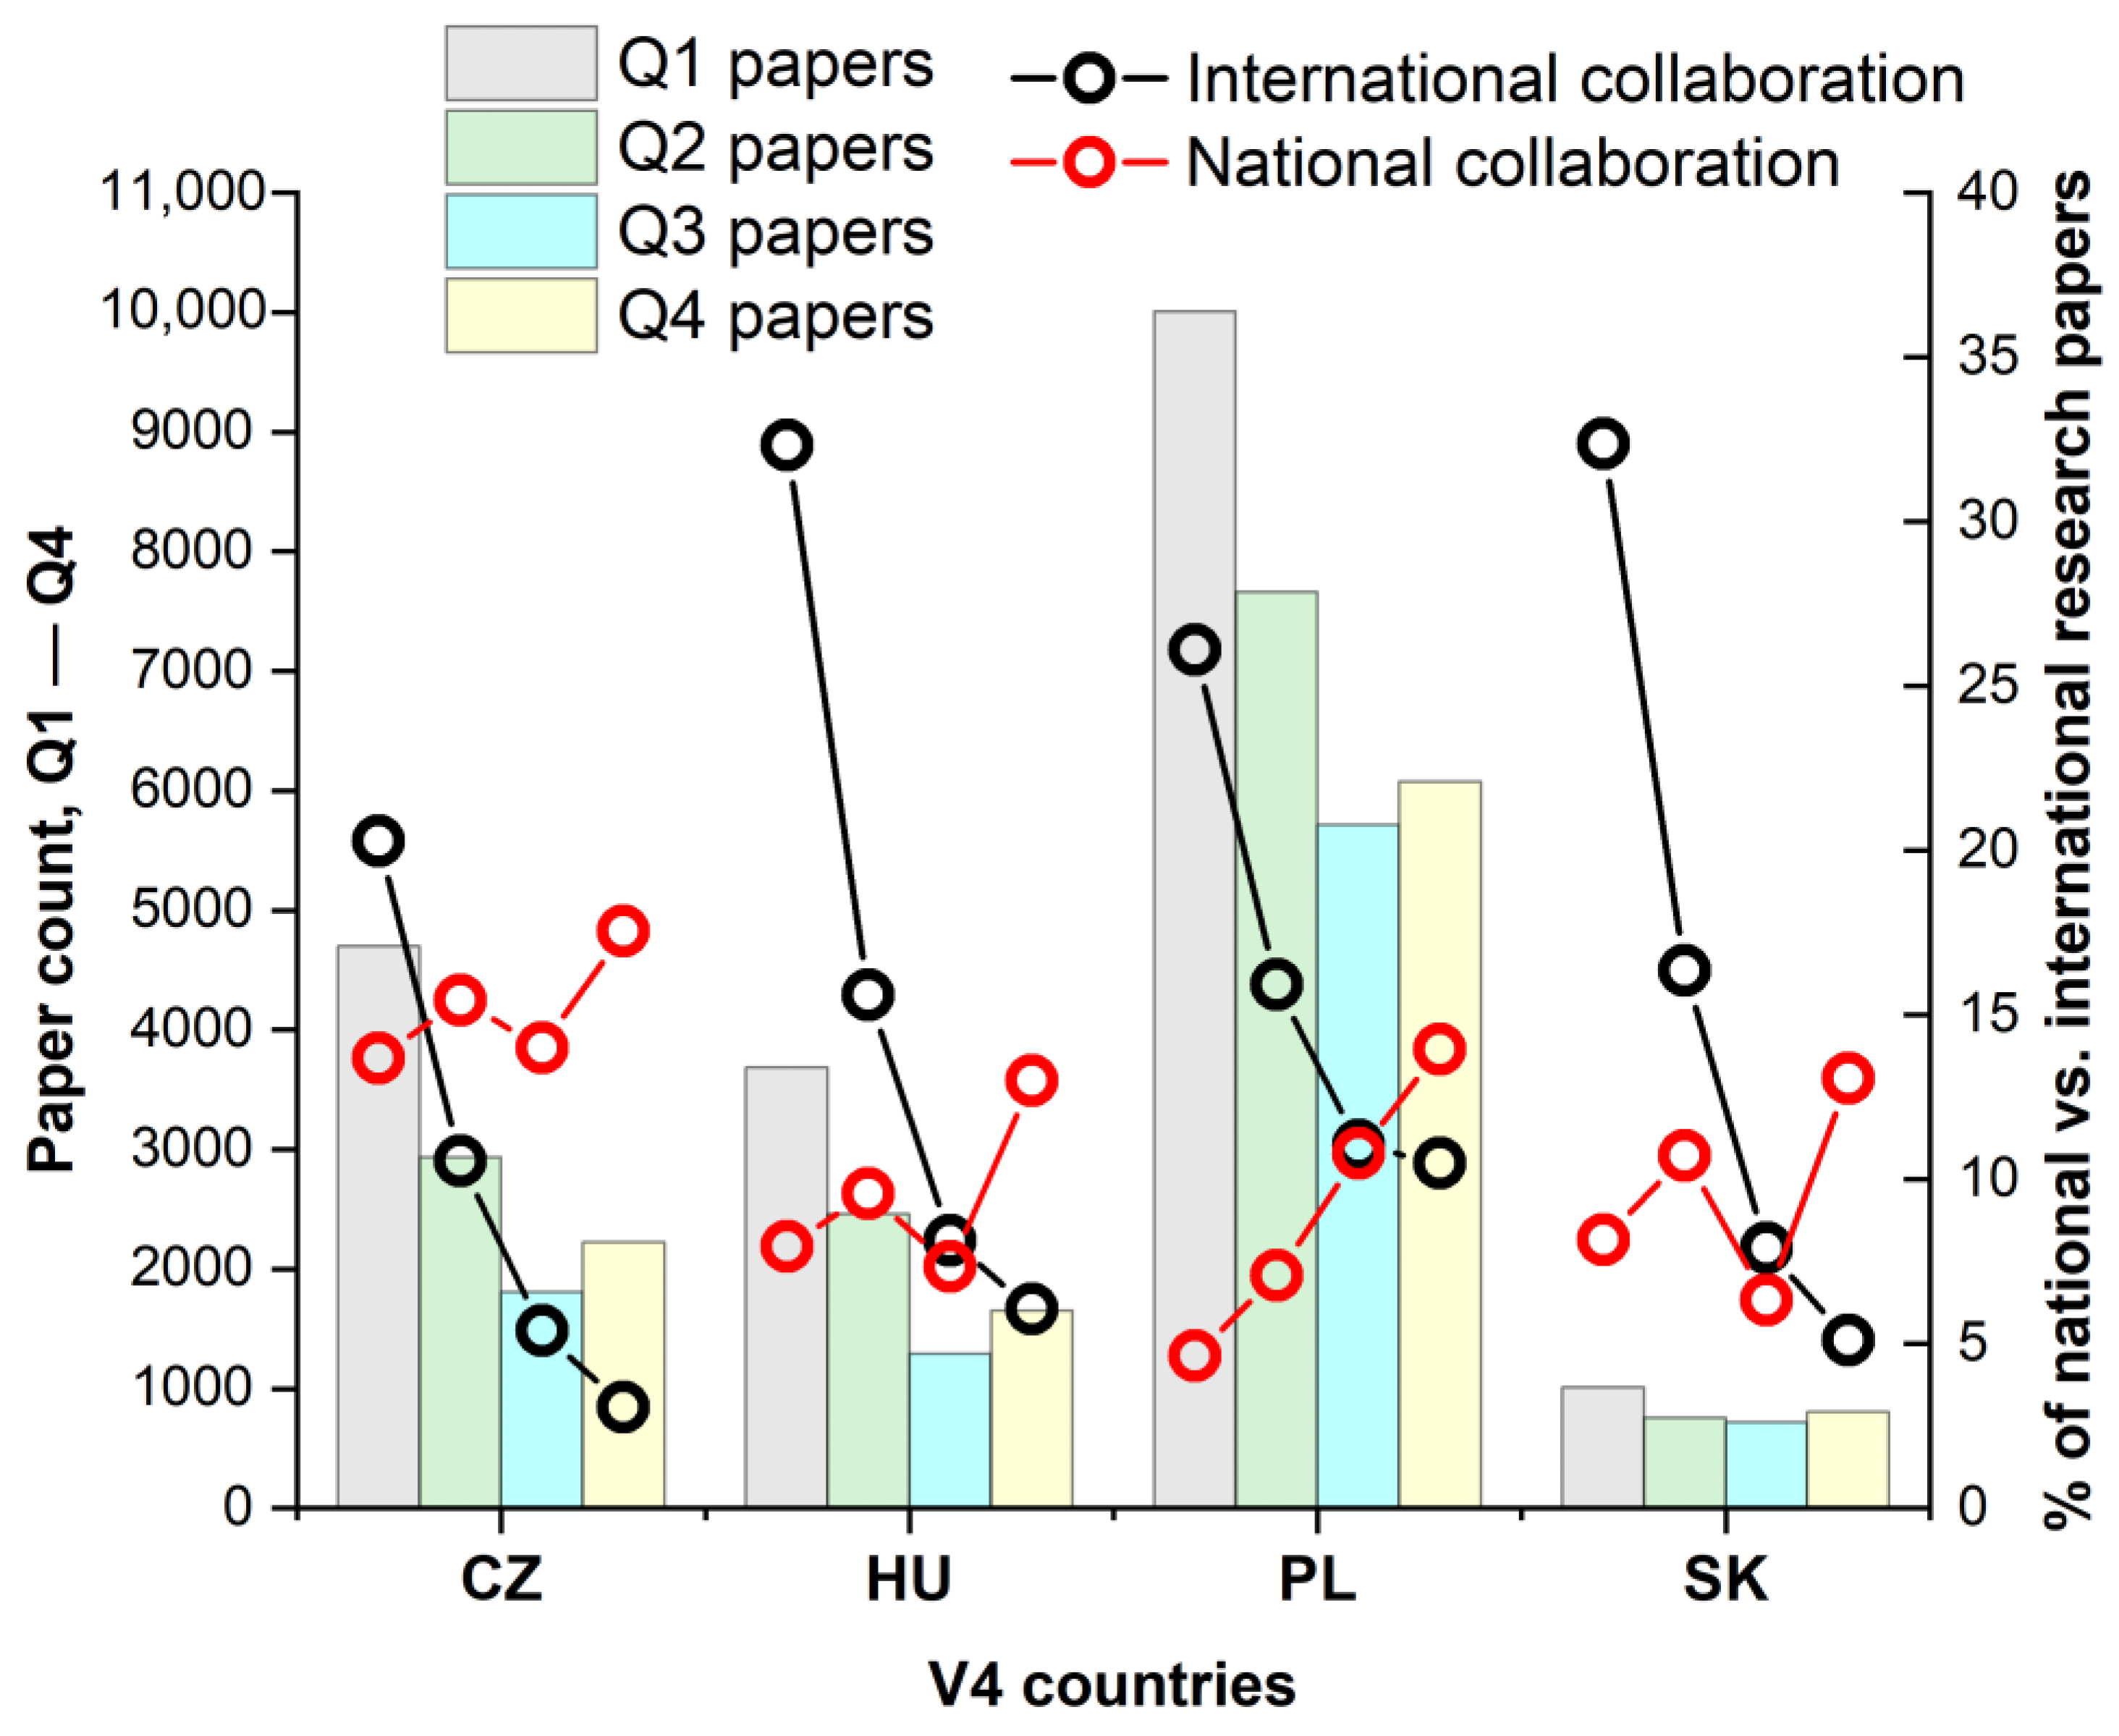
Figure 1. The total number and distribution of all papers and research articles in national and international collaboration among V4 countries as a function of the JIF quartile. The left Y axe shows the total number of paper counts. The right Y axe shows the percentage of research papers in international and national collaboration to all research articles for the given V4 country. Abbreviations: CZ = Czech Republic, HU = Hungary, PL = Poland, SK = Slovakia.
Publications 10 00035 g001
Figure 2. Comparison of JIF of research papers published in Q1–Q4 journals by V4 countries, as a function of collaboration type. The Y corresponds to the median level of JIF. Abbreviations: CZ = Czech Republic, HU = Hungary, PL = Poland, SK = Slovakia.
Publications 10 00035 g002
Figure 3. Comparison of category normalized citation impact (CNCI) of research papers published in Q1–Q4 journals by V4 countries, as a function of collaboration type. The Y corresponds to the median level of CNCI. Abbreviations: CZ = Czech Republic, HU = Hungary, PL = Poland, SK = Slovakia.
Publications 10 00035 g003
Figure 4. Scientific impact (JIF and CNCI) as a function of the country of affiliation of corresponding authors in the Czech Republic. JIF and CNCI were plotted against the country of origin of the corresponding authors. Open circles represent the observed IF and CNCI values; black line corresponds to the calculated median value. Red open circles: Czech Republic; green open circle: countries with an observed significant difference. The order of plotted countries corresponds to the calculated median value. Insets: For better visibility, the same results were plotted as a box plot. The black line corresponds to the median value, the bottom and top lines show the 1st and 3rd quartile and whiskers show 10–90% outliers. Abbreviations: AT = Austria, BE = Belgium, CA = Canada, CZ = Czech Republic, ES = Spain, GB = England, FR = France, GE = Germany, IT = Italy, NL = the Netherlands, USA = United States.
Publications 10 00035 g004
Figure 5. Scientific impact (JIF and CNCI) as a function of the country of affiliation of corresponding authors in Hungary. Red open circles: Hungary; green open circle: countries with an observed significant difference; open grey circles: no significant difference between the V4 and compared country. Abbreviations: AT = Austria, CA = Canada, CH = Switzerland, ES = Spain, GB = England, FR = France, GE = Germany, HU = Hungary, IT = Italy, NL = the Netherlands, USA = United States.
Publications 10 00035 g005
Figure 6. Scientific impact (JIF and CNCI) as a function of the country of affiliation of corresponding authors in Poland. Red open circles: Poland; green open circle: countries with an observed significant difference; open grey circles: no significant difference between the V4 and compared country. Abbreviations: BE = Belgium, CA = Canada, CH = Switzerland, ES = Spain, GB = England, FR = France, GE = Germany, IT = Italy, NL = the Netherlands, PL = Poland, USA = United States.
Publications 10 00035 g006
Figure 7. Scientific impact (JIF and CNCI) as a function of the country of affiliation of corresponding authors in Slovakia. Red open circles: Slovakia; green open circle: countries with an observed significant difference; open grey circles: no significant difference between the V4 and compared country. Abbreviations: AT = Austria, BE = Belgium, CZ = Czech Republic, ES = Spain, GB = England, FR = France, GE = Germany, IT = Italy, NL = the Netherlands, PL = Poland, SK = Slovakia.
Publications 10 00035 g007
Table 1. The total number of research papers in international and national collaboration as a function of the JIF quartile. The distribution of Q1–Q4 research papers for each V4 country in international and national collaboration was observed from the InCites database. N corresponds to the number of research articles; Internat. = international collaboration.
Czech RepublicHungaryPolandSlovakia
JIF QuartileInternat.
(N)
National
(N)
Internat.
(N)
National
(N)
Internat.
(N)
National
(N)
Internat.
(N)
National
(N)
Q13772906294473359803924861152
Q218211086148794431114428525228
Q395183971955015914025364348
Q4707146346511069085032346451
Table 2. The observed levels of significance when comparing the impact factor of research papers published in international and national collaboration.
JIF QuartileCZHUPLSK
Q1************
Q2*******NS
Q3NSNSNS***
Q4********NS
The level of significance is marked by starts: ** p < 0.01; *** p < 0.001; NS = not significant.
Table 3. The observed levels of significance when comparing the category normalized citation Impact of research papers published in international and national collaboration.
JIF QuartileCZHUPLSK
Q1************
Q2************
Q3***********
Q4**********
The level of significance is marked by starts: * p < 0.05; ** p < 0.01; *** p < 0.001.
Table 4. The total number of Q1 papers coauthored by the top 10 countries for each V4 country.
Czech RepublicHungaryPolandSlovakia
CountryPaper (N)CountryPaper (N)CountryPaper (N)CountryPaper (N)
Czech Republic800Hungary650Poland1401Slovakia164
USA534USA467USA853Czech Republic91
Germany381Germany320Germany532Germany60
England263England199England430England53
Italy228Italy149Italy391Italy52
Netherlands170Netherlands115Netherlands283Netherlands41
France152Austria95France214Austria40
Canada112France94Canada176Poland32
Spain105Spain91Spain168France31
Belgium99Canada84Switzerland157Spain21
Austria90Switzerland71Belgium131Belgium17
Publisher’s Note: MDPI stays neutral with regard to jurisdictional claims in published maps and institutional affiliations.