Modular Deep-Learning Pipelines for Dental Caries Data Streams: A Twin-Cohort Proof-of-Concept
Abstract
1. Introduction
1.1. The Public Health and Clinical Burden of Dental Caries
1.2. Advances in Microbial and Host Profiling
1.3. The Role of Artificial Intelligence in Dental Imaging and Omics
1.4. Study Objective and Conceptual Framework
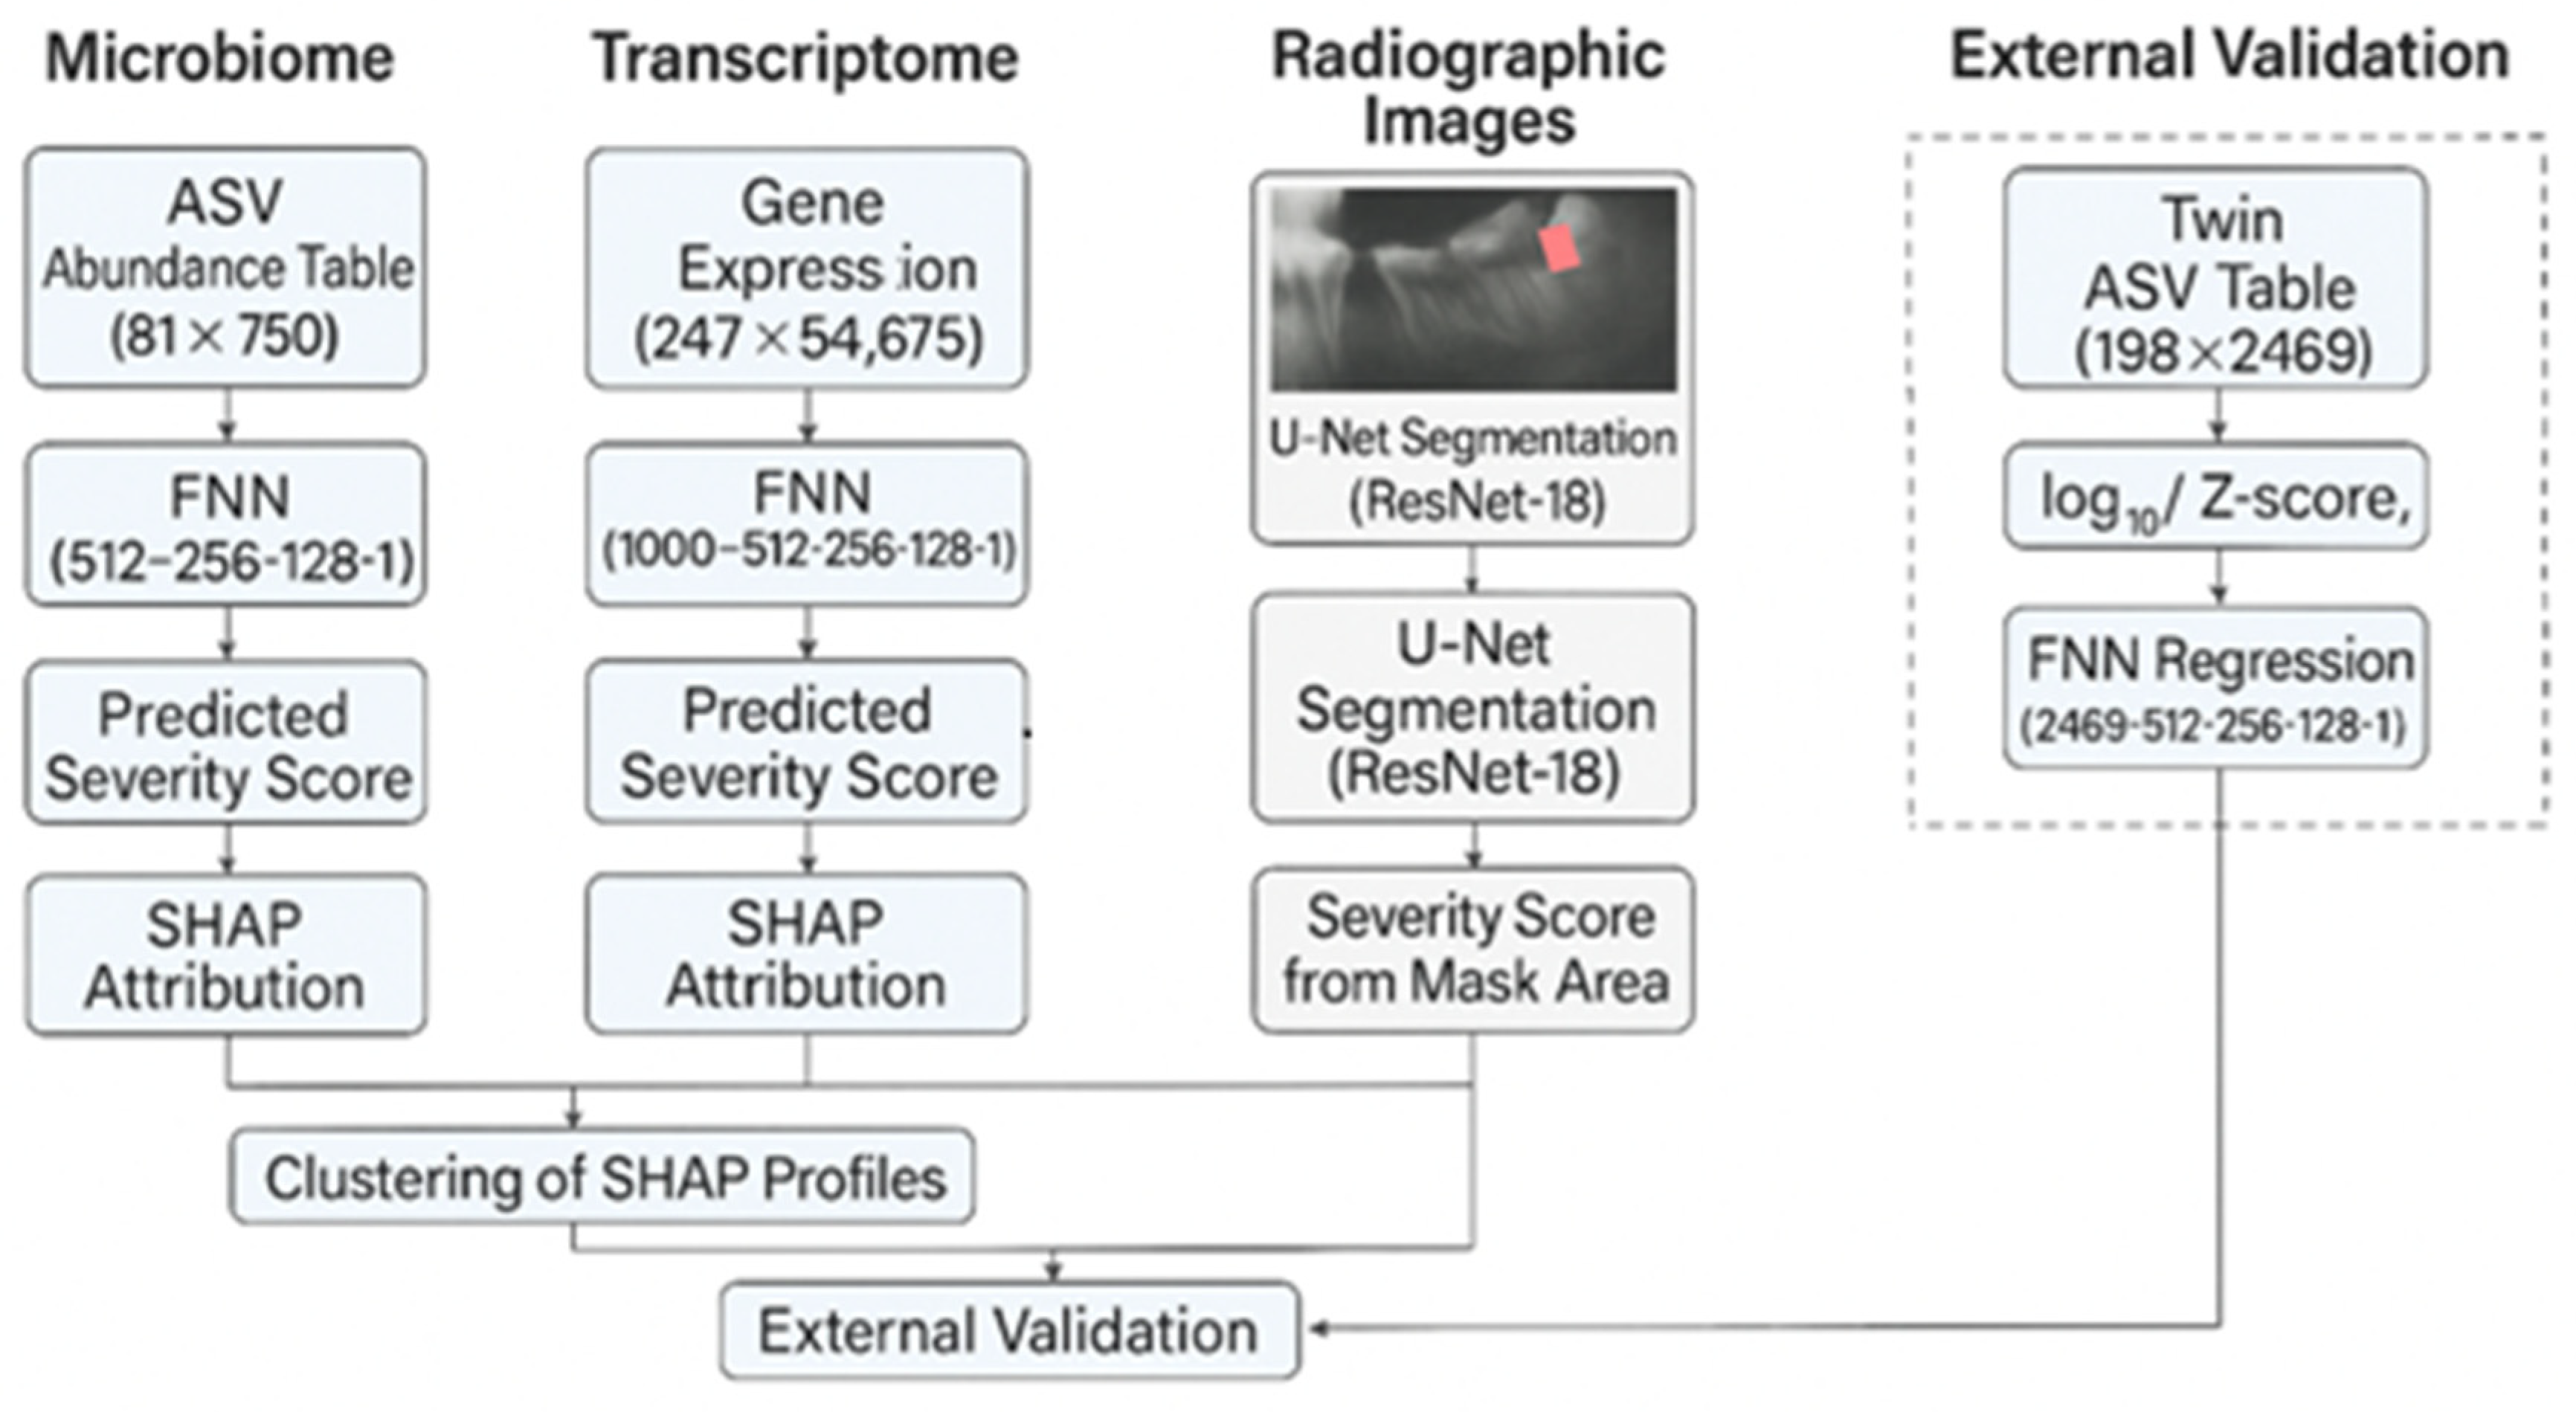
- A U-Net with a ResNet-18 encoder was trained on 100 expert-annotated panoramic images to compute a continuous caries-severity score based on predicted lesion area.
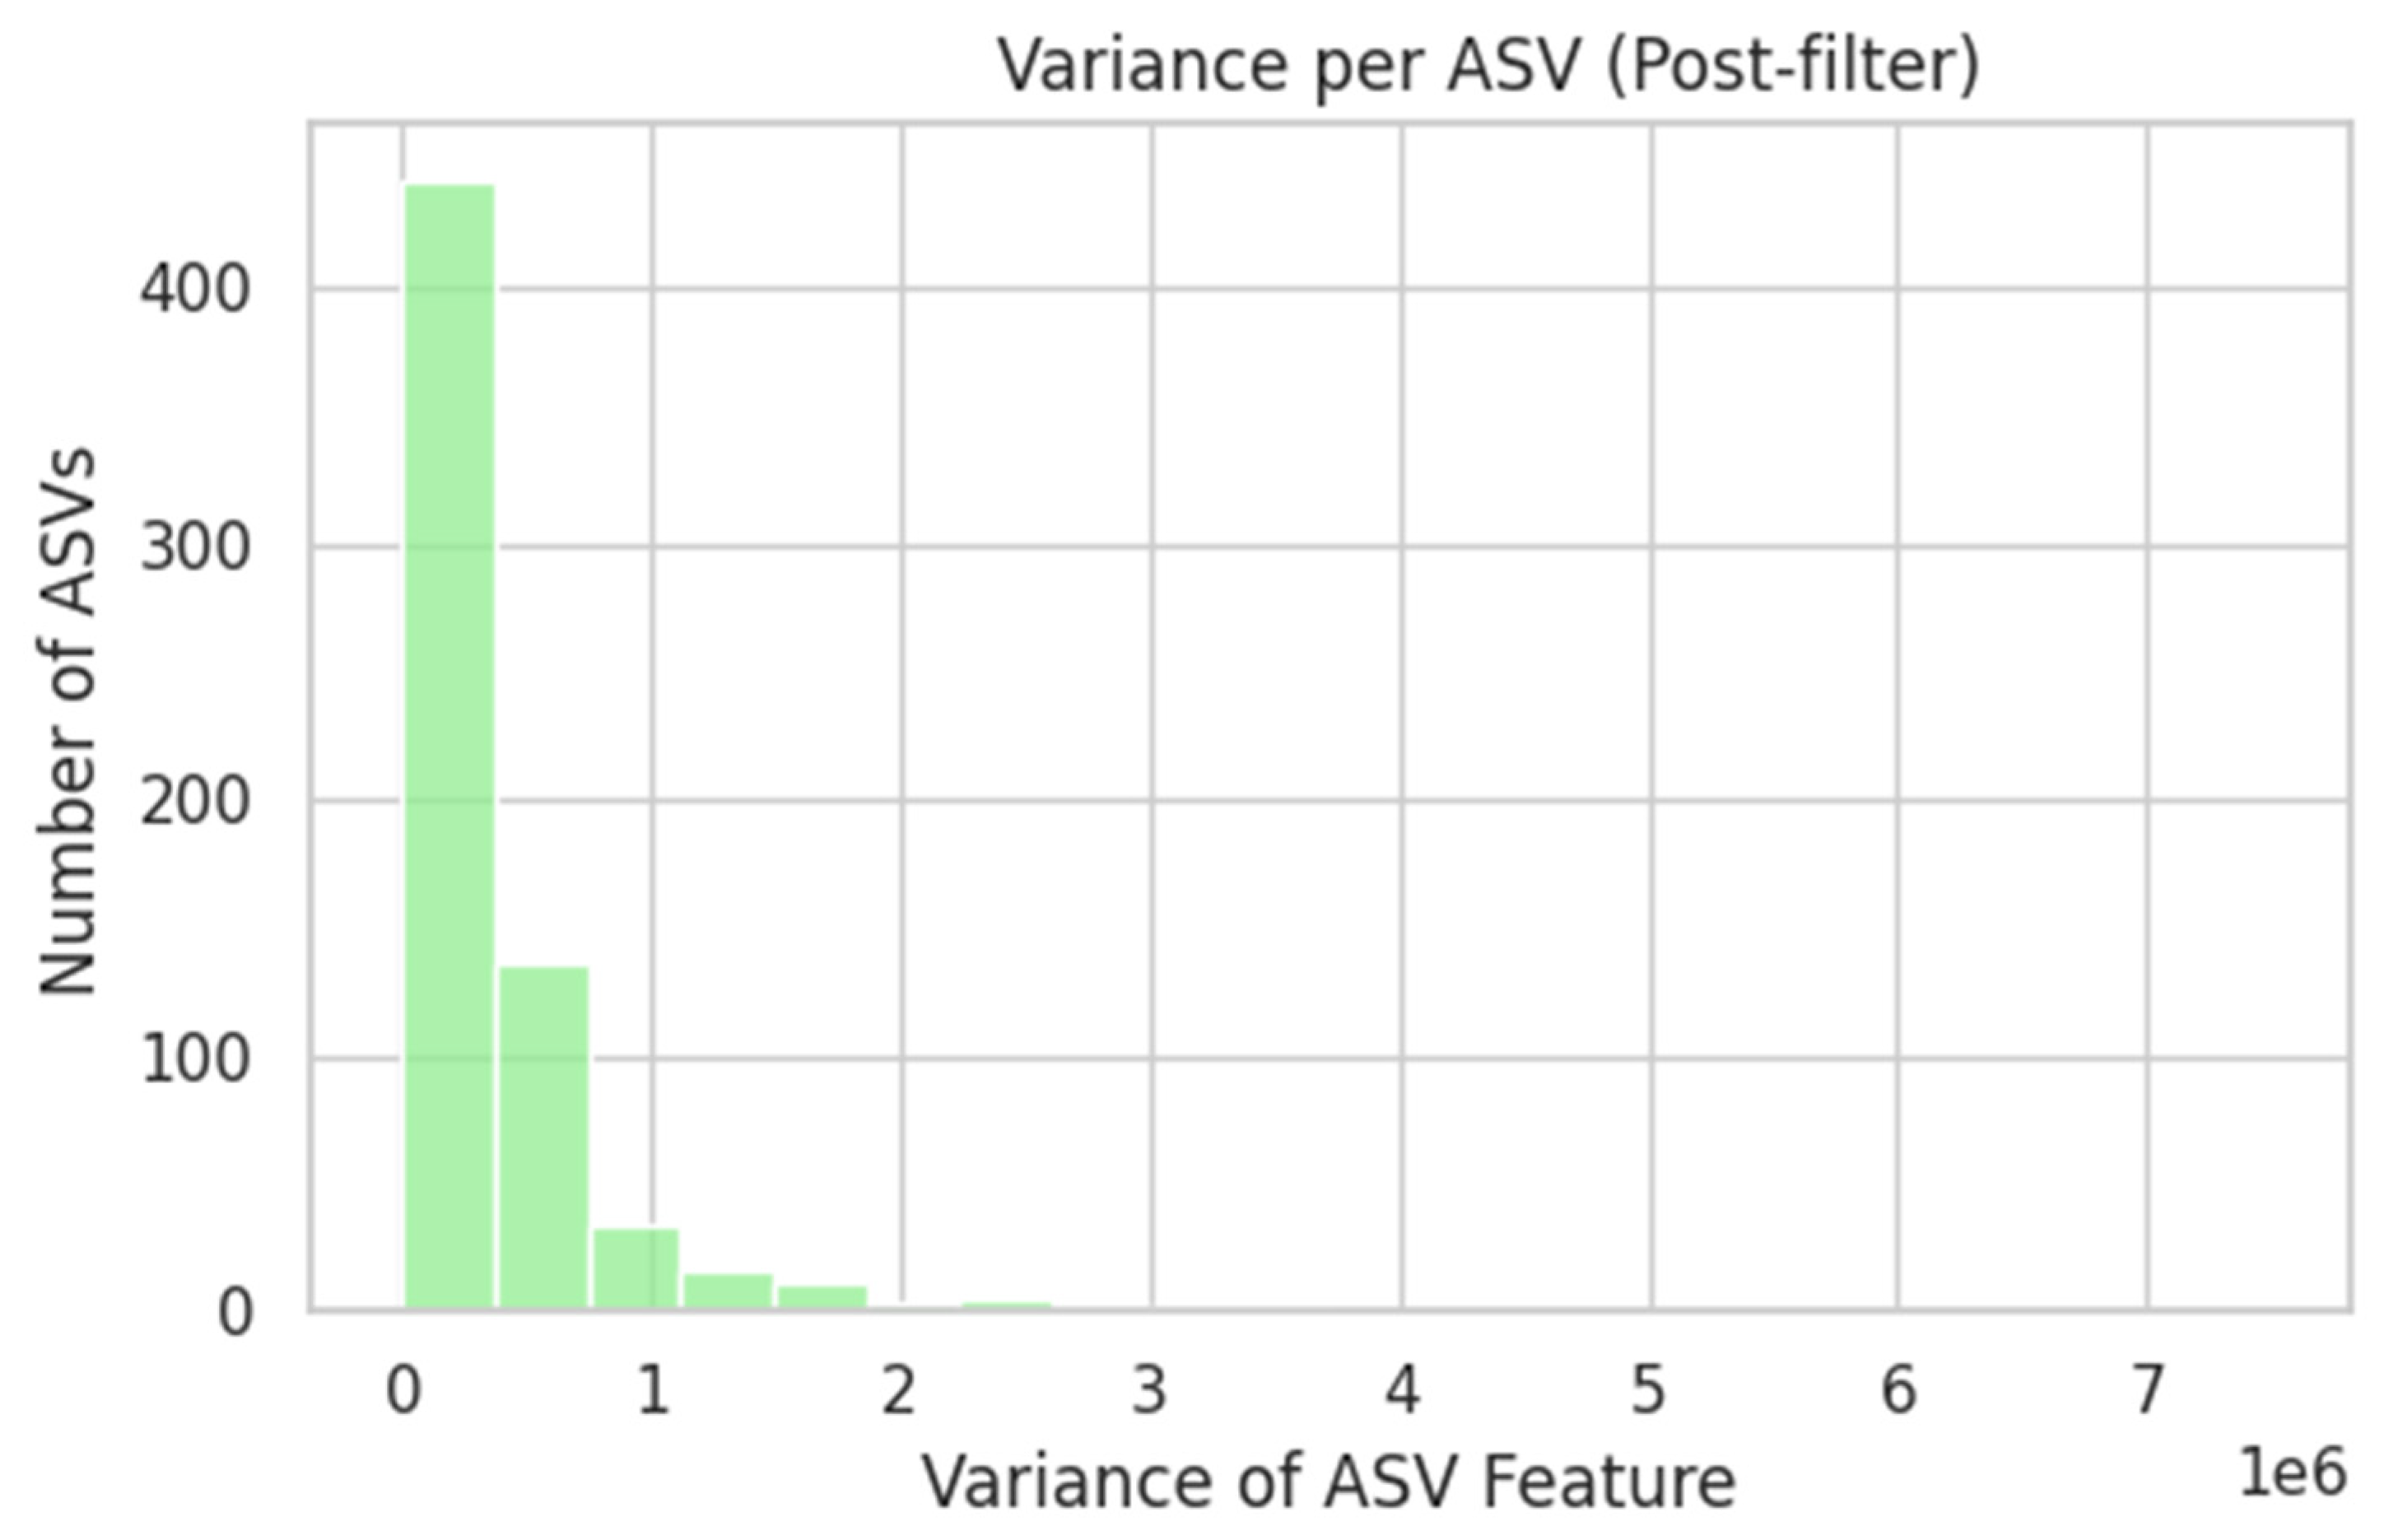
- A feed-forward neural network (FNN) was fitted to 81 supragingival 16S rRNA amplicon sequence-variant (ASV) profiles (750 taxa) following log-transformation, prevalence filtering, and Z-scoring.
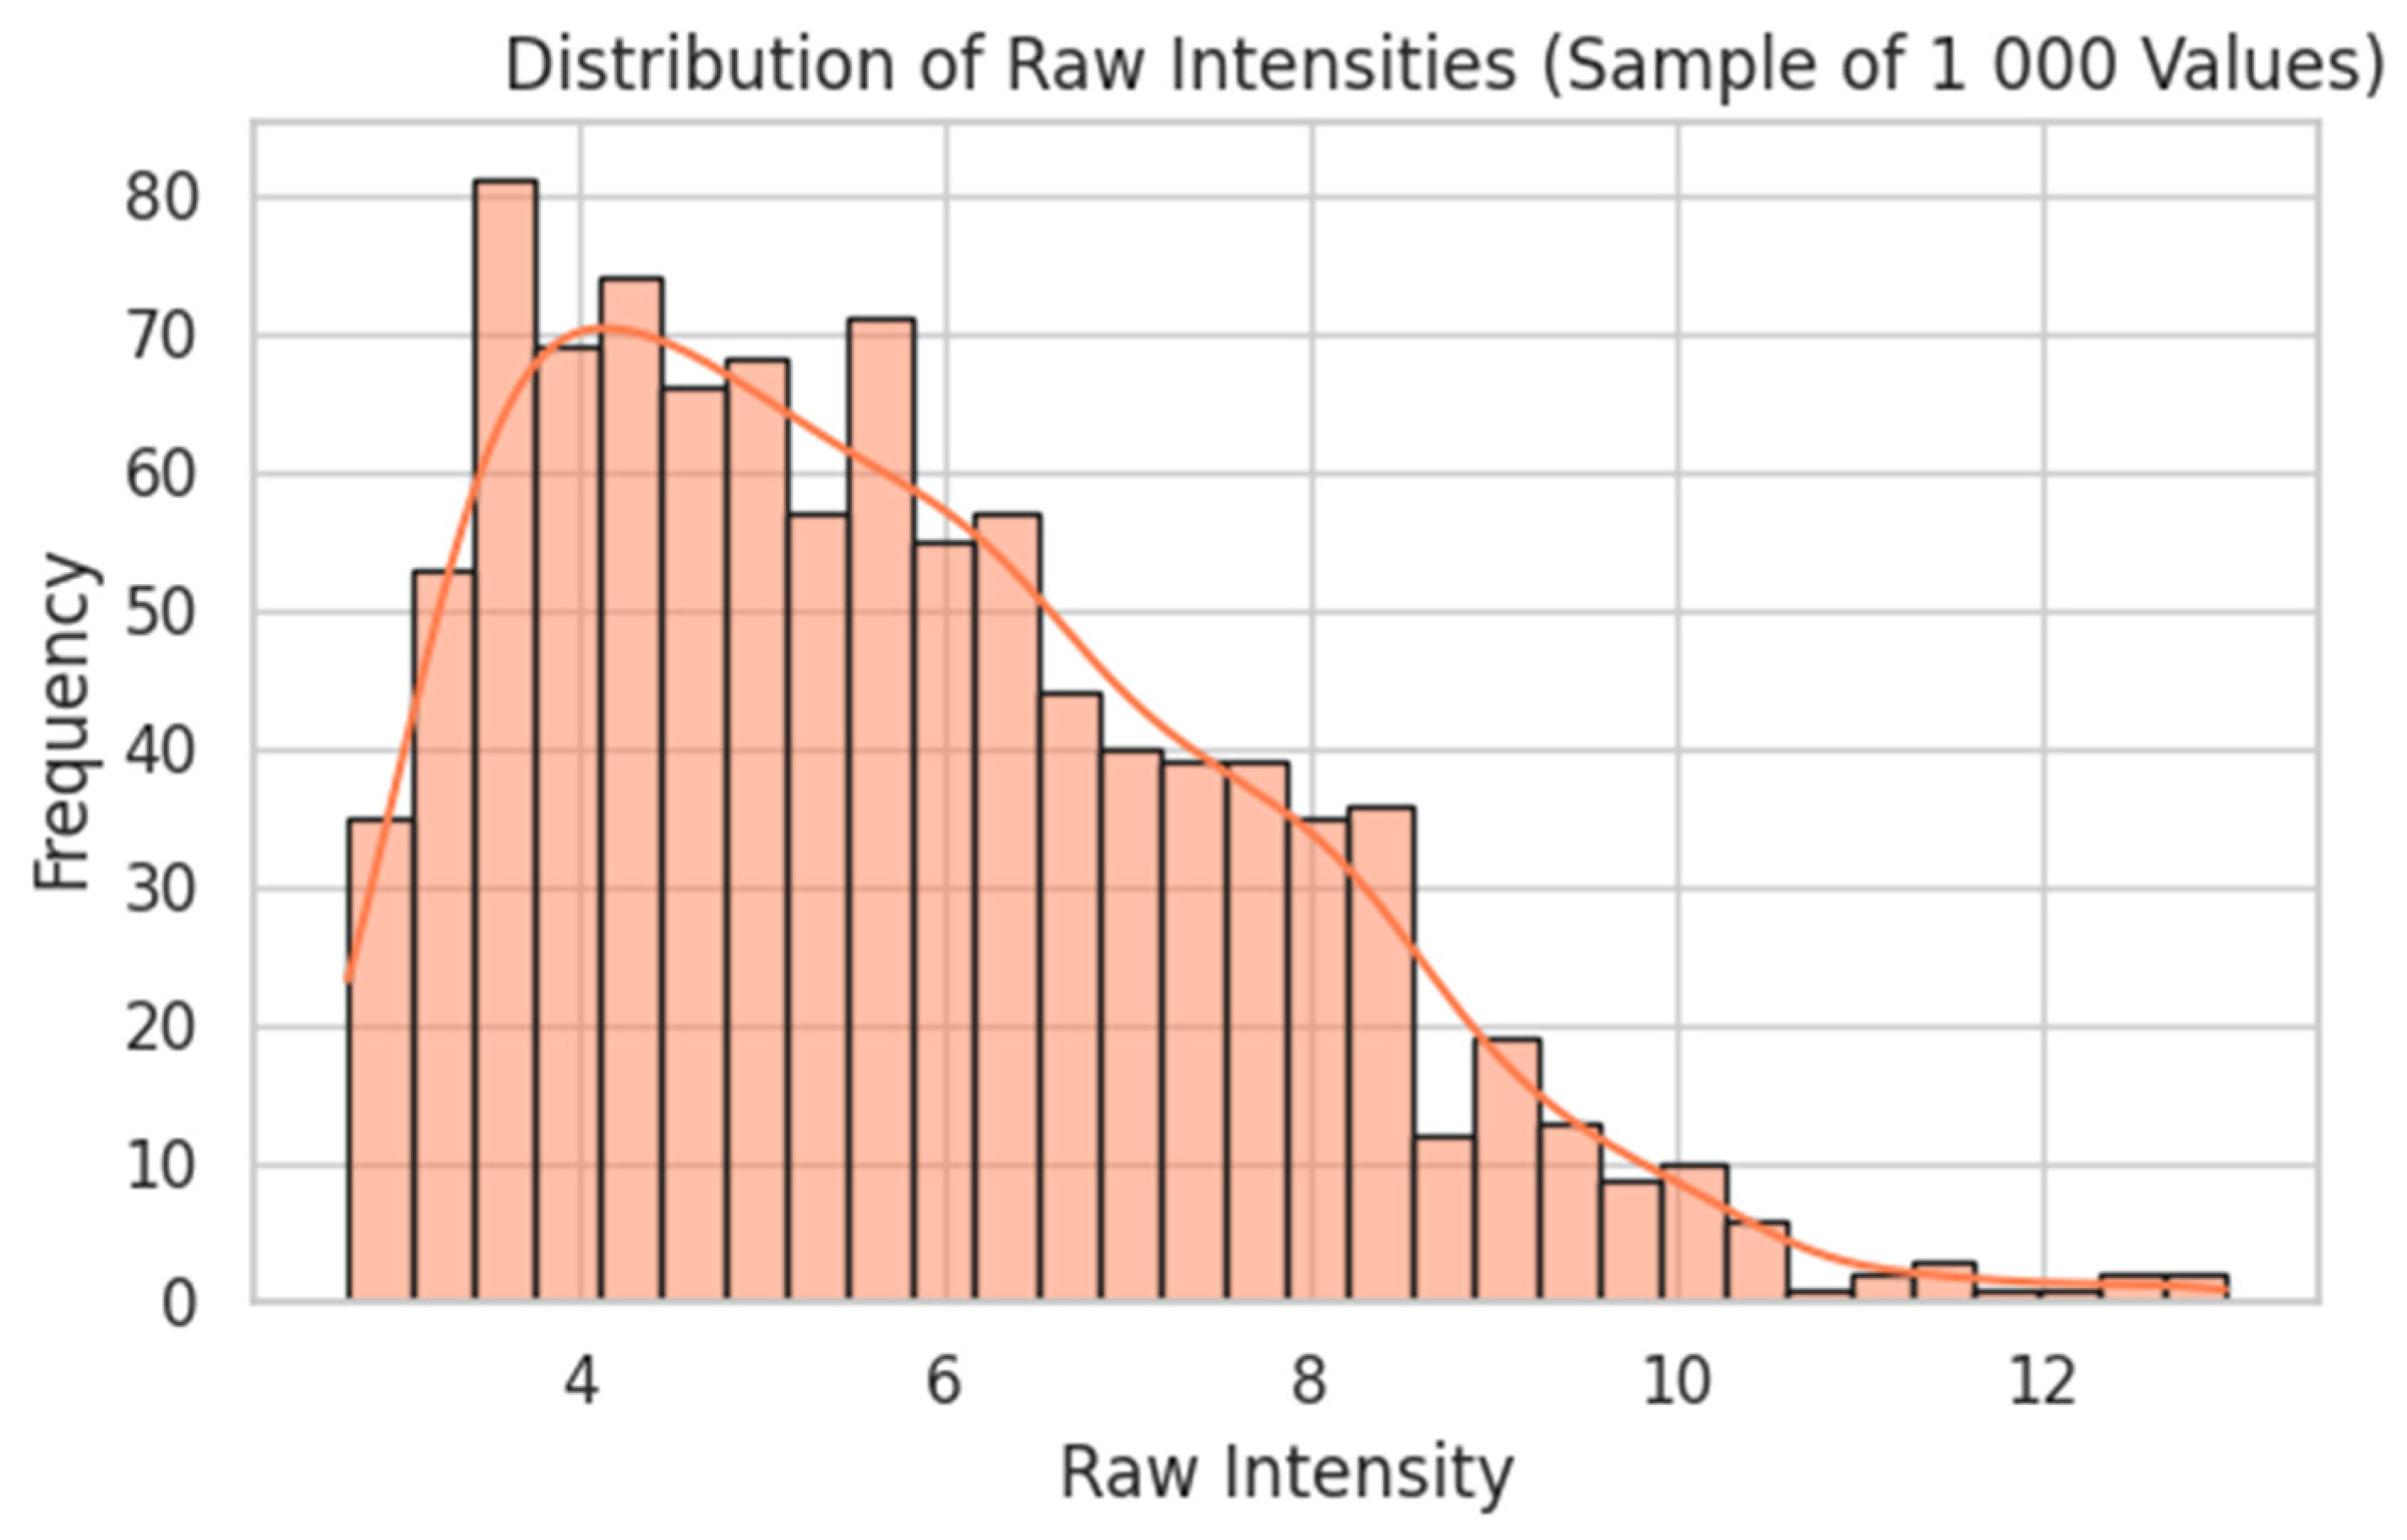
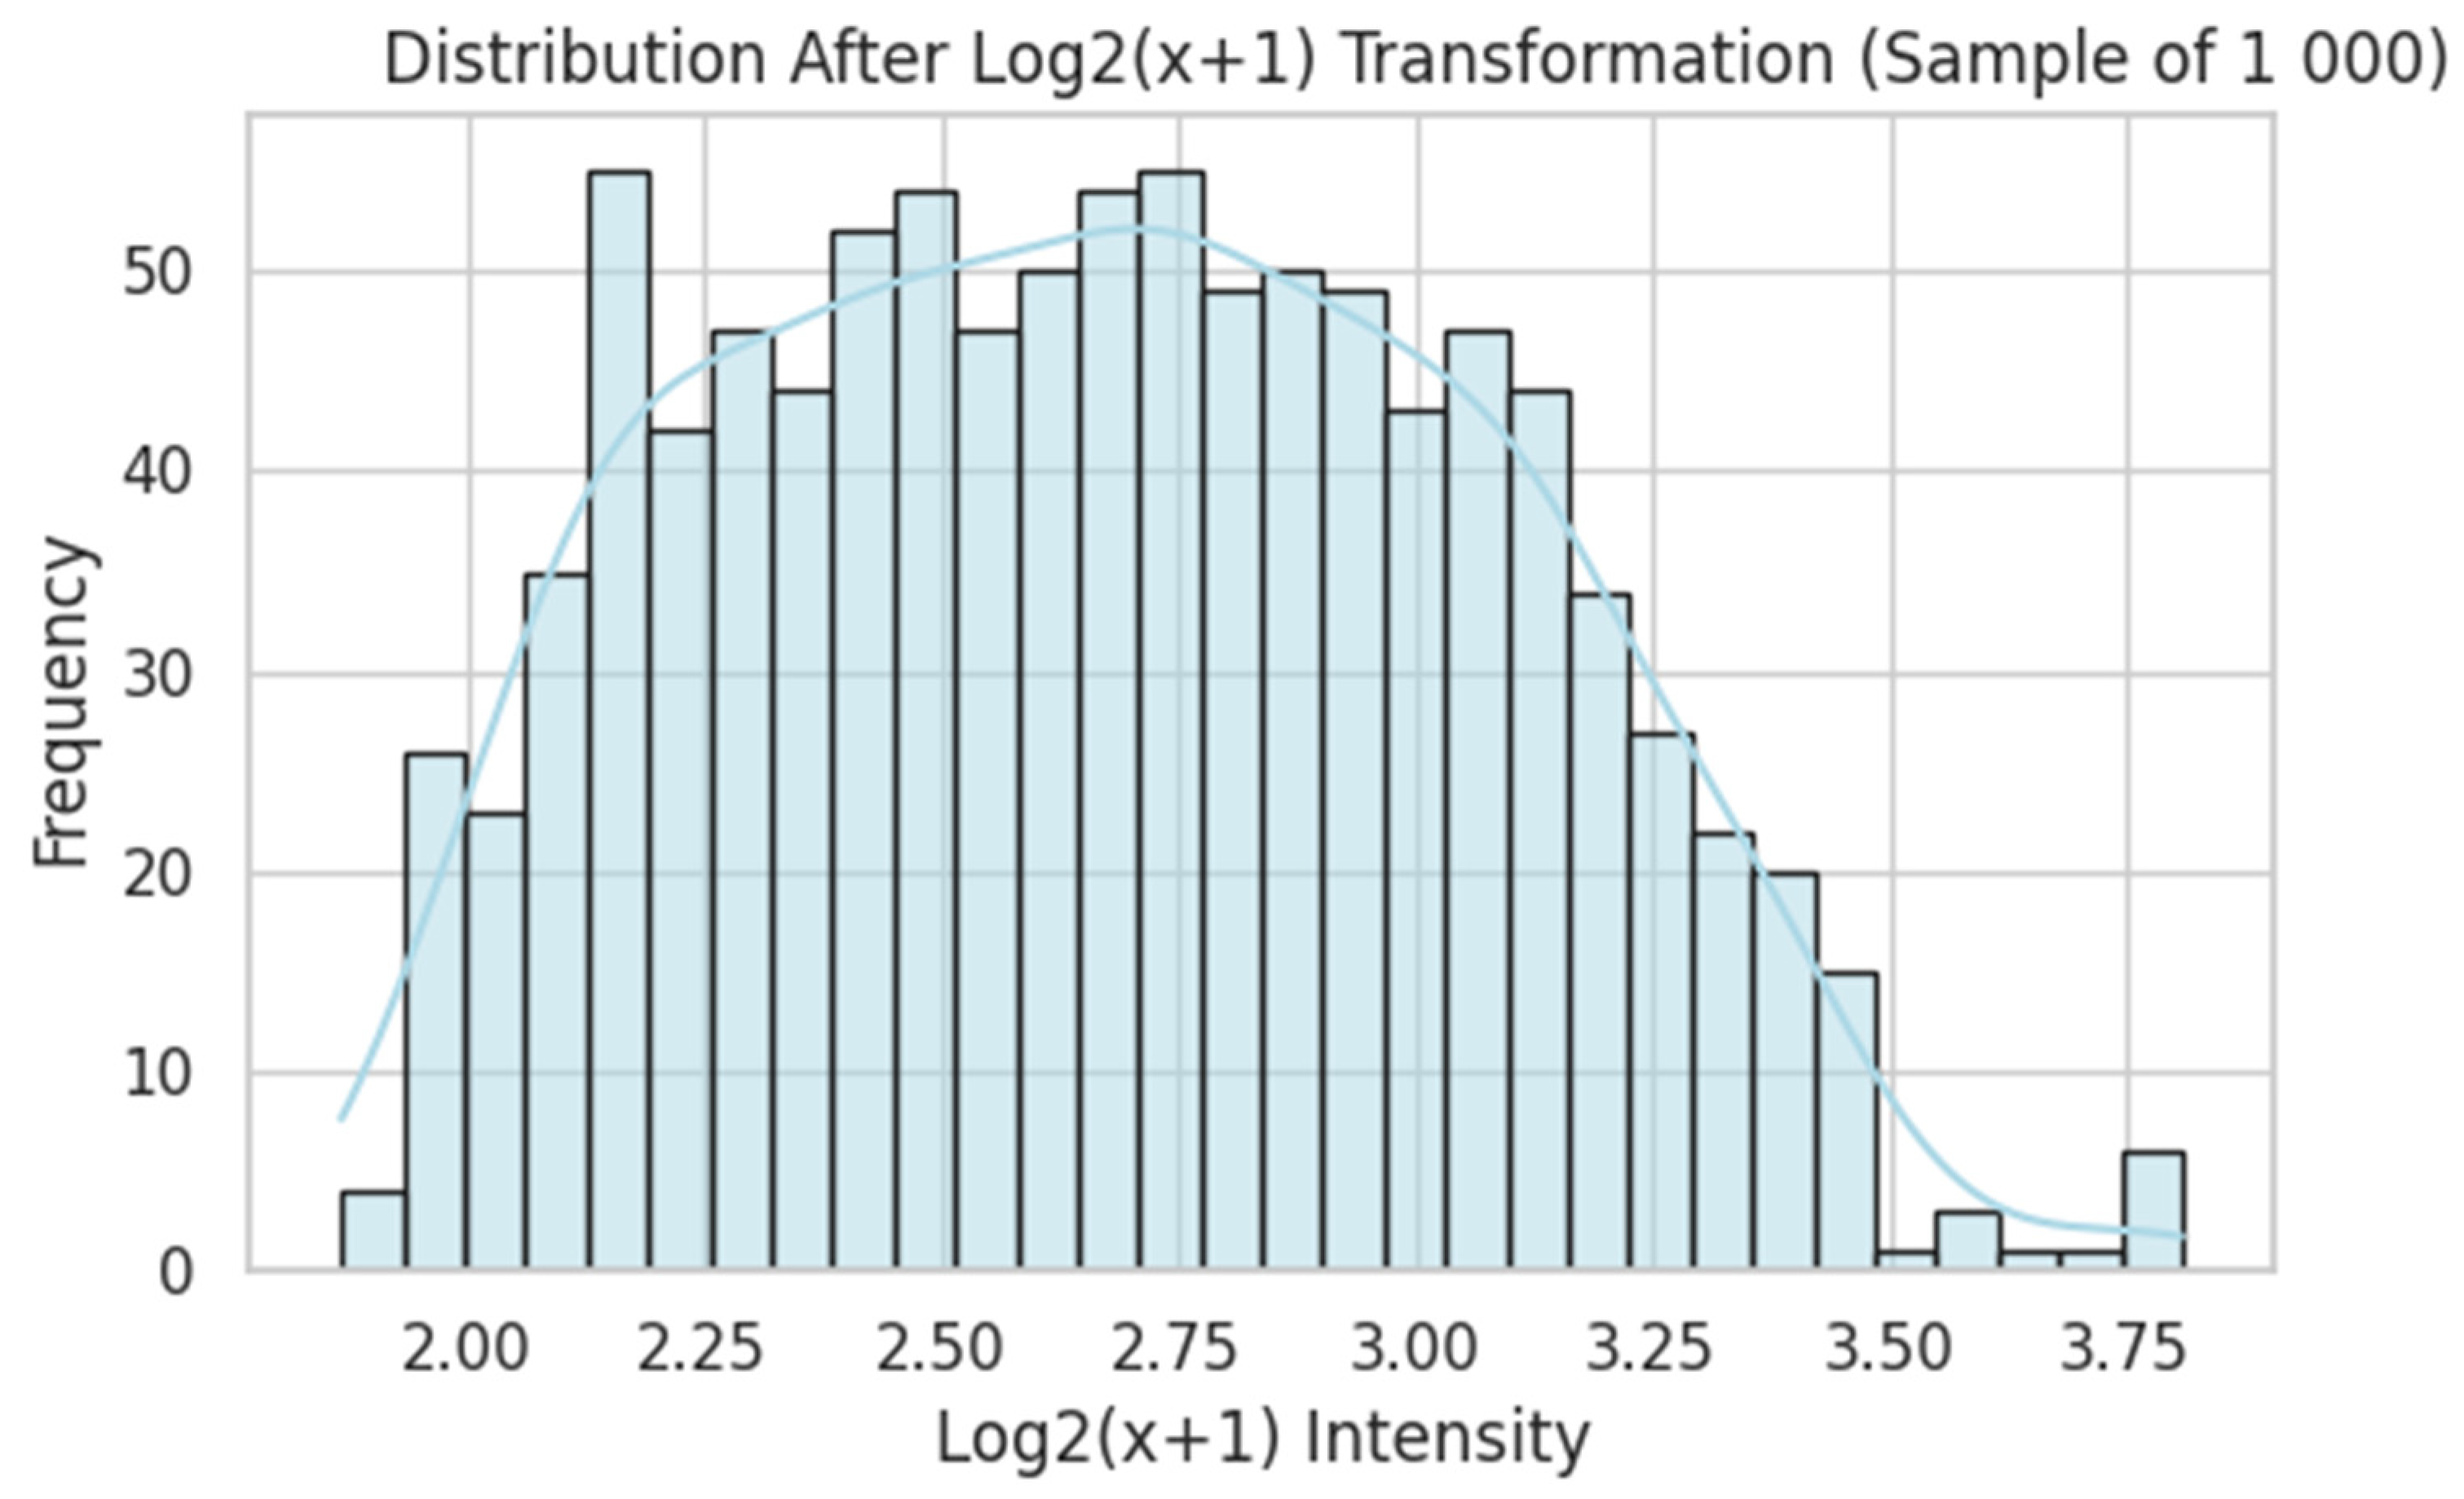
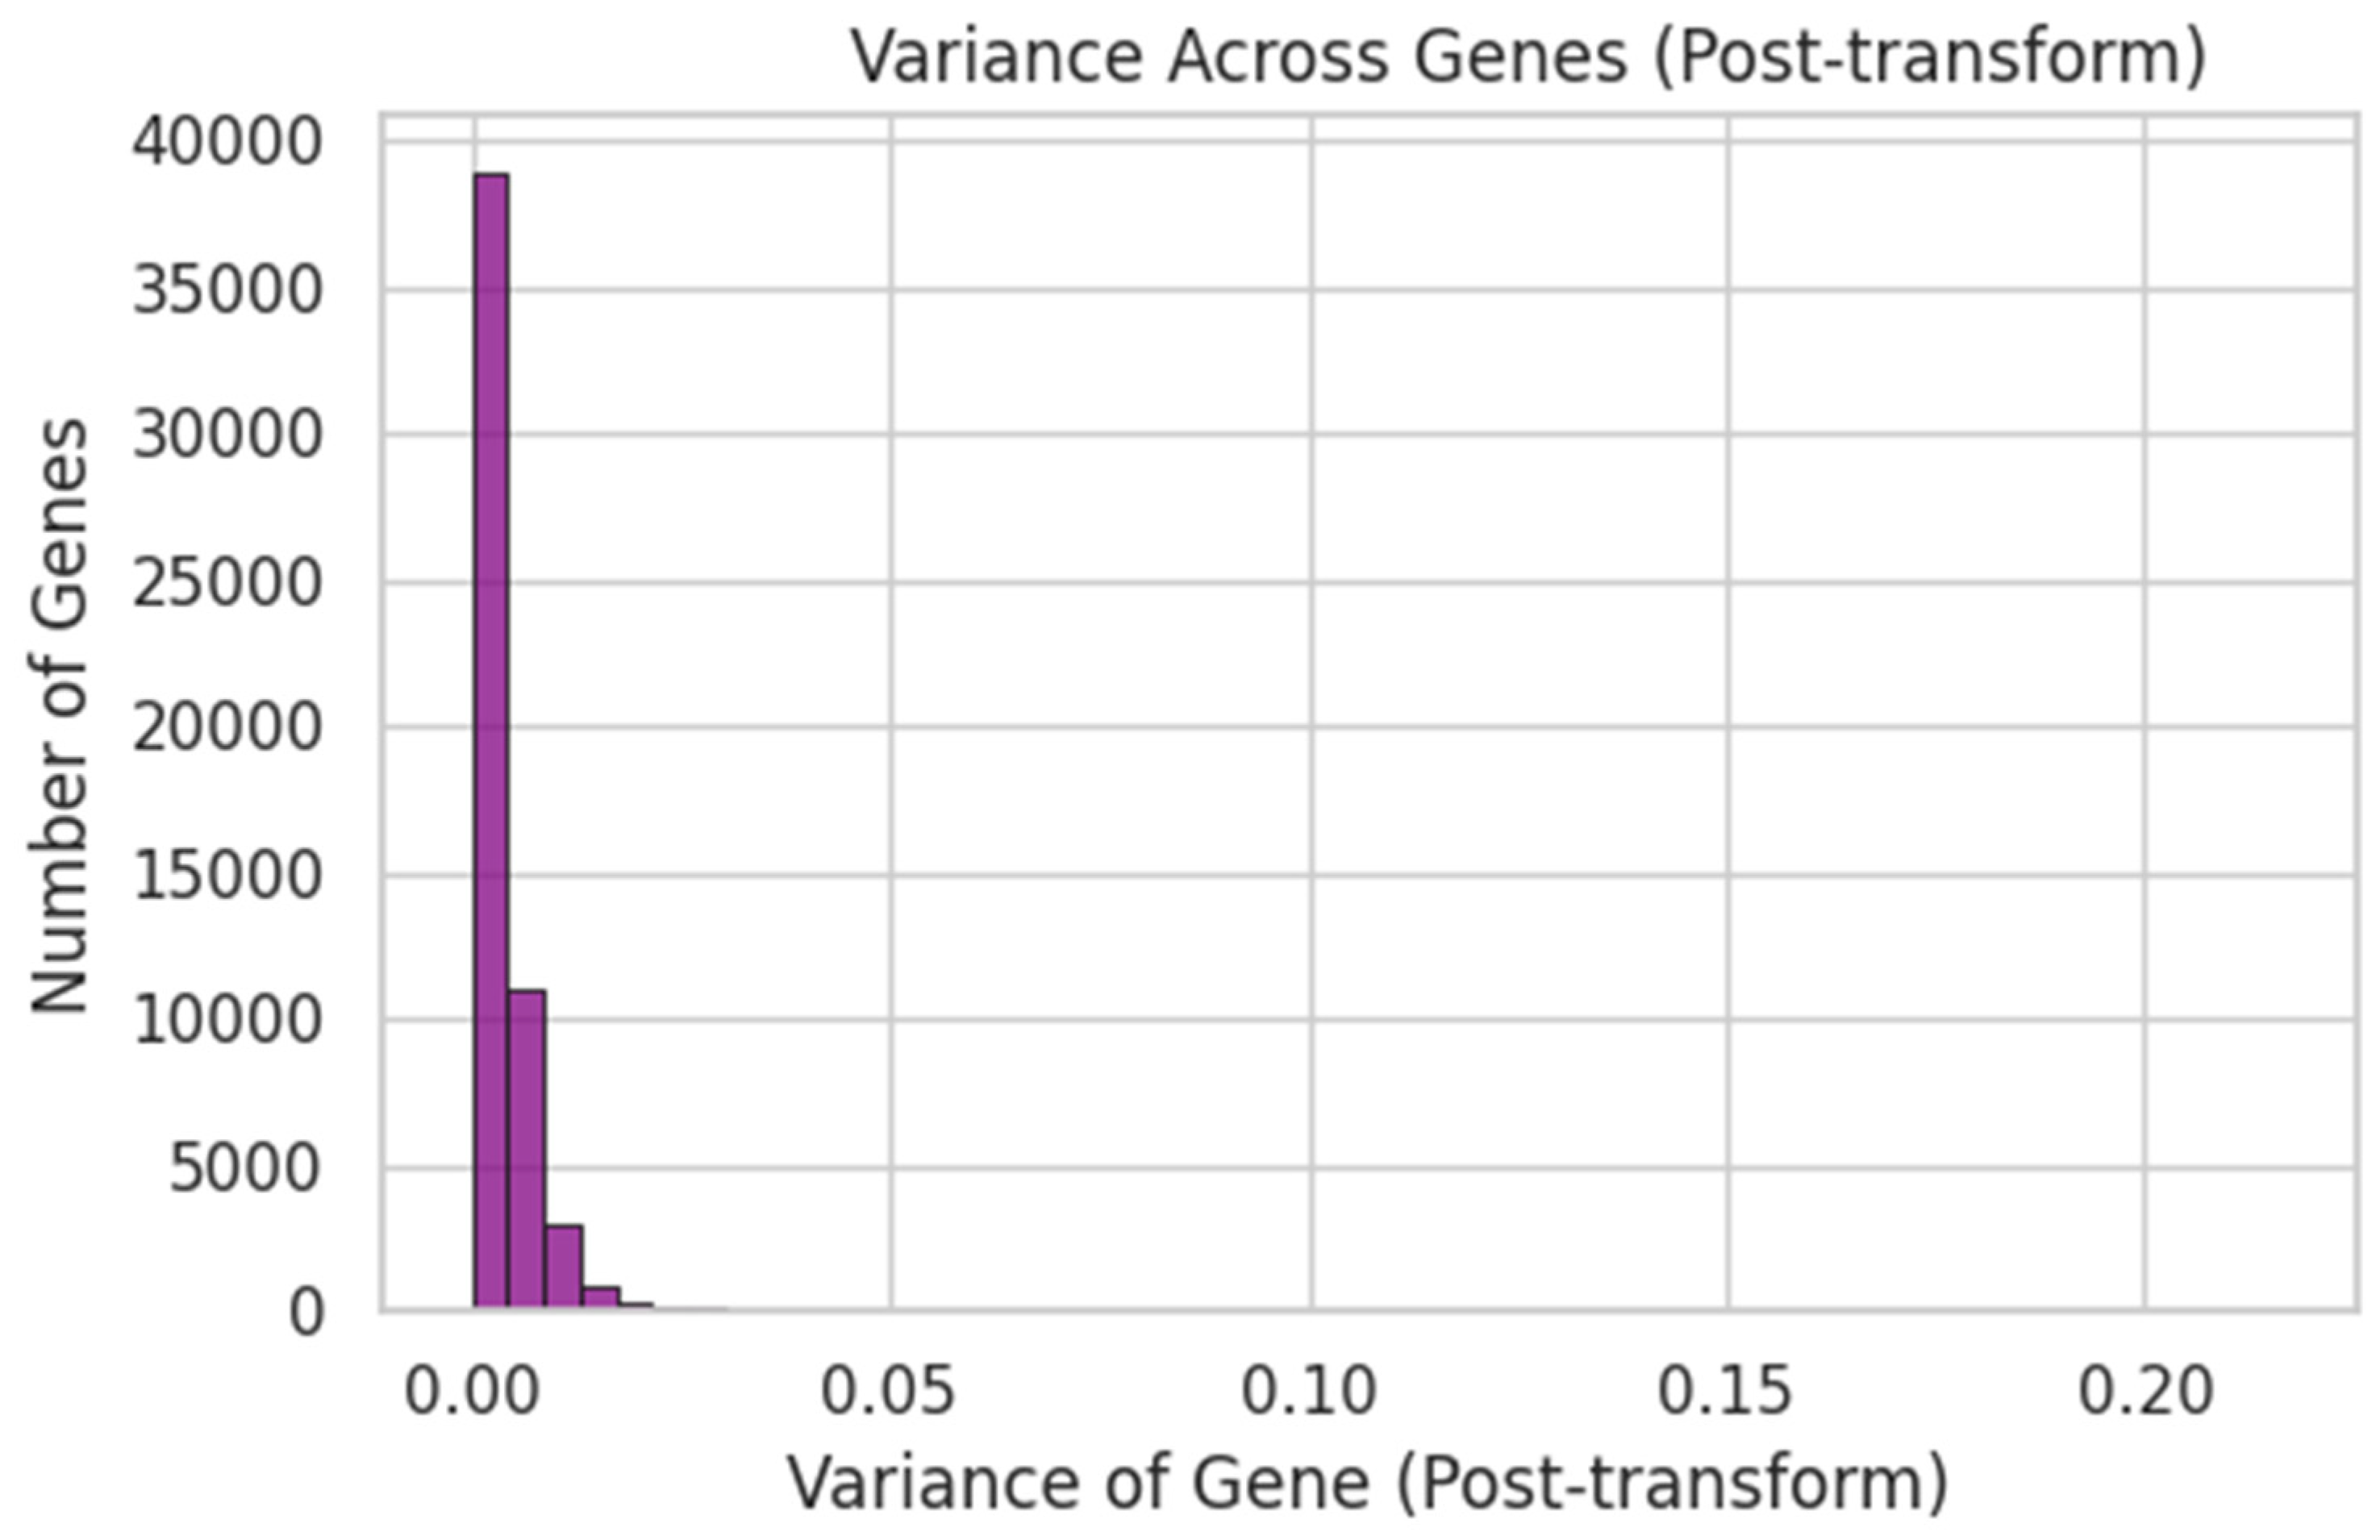
- A second FNN was trained on 54,675 probe-level intensities from 247 gingival biopsies, with preprocessing that included log2 transformation, quantile normalisation, and feature selection based on variance and correlation with synthetic targets.
1.5. Twin-Cohort Validation and Study Layout
- (i)
- subject-level alignment between microbial features and real clinical outcomes (TotalCaries count), and
- (ii)
- a natural experiment for assessing microbiome heritability via intra-pair similarity.
1.6. Paper Structure
2. Materials and Methods
2.1. Data Sources
2.1.1. Supragingival Plaque Microbiome
2.1.2. Gingival Tissue Transcriptome
2.1.3. Panoramic Radiographs
2.1.4. External Validation Panoramics
2.1.5. Twin-Cohort Saliva Microbiome
2.2. Multi -Pipeline Strategy
- A supragingival microbiome FNN,
- A gingival transcriptome FNN,
- A radiographic U-Net, and
- A twin-cohort microbiome branch.
2.3. Preprocessing
2.3.1. Microbiome (Supragingival)
2.3.2. Transcriptome
2.3.3. Radiographs
2.3.4. Twin-Cohort Preprocessing
2.4. Model Architectures
2.5. Evaluation
- Mean squared error (MSE)
- Coefficient of determination (R2)
- Pearson correlation (r)
- Intersection-over-Union (IoU)
- Precision
- Recall
- Tooth-area precision on an external paediatric set (n = 14): proportion of predicted lesion pixels that fall inside the dilated tooth mask (dilation = 5 px; sigmoid threshold = 0.50)
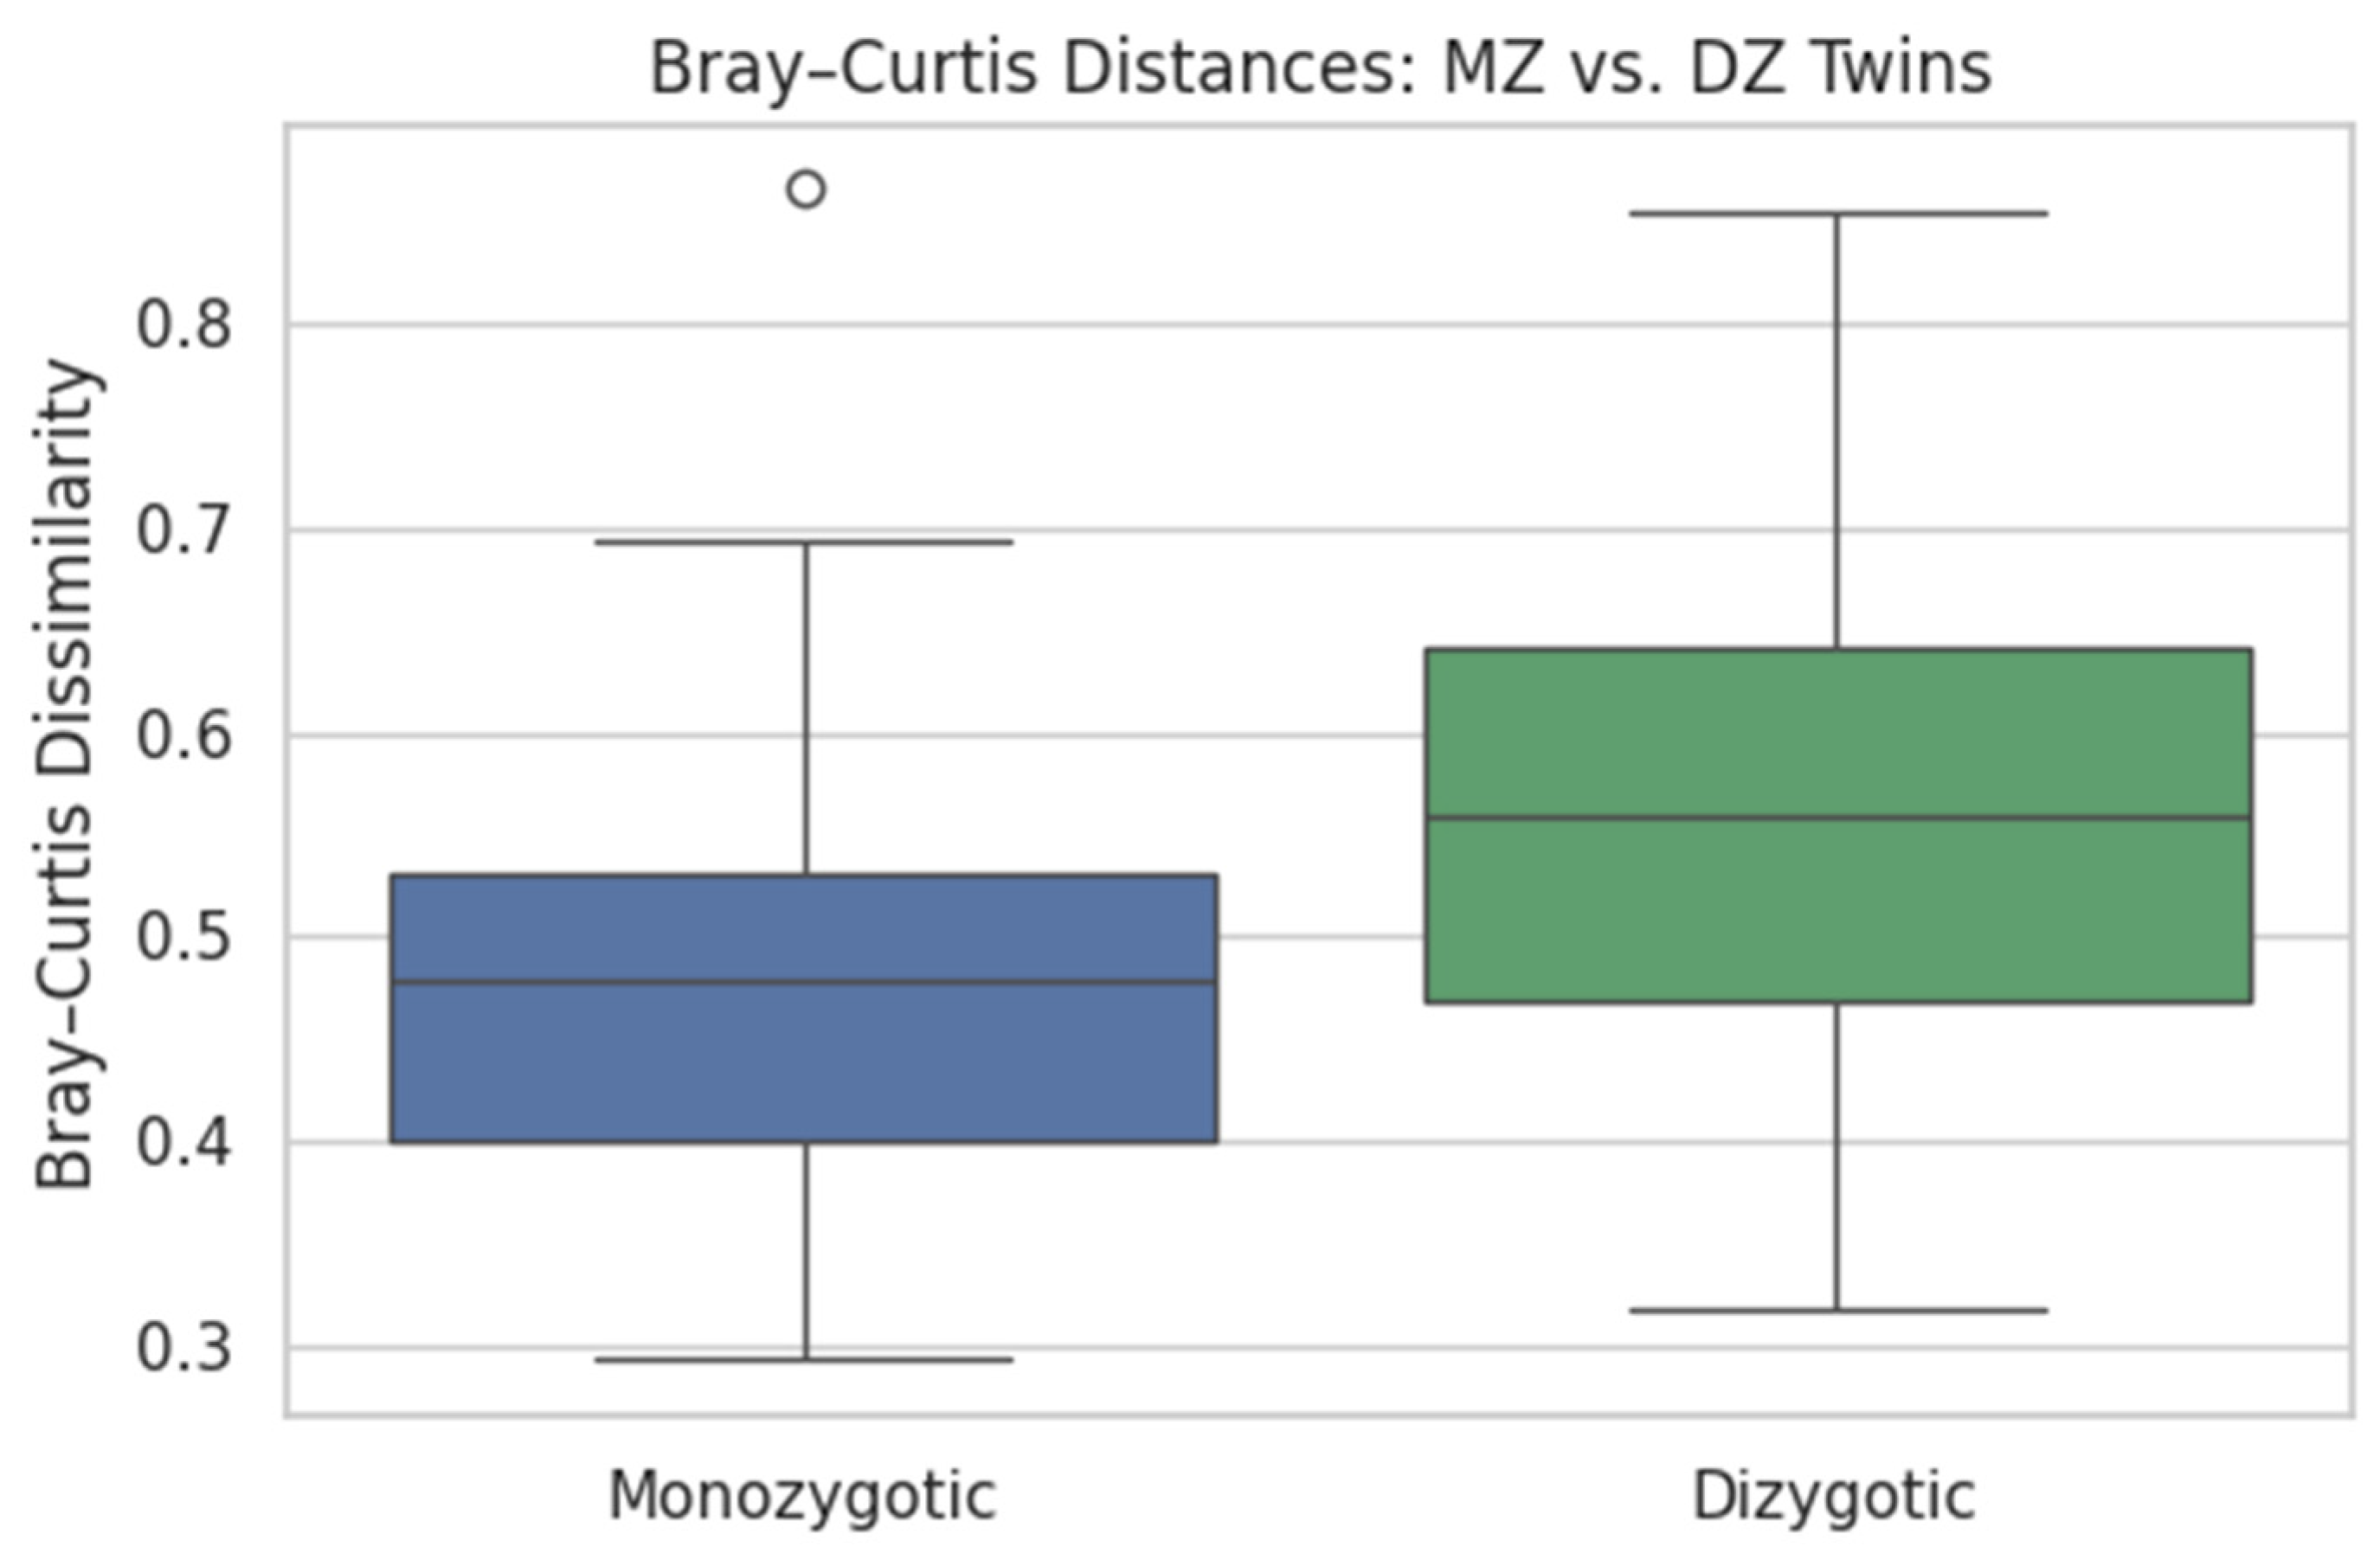
- Bray–Curtis dissimilarity: two-sample t-test (α = 0.05) comparing MZ and DZ pairs
- Twin FNN: MSE, R2, and r on the validation split
2.6. Interpretability Checks
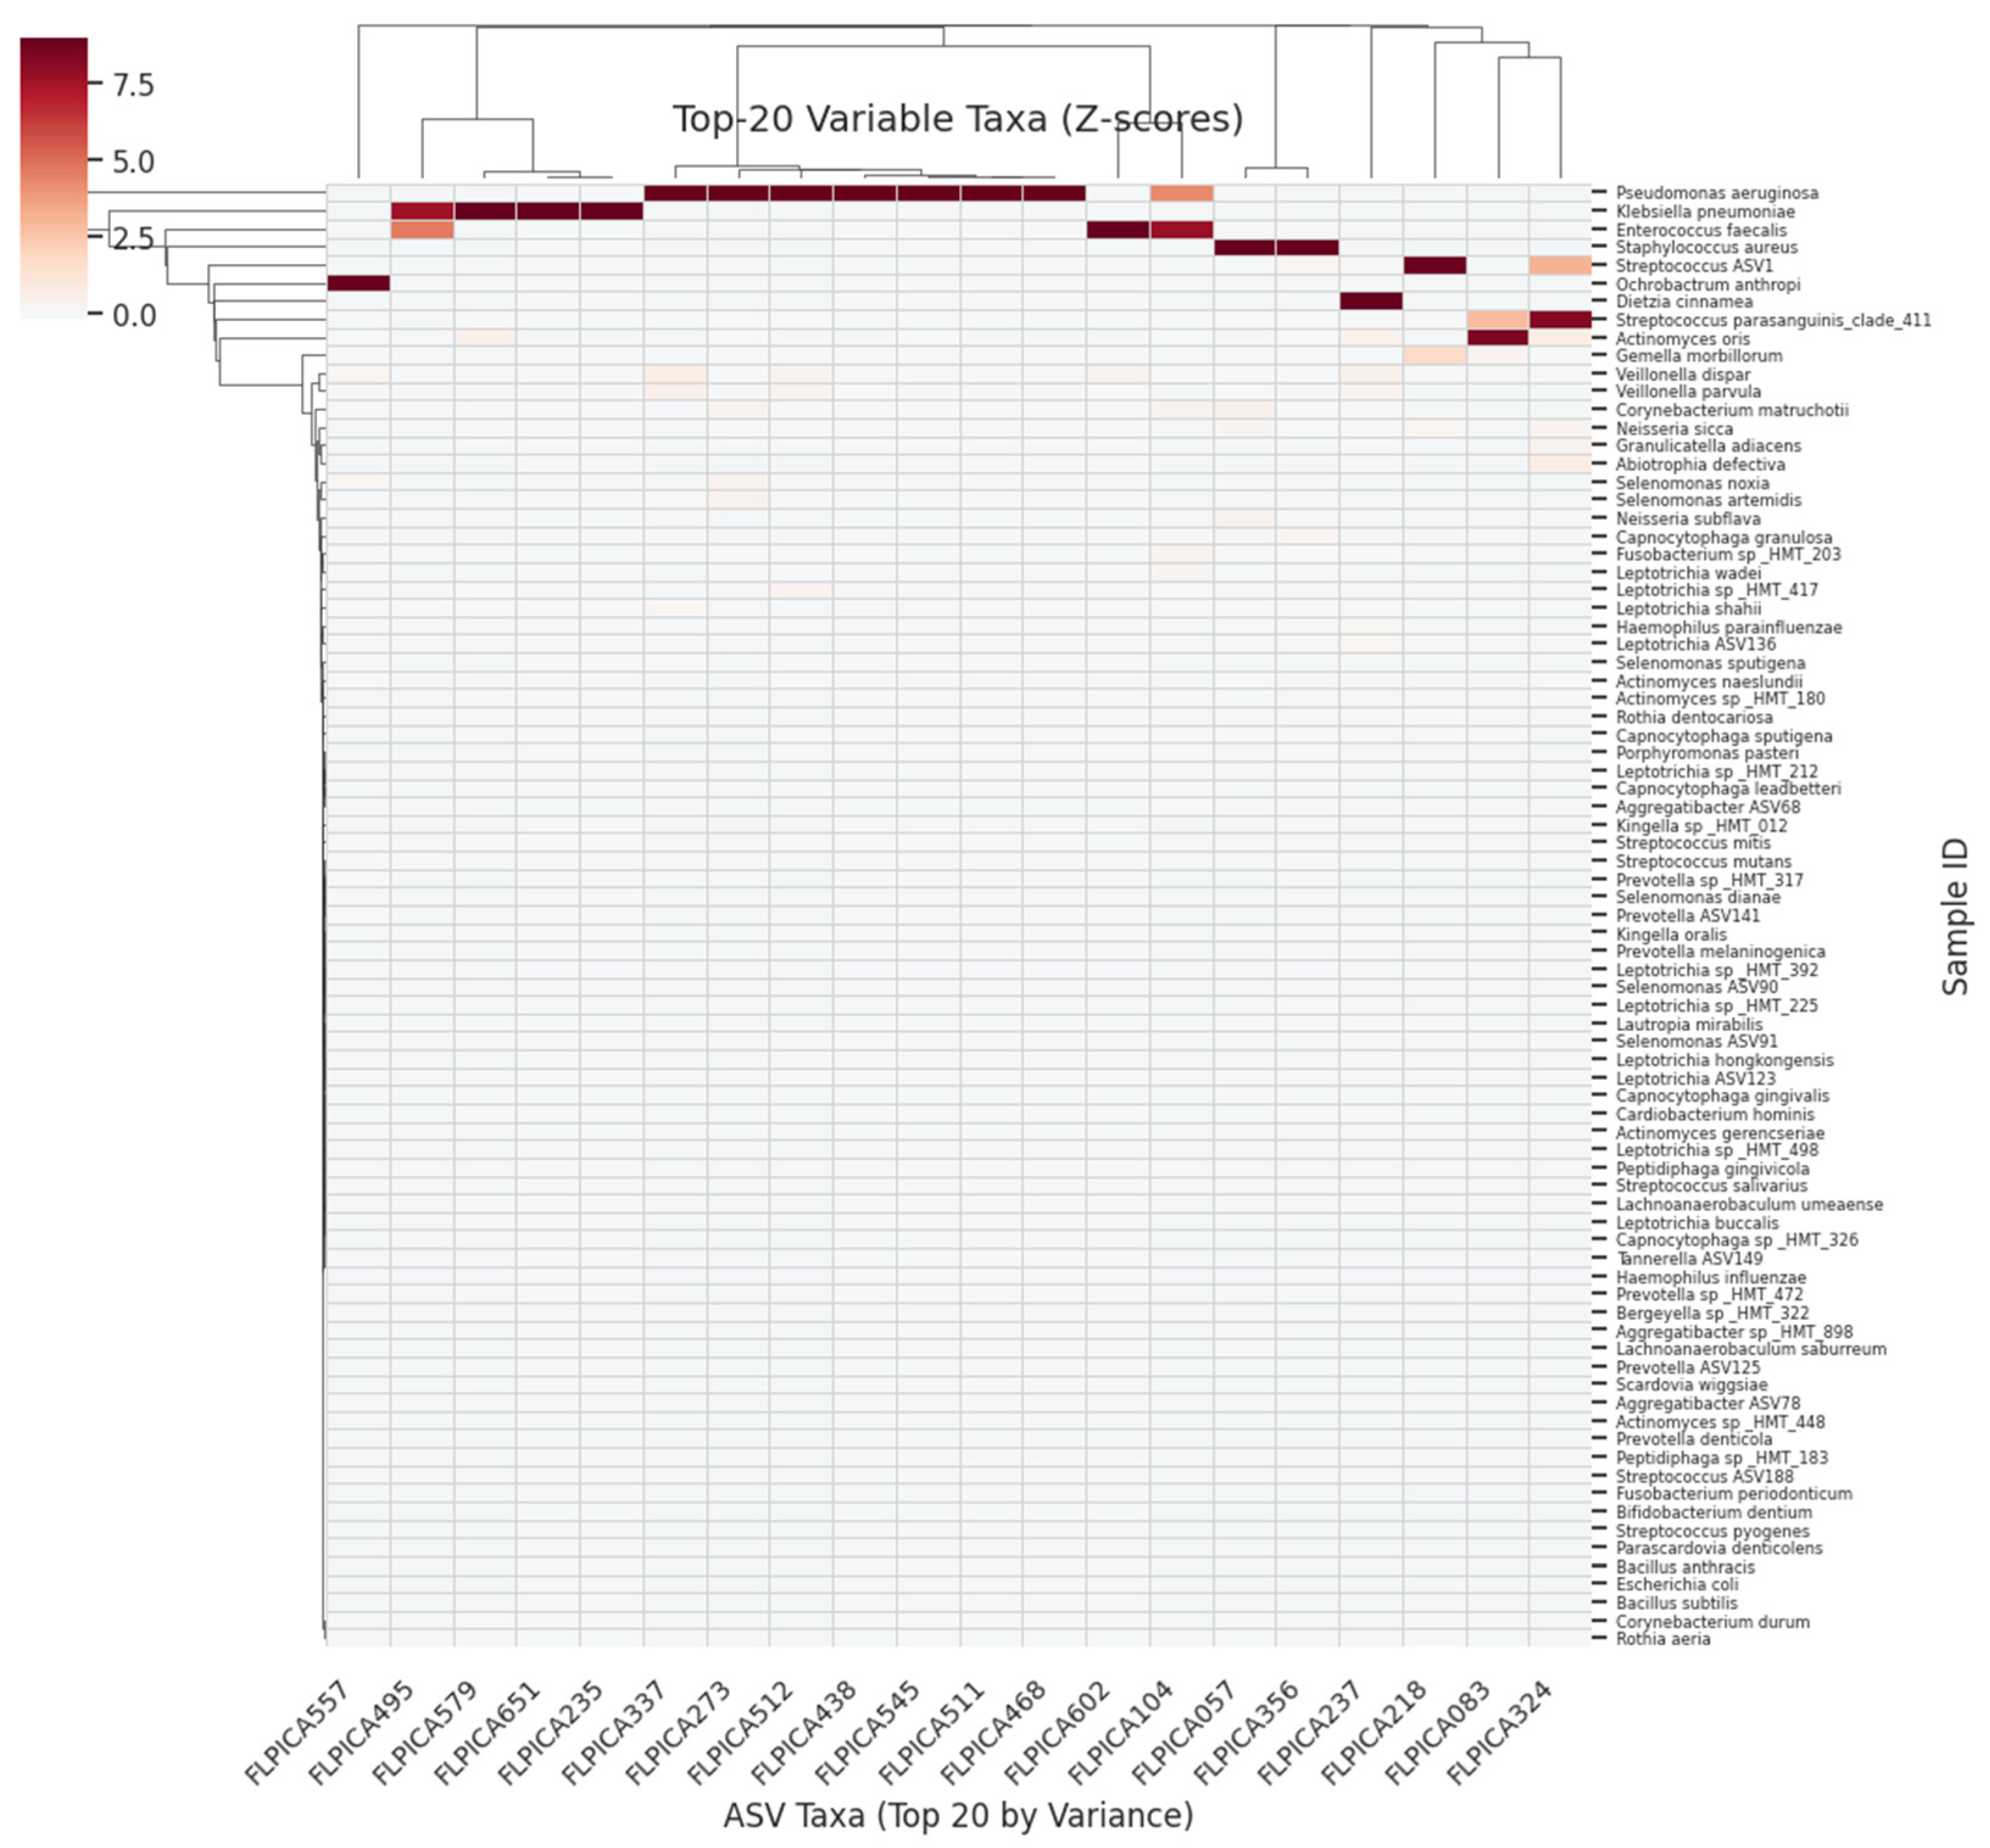
- The top 20 contributing ASVs or genes were visualised in horizontal bar plots.
- PCA and k-means clustering confirmed that SHAP-selected features corresponded to latent structure in the data.
- Gene-set enrichment (via GSEApy) was executed as a technical pipeline test but was not biologically interpreted due to the use of synthetic labels.
2.7. Ethics Approval and Consent to Participate
- Supragingival plaque ASV and microarray data were downloaded from GEO accession GSE10334, collected under the original authors’ IRB approval and consent protocols.
- Panoramic radiographs and masks originate from the open-access “Panoramic Dental Caries” Kaggle dataset, containing no personal identifiers.
- Twin-cohort saliva microbiome data were obtained from Figshare and were published with parental consent and ethics approval.
2.8. Data and Code Availability
- Storage location All processed datasets (filtered ASV and gene-expression matrices), trained model weights (≈1.3 GB), and the complete Colab notebook that reproduces every figure, table, and metric are stored in the authors’ institutional Google Drive.
- Access policy These materials are not publicly downloadable; they will be provided by the corresponding author upon reasonable request for non-commercial academic use.
- How to request E-mail calinb2003@yahoo.com with a brief statement of intended use. A view only Google Colab link and a shared-drive folder containing pipeline_notebook.ipynb, environment.yml, unet_resnet18_caries.pt, and the processed CSV files will be granted within 48 h.
2.9. Current Limitations
3. Model Architecture
- (i)
- prediction of a continuous caries severity proxy,
- (ii)
- identification of influential features using SHAP, and
- (iii)
- validation of performance using either synthetic severity scores or real clinical labels.
3.1. Conceptual Framework
3.2. Microbiome Regression Pipeline
- Optimiser: Adam (learning rate = 0.001, β1 = 0.9, β2 = 0.999, weight decay = 1 × 10⁻⁵)
- Training: Maximum 500 epochs; early stopping after 15 validation epochs without improvement
- Validation: five-fold cross-validation, repeated three times (15 folds total)
3.3. Transcriptome Regression Pipeline
- 1000 → 512 → dropout(0.3) → 256 → dropout(0.3) → 128 → 1
- Optimiser: Adam (learning rate = 0.001, weight decay = 1 × 10⁻⁴)
- Training: Up to 500 epochs; early stopping after 15 stagnant validation epochs
- Validation: Same 5 × 3 cross-validation protocol as in Section 3.2
3.4. Radiograph Segmentation Pipeline
- Loss function: Dice + binary cross-entropy
- Optimiser: Adam (lr = 0.0001, β = 0.9/0.999)
- Data split: 80/20 train–validation split with random_state = 42
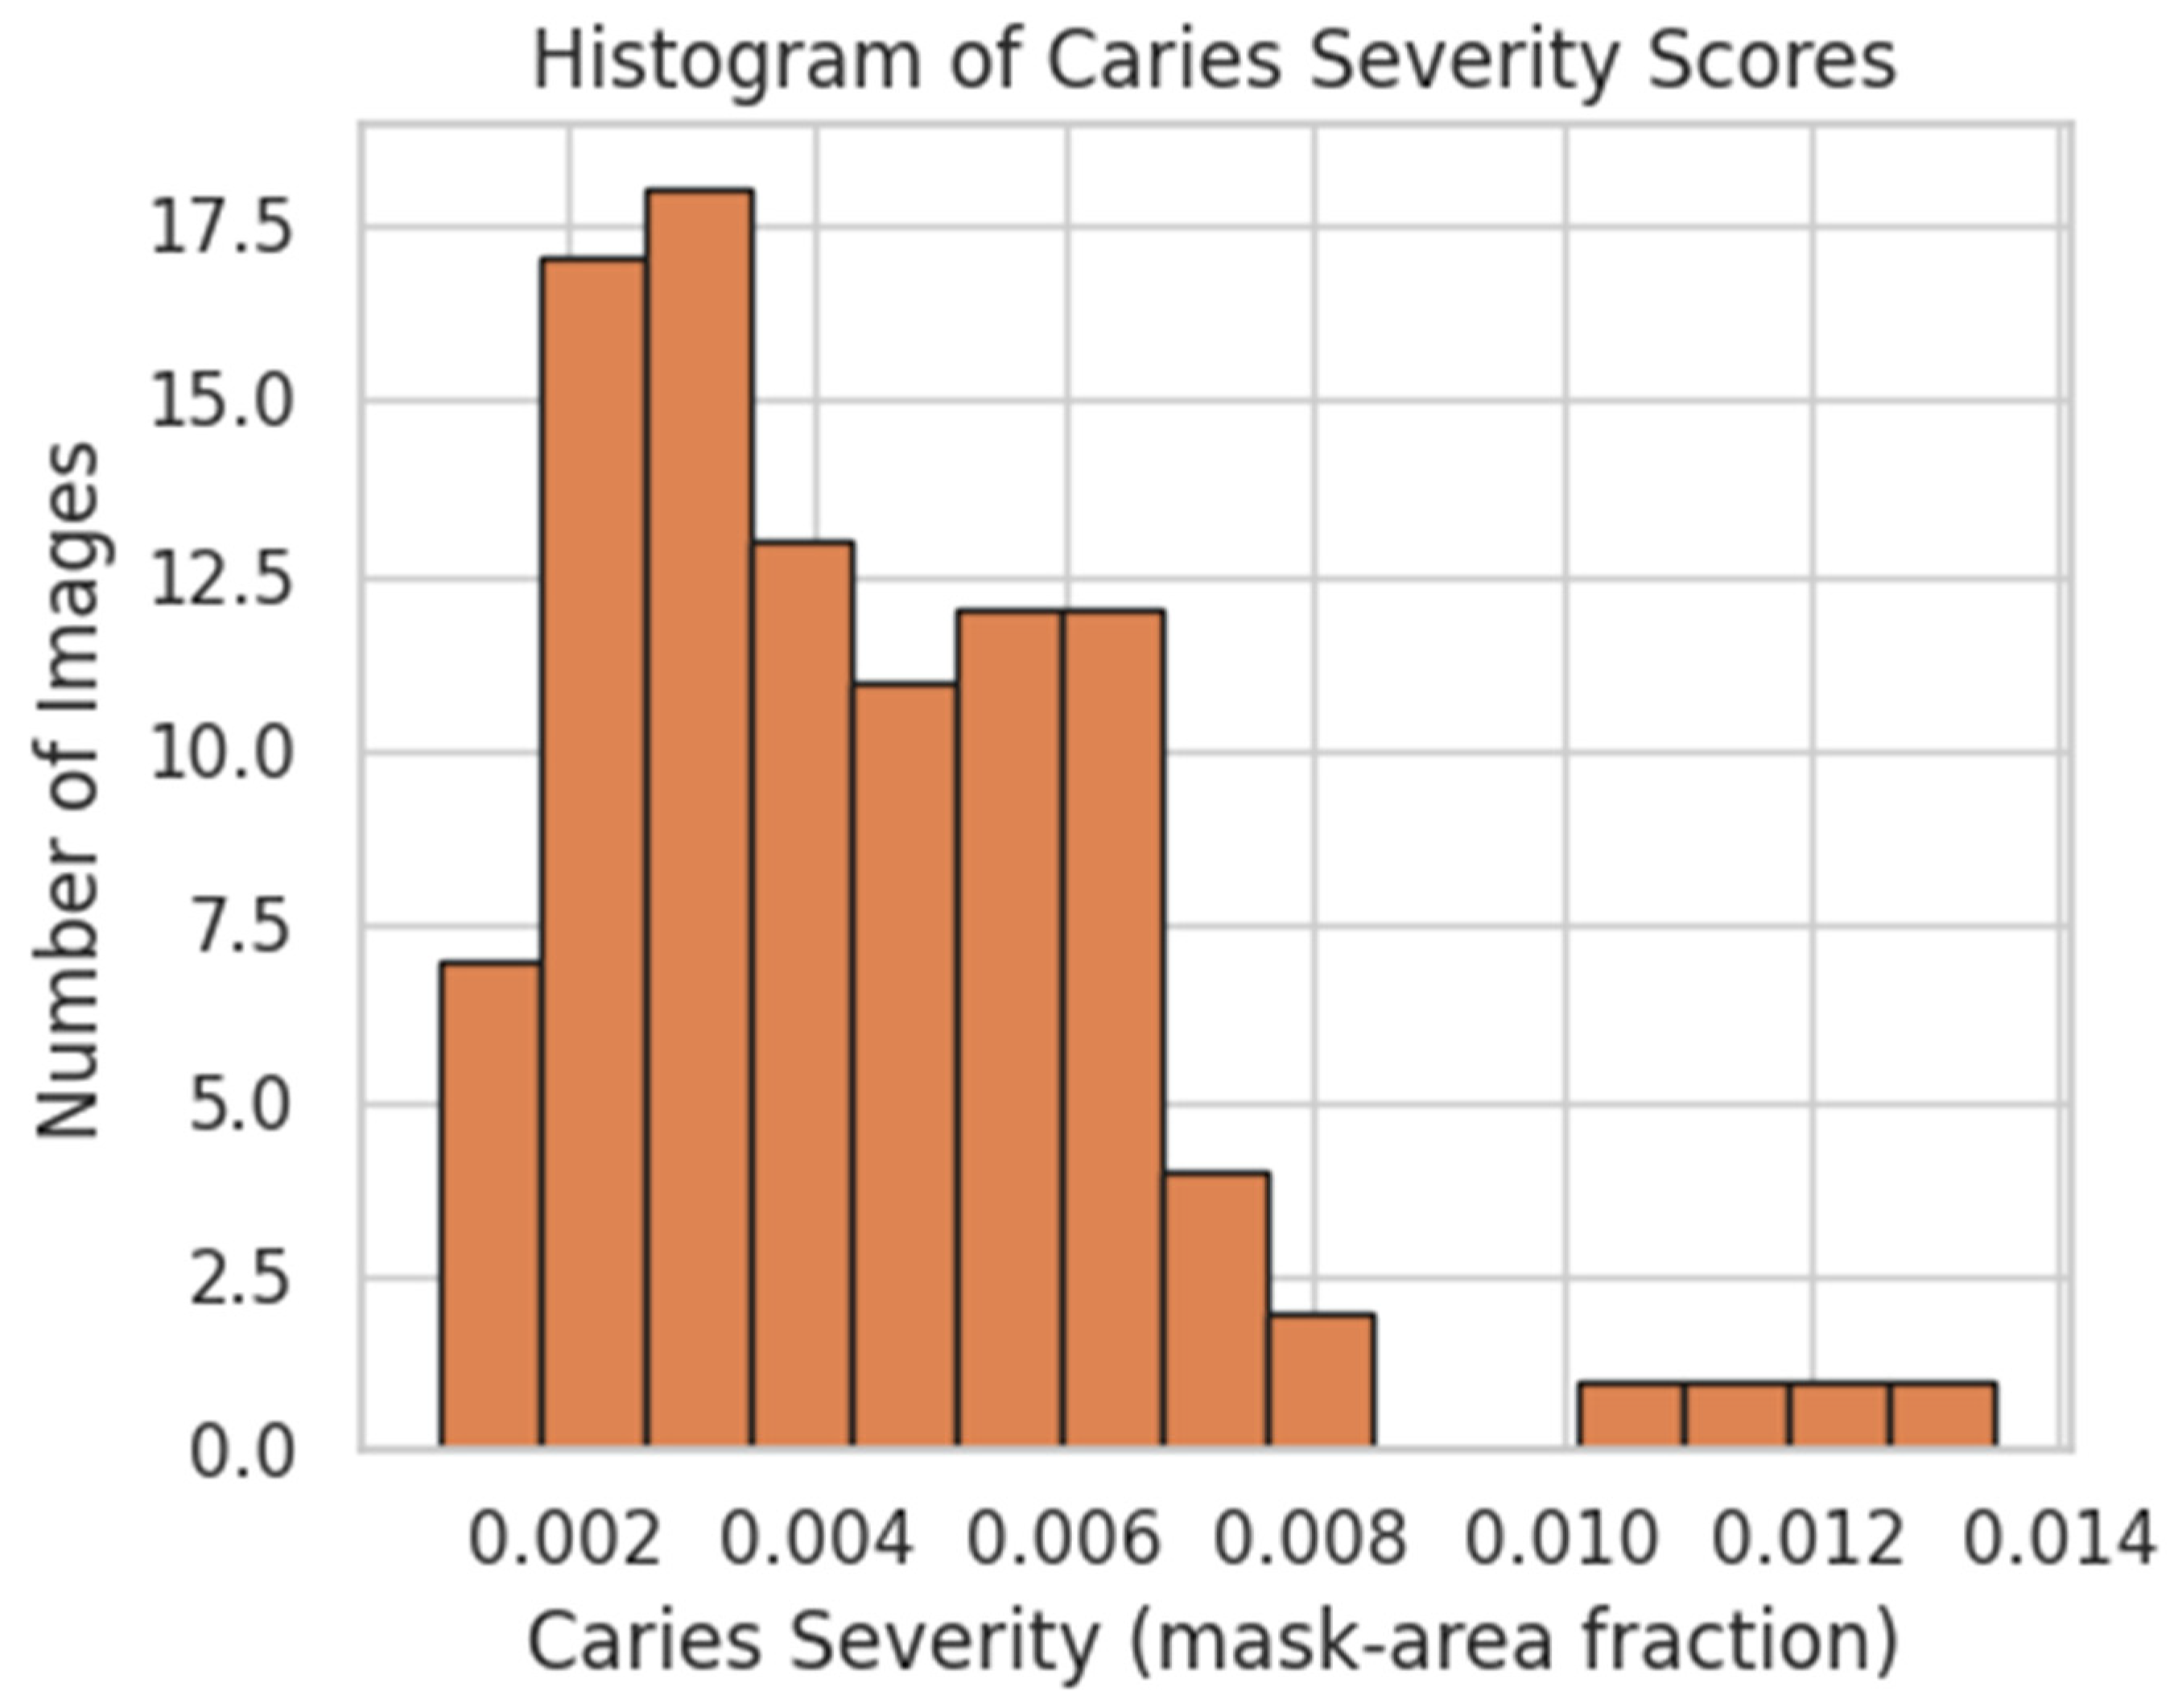
- Severity metric: Predicted mask area ÷ total image area
- Evaluation threshold: Sigmoid cut-off = 0.50 (default Dice operating point)
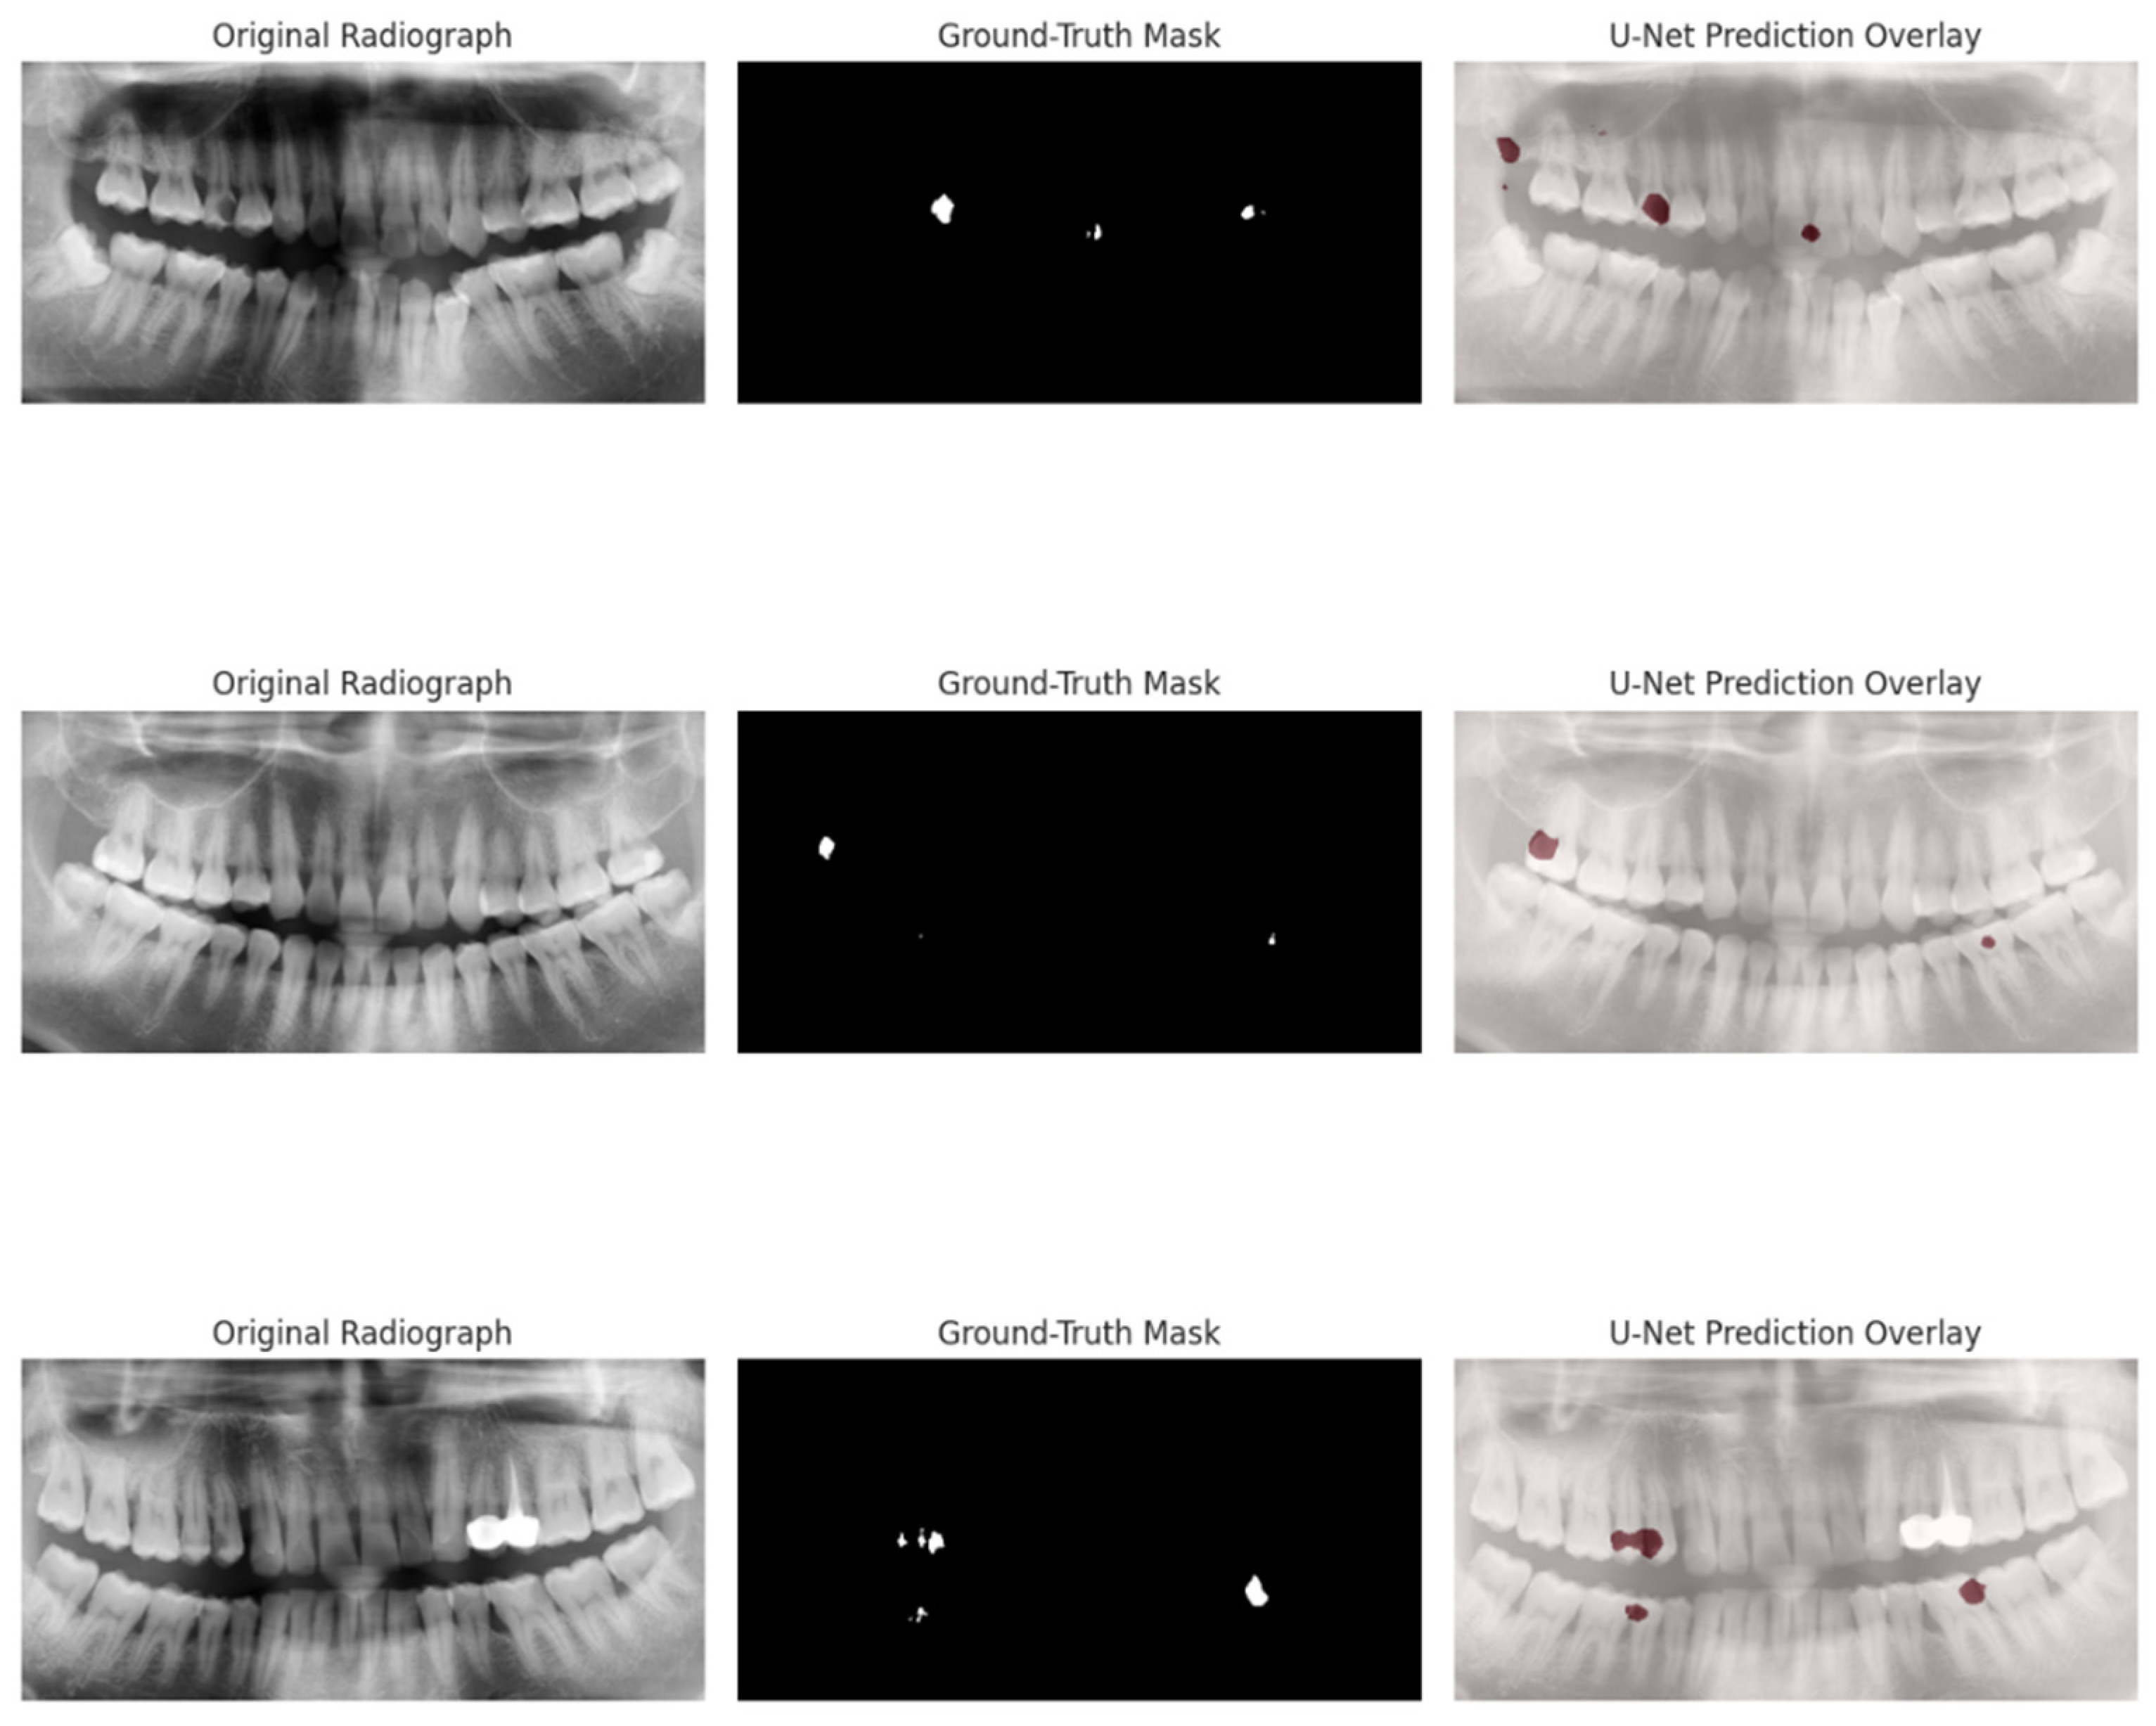
- Validation metrics: Intersection-over-Union (IoU) 0.564 (0.535–0.594), precision 0.624 (0.583–0.667), recall 0.877 (0.827–0.918) at threshold 0.50; 95% bootstrap confidence intervals reported in Section 4.4
3.5. Twin-Cohort Microbiome Pipeline
- Heritability: Bray–Curtis dissimilarities calculated per twin pair; MZ vs. DZ differences tested via two-sample t-test (α = 0.05)
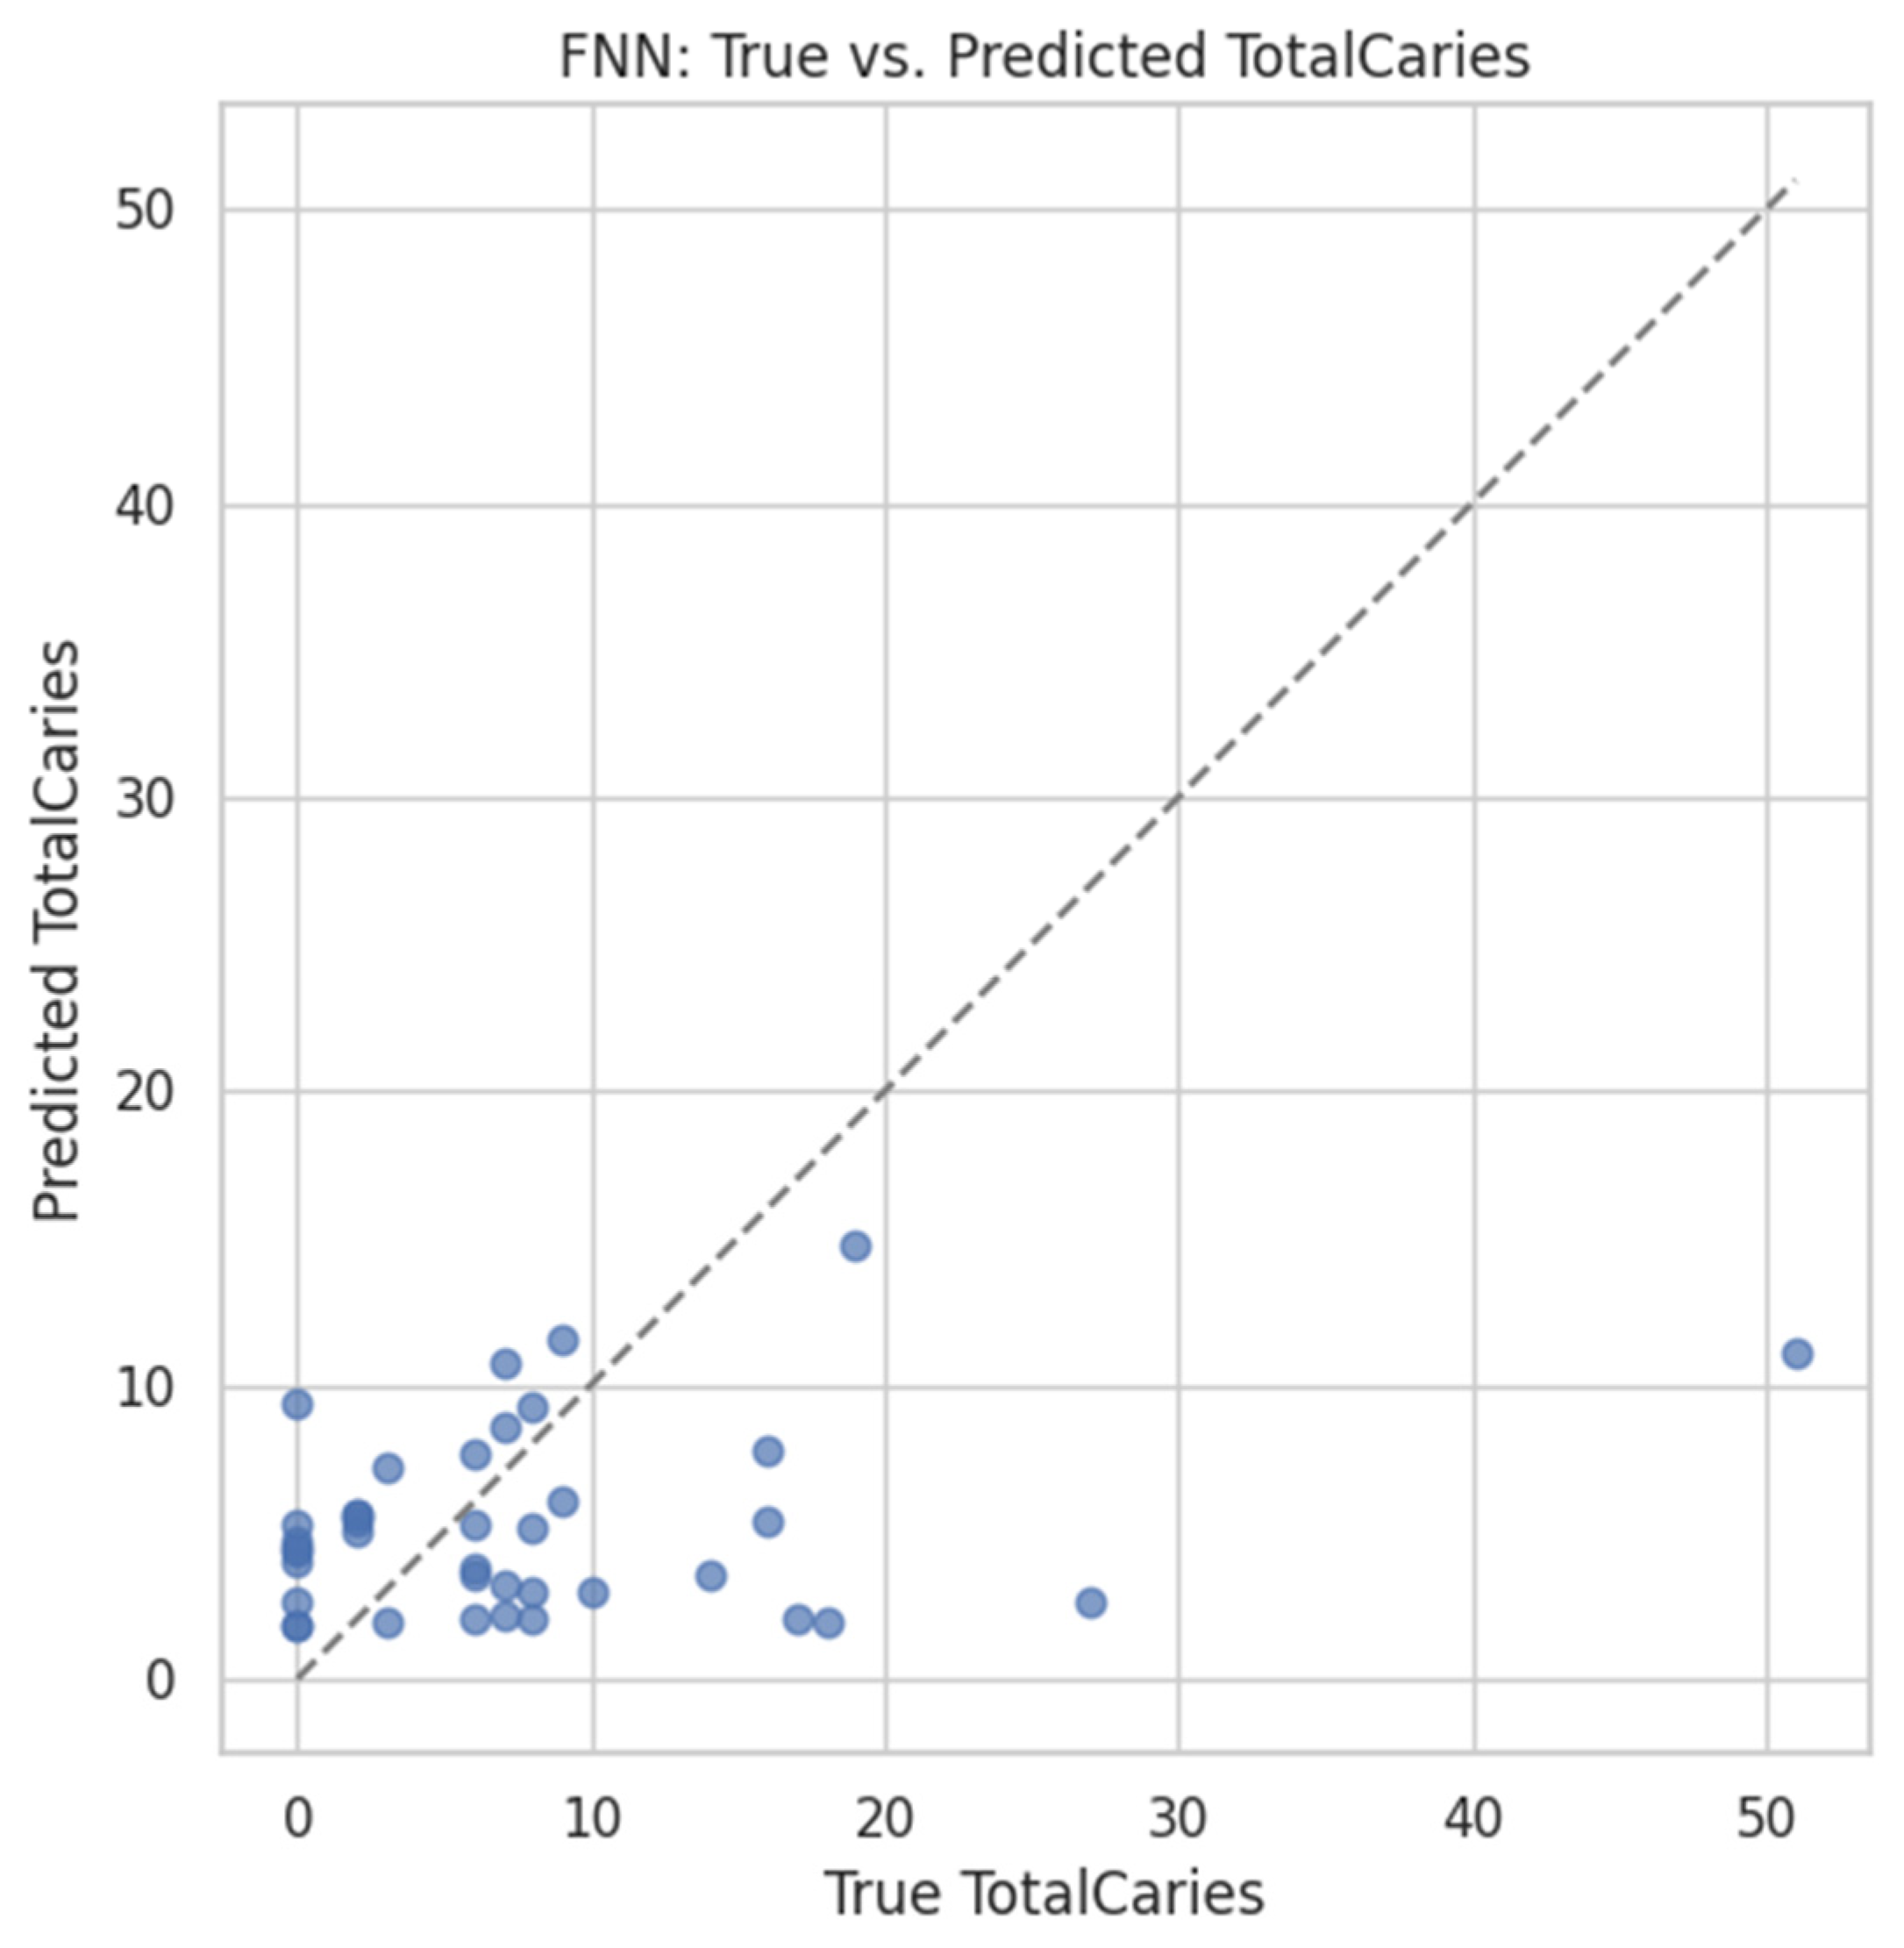
- Prediction: An FNN (2469 → 512 → 256 → 128 → 1) trained to regress TotalCaries count using:
- ◦
- 80/20 train–validation split (random seed = 42)
- ◦
- Early stopping (patience = 20 epochs)
- ◦
- Adam optimiser (learning rate = 0.001, weight decay = 1 × 10⁻⁵)
3.6. Interpretability
- Bar plots of the top 20 most influential ASVs or genes
- PCA and k-means clustering to confirm that SHAP-ranked features align with latent sample structure
- Gene set enrichment (via GSEApy) applied to the ranked transcriptomic list—interpreted only as a technical test, not for biological inference due to synthetic targets
3.7. Evaluation Metrics
3.8. Training Environment
- Microbiome FNN: ~3 min per CV fold
- Transcriptome FNN: ~10 min total
- Radiographic U-Net: ~25 min total
4. Results
4.1. Distribution of Radiographic Caries-Severity Scores
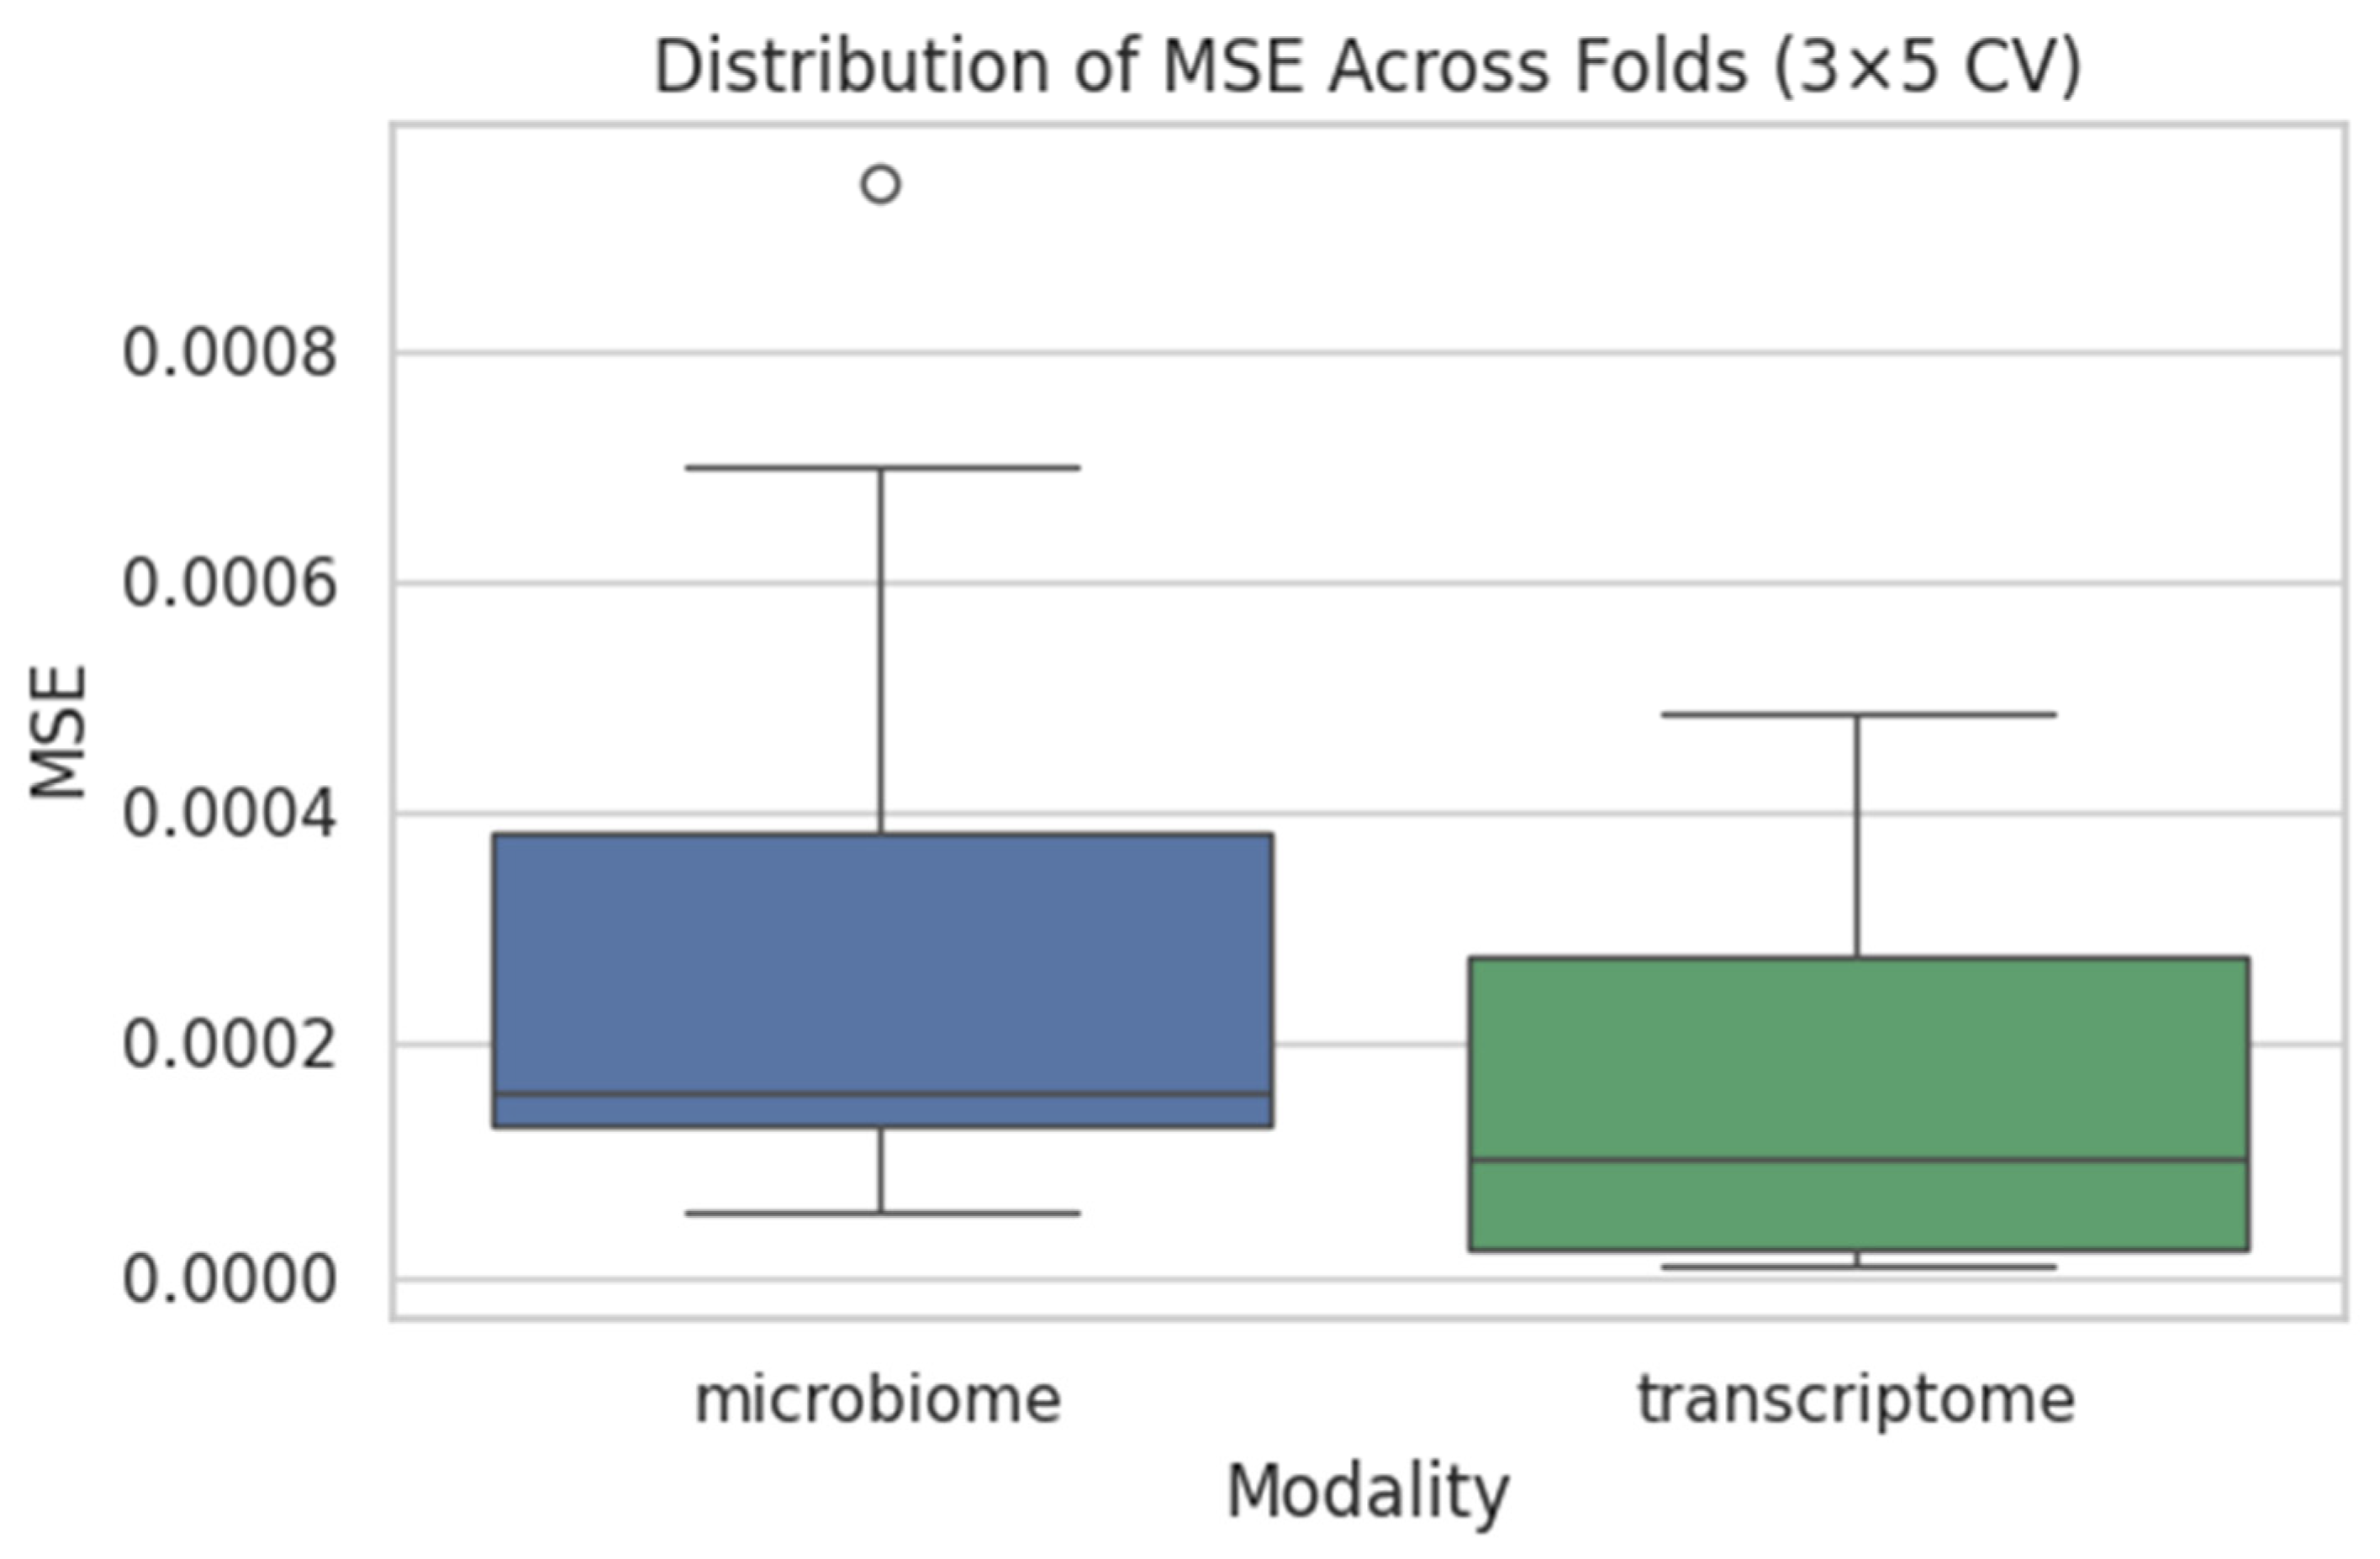
4.2. Supragingival Microbiome FNN
- Mean MSE = 0.0008 ± 0.0003
- Mean R2 ≈ −0.15
- Mean Pearson r ≈ −0.02
4.3. Gingival Transcriptome FNN
- Mean MSE ≈ 0.0010 ± 0.0004
- Mean R2 ≈ −0.18
- Mean Pearson r ≈ −0.03
4.4. Radiograph U-Net Segmentation
- IoU = 0.564 (95% CI 0.535–0.594)
- Precision = 0.624 (95% CI 0.583–0.667)
- Recall = 0.877 (95% CI 0.827–0.918)
- Pearson r = 0.62 (predicted vs. ground-truth severity, p < 0.01)
- MSE = 0.0004
4.5. Twin-Cohort Analyses
4.5.1. Microbiome Heritability via Bray–Curtis
- t = −3.582
- p = 0.0005
4.5.2. FNN Prediction of TotalCaries
- MSE = 91.82,
- R2 = –0.03,
- Pearson r = 0.253.
4.6. Aggregate Performance Summary
4.7. Study Limitations
- Synthetic targets: The use of permuted labels in the microbiome and transcriptome pipelines precludes current biomarker interpretation.
- Cohort mismatch: Lack of aligned subjects prevents any cross-modal integration or causal inference.
- Sample size: Cohorts remain small by machine-learning standards (81 plaque, 247 biopsy, 100 images, 198 saliva), limiting statistical power and architectural complexity.
- Imaging heterogeneity: Differences in scanner hardware, patient age, and acquisition protocols may depress U-Net performance; harmonised imaging repositories are needed.
- We relied on cropped panoramic radiographs rather than bitewings, which generally offer higher spatial resolution for detecting early lesions. This choice reflects the availability of open datasets rather than an optimal imaging modality, and should be considered when interpreting radiographic performance.
5. Discussion
5.1. Microbiome Pipeline
5.2. Transcriptome Pipeline
5.3. Radiographic U-Net
5.4. Twin-Cohort Validation
- Heritability: Bray–Curtis dissimilarity was significantly lower in MZ than DZ pairs (0.475 ± 0.107 vs. 0.557 ± 0.117; t = −3.58, p = 0.0005), confirming a genetic component in shaping oral microbial communities.
- Caries prediction: Re-using the FNN architecture from §3.2 (input = 2469 ASVs), we obtained MSE = 91.8, R2 = −0.03, and r = 0.253 on a held-out 20% validation set. While the proportion of variance explained was modest, the positive correlation supports a weak but non-negligible microbiome signal for caries burden—marking a clear contrast with the synthetic-label pipelines.
5.5. Integrative Context
- A radiograph-derived continuous gold-standard suitable for downstream molecular training,
- Heritable structure in oral microbial communities, with predictive signal detectable even by simple architectures,
- A modular, open-source, and interpretable machine-learning pipeline that can be rapidly extended by the broader research community.
- Integrated cohort design: Future studies should prospectively recruit participants from whom plaque or saliva, gingival biopsies, and radiographs are obtained on the same visit, accompanied by validated clinical indices (e.g., DMFT, ICDAS).
- Multi-input learning architectures: Incorporating dual-branch or attention-fusion neural networks capable of simultaneously ingesting microbial and transcriptomic features, with outputs regressing directly to severity scores or clinical outcomes.
- Longitudinal sampling: Repeated, time-stamped multi-omic and imaging measurements will be essential to model lesion initiation, progression, and response to intervention.
- Wet-lab validation: Molecular candidates identified by SHAP or pathway enrichment should be corroborated by qPCR, metagenomic sequencing, or cell-culture assays—particularly taxa such as Streptococcus mutans and transcripts such as MMP9 and IL1B.
- Processed-data release: A final priority is the design of prospective cohorts that collect radiographs, plaque or saliva microbiomes, and gingival transcriptomes at the same clinical encounter; even if raw files cannot always be released, providing harmonised processed datasets would greatly foster reproducibility and external validation.
5.6. Comparison with Prior Studies
- Most prior studies are unimodal, and even those with multiple data types rarely include aligned subjects.
- Interpretability is often limited to visual saliency maps; few pipelines incorporate SHAP or gene-pathway analysis.
- The ZOE 2.0 initiative is label-aligned and large but lacks imaging and relies on dmft/DMFT scores.
- To our knowledge, no prior work integrates 16S, transcriptome, and radiographic data in a unified framework.
6. Conclusions
Author Contributions
Funding
Institutional Review Board Statement
Informed Consent Statement
Data Availability Statement
Conflicts of Interest
References
- Pitts, N.B.; Zero, D.T.; Marsh, P.D.; Ekstrand, K.; Weintraub, J.A.; Ramos-Gomez, F.; Tagami, J.; Twetman, S.; Tsakos, G.; Ismail, A. Dental caries. Nat. Rev. Dis. Primers. 2017, 3, 17030. [Google Scholar] [CrossRef] [PubMed]
- Selwitz, R.H.; Ismail, A.I.; Pitts, N.B. Dental caries. Lancet 2007, 369, 51–59. [Google Scholar] [CrossRef] [PubMed]
- Pitts, N.B.; Ekstrand, K.R. International Caries Detection and Assessment System (ICDAS) and its International Caries Classification and Management System (ICCMS)—Methods for staging of the caries process and enabling dentists to manage caries. Community Dent. Oral Epidemiol. 2013, 41, e41–e52. [Google Scholar] [CrossRef] [PubMed]
- Kassebaum, N.J.; Bernabé, E.; Dahiya, M.; Bhandari, B.; Murray, C.J.; Marcenes, W. Global burden of untreated caries: A systematic review and metaregression. J. Dent. Res. 2015, 94, 650–658. [Google Scholar] [CrossRef] [PubMed]
- Takahashi, N.; Nyvad, B. The role of bacteria in the caries process: Ecological perspectives. J. Dent. Res. 2011, 90, 294–303. [Google Scholar] [CrossRef] [PubMed]
- Ismail, A.I. Visual and Visuo-tactile Detection of Dental Caries. J. Dent. Res. 2004, 83 (Suppl. S1), 56–66. [Google Scholar] [CrossRef]
- Gross, E.L.; Beall, C.J.; Kutsch, S.R.; Firestone, N.D.; Leys, E.J.; Griffen, A.L. Beyond Streptococcus mutans: Dental caries onset linked to multiple species by 16S rRNA community analysis. PLoS ONE 2012, 7, e47722. [Google Scholar] [CrossRef] [PubMed] [PubMed Central]
- Aas, J.A.; Griffen, A.L.; Dardis, S.R.; Lee, A.M.; Olsen, I.; Dewhirst, F.E.; Leys, E.J.; Paster, B.J. Bacteria of dental caries in primary and permanent teeth in children and young adults. J. Clin. Microbiol. 2008, 46, 1407–1417. [Google Scholar] [CrossRef] [PubMed] [PubMed Central]
- Simón-Soro, A.; Mira, A. Solving the etiology of dental caries. Trends Microbiol. 2015, 23, 76–82. [Google Scholar] [CrossRef] [PubMed]
- Takahashi, N.; Nyvad, B. Caries ecology revisited: Microbial dynamics and the caries process. Caries Res. 2008, 42, 409–418. [Google Scholar] [CrossRef] [PubMed]
- Marsh, P.D.; Head, D.A.; Devine, D.A. Dental plaque as a biofilm and a microbial community—Implications for treatment. J. Oral Biosci. 2015, 57, 185–191. [Google Scholar] [CrossRef]
- Kasimoglu, Y.; Koruyucu, M.; Birant, S.; Karacan, I.; Topcuoglu, N.; Tuna, E.B.; Gencay, K.; Seymen, F. Oral microbiota and dental caries data from monozygotic and dizygotic twin children. Sci. Data 2020, 7, 348. [Google Scholar] [CrossRef] [PubMed]
- Demmer, R.T.; Behle, J.H.; Wolf, D.L.; Handfield, M.; Kebschull, M.; Celenti, R.; Pavlidis, P.; Papapanou, P.N. Transcriptomes in Healthy and Diseased Gingival Tissues. J. Periodontol. 2008, 79, 2112–2124. [Google Scholar] [CrossRef] [PubMed]
- Kebschull, M.; Demmer, R.T.; Grün, B.; Guarnieri, P.; Pavlidis, P.; Papapanou, P.N. Gingival Tissue Transcriptomes Identify Distinct Periodontitis Phenotypes. J. Dent. Res. 2014, 93, 459–468. [Google Scholar] [CrossRef]
- Kebschull, M.; Guarnieri, P.; Demmer, R.T.; Boulesteix, A.L.; Pavlidis, P.; Papapanou, P.N. Molecular differences between chronic and aggressive periodontitis. J. Dent. Res. 2013, 92, 1081–1088. [Google Scholar] [CrossRef] [PubMed] [PubMed Central]
- Bartold, P.M.; Van Dyke, T.E. Periodontitis: A host-mediated disruption of microbial homeostasis. Unlearning learned concepts. Periodontology 2000 2013, 62, 203–217. [Google Scholar] [CrossRef]
- The Human Microbiome Project Consortium. Structure, function and diversity of the healthy human microbiome. Nature 2012, 486, 207–214. [Google Scholar] [CrossRef]
- Wang, Z.; Gerstein, M.; Snyder, M. RNA-Seq: A revolutionary tool for transcriptomics. Nat. Rev. Genet. 2009, 10, 57–63. [Google Scholar] [CrossRef] [PubMed] [PubMed Central]
- Lee, J.H.; Kim, D.H.; Jeong, S.N.; Choi, S.H. Detection and diagnosis of dental caries using a deep learning-based convolutional neural network algorithm. J. Dent. 2018, 77, 106–111. [Google Scholar] [CrossRef] [PubMed]
- Tuzoff, D.V.; Tuzova, L.N.; Bornstein, M.M.; Krasnov, A.S.; Kharchenko, M.A.; Nikolenko, S.I.; Sveshnikov, M.M.; Bednenko, G.B. Tooth detection and numbering in panoramic radiographs using convolutional neural networks. Dentomaxillofac. Radiol. 2019, 48, 20180051. [Google Scholar] [CrossRef] [PubMed] [PubMed Central]
- Topçuoğlu, B.D.; Lesniak, N.A.; Ruffin, M.T., 4th; Wiens, J.; Schloss, P.D. A Framework for Effective Application of Machine Learning to Microbiome-Based Classification Problems. mBio 2020, 11, e00434-20. [Google Scholar] [CrossRef] [PubMed] [PubMed Central]
- Divaris, K.; Joshi, A. The building blocks of precision oral health in early childhood: The ZOE 2.0 study. J. Public Health Dent. 2020, 80 (Suppl. S1), S31–S36. [Google Scholar] [CrossRef] [PubMed] [PubMed Central]
- Casalegno, F.; Newton, T.; Daher, R.; Abdelaziz, M.; Lodi-Rizzini, A.; Schürmann, F.; Krejci, I.; Markram, H. Caries Detection with Near-Infrared Transillumination Using Deep Learning. J. Dent. Res. 2019, 98, 1227–1233. [Google Scholar] [CrossRef] [PubMed] [PubMed Central]
- Zhang, Y.; Ye, F.; Chen, L.; Xu, F.; Chen, X.; Wu, H.; Cao, M.; Li, Y.; Wang, Y.; Huang, X. Children’s Dental Panoramic Radiographs Dataset for Caries Segmentation and Dental Disease Detection. Sci. Data 2023, 10, 380. [Google Scholar] [CrossRef] [PubMed]
- Thunderpede. Panoramic Dental Dataset [Data set]. Kaggle. 2023. Available online: https://www.kaggle.com/datasets/thunderpede/panoramic-dental-dataset (accessed on 10 May 2025).
- Zhang, J.S.; Huang, S.; Chen, Z.; Chu, C.-H.; Takahashi, N.; Yu, O.Y. Application of omics technologies in cariology research: A critical review with bibliometric analysis. J. Dent. 2024, 141, 104801. [Google Scholar] [CrossRef]
- Kabbashi, S.; Roomaney, I.A.; Chetty, M. Bridging the gap between omics research and dental practice. BDJ Open 2024, 10, 16. [Google Scholar] [CrossRef]
- Das, N. Advancing precision dentistry: The integration of multi-omics and cutting-edge imaging technologies—a systematic review. Front. Dent. Med. 2025, 6, 1581738. [Google Scholar] [CrossRef]
- Albano, D.; Galiano, V.; Basile, M.; Di Luca, F.; Gitto, S.; Messina, C.; Cagetti, M.G.; Del Fabbro, M.; Tartaglia, G.M. Artificial intelligence for radiographic imaging detection of caries lesions: A systematic review. BMC Oral Health 2024, 24, 274. [Google Scholar] [CrossRef]
- Luke, A.M.; Rezallah, N.N.F. Accuracy of artificial intelligence in caries detection: A systematic review and meta-analysis. Head Face Med. 2025, 21, 24. [Google Scholar] [CrossRef]
- Pérez de Frutos, J.; Holden Helland, R.; Desai, S.; Nymoen, L.C.; Langø, T.; Remman, T.; Sen, A. AI-Dentify: Deep learning for proximal caries detection on bitewing X-ray—HUNT4 Oral Health Study. BMC Oral Health 2024, 24, 344. [Google Scholar] [CrossRef]
- Bayati, M.; Alizadeh Savareh, B.; Ahmadinejad, H.; Mosavat, F. Advanced AI-driven detection of interproximal caries in bitewing radiographs using YOLOv8. Sci. Rep. 2025, 15, 4641. [Google Scholar] [CrossRef]
- Ayhan, B.; Ayan, E.; Karadağ, G.; Bayraktar, Y. Evaluation of Caries Detection on Bitewing Radiographs: A Comparative Analysis of the Improved Deep Learning Model and Dentist Performance. J. Esthet. Restor. Dent. 2025, 37, 1949–1961. [Google Scholar] [CrossRef]
- Huang, C.; Wang, J.; Zhang, Y.; Wang, S. A review of deep learning in dentistry. Neurocomputing 2023, 554, 126629. [Google Scholar] [CrossRef]
- Xing, H.; Eckert, G.J.; Ando, M. Impact of angle on photothermal radiometry and modulated luminescence (PTR/LUM) value. J. Dent. 2023, 132. [Google Scholar] [CrossRef]
- Dayo, A.F.; Amaechi, B.T.; Noujeim, M.; Deahl, S.T.; Gakunga, P.; Katkar, R. Comparison of photothermal radiometry and modulated luminescence, intraoral radiography, and cone beam computed tomography for detection of natural caries under restorations. Oral Surgery Oral Med. Oral Pathol. Oral Radiol. 2020, 129, 539–548. [Google Scholar] [CrossRef]
- Angelakopoulos, N.; Otero, C.I.A.Y.; Franco, A.; Vazquez, L.; Leprince, J.; Abdelaziz, M. Atlas of Dental Near-Infrared Transillumination Images. Diagnostics 2024, 14, 1154. [Google Scholar] [CrossRef]





| Pipeline | Architecture |
|---|---|
| Microbiome FNN | 750 → 512 → 256 → 128 → 1 (ReLU, Adam lr = 0.001) |
| Transcriptome FNN | 1000 → 512 → dropout(0.3) → 256 → dropout(0.3) → 128 → 1 |
| Radiograph U-Net | ResNet-18 encoder, Dice + BCE loss function |
| Twin FNN | 2469 → 512 → 256 → 128 → 1 (80/20 split, early stopping, patience = 20) |
| Modality | Primary Metrics | Validation Protocol |
|---|---|---|
| Microbiome | MSE, R2, Pearson r | five-fold CV × 3 repeats |
| Transcriptome | MSE, R2, Pearson r | five-fold CV × 3 repeats |
| Imaging | IoU, precision, recall, Dice coefficient | 20-image hold-out validation |
| Twin Cohort | MSE, R2, Pearson r (FNN); Bray–Curtis t-test | 80/20 train–validation split |
| Epoch | IoU | Precision | Recall |
|---|---|---|---|
| 1 | 0.42 | 0.59 | 0.38 |
| 5 | 0.51 | 0.68 | 0.48 |
| 10 | 0.54 | 0.71 | 0.51 |
| 15 | 0.56 | 0.73 | 0.54 |
| 20 | 0.57 | 0.74 | 0.55 |
| 25 | 0.58 | 0.75 | 0.56 |
| Summary (20-image hold-out, sigmoid = 0.50) | 0.564 (95% CI 0.534–0.593) | 0.624 (0.586–0.666) | 0.877 (0.823–0.919) |
| Modality | Mean MSE | Mean R2 | Mean r | Imaging IoU | Imaging Precision | Imaging Recall |
|---|---|---|---|---|---|---|
| Microbiome | 0.0008 | −0.15 | −0.02 | – | – | – |
| Transcriptome | 0.0010 | −0.18 | −0.03 | – | – | – |
| Twin-Cohort FNN | 91.82 | −0.03 | 0.253 | |||
| Imaging (U-Net) | – | – | – | 0.564 | 0.624 | 0.877 |
| Study (year) | Cohort Size & Data Set | Modalities/Cohort Alignment | ML Model & Interpretability | Headline Performance | Notes |
|---|---|---|---|---|---|
| Lee et al. 2018 [19] | 3000 bite-wing radiographs (single centre) | Imaging only; no molecular data | ResNet-50 CNN; saliency maps not reported | AUC = 0.96 for proximal-caries detection | Benchmark deep-learning image study |
| Casalegno et al. 2019 [23] | 1140 near-infra-red transillumination (NIRT) images | Imaging only | EfficientNet; Grad-CAM visualisation | Accuracy = 0.92 for enamel-lesion detection | Shows alternative imaging modality |
| Topçuoğlu et al. 2020 [21] | 237 saliva 16S samples | Microbiome only (CRC vs. healthy) | XGBoost + SHAP feature ranking | AUC = 0.88 | First microbiome study to apply SHAP |
| Divaris & Joshi 2020 [22] (ZOE 2.0) | >4000 children; saliva 16S + socio-demographics | Molecular + phenotype (aligned); no imaging | Random forest; permutation importance | AUC ≈ 0.80 for early-childhood caries | Largest paediatric microbiome cohort to date |
| Present study (2025) | 81 plaque 16S, 247 gingival arrays, 100 panoramics (un-matched) + 198 twin saliva (matched) | Three unimodal pipelines + twin validation | U-Net, two FNNs, twin FNN; SHAP on all tabular models | IoU 0.564 (imaging); r 0.25 (twin FNN) | First fully reproducible workflow spanning imaging, microbiome, transcriptome and twin heritability |
Disclaimer/Publisher’s Note: The statements, opinions and data contained in all publications are solely those of the individual author(s) and contributor(s) and not of MDPI and/or the editor(s). MDPI and/or the editor(s) disclaim responsibility for any injury to people or property resulting from any ideas, methods, instructions or products referred to in the content. |
© 2025 by the authors. Licensee MDPI, Basel, Switzerland. This article is an open access article distributed under the terms and conditions of the Creative Commons Attribution (CC BY) license (https://creativecommons.org/licenses/by/4.0/).
Share and Cite
Burlea, Ș.L.; Buzea, C.G.; Nedeff, F.; Mirilă, D.; Nedeff, V.; Agop, M.; Rusu, D.I.; Checheriță, L.E. Modular Deep-Learning Pipelines for Dental Caries Data Streams: A Twin-Cohort Proof-of-Concept. Dent. J. 2025, 13, 402. https://doi.org/10.3390/dj13090402
Burlea ȘL, Buzea CG, Nedeff F, Mirilă D, Nedeff V, Agop M, Rusu DI, Checheriță LE. Modular Deep-Learning Pipelines for Dental Caries Data Streams: A Twin-Cohort Proof-of-Concept. Dentistry Journal. 2025; 13(9):402. https://doi.org/10.3390/dj13090402
Chicago/Turabian StyleBurlea, Ștefan Lucian, Călin Gheorghe Buzea, Florin Nedeff, Diana Mirilă, Valentin Nedeff, Maricel Agop, Dragoș Ioan Rusu, and Laura Elisabeta Checheriță. 2025. "Modular Deep-Learning Pipelines for Dental Caries Data Streams: A Twin-Cohort Proof-of-Concept" Dentistry Journal 13, no. 9: 402. https://doi.org/10.3390/dj13090402
APA StyleBurlea, Ș. L., Buzea, C. G., Nedeff, F., Mirilă, D., Nedeff, V., Agop, M., Rusu, D. I., & Checheriță, L. E. (2025). Modular Deep-Learning Pipelines for Dental Caries Data Streams: A Twin-Cohort Proof-of-Concept. Dentistry Journal, 13(9), 402. https://doi.org/10.3390/dj13090402


