
Assessment of Exercise-Induced Dehydration Status Based on Oral Mucosal Moisture in a Field Survey

 ,
,  , , ,
, , ,
Abstract
1. Introduction
2. Materials and Methods
2.1. Study Participants
2.2. Experimental Design and Data Collection
2.3. Data Analysis
3. Results
4. Discussion
5. Conclusions
Author Contributions
Funding
Institutional Review Board Statement
Informed Consent Statement
Data Availability Statement
Conflicts of Interest
References
- American College of Sports Medicine; Sawka, M.N.; Burke, L.M.; Eichner, E.R.; Maughan, R.J.; Montain, S.J.; Stachenfeld, N.S. American College of Sports Medicine position stand. Exercise and Fluid replacement. Med. Sci. Sports Exerc. 2007, 39, 377–390. [Google Scholar] [CrossRef]
- Popkin, B.M.; D’Anci, K.E.; Rosenberg, I.H. Water, hydration, and health. Nutr. Rev. 2010, 68, 439–458. [Google Scholar] [CrossRef] [PubMed]
- Cian, C.; Barraud, P.A.; Melin, B.; Raphel, C. Effects of fluid ingestion on cognitive function after heat stress or exercise-induced dehydration. Int. J. Psychophysiol. 2001, 42, 243–251. [Google Scholar] [CrossRef]
- Cheuvront, S.N.; Carter, R., 3rd; Sawka, M.N. Fluid balance and endurance exercise performance. Curr. Sports Med. Rep. 2003, 2, 202–208. [Google Scholar] [CrossRef]
- Greiwe, J.S.; Staffey, K.S.; Melrose, D.R.; Narve, M.D.; Knowlton, R.G. Effects of dehydration on isometric muscular strength and endurance. Med. Sci. Sports Exerc. 1998, 30, 284–288. [Google Scholar] [CrossRef]
- Sawka, M.N.; Young, A.J.; Latzka, W.A.; Neufer, P.D.; Quigley, M.D.; Pandolf, K.B. Human tolerance to heat strain during exercise: Influence of hydration. J. Appl. Physiol. (1985) 1992, 73, 368–375. [Google Scholar] [CrossRef]
- Carter, R., 3rd; Cheuvront, S.N.; Williams, J.O.; Kolka, M.A.; Stephenson, L.A.; Sawka, M.N.; Amoroso, P.J. Epidemiology of hospitalizations and deaths from heat illness in soldiers. Med. Sci. Sports Exerc. 2005, 37, 1338–1344. [Google Scholar] [CrossRef]
- Sayers, S.P.; Clarkson, P.M. Exercise-induced rhabdomyolysis. Curr. Sports Med. Rep. 2002, 1, 59–60. [Google Scholar] [CrossRef]
- Dancaster, C.P.; Whereat, S.J. Fluid and electrolyte balance during the comrades marathon. S. Afr. Med. J. 1971, 45, 147–150. [Google Scholar]
- Barley, O.R.; Chapman, D.W.; Abbiss, C.R. Reviewing the current methods of assessing hydration in athletes. J. Int. Soc. Sports Nutr. 2020, 17, 52. [Google Scholar] [CrossRef]
- Armstrong, L.E. Hydration assessment techniques. Nutr. Rev. 2005, 63 (Suppl. 1), S40–S54. [Google Scholar] [CrossRef]
- Tanabe, M.; Takahashi, T.; Shimoyama, K.; Toyoshima, Y.; Ueno, T. Effects of rehydration and food consumption on salivary flow, pH and buffering capacity in young adult volunteers during ergometer exercise. J. Int. Soc. Sports Nutr. 2013, 10, 49. [Google Scholar] [CrossRef] [PubMed]
- Yoshihara, A.; Hirotomi, T.; Takano, N.; Kondo, T.; Hanada, N.; Miyazaki, H. Serum markers of chronic dehydration are associated with saliva spinability. J. Oral Rehabil. 2007, 34, 733–738. [Google Scholar] [CrossRef]
- Fortes, M.B.; Owen, J.A.; Raymond-Barker, P.; Bishop, C.; Elghenzai, S.; Oliver, S.J.; Walsh, N.P. Is this elderly patient dehydrated? Diagnostic accuracy of hydration assessment using physical signs, urine, and saliva markers. J. Am. Med. Dir. Assoc. 2015, 16, 221–228. [Google Scholar] [CrossRef] [PubMed]
- Shimizu, M.; Kinoshita, K.; Hattori, K.; Ota, Y.; Kanai, T.; Kobayashi, H.; Tokuda, Y. Physical signs of dehydration in the elderly. Intern. Med. 2012, 51, 1207–1210. [Google Scholar] [CrossRef]
- McGee, S.; Abernethy, W.B., 3rd; Simel, D.L. The rational clinical examination. Is this patient hypovolemic? JAMA 1999, 281, 1022–1029. [Google Scholar] [CrossRef]
- Robertson, G.L. Abnormalities of thirst regulation. Kidney Int. 1984, 25, 460–469. [Google Scholar] [CrossRef]
- Takahashi, F.; Takahashi, M.; Toya, S.; Morita, O. Relationship between medicine and stimulated saliva and oral moisture. Nihon Hotetsu Shika Gakkai Zasshi 2008, 52, 537–542. [Google Scholar] [CrossRef]
- Saito, M.; Ono, Y.; Kitamura, N.; Yamaguchi, M.; Saito, C. A study of moisture content in the oral mucosa in the elderly, Part II. Investigating moisture content in the oral mucosa in the elderly population residing at a nursing home. Ann. Jpn. Gerodont. Soc. 2008, 23, 97–105. [Google Scholar]
- Murakami, M.; Nishi, Y.; Kamashita, Y.; Nagaoka, E. Comparison of a saliva wetness tester and a moisture-checking device in patients with maxillary obturator prostheses. Gerodontology 2014, 31, 83–88. [Google Scholar] [CrossRef]
- Kanazaki, A.; Hu, J.; Otomaru, T.; Sumita, Y.I. Evaluation of xerostomia and effect of maxillofacial prosthesis use on mouth dryness in head and neck tumor patients. Int. J. Maxillofac. Prosthet. 2021, 4, 9–17. [Google Scholar] [CrossRef]
- Nishii, M.; Akashi, M.; Kakei, Y.; Hasegawa, T.; Minamikawa, T.; Furudoi, S.; Shibuya, Y.; Takahashi, M.; Otsuki, N.; Nibu, K.; et al. Sequential changes in oral dryness evaluated by a moisture-checking device in patients with oropharyngeal cancer during chemoradiotherapy: A pilot study. Oral Health Dent. Manag. 2014, 13, 507–511. [Google Scholar] [PubMed]
- Fukushima, Y.; Sano, Y.; Isozaki, Y.; Endo, M.; Tomoda, T.; Kitamura, T.; Sato, T.; Kamijo, Y.; Haga, Y.; Yoda, T. A pilot clinical evaluation of oral mucosal dryness in dehydrated patients using a moisture-checking device. Clin. Exp. Dent. Res. 2019, 5, 116–120. [Google Scholar] [CrossRef] [PubMed]
- Tanabe, G.; Hasunuma, T.; Inai, Y.; Takeuchi, Y.; Kobayashi, H.; Hayashi, K.; Shimizu, S.; Kamiya, N.S.; Churei, H.; Sumita, Y.I.; et al. Potential assessment of dehydration during high-intensity training using a capacitance sensor for oral mucosal moisture: Evaluation of elite athletes in a field-based survey. Chemosensors 2021, 9, 196. [Google Scholar] [CrossRef]
- Godek, S.F.; Bartolozzi, A.R.; Burkholder, R.; Sugarman, E.; Peduzzi, C. Sweat rates and fluid turnover in professional football players: A comparison of National Football League linemen and backs. J. Athl. Train. 2008, 43, 184–189. [Google Scholar] [CrossRef]
- Godek, S.F.; Bartolozzi, A.R.; Godek, J.J. Sweat rate and fluid turnover in American football players compared with runners in a hot and humid environment. Br. J. Sports Med. 2005, 39, 205–211. [Google Scholar] [CrossRef]
- Papacosta, E.; Nassis, G.P. Saliva as a tool for monitoring steroid, peptide and immune markers in sport and exercise science. J. Sci. Med. Sport 2011, 14, 424–434. [Google Scholar] [CrossRef]
- Takahashi, F.; Koji, T.; Morita, O. The usefulness of an oral moisture checking device (Moisture Checker for Mucus). Nihon Hotetsu Shika Gakkai Zasshi 2005, 49, 283–289. (In Japanese). [Google Scholar] [CrossRef]
- Fukushima, Y.; Yoda, T.; Araki, R.; Sakai, T.; Toya, S.; Ito, K.; Funayama, S.; Enoki, Y.; Sato, T. Evaluation of oral wetness using an improved moisture-checking device for the diagnosis of dry mouth. Oral Sci. Int. 2017, 14, 33–36. [Google Scholar] [CrossRef]
- Baker, L.B.; Barnes, K.A.; Anderson, M.L.; Passe, D.H.; Stofan, J.R. Normative data for regional sweat sodium concentration and whole-body sweating rate in athletes. J. Sports Sci. 2016, 34, 358–368. [Google Scholar] [CrossRef]
- Sawka, M.N.; Convertino, V.A.; Eichner, E.R.; Schnieder, S.M.; Young, A.J. Blood volume: Importance and adaptations to exercise training, environmental stresses, and trauma/sickness. Med. Sci. Sports Exerc. 2000, 32, 332–348. [Google Scholar] [CrossRef] [PubMed]
- Baker, L.B.; Jeukendrup, A.E. Optimal composition of fluid-replacement beverages. Compr. Physiol. 2014, 4, 575–620. [Google Scholar] [CrossRef] [PubMed]
- Kitson, O.; Rutherfurd-Markwick, K.; Foskett, A.; Lee, J.K.W.; Diako, C.; Wong, M.; Ali, A. Sensory Perception of an Oral Rehydration Solution during Exercise in the Heat. Nutrients 2021, 13, 3313. [Google Scholar] [CrossRef]
- Francisco, R.; Jesus, F.; Di Vincenzo, O.; Nunes, C.L.; Alvim, M.; Sardinha, L.B.; Mendonca, G.V.; Lukaski, H.; Silva, A.M. Assessment of exercise-induced dehydration in underhydrated athletes: Which method shows the most promise? Clin. Nutr. 2024, 43, 2139–2148. [Google Scholar] [CrossRef]
- Walsh, N.P.; Gleeson, M.; Shephard, R.J.; Gleeson, M.; Woods, J.A.; Bishop, N.C.; Fleshner, M.; Green, C.; Pedersen, B.K.; Hoffman-Goetz, L.; et al. Position statement. Part one: Immune function and exercise. Exerc. Immunol. Rev. 2011, 17, 6–63. [Google Scholar]


| Exercise Index | Value (Mean ± Standard Deviation) |
|---|---|
| Maximum heart rate (bpm) | 178.2 ± 15.2 |
| Running distance (km) | 18.6 ± 2.0 |
| Perceived exertion (Borg scale) | 4.5 ± 1.3 |
| Parameter | Pre-Exercise | Post-Exercise | Difference | During Exercise |
|---|---|---|---|---|
| Body weight (kg) | 60.5 ± 12.1 | 59.4 ± 12.1 | 1.1 ± 0.5 * | |
| Fluid intake (L) | 0.5 ± 0.2 | |||
| Sweat rate (L/h) | 0.77 ± 0.26 | |||
| Saliva flow rate (mL/min) | 1.0 ± 0.5 | 0.7 ± 0.5 | 0.3 ± 0.4 * | |
| Oral mucosal moisture | 30.8 ± 1.3 | 29.5 ± 1.6 | 1.4 ± 1.6 * |
| S-IgA | Pre-Exercise | Post-Exercise |
|---|---|---|
| Concentration (µg/mL) | 371.7 ± 258.3 | 390.0 ± 196.4 |
| Secretion rate (µg/min) | 333.0 ± 240.4 | 264.6 ± 179.8 * |
| Outcome | p-Value |
|---|---|
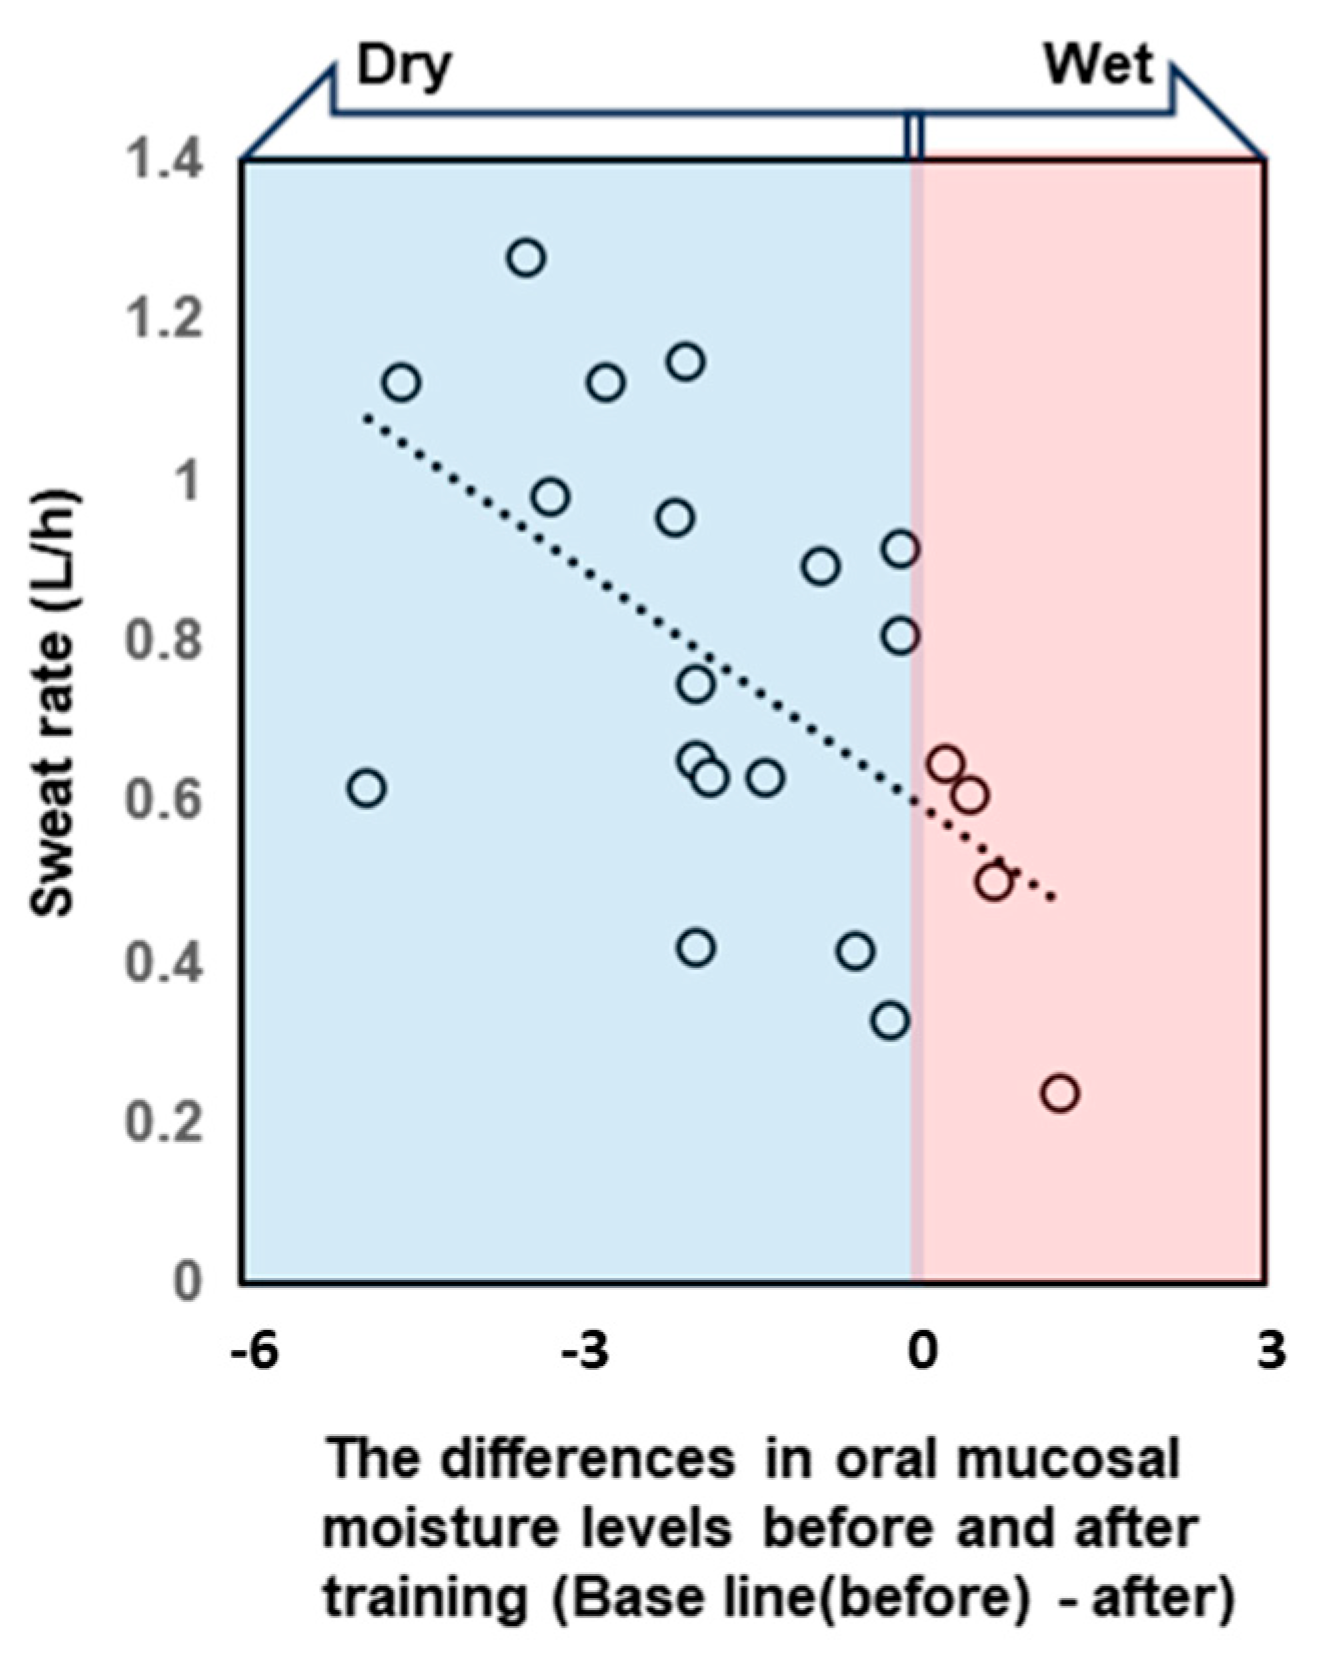
| differences in oral mucosal moisture levels | 0.02 * |
| body weight | 0.05 |
| gender | 0.11 |
| pre-training oral mucosal moisture content | 0.33 |
| differences in oral mucosal moisture levels × pre-training oral mucosal moisture content | 0.56 |
| differences in oral mucosal moisture levels × gender | 0.69 |
| differences in oral mucosal moisture levels × body weight | 0.84 |
Disclaimer/Publisher’s Note: The statements, opinions and data contained in all publications are solely those of the individual author(s) and contributor(s) and not of MDPI and/or the editor(s). MDPI and/or the editor(s) disclaim responsibility for any injury to people or property resulting from any ideas, methods, instructions or products referred to in the content. |
© 2024 by the authors. Licensee MDPI, Basel, Switzerland. This article is an open access article distributed under the terms and conditions of the Creative Commons Attribution (CC BY) license (https://creativecommons.org/licenses/by/4.0/).
Share and Cite
Tanabe, G.; Hasunuma, T.; Takeuchi, Y.; Churei, H.; Hayashi, K.; Togawa, K.; Moriya, N.; Ueno, T. Assessment of Exercise-Induced Dehydration Status Based on Oral Mucosal Moisture in a Field Survey. Dent. J. 2025, 13, 5. https://doi.org/10.3390/dj13010005
Tanabe G, Hasunuma T, Takeuchi Y, Churei H, Hayashi K, Togawa K, Moriya N, Ueno T. Assessment of Exercise-Induced Dehydration Status Based on Oral Mucosal Moisture in a Field Survey. Dentistry Journal. 2025; 13(1):5. https://doi.org/10.3390/dj13010005
Chicago/Turabian StyleTanabe, Gen, Tetsuya Hasunuma, Yasuo Takeuchi, Hiroshi Churei, Kairi Hayashi, Kaito Togawa, Naoki Moriya, and Toshiaki Ueno. 2025. "Assessment of Exercise-Induced Dehydration Status Based on Oral Mucosal Moisture in a Field Survey" Dentistry Journal 13, no. 1: 5. https://doi.org/10.3390/dj13010005
APA StyleTanabe, G., Hasunuma, T., Takeuchi, Y., Churei, H., Hayashi, K., Togawa, K., Moriya, N., & Ueno, T. (2025). Assessment of Exercise-Induced Dehydration Status Based on Oral Mucosal Moisture in a Field Survey. Dentistry Journal, 13(1), 5. https://doi.org/10.3390/dj13010005