Accuracy of the Hounsfield Unit Values Measured by Implant Planning Software

 , ,
, ,
Abstract
1. Introduction
2. Materials and Methods
2.1. Specimen Preparation
2.2. CT Imaging
2.3. HU Measurement Method
2.4. Study Items
2.5. Statistical Analyses
3. Results
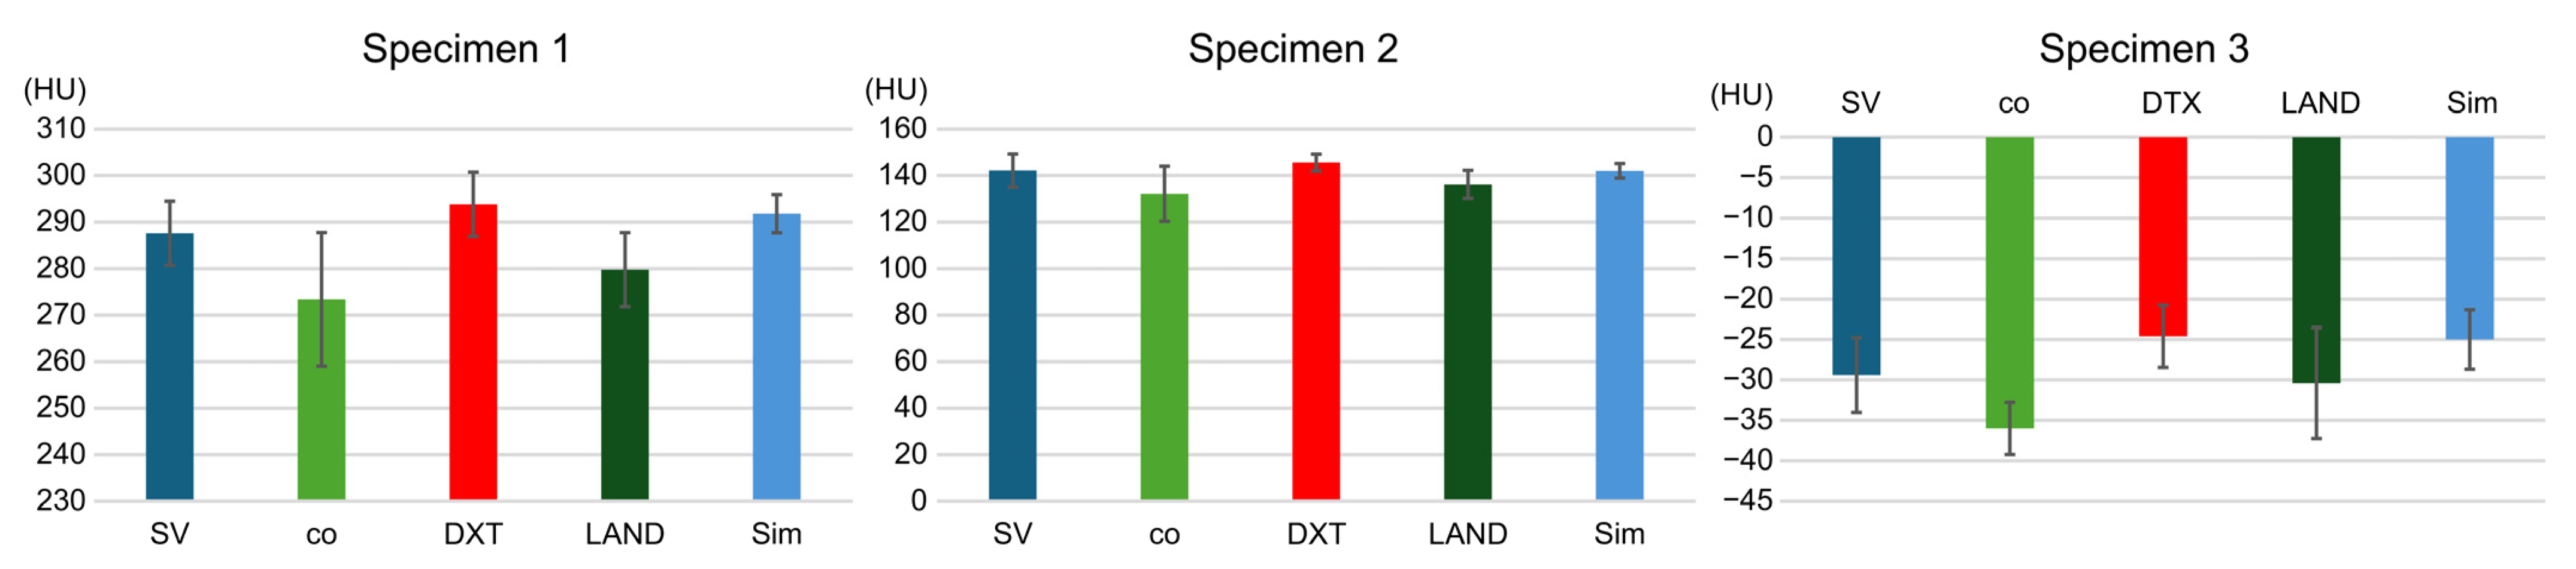
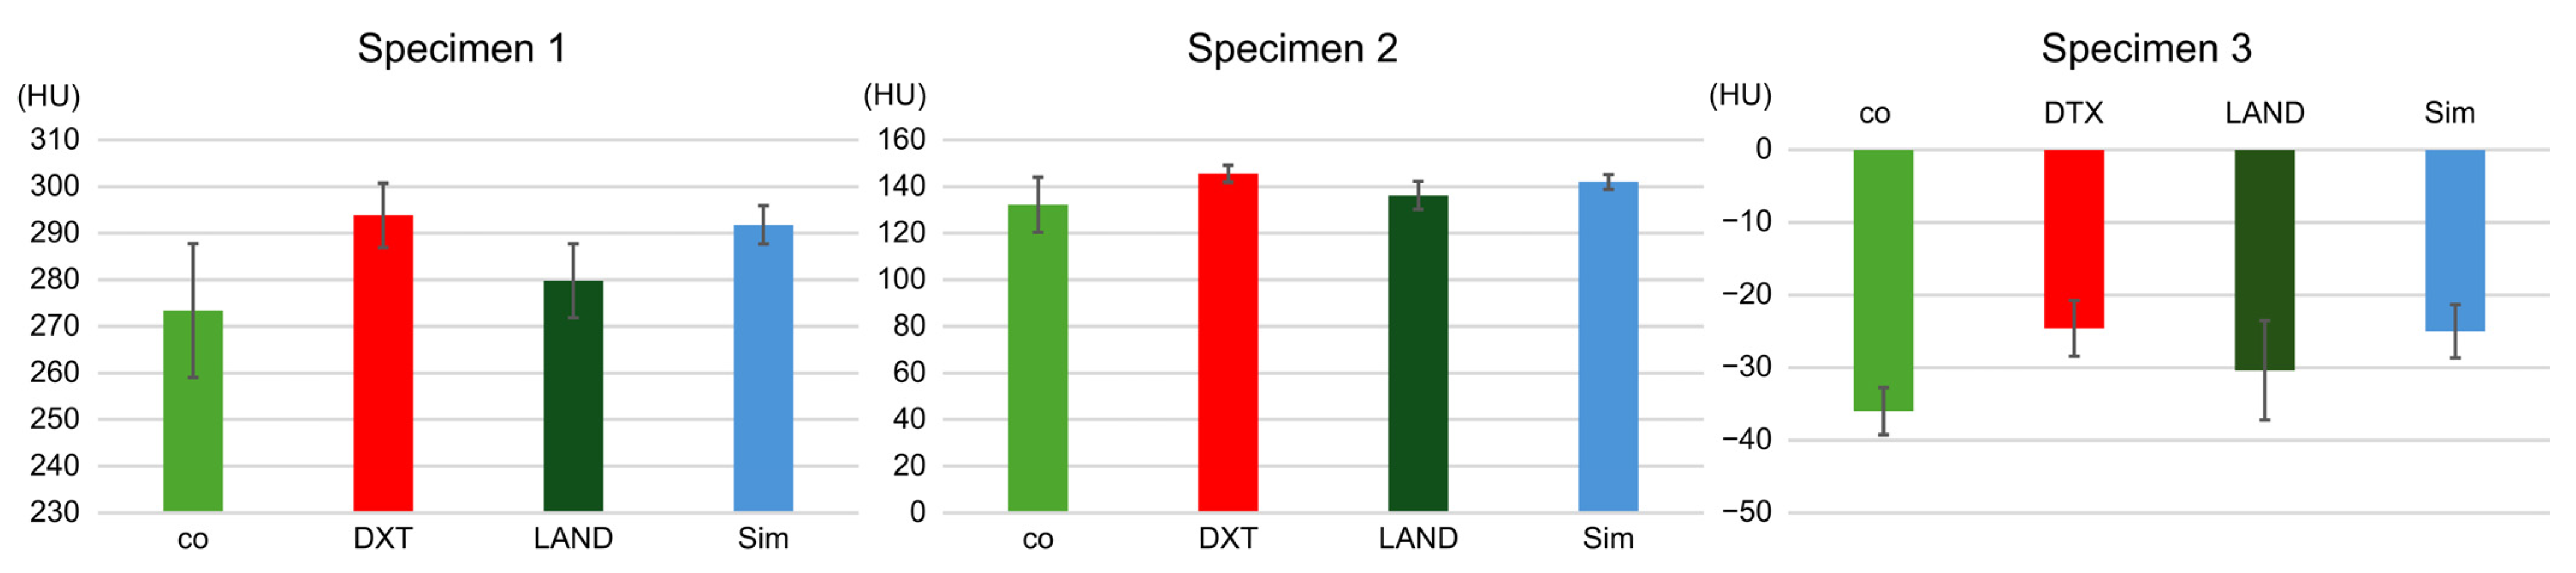
3.1. Study Item 1
3.2. Study Item 2
3.3. Study Item 3
3.4. Study Item 4
4. Discussion
5. Conclusions
Author Contributions
Funding
Institutional Review Board Statement
Informed Consent Statement
Data Availability Statement
Conflicts of Interest
References
- Perschbacher, S. Interpretation of panoramic radiographs. Aust. Dent. J. 2012, 57 (Suppl. S1), 40–45. [Google Scholar] [CrossRef]
- Yüksel, A.E.; Gültekin, S.; Simsar, E.; Özdemir, Ş.D.; Gündoğar, M.; Tokgöz, S.B.; Hamamcı, İ.E. Dental enumeration and multiple treatment detection on panoramic X-rays using deep learning. Sci. Rep. 2021, 11, 12342. [Google Scholar] [CrossRef]
- Kumar, A.; Bhadauria, H.S.; Singh, A. Descriptive analysis of dental X-ray images using various practical methods: A review. PeerJ Comput. Sci. 2021, 7, e620. [Google Scholar] [CrossRef] [PubMed]
- Dings, J.P.; Verhamme, L.; Merkx, M.A.; Xi, T.; Meijer, G.J.; Maal, T.J. Reliability and accuracy of cone beam computed tomography versus conventional multidetector computed tomography for image-guided craniofacial implant planning: An in vitro study. Int. J. Oral Maxillofac. Implants 2019, 34, 665–672. [Google Scholar] [CrossRef] [PubMed]
- Kuroshima, S.; Kaku, M.; Ishimoto, T.; Sasaki, M.; Nakano, T.; Sawase, T. A paradigm shift for bone quality in dentistry: A literature review. J. Prosthodont. Res. 2017, 61, 353–362. [Google Scholar] [CrossRef] [PubMed]
- Wang, S.H.; Hsu, J.T.; Fuh, L.J.; Peng, S.L.; Huang, H.L.; Tsai, M.T. New classification for bone type at dental implant sites: A dental computed tomography study. BMC Oral Health 2023, 23, 324. [Google Scholar] [CrossRef]
- Bruno, V.; Berti, C.; Barausse, C.; Badino, M.; Gasparro, R.; Ippolito, D.R.; Felice, P. Clinical relevance of bone density values from ct related to dental implant stability: A retrospective study. BioMed Res. Int. 2018, 2018, 6758245. [Google Scholar] [CrossRef] [PubMed]
- Misch, C.E. Density of bone: Effect on treatment plans, surgical approach, healing, and progressive boen loading. Int. J. Oral Implantol. 1990, 6, 23–31. [Google Scholar] [PubMed]
- Lekholm, U.; Zarb, G.A.; Albrektsson, T. Patient selection and preparation. In Tissue Integrated Prostheses, 1st ed.; Brånemark, P.I., Ed.; Quintessence Publishing Co. Inc.: Chicago, IL, USA, 1985; pp. 199–209. [Google Scholar]
- Cavdar, F.H.; Keceli, H.G.; Hatipoglu, H.; Demiralp, B.; Caglayan, F. Evaluation of extraction site dimensions and density using computed tomography treated with different graft materials: A preliminary study. Implant Dent. 2017, 26, 270–274. [Google Scholar] [CrossRef]
- Khaled, H.; Atef, M.; Hakam, M. Maxillary sinus floor elevation using hydroxyapatite nano particles vs tenting technique with simultaneous implant placement: A randomized clinical trial. Clin. Implant Dent. Relat. Res. 2019, 21, 1241–1252. [Google Scholar] [CrossRef]
- Han, M.; Kim, H.J.; Choi, J.W.; Park, D.Y.; Han, J.G. Diagnostic usefulness of cone-beam computed tomography versus multi-detector computed tomography for sinonasal structure evaluation. Laryngoscope Investig. Otolaryngol. 2022, 7, 662–670. [Google Scholar] [CrossRef] [PubMed]
- Kunz, A.S.; Patzer, T.S.; Grunz, J.P.; Luetkens, K.S.; Hartung, V.; Hendel, R.; Fieber, T.; Genest, F.; Ergün, S.; Bley, T.A.; et al. Metal artifact reduction in ultra-high-resolution cone-beam CT imaging with a twin robotic X-ray system. Sci. Rep. 2022, 12, 15549. [Google Scholar] [CrossRef] [PubMed]
- Pauwels, R.; Jacobs, R.; Singer, S.R.; Mupparapu, M. CBCT-based bone quality assessment: Are Hounsfield units applicable? Dentomaxillofac. Radiol. 2015, 44, 20140238. [Google Scholar] [CrossRef] [PubMed]
- Ribeiro-Rotta, R.F.; Pereira, A.C.; Oliveira, G.H.; Freire, M.C.; Leles, C.R.; Lindh, C. An exploratory survey of diagnostic methods for bone quality assessment used by Brazilian dental implant specialists. J. Oral Rehabil. 2010, 37, 698–703. [Google Scholar] [CrossRef]
- Selvaraj, A.; Jain, R.K.; Nagi, R.; Balasubramaniam, A. Correlation between gray values of cone-beam computed tomograms and Hounsfield units of computed tomograms: A systematic review and meta-analysis. Imaging Sci. Dent. 2022, 52, 133–140. [Google Scholar] [CrossRef]
- Eguren, M.; Holguin, A.; Diaz, K.; Vidalon, J.; Linan, C.; Pacheco-Pereira, C.; Lagravere Vich, M.O. Can gray values be converted to Hounsfield units? A systematic review. Dentomaxillofac. Radiol. 2022, 51, 20210140. [Google Scholar] [CrossRef]
- Nagata, K.; Fuchigami, K.; Hoshi, N.; Atsumi, M.; Kimoto, K.; Kawana, H. Accuracy of guided surgery using the silicon impression and digital impression method for the mandibular free end: A comparative study. Int. J. Implant Dent. 2021, 7, 2. [Google Scholar] [CrossRef]
- Nagata, K.; Okubo, M.; Saito, K.; Nakashizu, T.; Atsumi, M.; Kawana, H. Verification of the accuracy of dynamic navigation for conventional and mouthpiece methods: In vivo study. BMC Oral Health 2024, 24, 596. [Google Scholar] [CrossRef]
- Al-Ekrish, A.A. Comparative study of the accuracy of CBCT implant site measurements using different software programs. Saudi Dent. J. 2021, 33, 355–361. [Google Scholar] [CrossRef]
- Cheng, C.W.; Zhao, L.; Wolanski, M.; Zhao, Q.; James, J.; Dikeman, K.; Mills, M.; Li, M.; Srivastava, S.P.; Lu, X.Q.; et al. Comparison of tissue characterization curves for different CT scanners: Implication in proton therapy treatment planning. Transl. Cancer Res. 2013, 1, 4. [Google Scholar] [CrossRef]
- Dula, K.; Mini, R.; Lambrecht, J.T.; van der Stelt, P.F.; Schneeberger, P.; Clemens, G.; Sanderink, H.; Buser, D. Hypothetical mortality risk associated with spiral tomography of the maxilla and mandible prior to endosseous implant treatment. Eur. J. Oral Sci. 1997, 105, 123–129. [Google Scholar] [CrossRef] [PubMed]
- Gaur, A.; Dhillon, M.; Puri, N.; Sethi Ahuja, U.; Rathore, A. Questionable accuracy of CBCT in determining bone density: A comparative CBCT-CT in vitro study. Dent. Med. Probl. 2022, 59, 413–419. [Google Scholar] [CrossRef] [PubMed]
- Codari, M.; de Faria Vasconcelos, K.; Ferreira Pinheiro Nicolielo, L.; Haiter Neto, F.; Jacobs, R. Quantitative evaluation of metal artifacts using different CBCT devices, high-density materials and field of views. Clin. Oral Implants Res. 2017, 28, 1509–1514. [Google Scholar] [CrossRef] [PubMed]
- Pauwels, R.; Nackaerts, O.; Bellaiche, N.; Stamatakis, H.; Tsiklakis, K.; Walker, A.; Bosmans, H.; Bogaerts, R.; Jacobs, R.; Horner, K.; et al. Variability of dental cone beam CT grey values for density estimations. Br. J. Radiol. 2013, 86, 20120135. [Google Scholar] [CrossRef]
- Razi, T.; Emamverdizadeh, P.; Nilavar, N.; Razi, S. Comparison of the Hounsfield unit in CT scan with the gray level in cone-beam CT. J. Dent. Res. Dent. Clin. Dent. Prospects 2019, 13, 177–182. [Google Scholar] [CrossRef]
- Palomo, J.M.; Rao, P.S.; Hans, M.G. Influence of CBCT exposure conditions on radiation dose. Oral Surg. Oral Med. Oral Pathol. Oral Radiol. Endodontol. 2008, 105, 773–782. [Google Scholar] [CrossRef]
- Rodrigues, A.F.; Campos, M.J.S.; Chaoubah, A.; Fraga, M.R.; Farinazzo Vitral, R.W. Use of gray values in CBCT and MSCT images for determination of density: Influence of variation of FOV size. Implant Dent. 2015, 24, 155–159. [Google Scholar] [CrossRef]
- Shokri, A.; Ramezani, L.; Bidgoli, M.; Akbarzadeh, M.; Ghazikhanlu-Sani, K.; Fallahi-Sichani, H. Effect of field-of-view size on gray values derived from cone-beam computed tomography compared with the Hounsfield unit values from multidetector computed tomography scans. Imaging Sci. Dent. 2018, 48, 31–39. [Google Scholar] [CrossRef]
- Yadegari, A.; Safi, Y.; Shahbazi, S.; Yaghoutiazar, S.; Ghazizadeh Ahsaie, M. Assessment of CBCT gray value in different regions-of-interest and fields-of-view compared to Hounsfield unit. Dentomaxillofac. Radiol. 2023, 52, 20230187. [Google Scholar] [CrossRef]
- Spin-Neto, R.; Marcantonio, E., Jr.; Gotfredsen, E.; Wenzel, A. Exploring CBCT-based DICOM files. A systematic review on the properties of images used to evaluate maxillofacial bone grafts. J. Digit. Imaging 2011, 24, 959–966. [Google Scholar] [CrossRef]
- Das, I.J.; Cheng, C.W.; Cao, M.; Johnstone, P.A.S. Computed tomography imaging parameters for inhomogeneity correction in radiation treatment planning. J. Med. Phys. 2016, 41, 3–11. [Google Scholar] [CrossRef] [PubMed]
- Hu, Y.; Xu, S.; Li, B.; Inscoe, C.R.; Tyndall, D.A.; Lee, Y.Z.; Lu, J.; Zhou, O. Improving the accuracy of bone mineral density using a multisource CBCT. Sci. Rep. 2024, 4, 3887. [Google Scholar] [CrossRef]
- Ohba, S.; Sumita, Y.; Nakatani, Y.; Noda, S.; Asahina, I. Alveolar bone preservation by a hydroxyapatite/collagen composite material after tooth extraction. Clin. Oral Investig. 2019, 23, 2413–2419. [Google Scholar] [CrossRef] [PubMed]
- Nagata, K.; Fuchigami, K.; Kitami, R.; Okuhama, Y.; Wakamori, K.; Sumitomo, H.; Kim, H.; Okubo, M.; Kawana, H. Comparison of the performances of low-crystalline carbonate apatite and Bio-Oss in sinus augmentation using three-dimensional image analysis. Int. J. Implant Dent. 2021, 7, 24. [Google Scholar] [CrossRef] [PubMed]
- Nagata, K.; Kamata, M.; Okuhama, Y.; Wakamori, K.; Okubo, M.; Tsuruoka, H.; Atsumi, M.; Kawana, H. Volume change after maxillary sinus floor elevation with apatite carbonate and octacalcium phosphate. Int. J. Implant Dent. 2024, 10, 7. [Google Scholar] [CrossRef]
- Tabrizi, R.; Sadeghi, H.M.; Mohammadi, M.; Barouj, M.D.; Kheyrkhahi, M. Evaluation of bone density in sinus elevation by using allograft and xenograft: A CBCT study. Int. J. Oral Maxillofac. Implants 2022, 37, 114–119. [Google Scholar] [CrossRef]
- Loveless, T.P.; Kilinc, Y.; Altay, M.A.; Flores-Hidalgo, A.; Baur, D.A.; Quereshy, F.A. Hounsfield unit comparison of grafted versus non-grafted extraction sockets. J. Oral Sci. 2015, 57, 195–200. [Google Scholar] [CrossRef]
- Karagah, A.; Tabrizi, R.; Mohammadhosseinzade, P.; Mirzadeh, M.; Tofangchiha, M.; Lajolo, C.; Patini, R. Effect of sinus floor augmentation with platelet-rich fibrin versus allogeneic bone graft on stability of one-stage dental implants: A split-mouth randomized clinical trial. Int. J. Environ. Res. Public Health 2022, 19, 9569. [Google Scholar] [CrossRef]
- Mano, T.; Akita, K.; Fukuda, N.; Kamada, K.; Kurio, N. Histological comparison of three apatitic bone substitutes with different carbonate contents in alveolar bone defects in a beagle mandible with simultaneous implant installation. J. Biomed. Mater. Res. B Appl. Biomater. 2020, 108, 1450–1459. [Google Scholar] [CrossRef]
- Jeong, D.K.; Lee, S.C.; Huh, K.H.; Yi, W.J.; Heo, M.S.; Lee, S.S.; Choi, S.C. Comparison of effective dose for imaging of mandible between multi-detector CT and cone-beam CT. Imaging Sci. Dent. 2012, 42, 65–70. [Google Scholar] [CrossRef]


| CBCT1 | CBCT2 | ||||||||
|---|---|---|---|---|---|---|---|---|---|
| Specimen 1 | SV | co | DTX | LAND | Sim | co | DTX | LAND | Sim |
| Mean | 287.6 | 220 | 236.6 | 232 | 239.2 | 690.8 | 709.2 | 712.6 | 718.6 |
| Standard deviation | 6.9 | 7.4 | 3.7 | 5.1 | 3.3 | 5.5 | 3.2 | 4.2 | 6.9 |
| Significant difference | p < 0.001 | p < 0.001 | p < 0.001 | p < 0.001 | p < 0.001 | p < 0.001 | p < 0.001 | p < 0.001 | |
| Specimen 2 | |||||||||
| Mean | 142.2 | 77.2 | 79.6 | 79.6 | 80.2 | 567 | 572.4 | 591.8 | 576.8 |
| Standard deviation | 7.1 | 2.8 | 5.2 | 5.2 | 4.4 | 3.7 | 10.2 | 3.7 | 4.6 |
| Significant difference | p < 0.001 | p < 0.001 | p < 0.001 | p < 0.001 | p < 0.001 | p < 0.001 | p < 0.001 | p < 0.001 | |
| Specimen 3 | |||||||||
| Mean | −29.4 | −129.6 | −122.2 | −133 | −128.8 | 412.8 | 416.6 | 427.6 | 424 |
| Standard deviation | 4.6 | 4.3 | 2.7 | 5.4 | 0.4 | 3.8 | 6.4 | 4.2 | 4.9 |
| Significant difference | p < 0.001 | p < 0.001 | p < 0.001 | p < 0.001 | p < 0.001 | p < 0.001 | p < 0.001 | p < 0.001 | |
Disclaimer/Publisher’s Note: The statements, opinions and data contained in all publications are solely those of the individual author(s) and contributor(s) and not of MDPI and/or the editor(s). MDPI and/or the editor(s) disclaim responsibility for any injury to people or property resulting from any ideas, methods, instructions or products referred to in the content. |
© 2024 by the authors. Licensee MDPI, Basel, Switzerland. This article is an open access article distributed under the terms and conditions of the Creative Commons Attribution (CC BY) license (https://creativecommons.org/licenses/by/4.0/).
Share and Cite
Nagata, K.; Kouzai, Y.; Inaba, K.; Fujii, M.; Atsumi, M.; Kimoto, K.; Kuroda, S.; Kawana, H. Accuracy of the Hounsfield Unit Values Measured by Implant Planning Software. Dent. J. 2024, 12, 413. https://doi.org/10.3390/dj12120413
Nagata K, Kouzai Y, Inaba K, Fujii M, Atsumi M, Kimoto K, Kuroda S, Kawana H. Accuracy of the Hounsfield Unit Values Measured by Implant Planning Software. Dentistry Journal. 2024; 12(12):413. https://doi.org/10.3390/dj12120413
Chicago/Turabian StyleNagata, Koudai, Yusuke Kouzai, Keitaro Inaba, Manabu Fujii, Mihoko Atsumi, Katsuhiko Kimoto, Shinji Kuroda, and Hiromasa Kawana. 2024. "Accuracy of the Hounsfield Unit Values Measured by Implant Planning Software" Dentistry Journal 12, no. 12: 413. https://doi.org/10.3390/dj12120413
APA StyleNagata, K., Kouzai, Y., Inaba, K., Fujii, M., Atsumi, M., Kimoto, K., Kuroda, S., & Kawana, H. (2024). Accuracy of the Hounsfield Unit Values Measured by Implant Planning Software. Dentistry Journal, 12(12), 413. https://doi.org/10.3390/dj12120413