

Spectrophotometric Analysis of Coronal Discoloration In Vitro Induced by Bioceramic Cements


 , ,
, ,  ,
,  and
and 
Abstract
1. Introduction
2. Materials and Methods
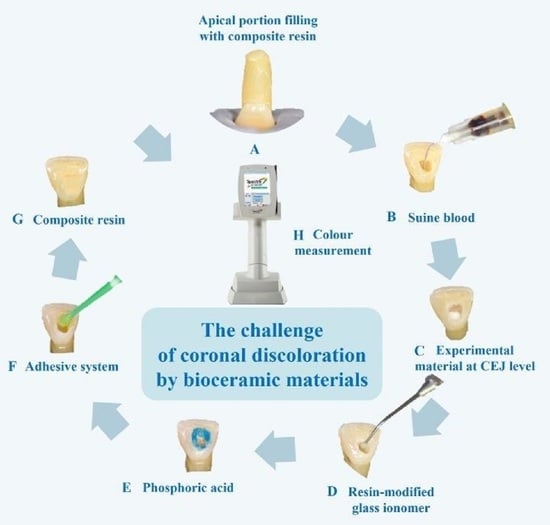
2.1. Sample Preparation
2.2. Experimental Setup/Procedure
2.3. Statistical Analysis
3. Results
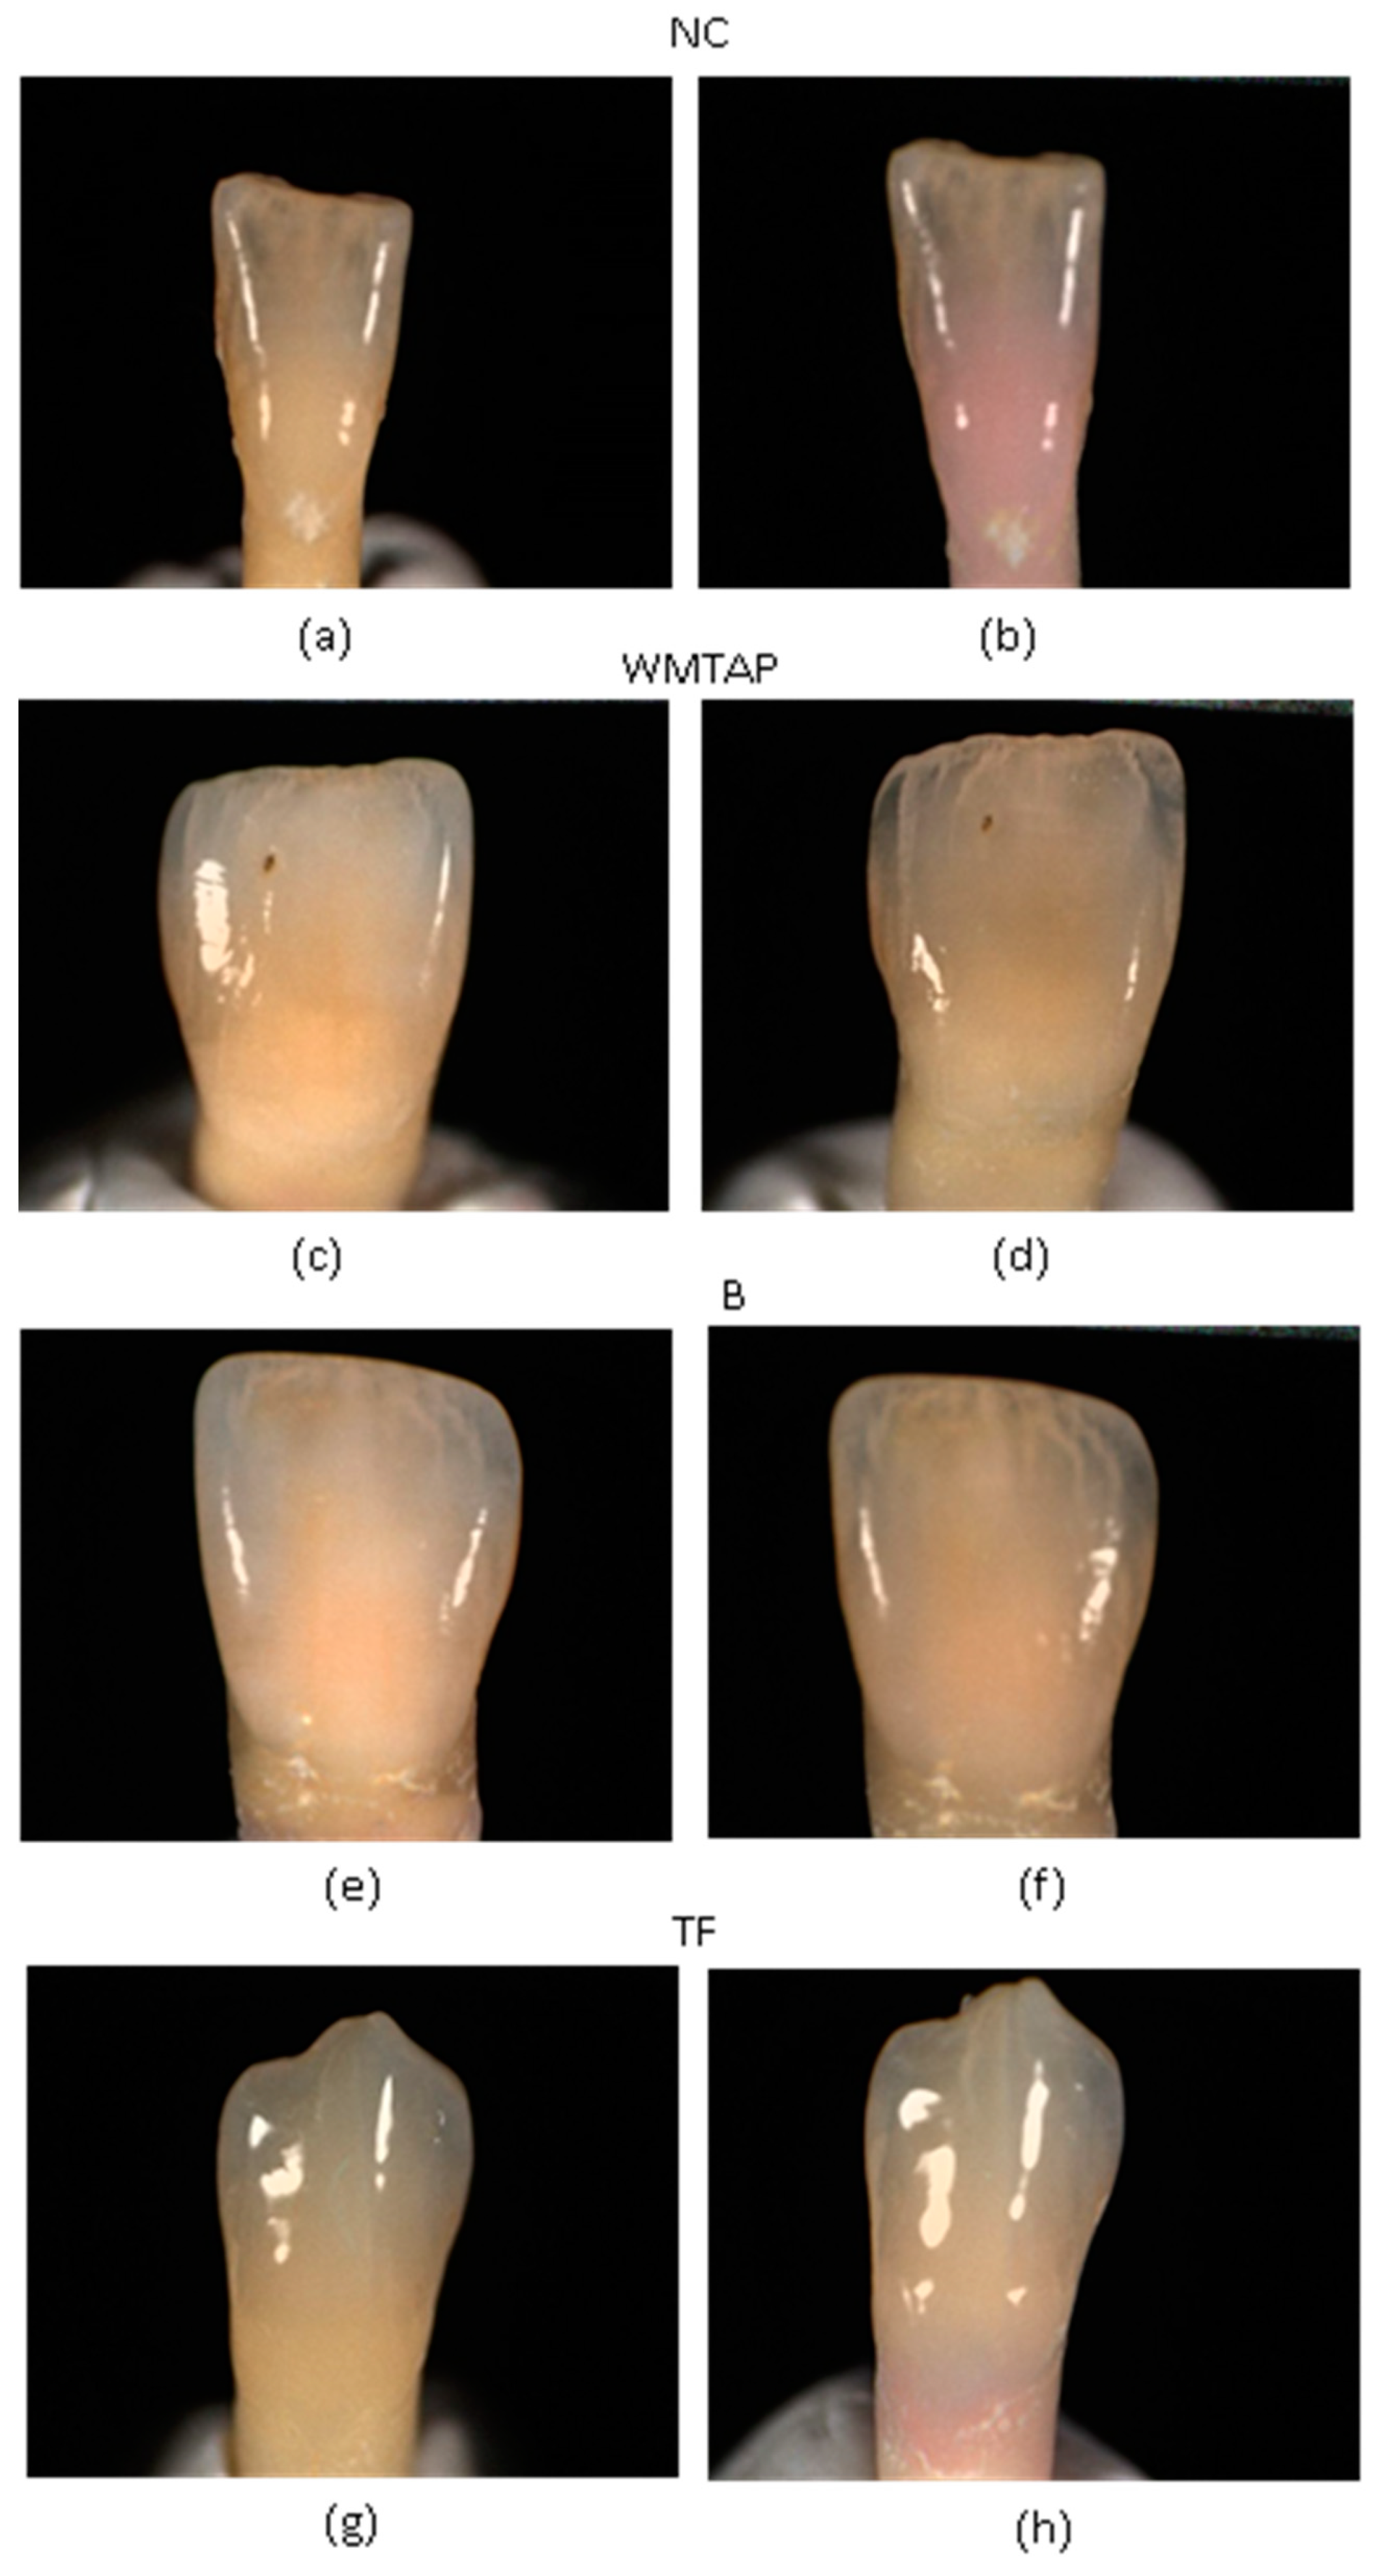
3.1. Descriptive Analysis
3.2. Inferential Analysis
4. Discussion
5. Conclusions
Author Contributions
Funding
Institutional Review Board Statement
Informed Consent Statement
Data Availability Statement
Conflicts of Interest
References
- Smith, A.J.; Cassidy, N.; Perry, H.; Begue-Kirn, C.; Ruch, J.V.; Lesot, H. Reactionary Dentinogenesis. Int. J. Dev. Biol. 1995, 39, 273–280. [Google Scholar] [CrossRef]
- Smith, A.J.; Scheven, B.A.; Takahashi, Y.; Ferracane, J.L.; Shelton, R.M.; Cooper, P.R. Dentine as a Bioactive Extracellular Matrix. Arch. Oral. Biol. 2012, 57, 109–121. [Google Scholar] [CrossRef] [PubMed]
- Miyashita, H.; Worthington, H.V.; Qualtrough, A.; Plasschaert, A. Pulp Management for Caries in Adults: Maintaining Pulp Vitality. Cochrane Database Syst. 2016, 2016, CD004484. [Google Scholar] [CrossRef]
- Chang, J.Y.; Chen, W.C.; Huang, T.K.; Wang, J.C.; Fu, P.S.; Chen, J.H.; Hung, C.C. Evaluation of the Accuracy and Limitations of Three Tooth-Color Measuring Machines. J. Dent. Sci. 2015, 10, 16–20. [Google Scholar] [CrossRef]
- Lagouvardos, P.E.; Fougia, A.G.; Diamantopoulou, S.A.; Polyzois, G.L. Repeatability and Interdevice Reliability of Two Portable Color Selection Devices in Matching and Measuring Tooth Color. J. Prosthet. Dent. 2009, 101, 40–45. [Google Scholar] [CrossRef]
- Karabucak, B.; Li, D.; Lim, J.; Iqbal, M. Vital Pulp Therapy with Mineral Trioxide Aggregate. Dent. Traumatol. 2005, 21, 240–243. [Google Scholar] [CrossRef] [PubMed]
- Belobrov, I.; Parashos, P. Treatment of Tooth Discoloration after the Use of White Mineral Trioxide Aggregate. J. Endod. 2011, 37, 1017–1020. [Google Scholar] [CrossRef]
- Kahler, B.; Mistry, S.; Moule, A.; Ringsmuth, A.K.; Case, P.; Thomson, A.; Holcombe, T. Revascularization Outcomes: A Prospective Analysis of 16 Consecutive Cases. J. Endod. 2014, 40, 333–338. [Google Scholar] [CrossRef]
- Ahmed, H.M.A.; Abbott, P.V. Discolouration Potential of Endodontic Procedures and Materials: A Review. Int. Endod. J. 2012, 45, 883–897. [Google Scholar] [CrossRef] [PubMed]
- Nagas, E.; Cehreli, Z.C.; Uyanik, M.O.; Vallittu, P.K.; Lassila, L.V.J. Effect of Several Intracanal Medicaments on the Push-out Bond Strength of ProRoot MTA and Biodentine. Int. Endod. J. 2016, 49, 184–188. [Google Scholar] [CrossRef] [PubMed]
- Dong, X.; Xu, X. Bioceramics in Endodontics: Updates and Future Perspectives. Bioengineering 2023, 10, 354. [Google Scholar] [CrossRef]
- Jitaru, S.; Hodisan, I.; Timis, L.; Lucian, A.; Bud, M. The Use of Bioceramics in Endodontics—Literature Review. Clujul Med. 2016, 89, 470. [Google Scholar] [CrossRef] [PubMed]
- Ruyter, I.; Nilner, K.; Moiler, B. Color Stability of Dental Composite Resin Materials for Crown and Bridge Veneers. Dent. Mater. 1987, 3, 246–251. [Google Scholar] [CrossRef]
- Abu-Bakr, N.; Han, L.; Okamoto, A.; Iwaku, M. Color Stability of Compomer after Immersion in Various Media. J. Esthet. Dent. 2000, 12, 258–263. [Google Scholar] [CrossRef]
- Yamanel, K.; Caglar, A.; Özcan, M.; Gulsah, K.; Bagis, B. Assessment of Color Parameters of Composite Resin Shade Guides Using Digital Imaging versus Colorimeter. J. Esthet. Restor. Dent. 2010, 22, 379–388. [Google Scholar] [CrossRef]
- Beatty, H.; Svec, T. Quantifying Coronal Tooth Discoloration Caused by Biodentine and EndoSequence Root Repair Material. J. Endod. 2015, 41, 2036–2039. [Google Scholar] [CrossRef]
- Ardu, S.; Braut, V.; Gutemberg, D.; Krejci, I.; Dietschi, D.; Feilzer, A.J. A Long-Term Laboratory Test on Staining Susceptibility of Esthetic Composite Resin Materials. Quintessence Int. 2010, 41, 695–702. [Google Scholar] [PubMed]
- Chen, S.J.; Karabucak, B.; Steffen, J.J.; Yu, Y.H.; Kohli, M.R. Spectrophotometric Analysis of Coronal Tooth Discoloration Induced by Tricalcium Silicate Cements in the Presence of Blood. J. Endod. 2020, 46, 1913–1919. [Google Scholar] [CrossRef] [PubMed]
- Marin, P.D.; Bartold, P.M.; Heithersay, G.S. Tooth Discoloration by Blood: An in Vitro Histochemical Study. Dent. Traumatol. 1997, 13, 132–138. [Google Scholar] [CrossRef]
- Seirawan, Y.M.; Layous, K.; Seirawan, K.M.; Doumani, M. Coronal Discoloration Related to Bioceramic and Mineral Trioxide Aggregate Coronal Barrier in Non-Vital Mature Teeth Undergoing Regenerative Endodontic Procedures. World J. Dent. 2020, 11, 1. [Google Scholar]
- Watts, A.; Addy, M. Tooth Discolouration and Staining: Tooth Discolouration and Staining: A Review of the Literature. Br. Dent. J. 2001, 190, 309–316. [Google Scholar] [CrossRef]
- Plotino, G.; Buono, L.; Grande, N.M.; Pameijer, C.H.; Somma, F. Nonvital Tooth Bleaching: A Review of the Literature and Clinical Procedures. J. Endod. 2008, 34, 394–407. [Google Scholar] [CrossRef] [PubMed]
- Yoldaş, S.E.; Bani, M.; Atabek, D.; Bodur, H. Comparison of the Potential Discoloration Effect of Bioaggregate, Biodentine, and White Mineral Trioxide Aggregate on Bovine Teeth: In Vitro Research. J. Endod. 2016, 42, 1815–1818. [Google Scholar] [CrossRef] [PubMed]
- Camilleri, J. Color Stability of White Mineral Trioxide Aggregate in Contact with Hypochlorite Solution. J. Endod. 2014, 40, 436–440. [Google Scholar] [CrossRef] [PubMed]
- Felman, D.; Parashos, P. Coronal Tooth Discoloration and White Mineral Trioxide Aggregate. J. Endod. 2013, 39, 484–487. [Google Scholar] [CrossRef]
- Shokouhinejad, N.; Nekoofar, M.H.; Pirmoazen, S.; Shamshiri, A.R.; Dummer, P.M.H. Evaluation and Comparison of Occurrence of Tooth Discoloration after the Application of Various Calcium Silicate-Based Cements: An Ex Vivo Study. J. Endod. 2015, 42, 140–144. [Google Scholar] [CrossRef]


| Commercial Name (Abbreviation) | Manufacturer | Lot | Expiration Date |
|---|---|---|---|
| White MTA ProRoot® | Denstply Tulsa Dental Products, Tulsa, OK, USA | 000014787 | 12 August 2019 |
| Biodentine™ | Septodont Saint Maur-des Fósses, France | B19471 | October 2018 |
| TotalFill® RRM™ Fast Set Putty (FKG) | Crêt-du-Locle 4 CH-2304 La Chaux-de-Fonds, Switzerland | 1601FSPS | 31 March 2018 |
| Groups | N | t0 (L*) M + SD (CI 95%) | t30d (L*) M + SD (CI 95%) | ∆L* |
|---|---|---|---|---|
| NC | 11 | 72.23 ± 3.70 [69.74; 74.71] | 68.41 ± 2.93 [66.44; 70.38] | −3.82 |
| WMTAP | 11 | 74.90 ± 3.47 [72,57; 77,23] | 71,95 ± 1.94 [70.65; 73.26] | −2.95 |
| BD | 11 | 71.64 ± 3.24 [69.46; 73.81] | 69.73 ± 3.12 [67.63; 71.82] | −1.91 |
| TF | 11 | 72,20 ± 3,73 [69.69; 74.71] | 71.35 ± 4.40 [68.39; 74.30] | −0.85 |
| Total | 44 |
| Groups | N | t0 (a*) M + SD (IC 95%) | t30d (a*) M + SD (IC 95%) | ∆a* |
|---|---|---|---|---|
| NC | 11 | 1.30 ± 2.18 [−0.17; 2.77] | 1.28 ± 1.98 [−0.06; 2.61] | −0.02 |
| WMTAP | 11 | 1.31 ± 1.85 [0.07; 2.55] | 0.72 ± 1.23 [−0.11; 1.54] | −0.59 |
| BD | 11 | 2.17 ± 1.56 [1.13; 3.21] | 1.66 ± 1.14 [0.89; 2.43] | −0.51 |
| TF | 11 | 1.38 ± 2.15 [−0.06; 2.83] | 1.65 ± 2.17 [0.19; 3.10] | 0.27 |
| Groups | N | t0 (b*) M + SD (IC 95%) | t30d (b*) M + SD (IC 95%) | ∆b* |
|---|---|---|---|---|
| NC | 11 | 19.49 ± 4.24 [16.64; 22.34] | 14.11 ± 1.97 [12.79; 15.43] | −5.38 |
| WMTAP | 11 | 19.50 ± 3.32 [17.27; 21.73] | 16.94 ± 3.62 [14.50; 19.37] | −2.56 |
| BD | 11 | 21.60 ± 4.47 [18.60; 24.60] | 18.70 ± 5.72 [14.86; 22.54] | −2.90 |
| TF | 11 | 19.49 ± 4.24 [16.64; 22.34] | 18.06 ± 4.08 [15.33; 20.80] | −1.43 |
| Total | 44 |
| Groups | N | ∆E 0–1 M + SD (CI 95%) | ∆E 1–24h M + SD (CI 95%) | ∆E 24h–7d M + SD (CI 95%) | ∆E 7d–30d M + SD (CI 95%) |
|---|---|---|---|---|---|
| NC | 11 | 9.00 ± 4.73 [5.82; 12.18] | 6.18 ± 6.72 [1.67; 10.70] | 7.36 ± 4.05 [4.64; 10.08] | 6.40 ± 2.59 [4.65; 8.14] |
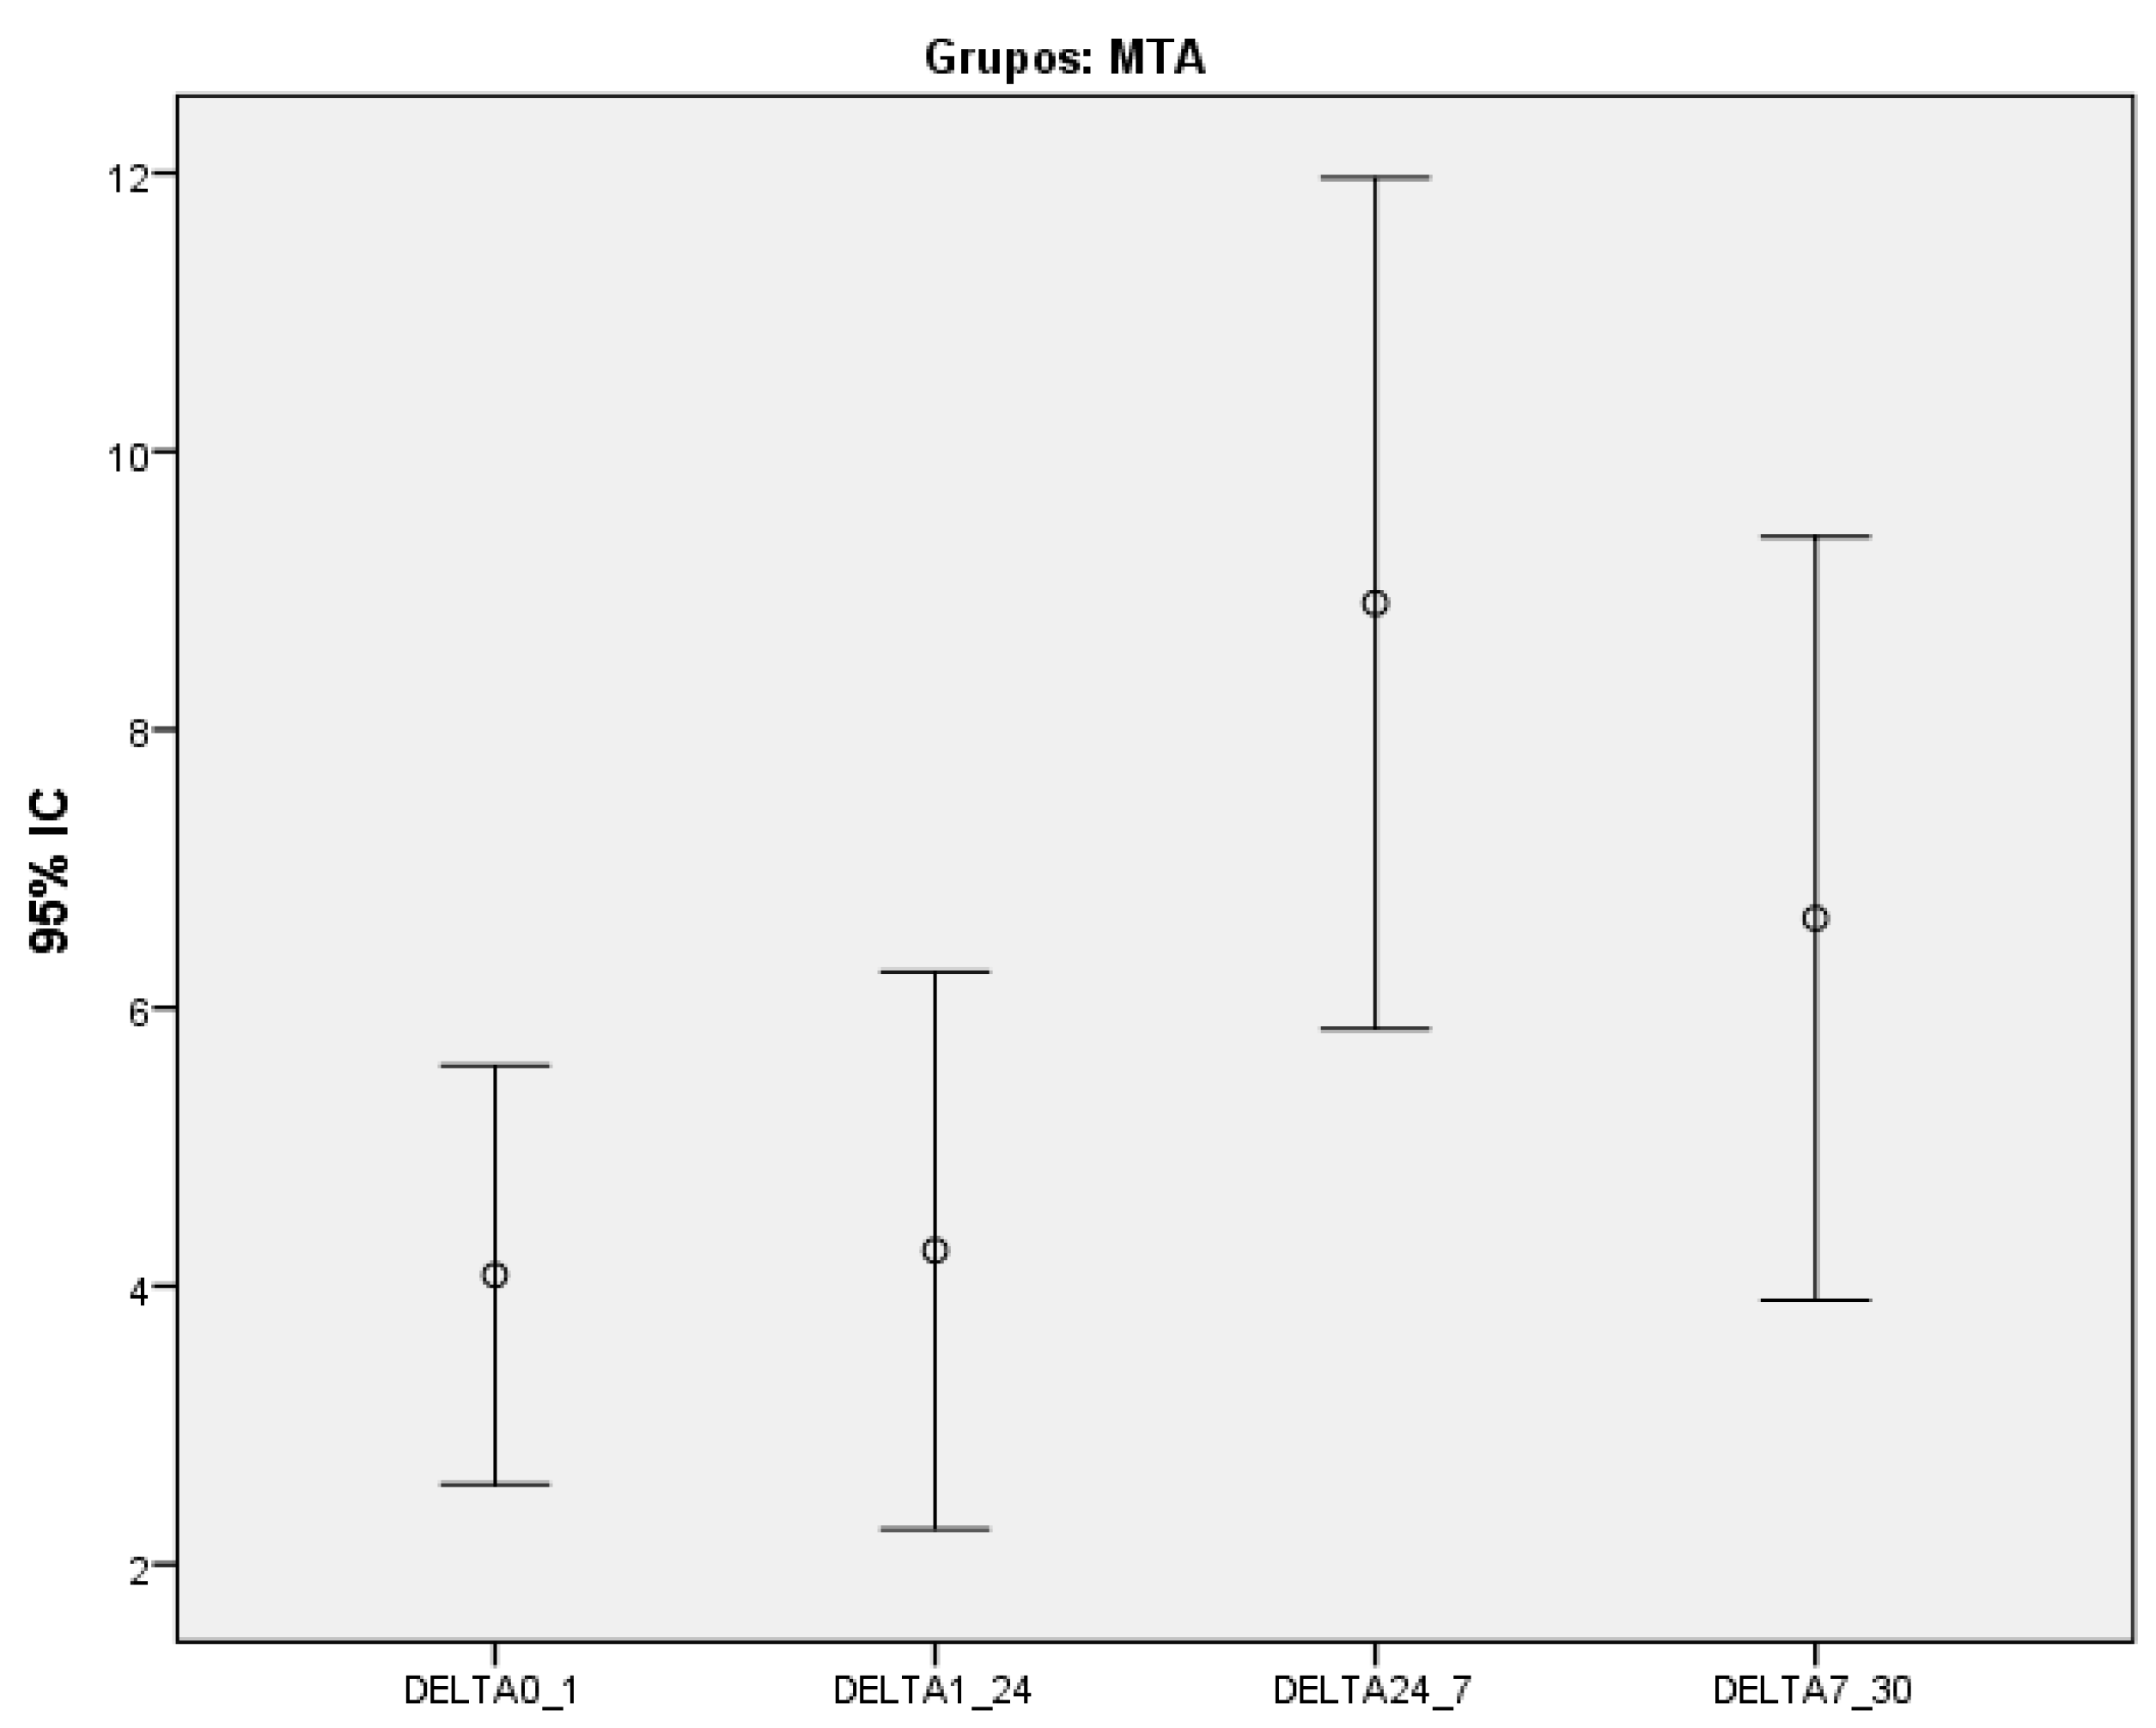
| WMTAP | 11 | 4.08 ± 2.24 [2.57; 5.58] | 4.26 ± 2.98 [2.25; 6.26] | 8.91 ± 4.55 [5.85; 11.97] | 6.64 ± 4.08 [2.73; 10.41] |
| BD | 11 | 7.44 ± 3.82 [4.88; 10.01] | 5.36 ± 3.65 [2.91; 7.81] | 6.57 ± 5.71 [2.73; 10.41] | 5.49 ± 4.48 [2.48; 8.50] |
| TF | 11 | 7.42 ± 5.63 [3.64; 11.20] | 3.20 ± 1.64 [2.10; 4.30] | 7.12 ± 5.34 [3.53; 10.70] | 7.29 ± 5.99 [3.26; 11.32] |
| Total | 44 |
| Discoloration Frequency | ||||||
|---|---|---|---|---|---|---|
| Groups | t0 | t1 | t24h | t7d | t30d | p |
| NC | 0 | 9 | 5 | 10 | 9 | <0.001 * |
| WMTAP | 0 | 6 | 6 | 10 | 10 | <0.001 * |
| BD | 0 | 10 | 8 | 7 | 7 | 0.001 * |
| TF | 0 | 8 | 5 | 7 | 6 | 0.006 * |
| Total | 0 | 33 | 24 | 34 | 32 | <0.001 * |
| Groups | N | ∆E 0–1 p | ∆E 1–24h p | ∆E 24h–7d p | ∆E 7d–30d p |
|---|---|---|---|---|---|
| NC | 11 | 0.075 | 0.779 | 0.611 | 0.779 |
| WMTAP | 11 | ||||
| BD | 11 | ||||
| TF | 11 | ||||
| Total | 44 |
| Groups | p |
|---|---|
| NC | 0.409 |
| WMTAP | 0.037 * |
| BD | 0.315 |
| TF | 0.210 |
Disclaimer/Publisher’s Note: The statements, opinions and data contained in all publications are solely those of the individual author(s) and contributor(s) and not of MDPI and/or the editor(s). MDPI and/or the editor(s) disclaim responsibility for any injury to people or property resulting from any ideas, methods, instructions or products referred to in the content. |
© 2023 by the authors. Licensee MDPI, Basel, Switzerland. This article is an open access article distributed under the terms and conditions of the Creative Commons Attribution (CC BY) license (https://creativecommons.org/licenses/by/4.0/).
Share and Cite
Carvalho, J.A.; Franco, C.; Proença, L.; Neves, J.A.; Polido, M.; Mendes, J.J.; Azul, A.M. Spectrophotometric Analysis of Coronal Discoloration In Vitro Induced by Bioceramic Cements. Dent. J. 2023, 11, 180. https://doi.org/10.3390/dj11070180
Carvalho JA, Franco C, Proença L, Neves JA, Polido M, Mendes JJ, Azul AM. Spectrophotometric Analysis of Coronal Discoloration In Vitro Induced by Bioceramic Cements. Dentistry Journal. 2023; 11(7):180. https://doi.org/10.3390/dj11070180
Chicago/Turabian StyleCarvalho, Joana A., Carlos Franco, Luís Proença, João Albernaz Neves, Mário Polido, José João Mendes, and Ana Mano Azul. 2023. "Spectrophotometric Analysis of Coronal Discoloration In Vitro Induced by Bioceramic Cements" Dentistry Journal 11, no. 7: 180. https://doi.org/10.3390/dj11070180
APA StyleCarvalho, J. A., Franco, C., Proença, L., Neves, J. A., Polido, M., Mendes, J. J., & Azul, A. M. (2023). Spectrophotometric Analysis of Coronal Discoloration In Vitro Induced by Bioceramic Cements. Dentistry Journal, 11(7), 180. https://doi.org/10.3390/dj11070180