

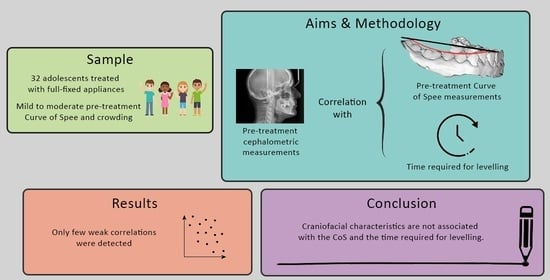
Association of Craniofacial Patterns with the Curve of Spee and the Time Required for Orthodontic Levelling


Abstract
:
1. Introduction
2. Materials and Methods
2.1. Sample
- -
- Adolescent patients of any sex between 12–18 years of age
- -
- Fully erupted permanent teeth, except for the third molars
- -
- Absence of periodontal or any systemic disease
- -
- Non-extraction treatment with full fixed appliances
- -
- Absence of mechanics that require bands on molars
- -
- Maximum overall crowding of 5 mm
2.2. Interventions
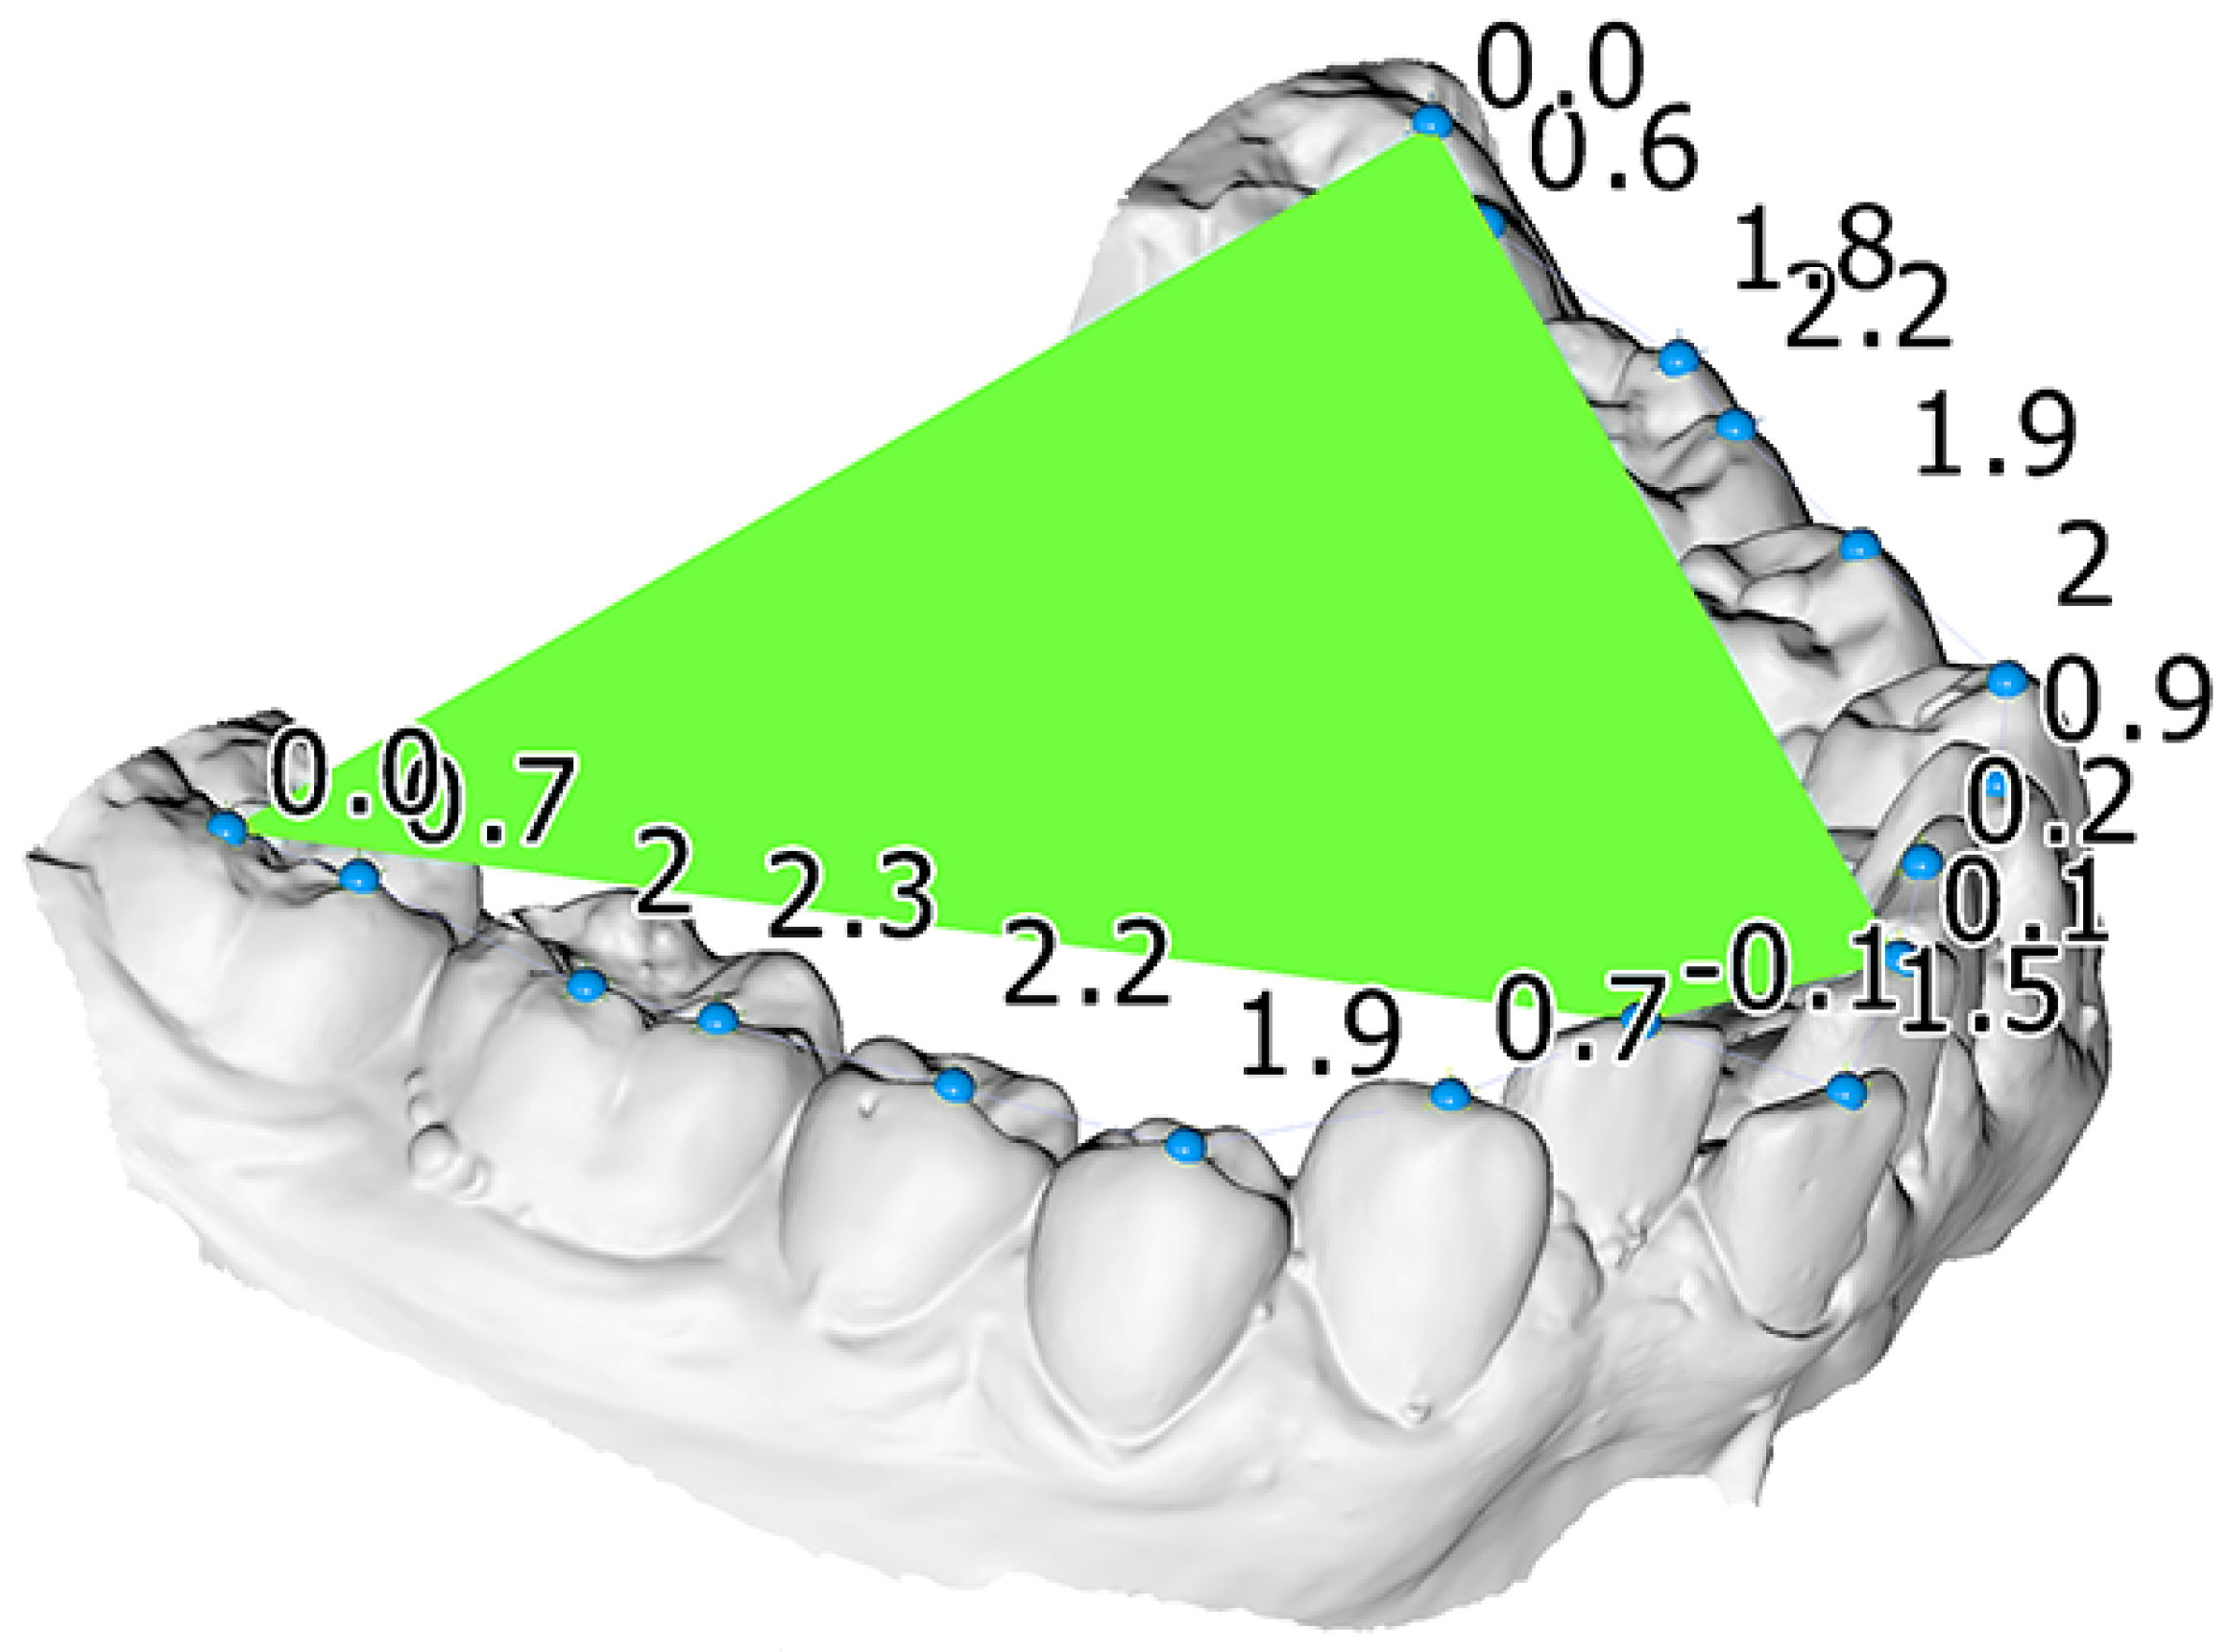
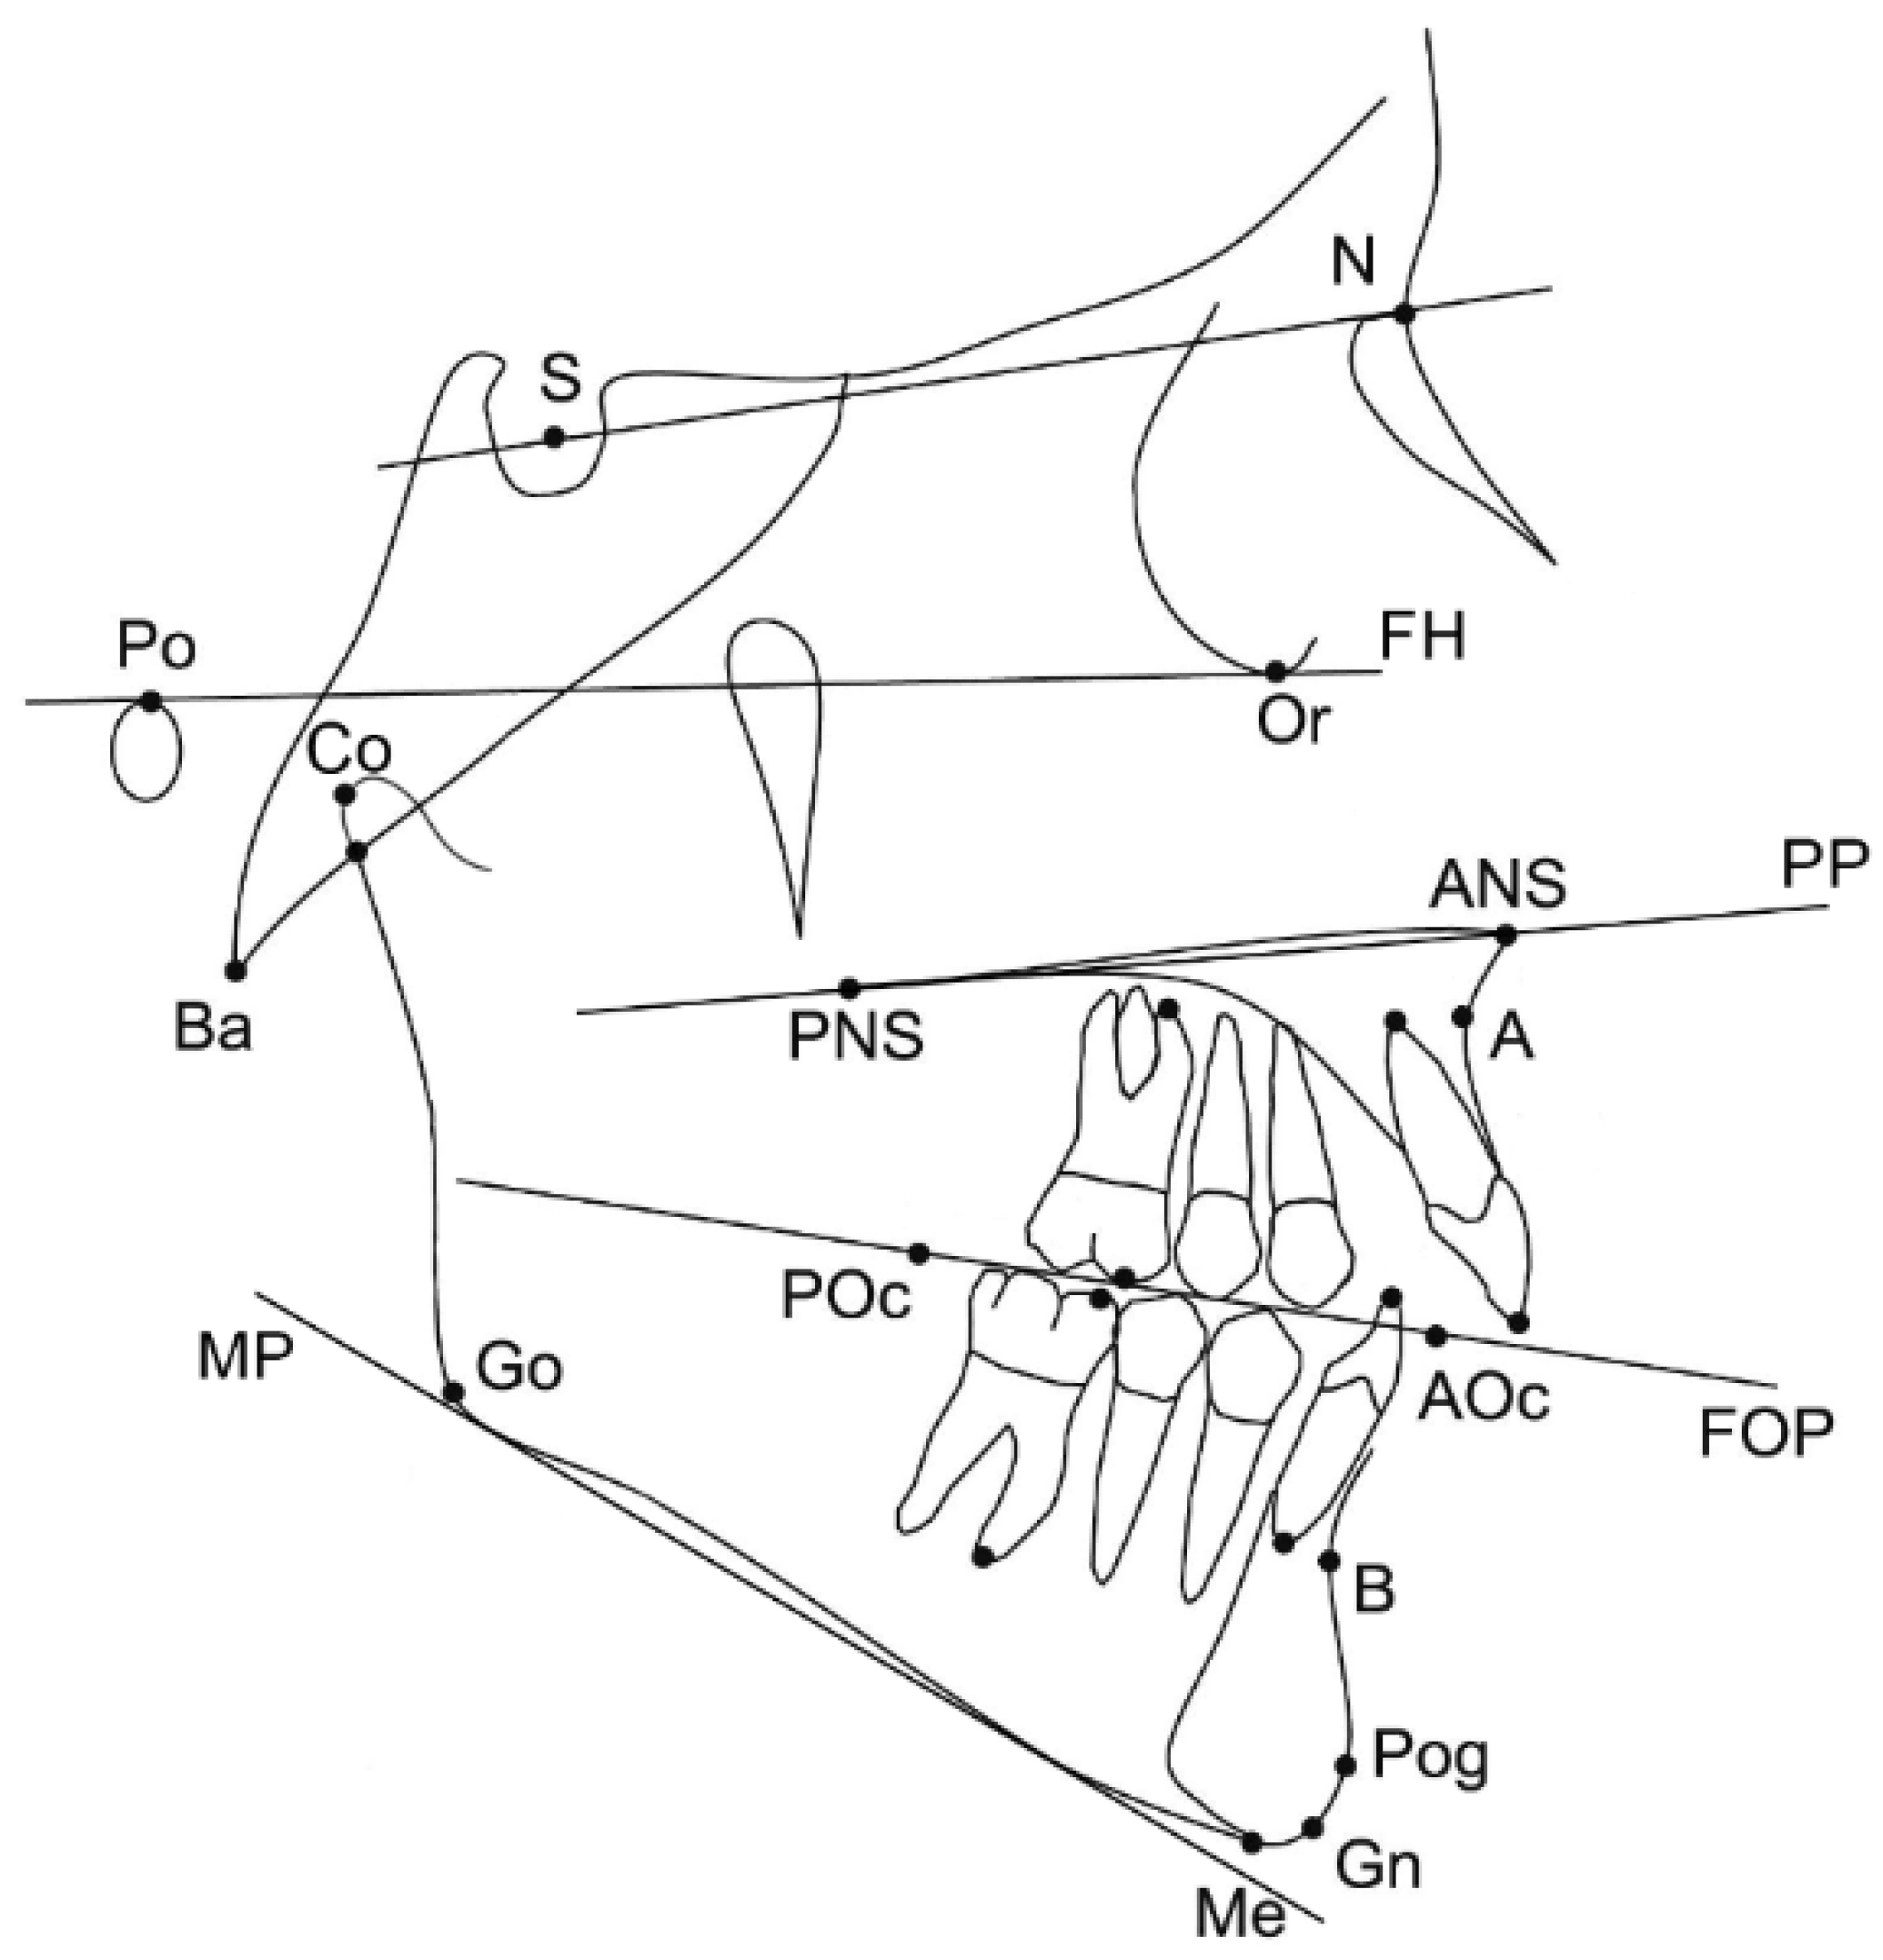
2.3. Measured Variables
2.4. Statistical Analysis
2.5. Method Error
3. Results
3.1. Participants
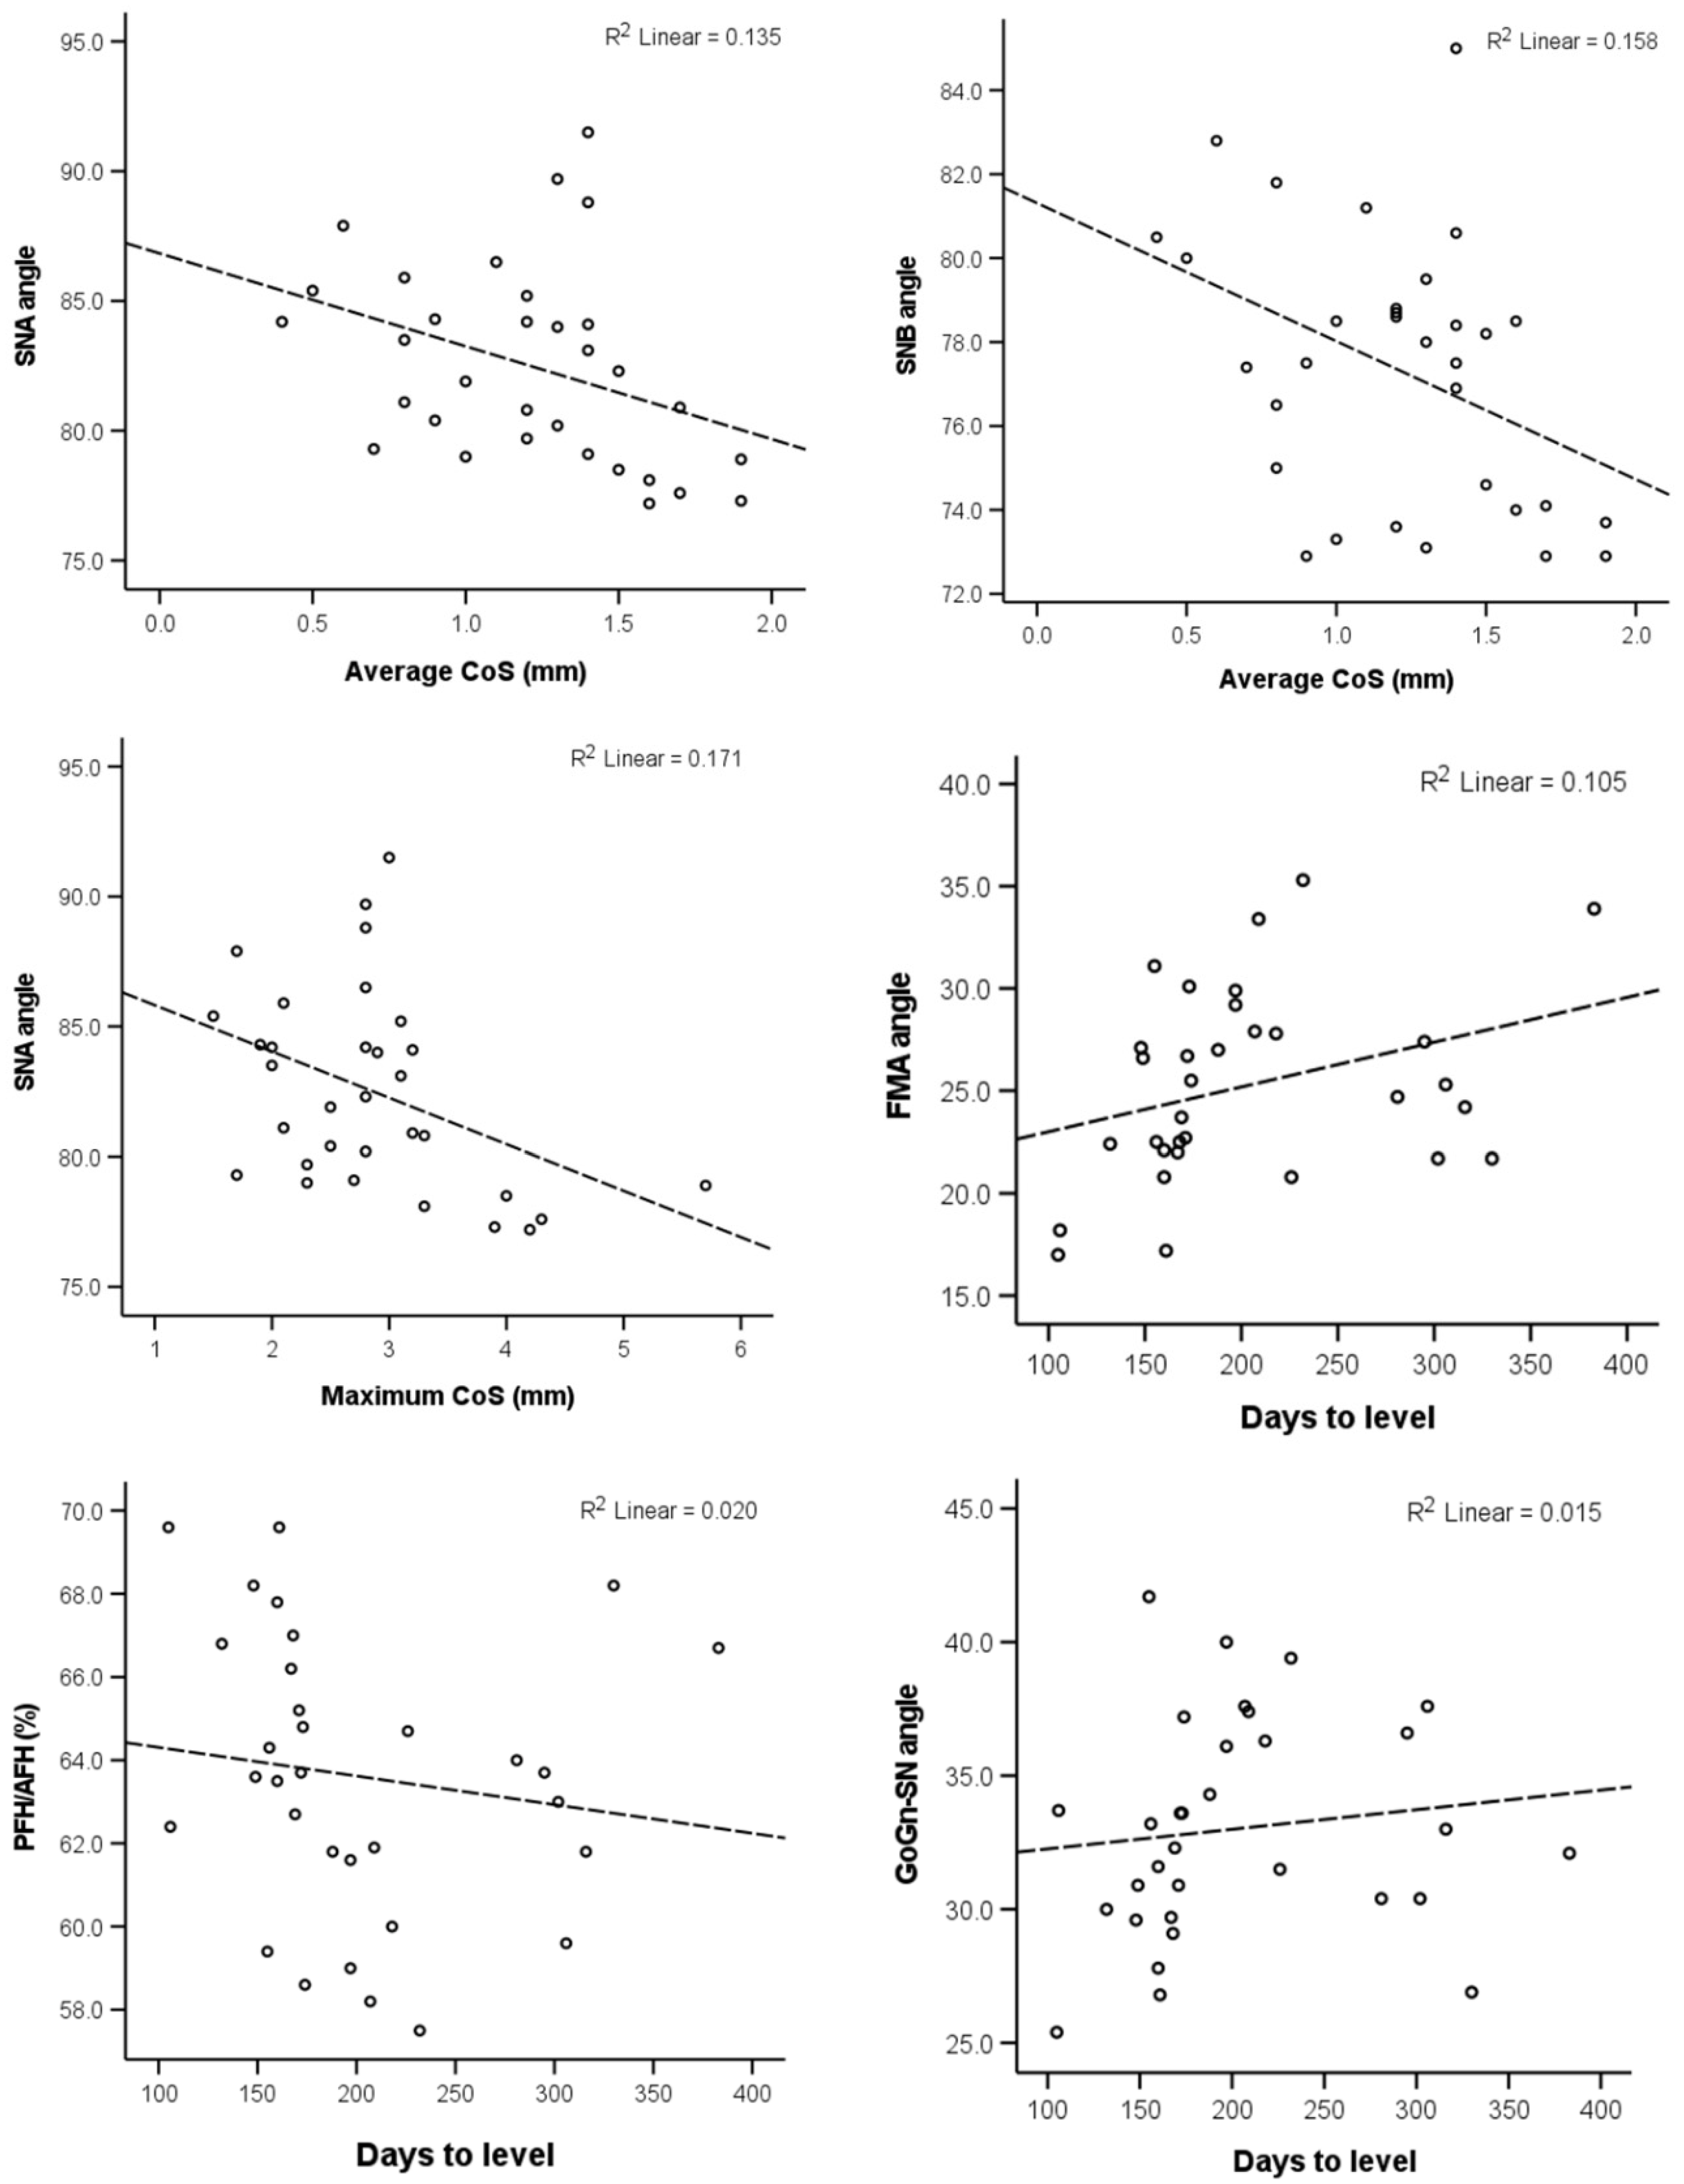
3.2. Main Outcomes
3.3. Method Error
4. Discussion
Limitations
5. Conclusions
Author Contributions
Funding
Institutional Review Board Statement
Informed Consent Statement
Data Availability Statement
Conflicts of Interest
Appendix A

| Variable | Dahlberg’s Error | p-Value * (Wilcoxon Signed Rank Test) |
|---|---|---|
| SNA (°) | 0.7 | 0.432 |
| SNB (°) | 0.4 | 0.288 |
| ANB (°) | 0.6 | 0.050 |
| Wits appraisal (mm) | 0.8 | 0.306 |
| Facial angle (FH-NPog) (°) | 0.8 | 0.271 |
| FH-MP (FMA) (°) | 0.9 | 0.593 |
| MP-PP (°) | 0.7 | 0.209 |
| GoGn-SN (°) | 1.0 | 0.031 |
| LFH/TFH (%) | 0.5 | 0.844 |
| PFH/AFH (%) | 1.5 | 0.023 |
References
- Tamizharasi, S.; Senthil Kumar, K. Significance of Curve of Spee: An Orthodontic Review. J. Pharm. Bioallied. Sci. 2012, 4, 323. [Google Scholar] [CrossRef] [PubMed]
- Spee, F.G.; Biedenbach, M.A.; Hotz, M.; Hitchcock, H.P. The Gliding Path of the Mandible along the Skull. J. Am. Dent. Assoc. 1980, 100, 670–675. [Google Scholar] [CrossRef]
- Marshall, S.D.; Caspersen, M.; Hardinger, R.R.; Franciscus, R.G.; Aquilino, S.A.; Southard, T.E. Development of the Curve of Spee. Am. J. Orthod. Dentofac. Orthop. 2008, 134, 344–352. [Google Scholar] [CrossRef]
- Veli, I.; Ozturk, M.A.; Uysal, T. Curve of Spee and Its Relationship to Vertical Eruption of Teeth among Different Malocclusion Groups. Am. J. Orthod. Dentofac. Orthop. 2015, 147, 305–312. [Google Scholar] [CrossRef] [PubMed]
- Andrews, L.F. The Six Keys to Normal Occlusion. Am. J. Orthod. 1972, 62, 296–309. [Google Scholar] [CrossRef]
- Bernstein, R.L.; Preston, C.B.; Lampasso, J. Leveling the Curve of Spee with a Continuous Archwire Technique: A Long Term Cephalometric Study. Am. J. Orthod. Dentofac. Orthop. 2007, 131, 363–371. [Google Scholar] [CrossRef] [PubMed]
- De Praeter, J.; Dermaut, L.; Martens, G.; Kuijpers-Jagtman, A.-M. Long-Term Stability of the Leveling of the Curve of Spee. Am. J. Orthod. Dentofac. Orthop. 2002, 121, 266–272. [Google Scholar] [CrossRef]
- Rozzi, M.; Mucedero, M.; Pezzuto, C.; Cozza, P. Leveling the Curve of Spee with Continuous Archwire Appliances in Different Vertical Skeletal Patterns: A Retrospective Study. Am. J. Orthod. Dentofac. Orthop. 2017, 151, 758–766. [Google Scholar] [CrossRef]
- Fawaz, P.; Amm, E.; Khoury, E. The Curve of Spee and Its Levelling in Different Vertical Skeletal Patterns: A 3D Set-up Study. Int. Orthod. 2021, 19, 659–668. [Google Scholar] [CrossRef]
- Rozzi, M.; Mucedero, M.; Pezzuto, C.; Lione, R.; Cozza, P. Long-Term Stability of Curve of Spee Levelled with Continuous Archwires in Subjects with Different Vertical Patterns: A Retrospective Study. Eur. J. Orthod. 2019, 41, 286–293. [Google Scholar] [CrossRef]
- Pollard, D.; Akyalcin, S.; Wiltshire, W.A.; Rody, W.J. Relapse of Orthodontically Corrected Deepbites in Accordance with Growth Pattern. Am. J. Orthod. Dentofac. Orthop. 2012, 141, 477–483. [Google Scholar] [CrossRef] [PubMed]
- Farella, M.; Michelotti, A.; Van Eijden, T.M.G.J.; Martina, R. The Curve of Spee and Craniofacial Morphology: A Multiple Regression Analysis. Eur. J. Oral Sci. 2002, 110, 277–281. [Google Scholar] [CrossRef] [PubMed]
- Halimi, A.; Benyahia, H.; Azeroual, M.-F.; Bahije, L.; Zaoui, F. Relationship between the Curve of Spee and Craniofacial Variables: A Regression Analysis. Int. Orthod. 2018, 16, 361–373. [Google Scholar] [CrossRef] [PubMed]
- Abu Alhaija, E.S.J.; Al Zo’ubi, I.A.; Al Rousan, M.E.; Hammad, M.M. Maximum Occlusal Bite Forces in Jordanian Individuals with Different Dentofacial Vertical Skeletal Patterns. Eur. J. Orthod. 2010, 32, 71–77. [Google Scholar] [CrossRef] [PubMed]
- Proffit, W.R.; Fields, H.W. Occlusal Forces in Normal- and Long-Face Children. J. Dent. Res. 1983, 62, 571–574. [Google Scholar] [CrossRef]
- Kiliaridis, S.; Kälebo, P. Masseter Muscle Thickness Measured by Ultrasonography and Its Relation to Facial Morphology. J. Dent. Res. 1991, 70, 1262–1265. [Google Scholar] [CrossRef]
- Biondi, K.; Lorusso, P.; Fastuca, R.; Mangano, A.; Zecca, P.A.; Bosco, M.; Caprioglio, A.; Levrini, L. Evaluation of Masseter Muscle in Different Vertical Skeletal Patterns in Growing Patients. Eur. J. Paediatr. Dent. 2016, 17, 47–52. [Google Scholar]
- Sayar, G.; Oktay, H. Assessment of Curve of Spee in Different Malocclusions. Eur. Oral Res. 2018, 52, 127–130. [Google Scholar] [CrossRef]
- Dritsas, K.; Alharbi, M.; Kouvelis, G.; Kloukos, D.; Gkantidis, N. Effect of the Timing of Second Molar Bonding on the Duration of the Mandibular Arch Levelling: A Randomized Clinical Trial. Eur. J. Orthod. 2022, 44, 203–209. [Google Scholar] [CrossRef]
- Paes da Silva, S.; Pitchika, V.; Baumert, U.; Wehrbein, H.; Schwestka-Polly, R.; Drescher, D.; Kühnisch, J.; Wichelhaus, A. Oral Health-Related Quality of Life in Orthodontics: A Cross-Sectional Multicentre Study on Patients in Orthodontic Treatment. Eur. J. Orthod. 2020, 42, 270–280. [Google Scholar] [CrossRef]
- Al-Moghrabi, D.; Salazar, F.C.; Pandis, N.; Fleming, P.S. Compliance with Removable Orthodontic Appliances and Adjuncts: A Systematic Review and Meta-Analysis. Am. J. Orthod. Dentofac. Orthop. 2017, 152, 17–32. [Google Scholar] [CrossRef] [PubMed]
- Gkantidis, N.; Christou, P.; Topouzelis, N. The Orthodontic–Periodontic Interrelationship in Integrated Treatment Challenges: A Systematic Review. J. Oral Rehabil. 2010, 37, 377–390. [Google Scholar] [CrossRef] [PubMed]
- Winkler, J.; Göllner, N.; Göllner, P.; Pazer.ra, P.; Gkantidis, N. Apical Root Resorption Due to Mandibular First Molar Mesialization: A Split-Mouth Study. Am. J. Orthod. Dentofac. Orthop. 2017, 151, 708–717. [Google Scholar] [CrossRef]
- Tsomos, G.; Ludwig, B.; Grossen, J.; Pazera, P.; Gkantidis, N. Objective Assessment of Patient Compliance with Removable Orthodontic Appliances: A Cross-Sectional Cohort Study. Angle Orthod. 2014, 84, 56–61. [Google Scholar] [CrossRef]
- Pachêco-Pereira, C.; Pereira, J.R.; Dick, B.D.; Perez, A.; Flores-Mir, C. Factors Associated with Patient and Parent Satisfaction after Orthodontic Treatment: A Systematic Review. Am. J. Orthod. Dentofac. Orthop. 2015, 148, 652–659. [Google Scholar] [CrossRef] [PubMed]
- Fink, D.F.; Smith, R.J. The Duration of Orthodontic Treatment. Am. J. Orthod. Dentofac. Orthop. 1992, 102, 45–51. [Google Scholar] [CrossRef]
- Popowich, K.; Nebbe, B.; Heo, G.; Glover, K.E.; Major, P.W. Predictors for Class II Treatment Duration. Am. J. Orthod. Dentofac. Orthop. 2005, 127, 293–300. [Google Scholar] [CrossRef]
| Variable | Median | IQR * | Range |
|---|---|---|---|
| Max. CoS (mm) | 2.8 | 1.1 | 1.5–5.7 |
| Average CoS (mm) | 1.3 | 0.6 | 0.4–1.9 |
| Overjet (mm) | 4.0 | 1.0 | 1.9–6.9 |
| Overbite (mm) | 3.7 | 1.5 | 1.5–9.9 |
| Days required to level | 173.5 | 70.5 | 105–383 |
| SNA (°) | 82.1 | 5.8 | 77.2–91.5 |
| SNB (°) | 77.8 | 5.3 | 72.9–85.0 |
| ANB (°) | 5.5 | 2.5 | –0.4–10.2 |
| Wits appraisal (mm) | 1.9 | 3.8 | –3.5–7.4 |
| Facial angle (FH-NPog) (°) | 88.0 | 2.6 | 80.8–94.2 |
| FH-MP (FMA) (°) | 25.0 | 5.9 | 17.0–35.3 |
| MP-PP (°) | 20.8 | 7.4 | 11.7–29.8 |
| GoGn-SN (°) | 32.7 | 6.4 | 25.4–41.7 |
| LFH/TFH (%) | 54.5 | 3.6 | 46.3–60.1 |
| PFH/AFH (%) | 63.7 | 4.9 | 57.5–69.6 |
| Variable | Max CoS r (P) | Average CoS r (P) | Days to Level r (P) |
|---|---|---|---|
| SNA (°) | −0.441 (0.011) * | −0.470 (0.007) * | 0.128 (0.485) |
| SNB (°) | −0.282 (0.117) | −0.374 (0.035) * | 0.060 (0.744) |
| ANB (°) | −0.145 (0.427) | −0.074 (0.688) | 0.193 (0.290) |
| Wits appraisal (mm) | 0.049 (0.791) | 0.112 (0.543) | −0.126 (0.491) |
| Facial angle (FH-NPog) (°) | −0.133 (0.469) | −0.133 (0.467) | −0.165 (0.367) |
| FH-MP (FMA) (°) | 0.146 (0.424) | 0.083 (0.651) | 0.350 (0.050) * |
| MP-PP (°) | 0.139 (0.446) | 0.137 (0.453) | 0.294 (0.102) |
| GoGn-SN (°) | 0.144 (0.431) | 0.187 (0.304) | 0.306 (0.089) |
| LFH/TFH (%) | 0.079 (0.668) | 0.175 (0.339) | 0.233 (0.199) |
| PFH/AFH (%) | −0.210 (0.248) | −0.199 (0.275) | −0.321 (0.073) |
| Maxillary length (Co-ANS) (mm) | 0.061 (0.742) | 0.178 (0.330) | −0.041 (0.822) |
| Mandibular length (Co-Gn) (mm) | 0.149 (0.416) | 0.250 (0.167) | 0.077 (0.674) |
Publisher’s Note: MDPI stays neutral with regard to jurisdictional claims in published maps and institutional affiliations. |
© 2022 by the authors. Licensee MDPI, Basel, Switzerland. This article is an open access article distributed under the terms and conditions of the Creative Commons Attribution (CC BY) license (https://creativecommons.org/licenses/by/4.0/).
Share and Cite
Krüsi, A.; Dritsas, K.; Kalimeri, E.; Kloukos, D.; Gkantidis, N. Association of Craniofacial Patterns with the Curve of Spee and the Time Required for Orthodontic Levelling. Dent. J. 2022, 10, 175. https://doi.org/10.3390/dj10090175
Krüsi A, Dritsas K, Kalimeri E, Kloukos D, Gkantidis N. Association of Craniofacial Patterns with the Curve of Spee and the Time Required for Orthodontic Levelling. Dentistry Journal. 2022; 10(9):175. https://doi.org/10.3390/dj10090175
Chicago/Turabian StyleKrüsi, Annina, Konstantinos Dritsas, Eleni Kalimeri, Dimitrios Kloukos, and Nikolaos Gkantidis. 2022. "Association of Craniofacial Patterns with the Curve of Spee and the Time Required for Orthodontic Levelling" Dentistry Journal 10, no. 9: 175. https://doi.org/10.3390/dj10090175
APA StyleKrüsi, A., Dritsas, K., Kalimeri, E., Kloukos, D., & Gkantidis, N. (2022). Association of Craniofacial Patterns with the Curve of Spee and the Time Required for Orthodontic Levelling. Dentistry Journal, 10(9), 175. https://doi.org/10.3390/dj10090175