Abstract
Apatite (Ap) dissolution in diluted acids is well described in the literature, but in technological processes which use more concentrated acids, the reaction is fast, and it is complicated to follow the process kinetics. The relationship between pH change and the apatite dissolution rate depending on HCl concentration was studied by thermodynamic calculations and experiments with synthetic fluorapatite (FAp). On the basis of experimental pH measurements, the kinetics of dissolution was analyzed. The solution composition (P, Ca, F) was determined by wet chemical methods and the solid part was characterized by XRD and FTIR. It was shown that the amount of HCl needed for FAp dissolution depends on acid concentration. FAp dissolution rate cannot be deduced from solubility data of P, Ca or F as the secondary reactions of CaF2 and CaHPO4 formation take place simultaneously. It was found that the Ap dissolution rate can be followed by pH change.
1. Introduction
The main source of phosphorus for mankind is natural apatites. The biggest part of natural calciumfluorapatite (CaFAp) is used for the production of phosphorus fertilizers and phosphoric acid via acidic digestion processes [1].
The studies of CaAp dissolution processes in acids have been comprehensively reviewed by Dorozkin up to the year 2010, and a general description of the dissolution stages has been given [2]. The dissolution of apatite is described by different models: a diffusion and kinetical model, a mono- and poly-nuclear model, a self-inhibition model, a stoichiometric/non-stoichiometric dissolution, an ion-exchange model, a hydrogen catalytic model, and an etch pit formation model, which all depend on the experiment conditions and sample composition. Most of the models have been elaborated for apatite dissolution in either slightly acidic or nearly neutral (4 < pH < 8) aqueous solutions and at relatively low concentrations. Therefore, the validity of these models for apatite dissolution in strong acids (HCl, HNO3, H2SO4) at pH < 2 used in the production of fertilizers and phosphorus acid as well as in the recovery technologies of rare earth elements needs specification.
The chemical model developed for the description of Ap dissolution in strong acidic media based on indirect measurements describes the dissolution of Ap as follows [2]:
Ca5(PO4)3(F,OH) + H2O + H+ → Ca5(PO4)3(H2O)+ + HF,H2O
2Ca5(PO4)3(H2O)+ → 3Ca3(PO4)2 + Ca2+ + 2H2O
Ca3(PO4)2 + 2H+ → Ca2+ + 2CaHPO4
CaHPO4 + H+ → Ca2+ + H2PO4−
Net-reaction 5Ca2+ + 3PO43− + F−,OH− + 7H+ → 5Ca2+ + 3H2PO4− + HF,H2O
According to this model, chemical dissolution of apatite occurs step by step on the surface via intermediate formation of a monoatomic layer of some virtual compounds, like Ca3(PO4)2 and CaHPO4.
In the latest studies of the dissolution of various natural [3,4,5,6,7] and some synthetic carbonate apatites [8,9] using chemical and thermochemical methods, the main controlling factors discussed are the acid concentration, apatite particle size, time, and solid/liquid ratio. The amounts of HCl used in these experiments have been much higher than needed in a stoichiometric reaction. However, the conclusion has been made that the rapid leaching of Ca, P, and F in strong acid solutions of high concentration (up to 1 M) in a short time interval of 10–30 min is problematic for proper investigation of kinetics and detailed reaction mechanism [7,10].
The thermochemical method used for the study of kinetics of FAp dissolution in HCl at the concentration of 1–2 M and acid dose 28 mole HCl per 1 mole of FAp revealed a very fast reaction, which is affected by apatite composition [9]. The reaction of apatite decomposition is generally described by the following equation
Ca5(PO4)3F + 10H+ + 10Cl− → 5Ca2+ + 3H3PO4 + 10Cl− + HF
Based on the activation energies, the dissolution mechanism of Ca and P in HCl is stated to be mainly controlled by chemical kinetics [9,11]. However, a conclusion that the dissolution is limited by the product layer diffusion process [12] has also been made. In addition, the counteraction of the reaction products of apatite dissolution in technological processes at these relatively high saturation conditions should be considered as well.
Thus, there is no clear understanding of how to describe the rate of apatite dissolution at its initial stage in strong acid solutions of high concentrations.
The aim of this study was to find dependence between pH change and the apatite dissolution rate in fluorapatite dissolution reactions by thermodynamic calculations and experiments with synthetic flourapatite at near-stoichiometric conditions in hydrochloric acid media.
2. Results and Discussion
2.1. Thermodynamic Calculations
The thermodynamic calculations (HsC) were performed for HCl solutions with concentrations from 0.05 to 2 M adding FAp by the step of 0.02 mol and with different compositions of the solid phase formed in the reaction: HsC1—with the formation of CaF2, and HsC2—with the formation of CaF2, together with CaHPO4·2H2O. In earlier studies, the formation of CaHPO4 has been proposed [2], and in the system also with H3PO4, the formation of CaF2 has been found [13,14]. The results of the calculations with 1 M HCl are shown in Figure 1 and Figure 2.
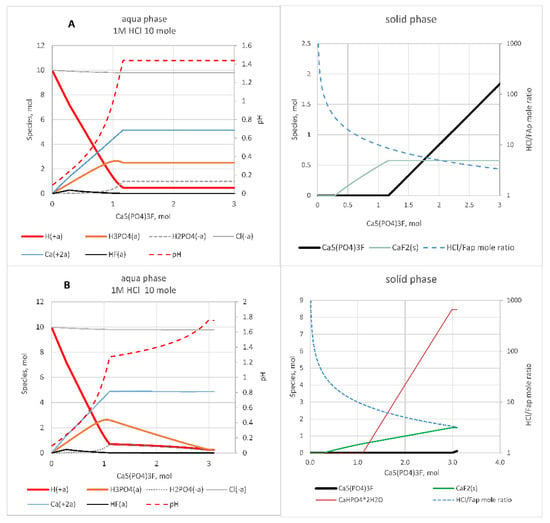
Figure 1.
Aqua and solid-phase composition: 10 moles of 1 M HCl + FAp: (A) CaF2 in the solid phase; (B) CaF2 and CaHPO4·2H2O in the solid phase.
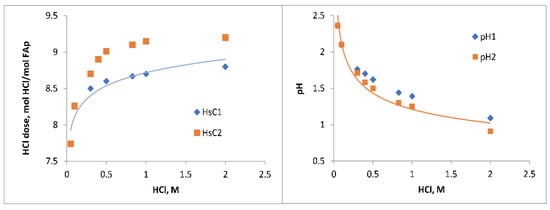
Figure 2.
HCl amount needed for dissolution of 1 mole of FAp (HCl dose) and pH depending on HCl concentration: HsC1—with CaF2; HsC2—with CaF2, and CaHPO4·2H2O.
In Figure 1, the amounts (moles) of ions in aqua and solid phases in the case of 1 M HCl are presented depending on the amount of FAp added and on the solid-phase composition assumed. At the stoichiometric point (maximum of phosphorus dissolved) the aqua phase contains Ca2+, H+, Cl−, H2PO4− ions and H3PO4 and CaCl2 aqua complexes. The latter is formed in the amount below 0.15 mol that is not visible in a figure. The amount of HCl needed for the dissolution of 1 mole of FAp is 8.7 (HsC1) or 9.0 moles (HsC2).
The amount of HCl needed for the dissolution of 1 mole of FAp (and later the acid dose) changes from 7.6 to 8.8 (HsC1) or 9.2 (HsC2) according to the increase in HCl concentration from 0.05 to 2 M (Figure 2) and the selected reaction products. This phenomenon can be explained by the change in H+ consumption depending on the equilibrium of H3PO4 and HPO42− species in solution.
The formation of CaF2 takes place at any HCl concentration. CaHPO4·2H2O formation is possible at HCl concentrations above 0.2 M. In Figure 2 it is seen that at HCl concentrations above 0.2 M and in the case of CaF2 formation alone, the dose of HCl is 0.4–0.5 moles lower than in the case of simultaneous formation of CaHPO4·2H2O and CaF2.
The pH value differs slightly depending on the solid phase formed (Figure 2) as the amount of CaHPO4·2H2O is small. According to the calculations, pH increases in correlation with the quantity of apatite dissolved (Figure 1). In real conditions, the amount of apatite dissolved increases with time, and therefore, it could be described by the change of pH.
2.2. Experiments with Synthetic FAp
The experiments of FAp dissolution in HCl at different concentrations and doses (HCl/FAp mole ratio) were performed under the conditions described in Table 1. The minimum time used was limited by the very fine solid phase separation conditions. The pH value, Ca, P, and F content in the solutions were compared with the HsC calculations. pH measurements of the HCl solution mixtures with synthetic FAp revealed that the pH change is very fast and the speed increases with the increase in acid concentration (Figure 3). The value of pH stabilizes at 3000 s in 0.05 M HCl but in 0.5 M solution only 1000 s is needed for stabilization, and in 1 M solution even 600–700 s. These results are in accordance with the thermochemical measurements performed in 3% (1 M) HCl with synthetic apatites described in [9,12].

Table 1.
pH and solubility of P2O5, CaO, and F in the experiments and by calculations.
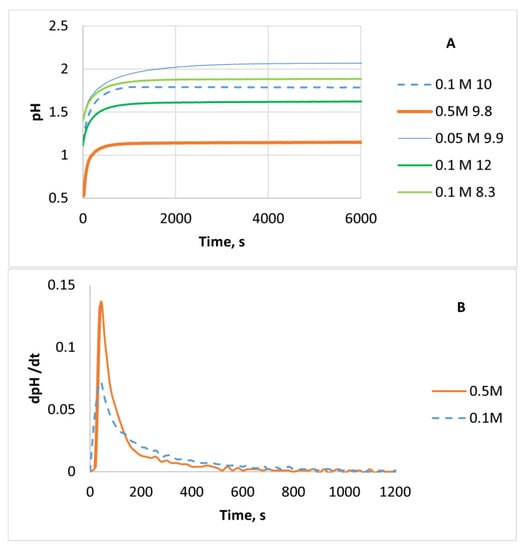
Figure 3.
pH (A) and dpH/dt (B) depending on time and HCl concentration.
The pH values measured in the experiments at longer times are closer to the calculated values and, at that, even closer in less-concentrated solutions (Table 1). The latter can be explained by the lack of precision of activity values in the calculations of strong acids. Additionally, the adsorption processes at solid surfaces are not taken into account in the equilibrium calculations that could slightly change the hydrogen ion consumption profile and rate in real experiments.
The solubility of F and Ca determined in the experiments is higher than calculated, but these values decrease with time. The difference is bigger for diluted HCl solutions (0.05–0.1 M) and in the case of HCl doses above stoichiometric. Solubility of Ca and F is lower than calculated if the dose of HCl is below stoichiometric, but P solubility is higher, which indicates the formation of the secondary solid phase CaF2. Therefore, the composition of the soluble part is affected not only by the acid concentration and time but also by the acid dose.
The XRD analysis of the solid phase separated after the reaction approved the formation of CaF2 (Table 2, Figure 4). In the case of an HCl dose above 10, the solid phase consisted only of CaF2. In the experiments at an almost stoichiometric amount of HCl (exp. 10 and 12), some amorphous phase is also detected in the solid part that, according to FTIR analysis, could be attributed to hydrogen phosphate. In Figure 5, the absorption bands at 1140, 1074, and 928 cm−1, characteristic of H-PO4 vibrations [15], are seen. At the same time, the absorption bands of PO4 in FAp at 1089, 1018, and 603 cm−1 have been shifted or disappeared.

Table 2.
Solid phase composition in the reaction of FAp with HCl by XRD analysis.
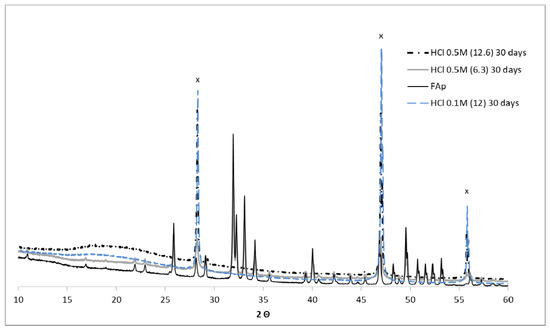
Figure 4.
XRD patterns of FAp and solid residues after 30 days in the experiments with 0.1 M HCl (dose 12) and 0.5 M HCl (dose 12.6 and 6.3). x—CaF2 (ICDD DB card nr 00-004-0864).
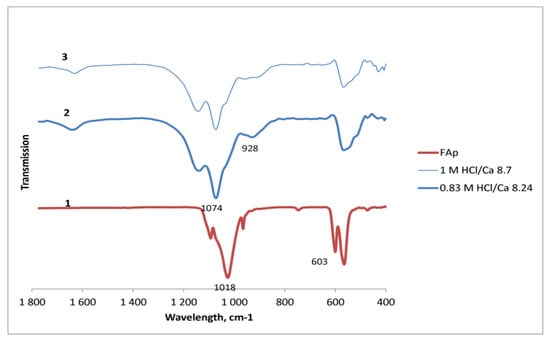
Figure 5.
FTIR spectra of 1—FAp; 2—solid residue of experiment 10 (HCl 0.83 M); 3—solid residue of exp. 12 (HCl 1 M).
In the experiments with HCl/FAp = 6.5 (below stoichiometric), the solid phase consisted of unreacted FAp and CaF2 (Table 2). The amount of CaF2 increased with time.
As a result of the experiments, the formation of CaF2 was proved. Speed of CaF2 crystallization depends on HCl concentration and dose, being higher at lower acid dose and higher concentration (Table 2). CaF2 was found in the HCl solutions of 0.1 M only after some months, whilst in the experiments with 1 M HCl, it was found after only 10 min. In the reactions describing the dissolution of FAp in HCl discussed in [1,2,3,4,5,6], the formation of CaF2 is not mentioned, but it is mentioned in the studies with H3PO4 [13,14]. Possibly, CaF2 is not found in weak acid as the formation of it is much slower than FAp dissolution, but it occurs with remarkable speed at HCl concentrations of 5–25% used in the real phosphate rock treatment technology.
Crystalline CaHPO4·2H2O was not detected, but a transition phase containing Ca-HPO4 groups was present in the mixtures with a stoichiometric dose of HCl, as was proposed by Dorozkin [2]. It was also not noticed in previous studies in which the HCl dose exceeded the stoichiometric dose, because in these conditions CaHPO4 dissolves.
Thus, by the information given above, it was shown that the proposed earlier net reaction for FAp dissolution in acids is a simplified description of the process.
2.3. Kinetic Analysis
According to HsC equilibrium calculations where apatite reacts with 1 M HCl solution (amounts of species less than two orders of magnitudes are eliminated), the dissolution process at the stoichiometric point of apatite dissolution can be described by the following equation:
with
2Ca5(PO4)3F + 17H+ + 17Cl− → 2F− + 10Ca2+ + 17Cl− + 0.5H+ + 6H2.75(PO4)0.25−
6H2.75(PO4)0.25− = 4.5H3PO4 + 1.5H2PO4−
The reactions above fulfill the elements and charge balances. It is also assumed that new solid compounds CaF2 and CaHPO4, presented in the paper earlier, are formed slowly, and that in the initial stage only apatite dissolution Reaction (7) occurs.
For the batch reactor, the change in the total number of H+ -ions nH+ can be expressed as:
giving
where
—consumption rate of H+ ions, mol s−1 L−1
V—solution volume, L
— molar concentration of hydrogen ions, mol L−1
and according to Reaction (7), the reaction rates for apatite dissolution and ions formed are , , , and .
Here, the apatite (single solid phase) dissolution reaction rate is calculated in mol s−1 L−1, and later its concentrations are calculated as mol L−1. From the experimental data and calculations, it can be shown that the pH value of the solution is suitable for the description of the kinetics of the apatite dissolution process.
The pH change from the experiment with 1 M HCl solution (dose 8.7 mol HCl/1 mol apatite) is presented in Figure 3. In the calculations, the averaged datapoint values were used. The initial amount of apatite was 1.39 mmols, liquid volume was equal with the added 1 M HCl volume, 12.35 mL, and the temperature was 25 °C.
The exact concentrations of H+ ions can be calculated from the pH values knowing the activity coefficient γH+. On the basis of HsC calculations, the molar activity coefficient values are related to pH by the following equation (R = 0.99)
and from the definition of pH
the more exact molar concentration of hydrogen ions is then expressed as
The time-change of the molar concentration of H+ ions in the time interval from 10 s to 820 s was fitted with numerous different functions and the mathematically most appropriate (regression coefficient R = 0.99) was found to be
with a = 1.94; b = −1.131; c = 0.076.
In this experiment, after 820 s, the pH remains constant. From Equation (15), the molar concentration of H+ ions at any time moment t is
The consumption rate of H+ ions can now be given as
Using the Relationship (11) the dissolution rate of apatite and the concentrations of H+ and other ions (Ca2+, F−, H2.75(PO4)0.25−) can now be calculated by solving the ordinary differential equation system (Equations (10) and (11)). The initial conditions are: t = 0 s: MH+ = 1.186, MFAp = 0.113, MCa2+ = 0, MF− = 0, MH2.75(PO4) = 0 (mol/L). The very first seconds are excluded as not suitable for Equation (15). The first period of dissolution, until 300 s, is used for the graphical illustration of the calculation results, shown in Figure 6.
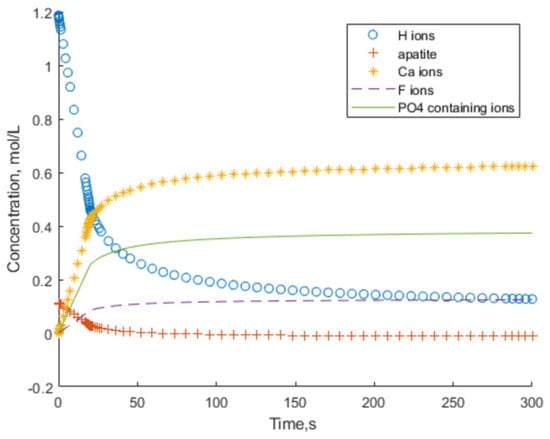
Figure 6.
Batch experiment simulation.
The other parameters of the solution (P, Ca, and F concentrations) are affected by the secondary reactions of the formation of CaF2 and CaHPO4, and therefore, the only comparable parameter to describe the FAp dissolution kinetics in calculations and experiments is pH.
3. Materials and Methods
FAp was synthesized by precipitation from aqueous solution. Two solutions—one containing Ca(NO3)2 (0.5 M), the other containing (NH4)2HPO4 (0.6 M) and NH4F (0.2 M)—were added simultaneously to NH4OH–NH4NO3 solution under N2 flow and 80 °C temperature. The pH of the solution was adjusted and maintained at 9. The precipitate was washed thoroughly with distilled water and dried after separation of the mother liquor and finally calcined at 800 °C. The chemical composition of the FAp obtained was P2O5 41.35, CaO 54.11, and F 3.47%. The FTIR and XRD spectra of the product corresponded to pure FAp (ICDD, DB card nr 00-060-0667). Ap unit cell parameters were a = 9.3705(16) and c = 6.8818(15) Å.
All reagents for synthesis and analyses were bought from ACROS organics (Acros Organics B.V.B.A., Fair Lawn, NJ, USA), Sigma-Aldrich (St. Louis, MO, USA), and Merck (Merck & Co., Kenilworth, NJ, USA) and used as-bought.
The surface area of the FAp (3.6 m2∙g−1) was measured by the BET-method (adsorptive gas N2, carrier gas He, heating temperature 150 °C) using a sorptometer KELVIN 1040/1042 (Costech International, Tallinn, Estonia).
In the batch experiments of the dissolution process, different amounts of FAp were added to the exactly measured amounts of 0.05, 0.1, 0.5, and 1.0 M HCl solution and the suspension was mixed in an overhead mixture up to 72 h or by an automatic titrator that allowed to follow the change of pH in short time intervals up to 5 h. After solid-phase separation, the composition of the solution was analyzed. The solid-phase composition was determined by XRD and FTIR spectroscopy.
pH was measured with Mettler Toledo electrode DG-117 Water, calibrated with Mettler Toledo pH buffer solutions (2.0; 4.01; 7.00), and connected to a Mettler Toledo automatic titrator T90 (Greifensee, Switzerland) in the propeller-mixed suspension every 20 s. In the solutions after solid-part separation by filtration, the concentration of Ca2+ ions was determined by atomic absorption spectrometry (Spectra AA 55B, Varian BV, Varian Australia Pty Ltd., Belrose, Australia) and the concentration of phosphorus was determined spectrophotometrically (Biochrom Libra S70PC, Cambridge, UK) as the phosphomolybdate yellow complex (λ = 430 nm). The fluoride concentration in the solution was determined by an F-selective electrode (Mettler Toledo, Greifensee, Switzerland).
XRD patterns were obtained with a difractometer Rigaku Ultima IV, Wilmington, MA, USA (40 kV, 40 mA, scan speed 5 deg min−1, step 0.0200 deg, K-beta filter). The cell dimensions were determined by Rigaku PDXL 2 software.
FTIR spectra were recorded with a Bruker 55/S/NIR FTIR ATR spectrometer (Bremen, Germany) as an average of 32 scans at a resolution of 4 cm−1.
Computational Methods
An equilibrium composition was calculated using HSC Chemistry® software version 10.0.1.8 (Outotec, Finland) which uses the Gibbs energy minimization method. The input species for calculations are given in Table 3, their thermochemical data was taken from the program database.

Table 3.
The input species for calculations of the equilibrium composition.
In the simulations of the dissolution process, Matlab R2020b (update 4), MathWorks, Inc., Natick, MA, USA was used.
4. Conclusions
The correlation between the pH change and the apatite dissolution rate depending on HCl concentration was studied by thermodynamic calculations and experiments with synthetic fluorapatite.
A mathematical description of the studied dissolution process was composed, according to which the kinetics of dissolution can be determined by measuring the pH values of the system.
According to thermodynamics calculations, the stoichiometric amount of HCl needed for FAp dissolution depends on acid concentration. The experiments showed, as expected, that the dissolution of FAp is very fast and depends also on acid concentration.
The formation of secondary solid phases (CaF2 and CaHPO4) in the FAp-HCl system was proved and should be considered as a possible prerequisite for diffusion limitation at dissolution.
The reaction rate cannot be deduced from the calcium, fluorine, and phosphorus content of the solution as the secondary reactions of CaF2 and CaHPO4 formation (notably at higher acid concentration) take place simultaneously.
The next stage of the studies will involve natural apatites.
Author Contributions
Conceptualization, K.T., J.K. and R.K.; methodology, K.T., J.K.; validation, K.T., J.K.; formal analysis, K.T., G.H.-E.; investigation, K.T., G.H.-E., J.K.; writing—original draft preparation, K.T., J.K.; writing—review and editing, K.T., J.K. and R.K., G.H.-E., A.T.; visualization, K.T., G.H.-E.; supervision, A.T.; project administration, A.T.; funding acquisition, A.T. All authors have read and agreed to the published version of the manuscript.
Funding
This research was funded by the European Regional Development Fund and Estonian Research Council via project RESTA23.
Acknowledgments
This study was supported by the European Regional Development Fund and Estonian Research Council via project RESTA23. The authors thank K. Tamm for the help with HSC software.
Conflicts of Interest
The authors declare no conflict of interest.
References
- Schorr, M.; Valdez-Salas, B.; Zlatev, R.; Stoytcheva, M. Phosphate ore processing for phosphoric acid production: Classical and novel technology. Miner. Process. Extr. Met. 2010, 119, 125–129. [Google Scholar] [CrossRef]
- Dorozkin, S.V. Dissolution mechanism of calcium apatites in acids: A review of literature. World J. Methodol. 2012, 2, 1–17. [Google Scholar] [CrossRef]
- Aly, H.F.; Ali, M.M.; Taha, M.H. Dissolution Kinetics of Western Deseret Phosphate Rocks, Abu Tartur with Hydrochloric Acid. Arab. J. Nucl. Sci. Appl. 2013, 46, 1–16. [Google Scholar]
- Abd El-Mottaleb, M.; Cheira, M.F.; Gouda, G.A.H.; Ahmed, A.S.A. Leaching of Rare Earth Elements from Egyptian Western Desert Phosphate Rocks using HCl. Chem. Adv. Mat. 2016, 1, 33–40. [Google Scholar]
- Kandil, A.-H.T.; Mira, H.I.; Mohamed, H.; Taha, M.H.; Kamel, M.F. Production of pure phosphoric acid from El-Sebaeya low-grade phosphate ore. Sep. Sci. Technol. 2017, 52, 679–690. [Google Scholar] [CrossRef]
- Shlewit, H. Treatment of phosphate rocks with hydrochloric acid. J. Radioanal. Nucl. Chem. 2010, 287, 49–54. [Google Scholar] [CrossRef]
- Stone, K.; Bandara, A.; Senanayake, G.; Jayasekera, S. Processing of rare earth phosphate concentrates: A comparative study of pre-leaching with perchloric, hydrochloric, nitric and phosphoric acids and deportment of minor/major elements. Hydrometallurgy 2016, 163, 137–147. [Google Scholar] [CrossRef]
- Zendah, H.; Khattech, I.; Jemal, M. Thermochemical and kinetic studies of the acid attack of “B” type carbonate fluorapatites at different temperatures (25–55) °C. Thermochim. Acta 2013, 565, 46–51. [Google Scholar] [CrossRef]
- Chihi, H.; Khattech, I.; Jemal, M. Thermochemistry and kinetics of the attack of magnesium-carbonate co-substituted fluo-rapatites by hydrochloric acid at different temperatures (25–55) °C. Thermochim. Acta 2016, 646, 16–25. [Google Scholar] [CrossRef]
- Bandara, A.; Senanayake, G. Dissolution of calcium, phosphate, fluoride and rare earth elements (REEs) from a disc of natural fluorapatite mineral (FAP) in perchloric, hydrochloric, nitric, sulphuric and phosphoric acid solutions: A kinetic model and comparative batch leaching of major and minor elements from FAP and RE-FAP concentrate. Hydrometallurgy 2018, 184, 218–236. [Google Scholar] [CrossRef]
- Wu, S.; Zhao, L.; Wang, L.; Huang, X.; Zhang, Y.; Feng, Z.; Cui, D. Simultaneous recovery of rare earth elements and phos-phorus from phosphate rock by phosphoric acid leaching and selective precipitation: Towards green process. J. Rare Earths 2019, 37, 652–658. [Google Scholar] [CrossRef]
- Brahim, K.; Soussi-Baatout, A.; Khattech, I.; Jemal, M. Dissolution kinetics of fluorapatite in the hydrochloric acid solution. J. Therm. Anal. Calorim. 2017, 129, 701–708. [Google Scholar] [CrossRef]
- Zendah, H.; Khattech, I.; Jemal, M. Synthesis, characterization, and thermochemistry of acid attack of “B” type carbonate fluorapatites. J. Therm. Anal. Calorim. 2012, 109, 855–861. [Google Scholar] [CrossRef]
- Soltani, F.; Abdollahy, M.; Petersen, J.; Ram, R.; Koleini, S.J.; Moradkhani, D. Leaching and recovery of phosphate and rare earth elements from an iron-rich fluorapatite concentrate: Part II: Selective leaching of calcium and phosphate and acid baking of the residue. Hydrometallurgy 2018, 184, 29–38. [Google Scholar] [CrossRef]
- Gadaleta, S.J.; Paschalis, E.P.; Betts, F.; Mendelsohn, R.; Boskey, A.L. Fourier transform infrared spectroscopy of the solu-tion-mediated conversion of amorphous calcium phosphate to hydroxyapatite: New correlations between X-ray diffraction and infrared data. Calcif. Tissue Int. 1996, 58, 9–16. [Google Scholar] [CrossRef] [PubMed]
Publisher’s Note: MDPI stays neutral with regard to jurisdictional claims in published maps and institutional affiliations. |
© 2021 by the authors. Licensee MDPI, Basel, Switzerland. This article is an open access article distributed under the terms and conditions of the Creative Commons Attribution (CC BY) license (https://creativecommons.org/licenses/by/4.0/).