Article

Upconversion and Downconversion Luminescence of CaLaLiTeO6:Mn4+/Er3+ Phosphors for Dual-Mode Optical Thermometry and Anti-Counterfeiting Application

1
Anhui Engineering Research Center for Photoelectrocatalytic Electrode Materials, School of Electrical Engineering, Huainan Normal University, Huainan 232038, China
2
School of Chemistry, Chemical and Environmental Engineering, Weifang University, Weifang 261061, China
*
Authors to whom correspondence should be addressed.
Inorganics 2025, 13(9), 308; https://doi.org/10.3390/inorganics13090308
Submission received: 30 July 2025 / Revised: 3 September 2025 / Accepted: 11 September 2025 / Published: 13 September 2025

Abstract

Multifunctional phosphors that integrate optical temperature measurement and counterfeit detection capabilities have garnered considerable interest owing to their diverse application potential. In this study, novel CaLaLiTeO6:Mn4+/Er3+ phosphors were prepared via the high-temperature solid-phase method. The phase structure and morphology characterization confirmed the successful synthesis of CaLaLiTeO6 material with effective doping of Mn4+ and Er3+ into the host lattice. Upon excitation at 379 nm, the CaLaLiTeO6:Mn4+/Er3+ material exhibits far-red emission at 716 nm (Mn4+:2Eg4A2g) and green emission at 525/548 nm (Er3+:2H11/2/4S3/24I15/2). The emission peak intensities of Er3+ and Mn4+ ions in the CaLaLiTeO6:0.015Mn4+/0.01Er3+ sample displayed distinct variations with temperature under different excitation wavelengths (325 nm, 379 nm, and 980 nm). Subsequently, a dual-mode optical temperature sensing system was developed based on the fluorescence intensity ratio and the dual excitation single-band ratiometric method, which achieved a maxed relative sensitivity of 1.12% K−1 at 343 K. Moreover, the excitation-dependent luminescence color changes of CaLaLiTeO6:Mn4+/Er3+ make it particularly suitable for anti-counterfeiting applications. The present study underscores the dual-functional capabilities in sophisticated non-contact optical temperature measurement and anti-counterfeiting applications.

1. Introduction

With the advancement of society, there is a progressively increasing need for temperature sensing systems that demonstrate excellent resolution, exceptional sensitivity, and nondestructive characteristics [1,2,3,4]. The emergence of new thermometers that utilize the optical response of materials offers distinct advantages, including outstanding light efficiency, resilience to environmental factors, and swift reaction times, positioning them as a significant focus of contemporary research [5]. Luminescent materials possess specific optical characteristics that respond to temperature variations, which include the shape of the emission spectrum, position of the emission maximum, spectral width, fluorescence intensity ratio (FIR), polarization dependence, fluorescence strength, and fluorescence decay time [6]. Of these characteristics, the FIR temperature measurement technique is acknowledged as a promising approach because of its decreased reliance on measurement conditions and resilience to spectral degradation [7].
Most FIR thermometers primarily rely on thermally coupled energy levels (TCLs) of rare earth (RE) ions. The enhancement of relative sensitivity necessitates a broader TCL energy gap; however, the stable energy gap of TCLs (ranging from 200 cm−1 to 2000 cm−1) imposes limitations on the improvement of relative sensitivity. To enhance thermometric sensitivity, co-doping independent dual emitting centers has garnered significant interest due to its substantial variation in FIR with temperature, resulting in relatively high sensitivity. This approach is typically achieved by co-doping a RE ion with a transition metal (TM) ion, which serve as the reference and temperature probe signals, respectively [8,9]. The FIR based on the dual emission peak ratio under a single excitation source exhibits greater stability owing to its reduced sensitivity to measurement conditions and external interferences [8]. The photoluminescence (PL) properties of TM ions are particularly susceptible to surrounding conditions due to their unshielded 3d shell, rendering TM-based luminescence more effective for temperature sensing in comparison to RE-based counterparts. For instance, Yan et al. reported a maximum relative sensitivity of 0.7% K−1 for Lu3Al5O12:Eu3+/Mn4+ phosphors [10]. Fang et al. demonstrated that the CaGdAlO4:Mn4+, Tb3+ phosphors achieved a maximum relative sensitivity of 2.3% K−1 [11]. In addition to the FIR mode associated with dual different emission centers, an innovative measurement strategy has emerged for assessing the temperatures of objects, referred to as the dual-excitation single-band ratiometric (SBR) thermometry strategy. Using the SBR technique, Trejgis et al. developed an optical thermometer through the use of the excited state absorption mechanism [12]. Yang et al. also developed an innovative SBR-based temperature sensor that leverages the redshift of the charge transfer band edge [13]. Integrating multiple modes within a single phosphor may represent an effective strategy for enhancing thermometric performance and providing self-calibrating capabilities. In comparison to single-mode temperature sensors, multi-mode thermometers exhibit superior performance, characterized by higher accuracy and sensitivity [9]. Energy transfer mechanisms between impurity ions can extend beyond classical resonant models to include processes mediated by the host lattice, such as charge carrier trapping and thermal release or exciton migration, as demonstrated in LaPO4:Ce,Tb nanocrystals, where the microsecond-scale rise time of Tb3+ emission and its strong thermal quenching at low temperatures reflect a temperature-dependent transfer efficiency contrary to resonant behavior [14]. In YAG:Nd,Er,Cr systems, Cr3+ acts as a sensitizer via phonon-assisted energy transfer to lanthanides, while Cr4+ serves as an energy bridge between Nd3+ and Er3+ [15], with both processes exhibiting pronounced temperature sensitivity due to their phonon-assisted nature, leading to enhanced emission intensity and thermometric performance at elevated temperatures.
In recent years, the double-perovskite structure of AA’BB’O6 has garnered significant research attention [16]. Contrasted with the ABO3 perovskite, the double-perovskite structure offers a greater number of lattice sites for substituting various elements, particularly high-valence ions such as Nb5+, Sb5+, Te6+, and W6+, thus facilitating the formation of a diverse lattice framework. This diversity facilitates the formation of multiple crystalline phases, including cubic, monoclinic, and other crystal systems. The abundant double-perovskite structures provide numerous [BO6] and [B’O6] octahedral sites capable of accommodating Mn4+ substitution. Noteworthy is the fact that the replacement of ions at the A, A’, B, and B’ sites induces distortions, contractions, and other alterations in the octahedral groups, thereby imparting new luminescent behaviors to Mn4+. One exemplary host of the double-perovskite structure is CaLaLiTeO6 (CLLT), which facilitates PL across different bands through the activation of various ions [16,17,18,19]. In this study, TM Mn4+ ions and RE Er3+ ions were successfully doped into the CLLT double-perovskite structure. The synthesized products underwent characterization of phase structure and morphology through X-Ray diffraction (XRD), scanning electron microscope (SEM), and elemental mapping analyses. Moreover, the PL characteristics of the specimens with varying doping levels were thoroughly investigated at different excitation wavelengths. Leveraging the distinctive thermal behaviors of Er3+ and Mn4+ luminescence, a dual-mode optical thermometry was developed by combining dual emission LIR and dual excitation SBR methods. Furthermore, the co-doped CLLT:Mn4+/Er3+ phosphor demonstrates practical applications in the production of anti-counterfeiting tags, leveraging its excitation-dependent color-switching properties.

2. Results and Discussion

2.1. Crystalline Structure and Morphology

The crystal structure and phase purity of the synthesized phosphors were characterized by XRD patterns. The XRD patterns of samples including CLLT, CLLT:0.015Mn4+, CLLT:0.01Er3+, CLLT:0.015Mn4+/0.01Er3+, and CLLT:0.015Mn4+/0.10Er3+ closely matched those of the reference card (PDF # 04-018-0711) for CLLT, as depicted in Figure 1a. These phosphors exhibited a monoclinic crystal structure identical to that of the CLLT crystal, belonging to the P21/c space group. Notably, no impurity phases were detected in the XRD patterns, indicating that the codoping with Mn4+ and Er3+ did not induce significant structural distortions in the double-perovskite system.
In assessing ion substitution within the crystal structure, the difference in ionic radius (Dr) was determined using the following equation:
D r = R s ( C N ) R d ( C N ) R s ( C N ) × 100 %
where Dr signifies the percentage variation in radius, CN indicates the coordination number, and Rs and Rd refer to the radii of the central and substituted ions, respectively. Typically, Er3+ substitutes ions with greater radii, such as Ca2+ or La3+, within this structure. The calculated ionic radius differences are determined as Dr(Er-La) = 13.44% and Dr(Er-Ca) = 10.35%. Given their similar positions and sizes, Er3+ is expected to be disordered and occupy La3+ or Ca2+ sites. This behavior is consistent with observations in other rare-earth-doped phosphors with the identical host material, such as CaLaLiTeO6:Tm3+/Mn4+ [17] and CaLaLiTeO6:Yb3+,Tm3+ [20]. Conversely, Mn4+ is improbable as a substitute for La3+ or Ca2+ owing to the significant difference in ionic radii. Mn4+ typically occupies sites with octahedral coordination and emits red light. Within the CLLT matrix, two octahedral structures exist: [TeO6]6− and [LiO6]11−. Calculations based on elemental radii differences show Dr(Mn-Te) as 5.35% and Dr(Mn-Li) as 30.26%. Consequently, Mn4+ ions preferably substitute Te6+ within the CLLT matrix as opposed to Li+ sites, following the principle of radius similarity.
The substitution of Ca2+ by Er3+ and Te6+ by Mn4+ introduces localized charge imbalances that necessitate compensation mechanisms. Due to the low concentrations of Er and Mn, their core-level peaks could not be directly detected in the X-Ray photoelectron spectroscopy (XPS) survey spectrum of CaLaLiTeO6:0.015Mn4+/0.01Er3+ (Figure S1a, Supplementary Information). Instead, the high-resolution O 1s spectrum was deconvoluted into two components, corresponding to oxygen vacancy and lattice oxygen (Figure S1b, Supplementary Information). These oxygen vacancies serve as the primary charge compensation mechanism for both the positive charge excess created by Er3+ substituting for Ca2+ and the negative charge deficit created by Mn4+ substituting for Te6+.
In order to validate the crystal structure further, Rietveld structure refinement of CLLT:0.015Mn4+/0.01Er3+ was performed utilizing the standard structures of PDF # 04-018-0711 as the initial data. As shown in Figure 1b, the refinement yielded Rwp = 6.25%, Rp = 4.83%, and χ2 = 1.65, indicating good agreement between the experimental and standard data. The cell volume was calculated as 245.83 Å3, with an average Ca-O bond distance of 2.58 Å for the CLLT:0.015Mn4+/0.01Er3+ samples. The refined atomic parameters for CLLT:0.015Mn4+/0.01Er3+ are summarized in Table S1 provided in the Supplementary Information. The crystal structures extracted from the refinement findings are depicted in Figure 1c. The skeletal structure of CLLT comprises alternating octahedra [TeO6]6− and [LiO6]11−, with Ca2+ and La3+ ions occupying the interspaces between these octahedra to maintain overall charge balance and structural stability. The Ca2+/La3+/Er3+ cations belong to the 8-coordinated 4e Wyckoff position, while the Li+ and Te6+/Mn4+ cations occupy the 6-coordinated 2d and 2a Wyckoff positions, respectively.
The morphology and crystallinity of particles significantly influence the luminescent properties of phosphors. The SEM image inset in Figure 1d illustrates CLLT:0.015Mn4+/0.01Er3+ phosphors with irregularly shaped grains that are agglomerated. The presence of well-grown grains with smooth surfaces enhances their performance as luminescent materials. The SEM analysis indicates an average particle size of 4.67 μm within a range of 2.07–9.70 μm. The Energy-Dispersive X-Ray Spectroscopy (EDX) and elemental mappings, as shown in Figure 1d,e, demonstrate the uniform distribution of elements (Ca, La, Te, O, Mn, and Er) on the particle surfaces. The atomic percentages obtained from the EDX quantitative analysis are summarized in Table S2 (Supplementary Information). The results confirm the successful incorporation of both Mn4+ and Er3+ into the host lattice without significant segregation or impurity formation.

2.2. Diffuse Reflection Spectra and Electronic Band Structure

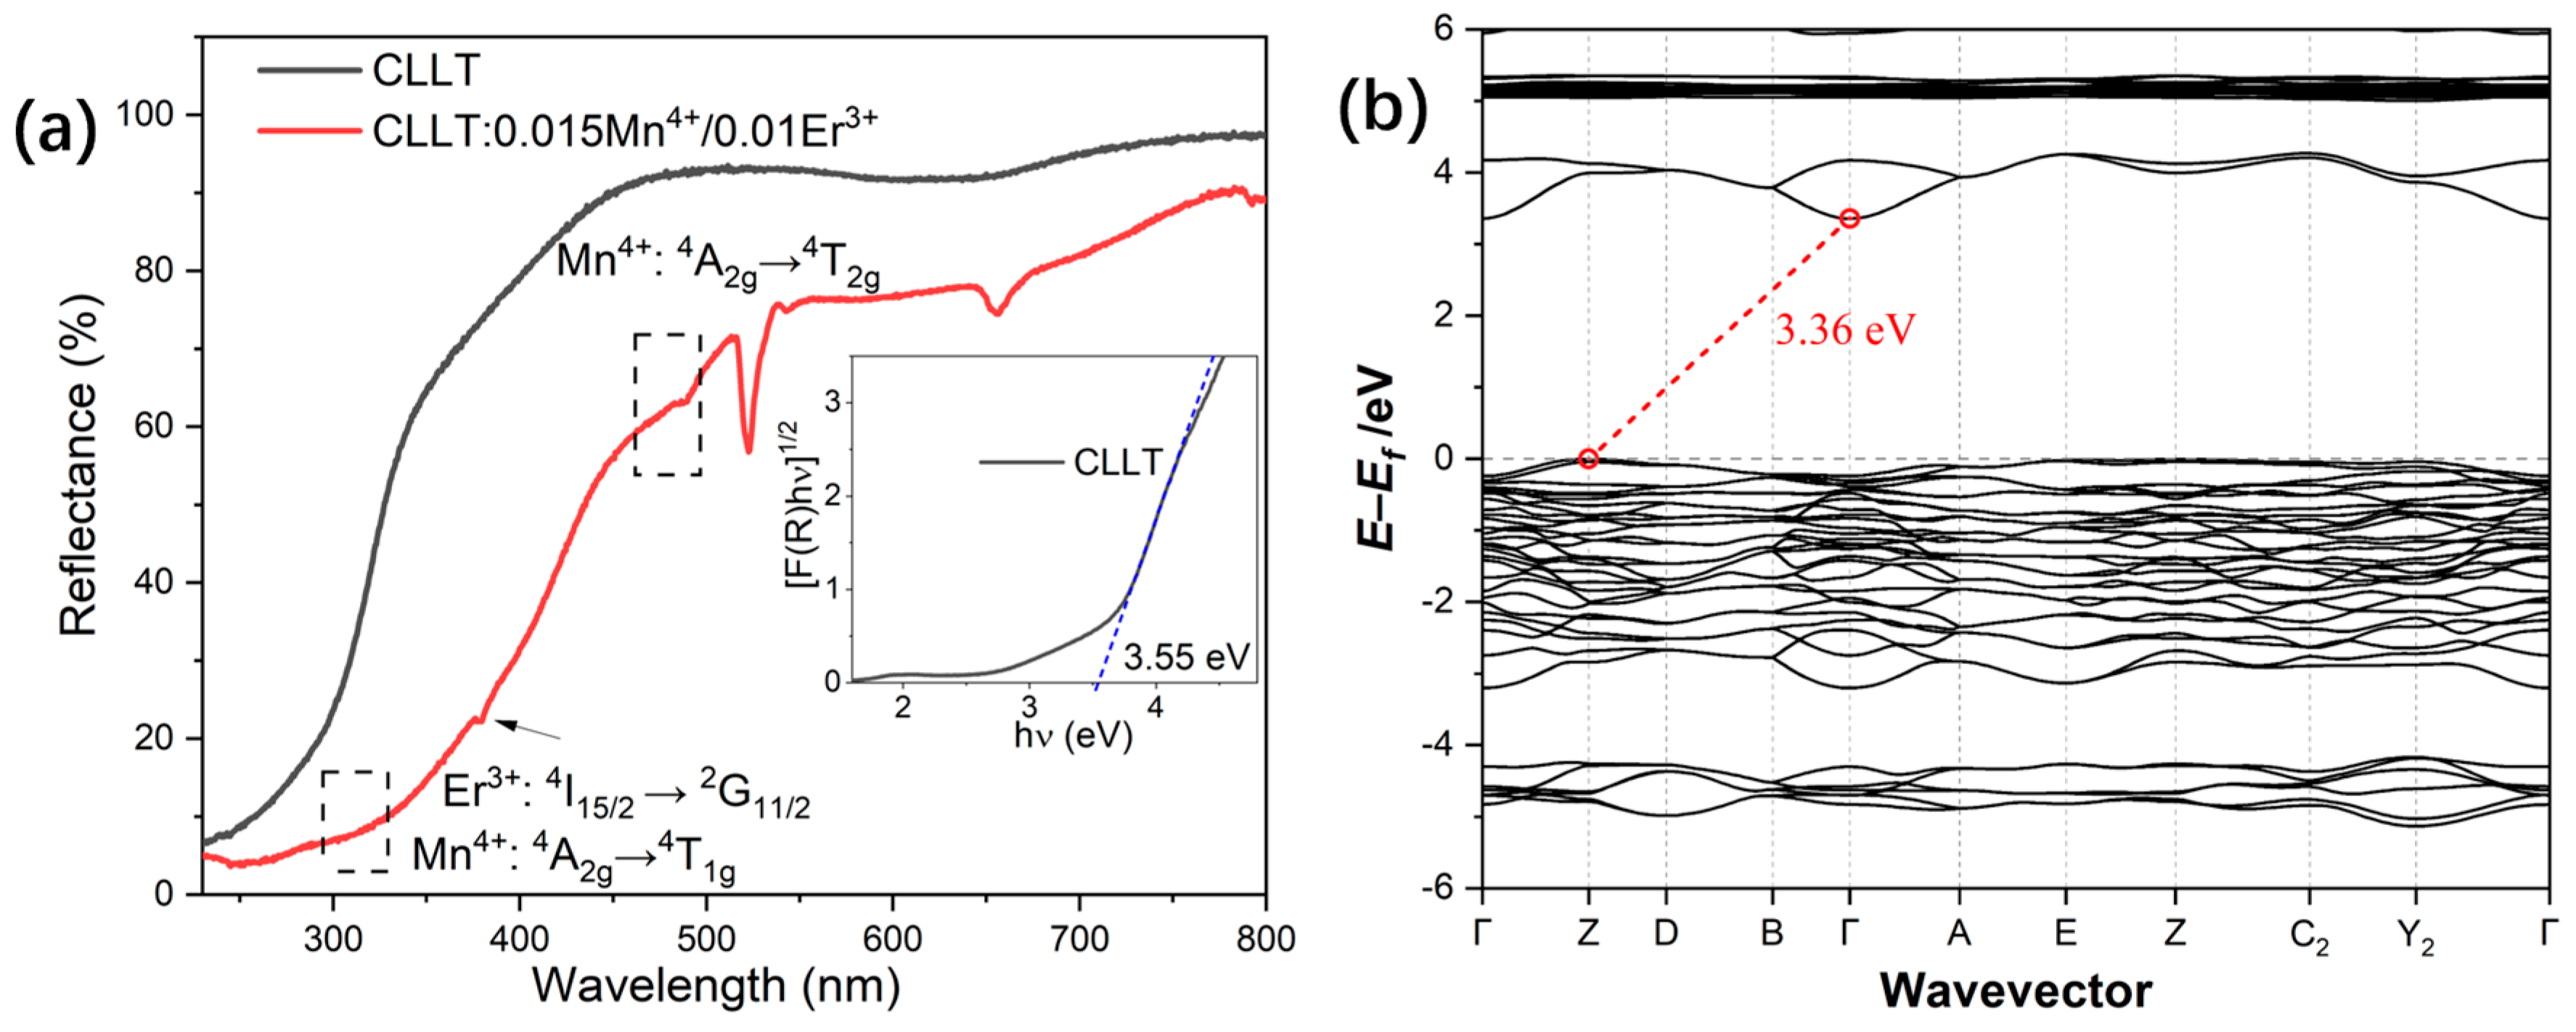
Figure 2a presents the UV–visible diffuse reflectance spectra of the phosphors within the wavelength range of 240–800 nm. The f-f absorption transition of Er3+ is observed at 379 nm, corresponding to the 4I15/22G11/2 transitions. Moreover, absorption bands at approximately 318 nm and 476 nm are attributed to the 4A2g4T2g and 4A2g4T1g transitions of Mn4+, respectively [17]. The Kubelka–Munk formula was applied to determine the bandgap energy (Eg) of the samples derived from the diffuse reflectance spectra, as expressed in the following equation [21]:
F ( R ) = ( 1 R ) 2 2 R
where R denotes the diffuse reflection coefficient. The relationship between the bandgap energy Eg and the Kubelka–Munk function is represented by the equation [22]:
( F ( R ) h ν ) n = c ( h ν E g )
Here, h denotes Planck’s constant, ν is the frequency of incident light, and c is a constant. The exponent n takes values of 2, 1/2, 2/3, and 1/3 for direct–allowed, indirect–allowed, direct–forbidden, and indirect–forbidden transitions, respectively. Detailed density functional theory (DFT) calculations of the electronic properties were conducted, and the calculated band structure of the CLLT host is illustrated in Figure 2b. The theoretical calculations indicate that CLLT exhibits an indirect bandgap of 3.36 eV, with the valence band maximum (VBM) situated at the Z point and the conduction band minimum (CBM) located at the Γ point in the Brillouin zone. Given that CLLT demonstrates indirect bandgap characteristics, the value of n is considered to be 1/2 for the calculations presented herein.
The inset of Figure 2a depicts the [F(R)hν]1/2 versus hν plot for the CLLT host, resulting in a calculated bandgap energy of 3.55 eV. Notably, the experimental bandgap value indicated in the inset of Figure 2a is slightly elevated compared to the computed value presented in Figure 2b. The theoretical prediction is typically smaller than the experimentally determined bandgap [23]. This deviation can primarily be attributed to abrupt changes in the derivative of the total energy Eg concerning the electron count N, within the context of DFT, as well as the self-interaction error of electrons [24]. These findings unequivocally confirm the indirect bandgap semiconductor nature of this material. Additionally, its wide bandgap characteristic (>3.3 eV) is essential for enabling effective electronic transitions in RE or TM luminescent centers.

2.3. Photoluminescence Properties

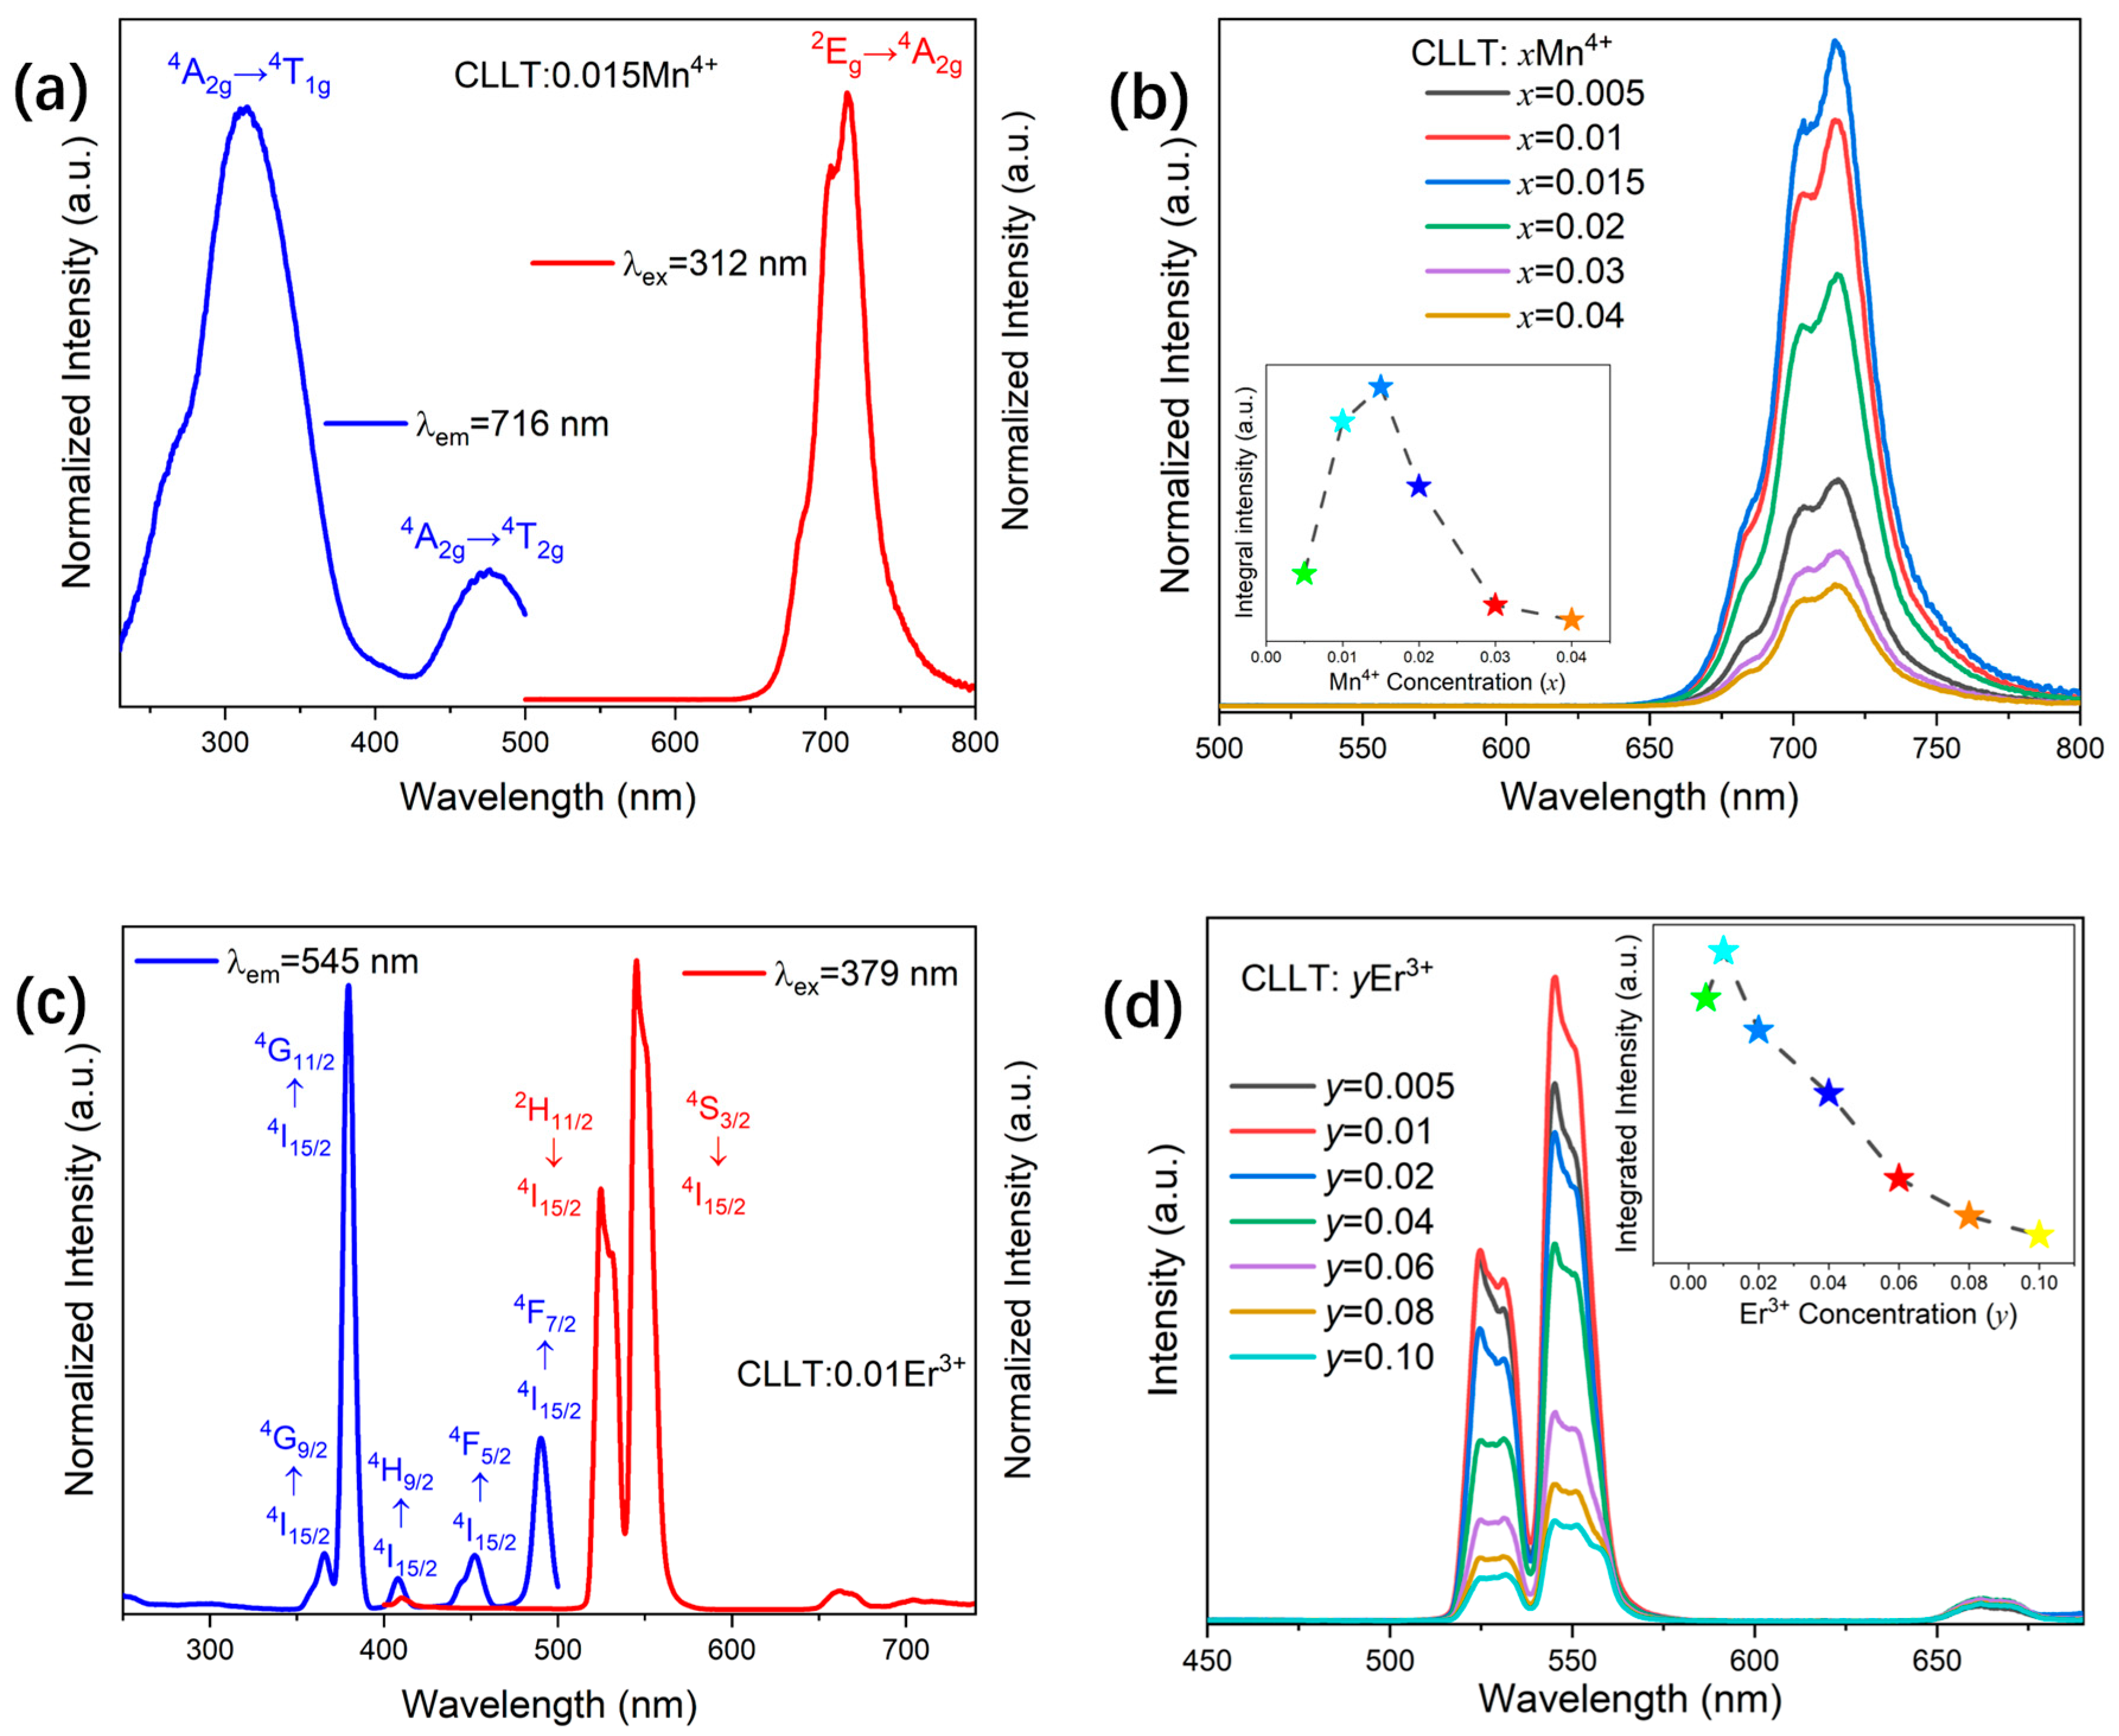
The photoluminescence excitation (PLE) and PL spectra of Mn4+-single-doped CLLT are illustrated in Figure 3a. The excitation spectrum, monitored at 716 nm, exhibits two broad excitation bands centered around 312 nm and 476 nm, which correspond to the 4A2g4T1g and 4A2g4T2g spin-allowed transitions, respectively [25,26]. When excited at 312 nm, the CLLT:0.015Mn4+ phosphor emits a broad and asymmetric spectrum centered at 716 nm, with an accompanying hump at approximately 703 nm. This emission can be attributed to the 2Eg4A2g transition of the Mn4+ ion, while the observed hump results from the splitting of the 2Eg levels due to the influence of the crystal field [26].
Figure 3b displays the PL spectra and integral intensity for CLLT:xMn4+ (where x = 0.005, 0.01, 0.015, 0.02, 0.03, and 0.04). As the concentration of Mn4+ increases, the emission intensity initially rises, reaching its peak at x = 0.015, before subsequently declining. Notably, the locations of the emission peaks stay relatively consistent across the concentration range. Consequently, the optimal concentration of Mn4+ for enhanced luminescence is determined to be x = 0.015, which is significantly higher than that observed in other concentrations.
As the concentration of Mn4+ ions increases, the enhanced number of Mn4+ luminescent centers leads to a gradual increase in the luminescence intensity of the CLLT:xMn4+ phosphors. However, for concentrations exceeding 0.015, the decreased inter-ionic distance leads to concentration quenching of the Mn4+ ions, contributing to a gradual decline in spectral intensity. The critical distance Rc between Mn4+ ions can be estimated using the following equation [27]:
R c = 2 ( 3 V 4 π x c N ) 1 3
where V (245.83 Å3) represents the unit cell volume, xc (0.015) denotes the critical doping concentration for Mn4+, and N (2) indicates the number of available Mn4+ sites within the unit cell. Thus, the estimated Rc value is approximately 25.02 Å. Three mechanisms contribute to concentration quenching: exchange interaction, radiation re-absorption, and electric multipolar interaction. The exchange interaction is pertinent when the Rc value is less than 5 Å; however, the calculated Rc value for the prepared sample is substantially greater than this threshold. Radiation re-absorption arises when spectral overlap occurs between the sensitizer’s emission and the activator’s PLE spectra. Consequently, the predominant mechanism for concentration quenching in this study is attributed to electric multipolar interactions.
The electric multipolar interaction is further analyzed with values of θ assigned as 6, 8, and 10, corresponding, respectively, to dipole–dipole, dipole–quadrupole, and quadrupole–quadrupole interactions. The θ value can be derived from the following equation [28]:
lg ( I / x ) = lg ( K / β ) ( θ / 3 ) l g ( x )
In this equation, x represents the dopant concentration, I denotes the luminescence intensity, and θ serves as an index of the electric multipolar character. Parameters K and β are constants specific to a given host material under identical excitation conditions. Upon conducting calculations, a slope of approximately −θ/3 is obtained, yielding a θ value of 6.69, which is close to 6. Hence, we conclude that the electric multipolar interaction corresponds to the dipole–dipole interaction.
The PLE and PL spectra of CLLT:Er3+ are presented in Figure 3c. The emission peaks of Er3+ stemming from the 4S3/24I15/2 transition at 545 nm reveal an excitation spectrum characterized by several narrow peaks associated with intra-4f transitions of Er3+, specifically at 365 nm (4I15/24G9/2), 379 nm (4I15/24G11/2), 407 nm (4I15/22H9/2), 452 nm (4I15/24F5/2), and 489 nm (4I15/24F7/2), respectively [1]. Under the strongest PLE peak at 379 nm, electrons are promoted to the 4F5/2 state of Er3+. By means of phonon assistance, these electrons transition to the 2H11/2 and 4S3/2 excited states of Er3+ via a non-radiative relaxation process, ultimately returning to the basal state 4I15/2 level, resulting in the characteristic green emission of Er3+ [5,29]. A series of CLLT:yEr3+ samples with varying Er3+ doping concentrations were prepared, and their PL spectra are provided in Figure 3d. The emission intensity of Er3+ initially increases and then decreases with increasing doping concentration y, reaching a maximum at y = 0.01. Furthermore, the positions of the Er3+ emission peaks at 524 nm and 545 nm remain nearly unchanged across different doping levels.
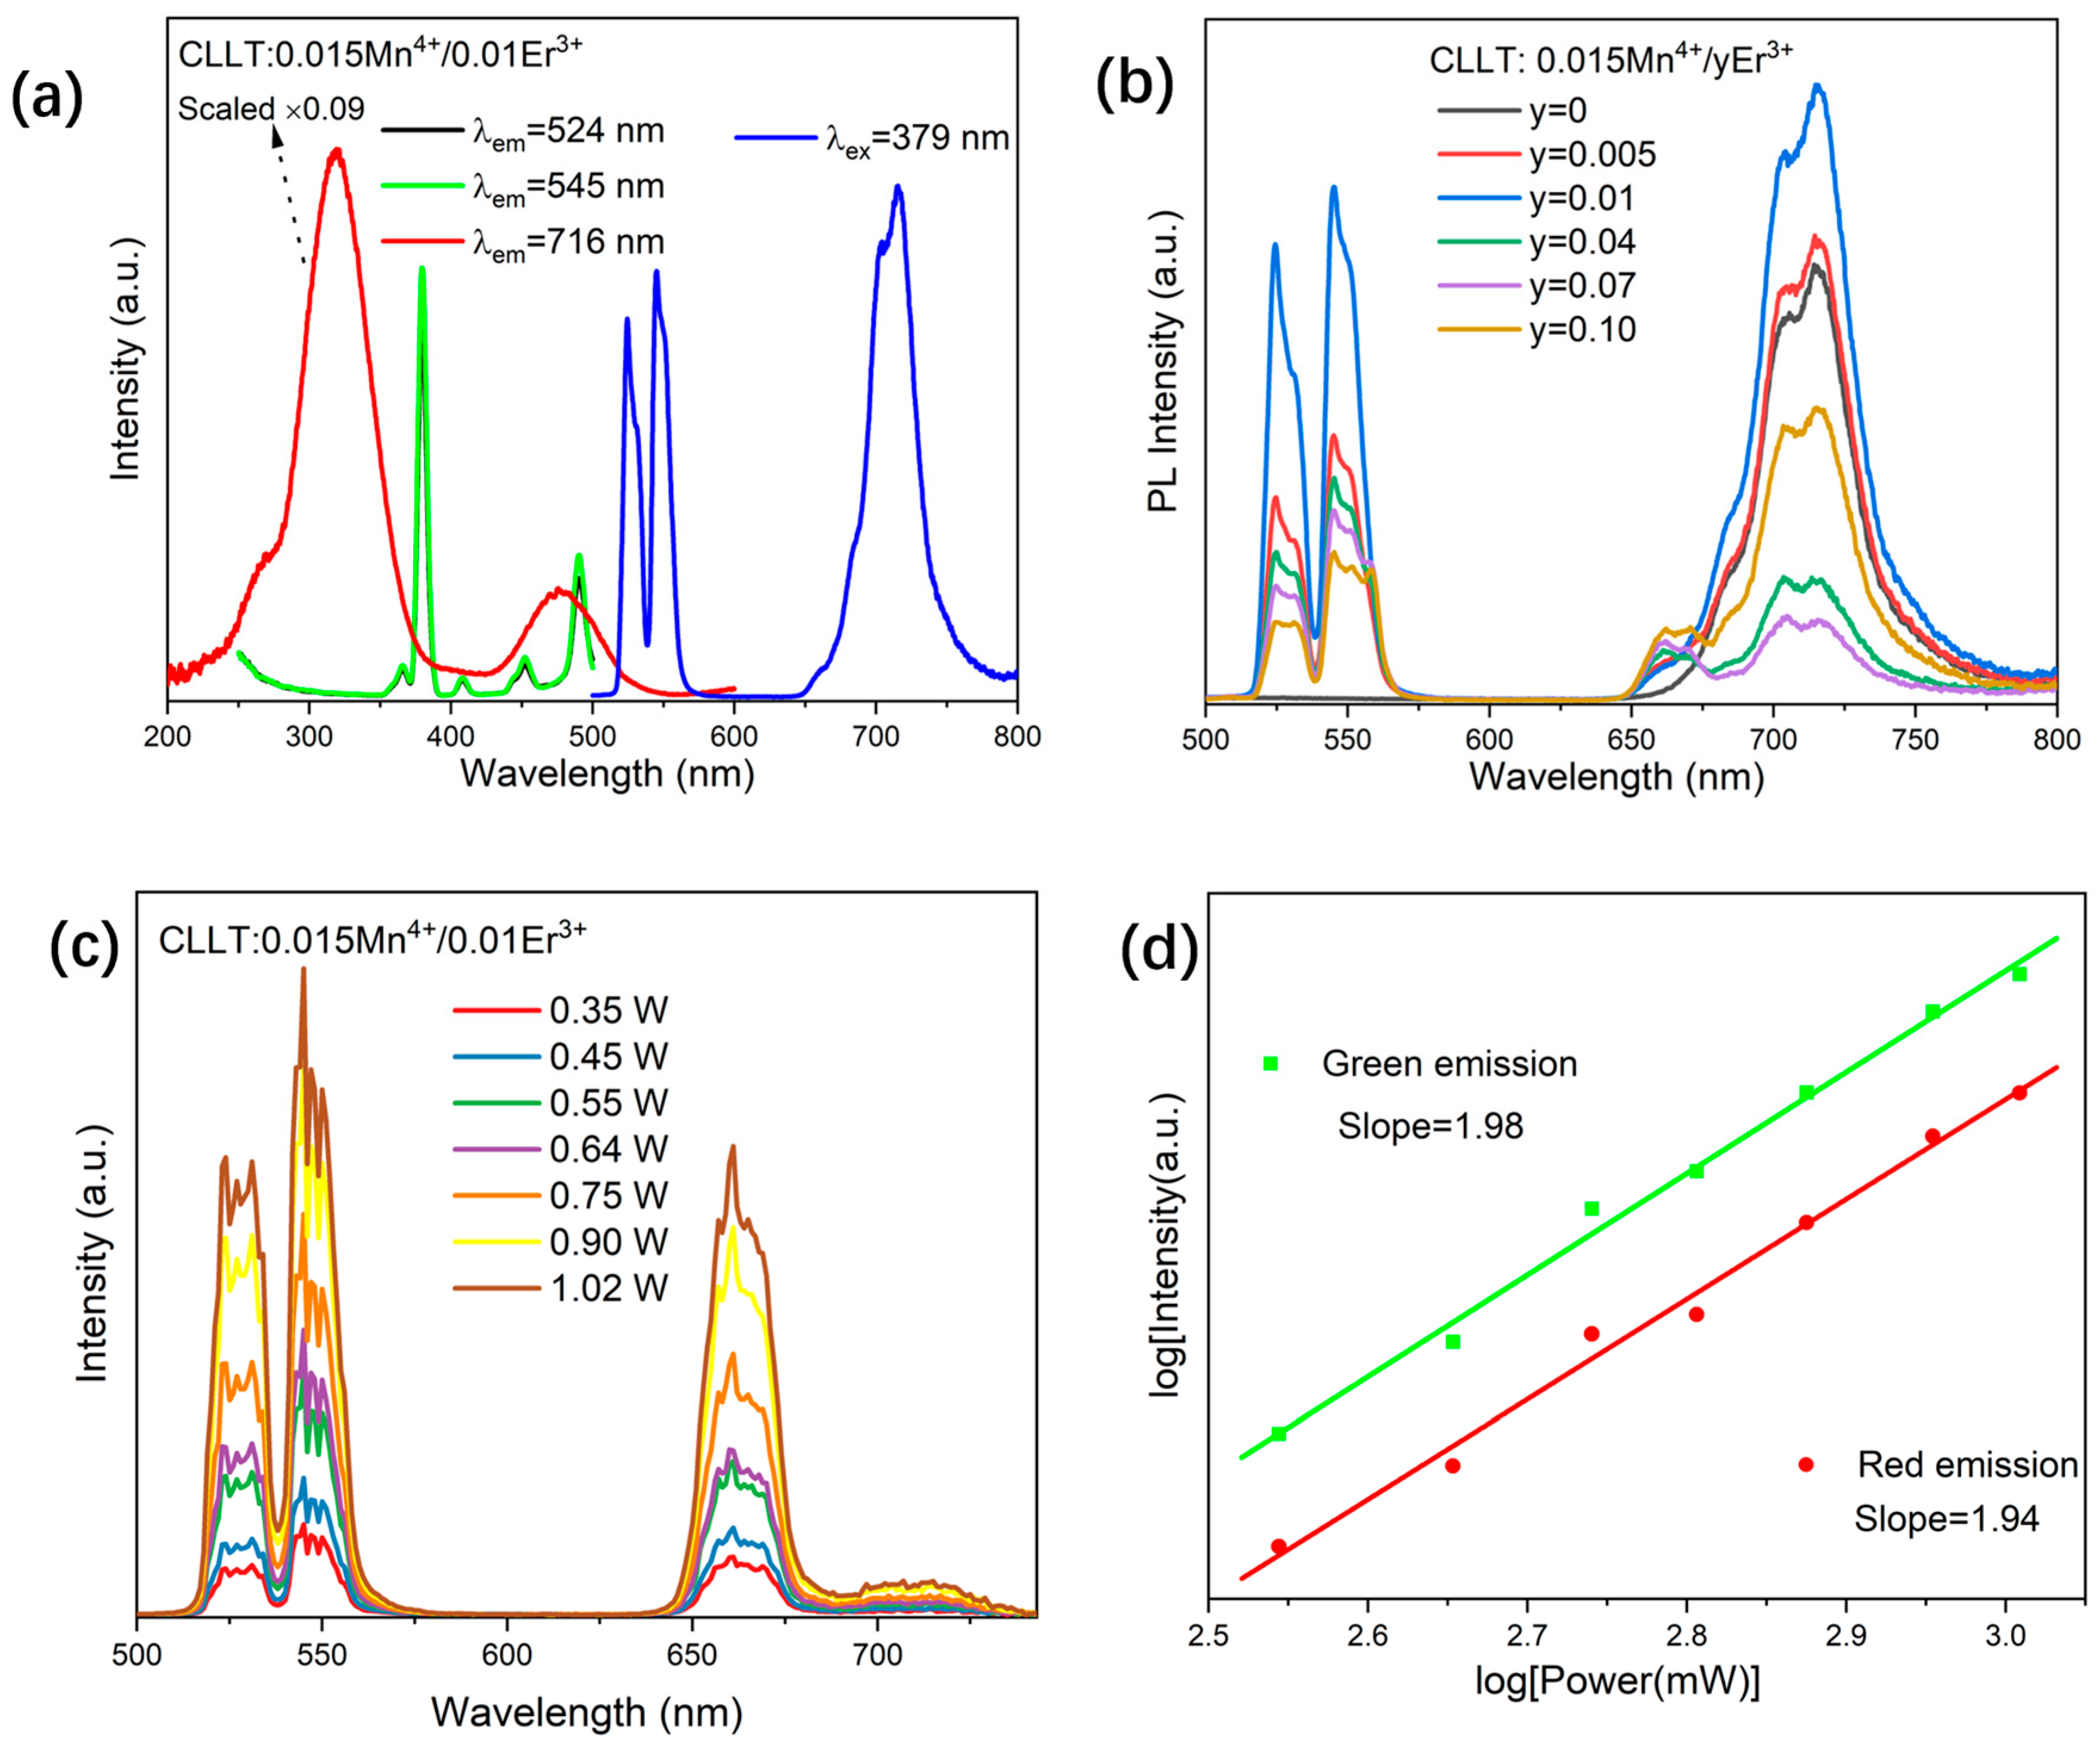
Figure 4a presents the PL and PLE spectra for CLLT:0.015Mn4+/0.01Er3+. The PLE spectra of CLLT:0.015Mn4+/0.01Er3+ while monitoring emission peaks at 524 nm, 545 nm, and 716 nm are presented. The three plots distinctly illustrate the unique PLE profiles of Er3+ and Mn4+, which correspond with the PLE data of CLLT:0.015Mn4+ and CLLT:0.01Er3+, presented in Figure 3a,c, respectively. Notably, the broad PLE band of Mn4+ significantly overlaps with the narrow PLE band of Er3+, with the prominent PLE maximum for Er3+ occurring at 379 nm. Consequently, the 379 nm wavelength can be effectively utilized as an excitation stimulant to induce luminescence from Er3+ as well as Mn4+. It is notable that a slight spectral overlap exists between the emission peaks of Er3+ and the excitation spectrum of Mn4+, indicating the potential for energy transfer (ET) from Er3+ to Mn4+.
A series of CLLT:0.015Mn4+/yEr3+ phosphors (where y = 0.005, 0.01, 0.04, 0.07, and 0.10) were synthesized, maintaining a fixed concentration of Mn4+ while varying the concentration of Er3+. The PL spectra obtained under excitation at 379 nm are depicted in Figure 4b. The CLLT:0.015Mn4+/yEr3+ phosphors exhibit three prominent emission peaks at 524 nm, 545 nm, and 716 nm, corresponding to the transitions 2H11/24I15/2 and 4S3/24I15/2 of Er3+, as well as the 2Eg4A2g transition of Mn4+. Notably, the positions of their PL peaks remain largely unaffected by the varying concentrations of Er3+, while significant variations in PL intensity are observed. As the concentration of Er3+ (y) increases, the PL intensity reaches its maximum at y = 0.01, after which it begins to decline. Considering the comparative PL intensities of both Mn4+ and Er3+, a concentration of y = 0.01 was chosen for additional investigations in the following portions.
To investigate the multi-photon upconversion (UC) luminescence mechanism of CLLT:0.015Mn4+/0.01Er3+ luminescent materials, intensity-dependent UC emission spectra were recorded, as illustrated in Figure 4c. It is clear that the locations of the UC emission peaks stay constant while the excitation power rises. Furthermore, the emission strength of UC shows a remarkable increase as the excitation intensity escalates. The three distinct luminescence peaks correspond to wavelengths of 524, 545, and 661 nm, which are attributed to the transitions 2H11/24I15/2, 4S3/24I15/2, and 4F9/24I15/2 of Er3+, respectively [30]. Additionally, a weaker luminescence peak at 716 nm is related to the 2Eg4A2g transition of Mn4+ ions. The logarithmic curves of pump power (0.35–1.02 W) versus upconversion radiation were analyzed as shown in Figure 4d. When stimulated by a 980 nm wavelength light, the inclinations of the fitting curves for green and red light were determined to be 1.98 and 1.94, suggesting their involvement in the two-photon absorption process.
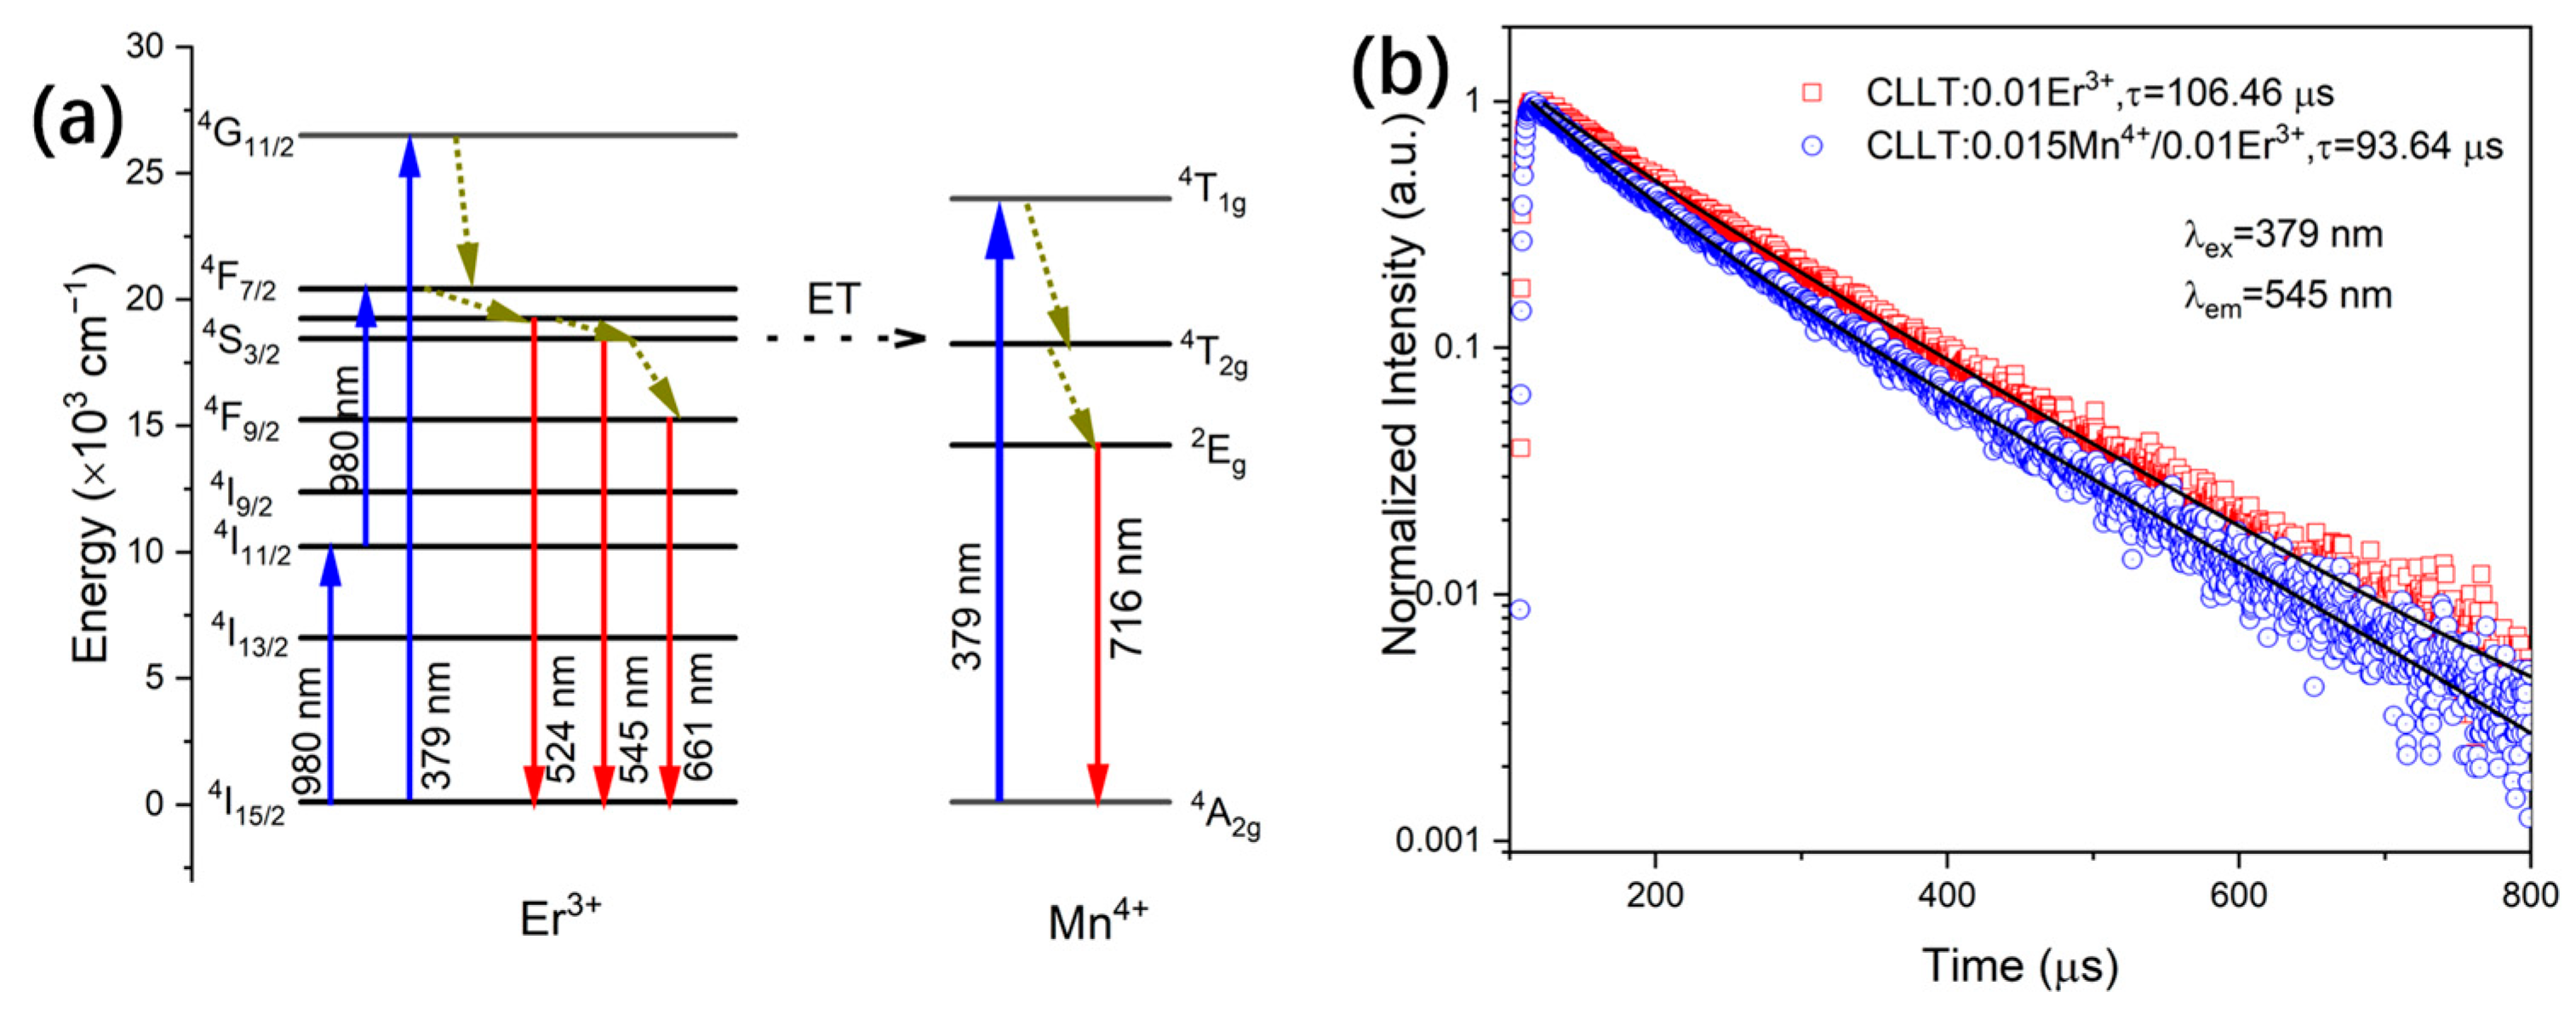
The diagram of energy levels presented in Figure 5a illustrates the ET processes involving Er3+ and Mn4+ ions under the irradiation of 980 nm light. Specifically, Er3+ undergoes transitions from 4I15/2 to 4I11/2 via ground state absorption under laser irradiation, followed by transitions to 4F7/2 stimulated by excited state absorption. Subsequently, the electrons at this energy level go through non-radiative relaxation to 2H11/2 and 4S3/2, before returning to the ground state 4I15/2, thereby generating green radiation at 524 and 545 nm. For red emission, two pathways exist whereby the Er3+ ions at the 4S3/2 level undergo non-radiative relaxation to the 4F9/2 state before transitioning back to the ground 4I15/2 state, emitting red light at 661 nm. In the UC process, the green luminescence arising from the transitions 2H11/2 or 4S3/24I15/2 could promote the electrons from the fundamental state 4A2g of Mn4+ to the excited configuration 4T2g energy level. This indicates the ET from the green emission levels 2H11/2 or 4S3/2 of Er3+ to the 4T2g level of Mn4+ ions, resulting in the faint luminescence observed at 716 nm in Figure 4c. These findings indicate the occurrence of partial energy transfer from Er3+ to Mn4+ in both the upconversion and downconversion luminescence of the CLLT:0.015Mn4+/0.01Er3+ sample. The singly doped CLLT:0.01Er3+ and the co-doped CLLT:0.015Mn4+/0.01Er3+ phosphors are shown in Figure 5b. The lifetime of Er3+ was determined to be 106.46 μs in the absence of Mn4+ and 93.64 μs in its presence, using the formula for energy transfer efficiency, η E T = 1 τ / τ 0 , where τ0 and τ are the lifetimes without and with the acceptor (Mn4+), respectively. The calculated ET efficiency is approximately 12%. This result confirms the presence of weak energy transfer from Er3+ to Mn4+.

2.4. Temperature Sensing Properties

2.4.1. Dual Emission FIR Method

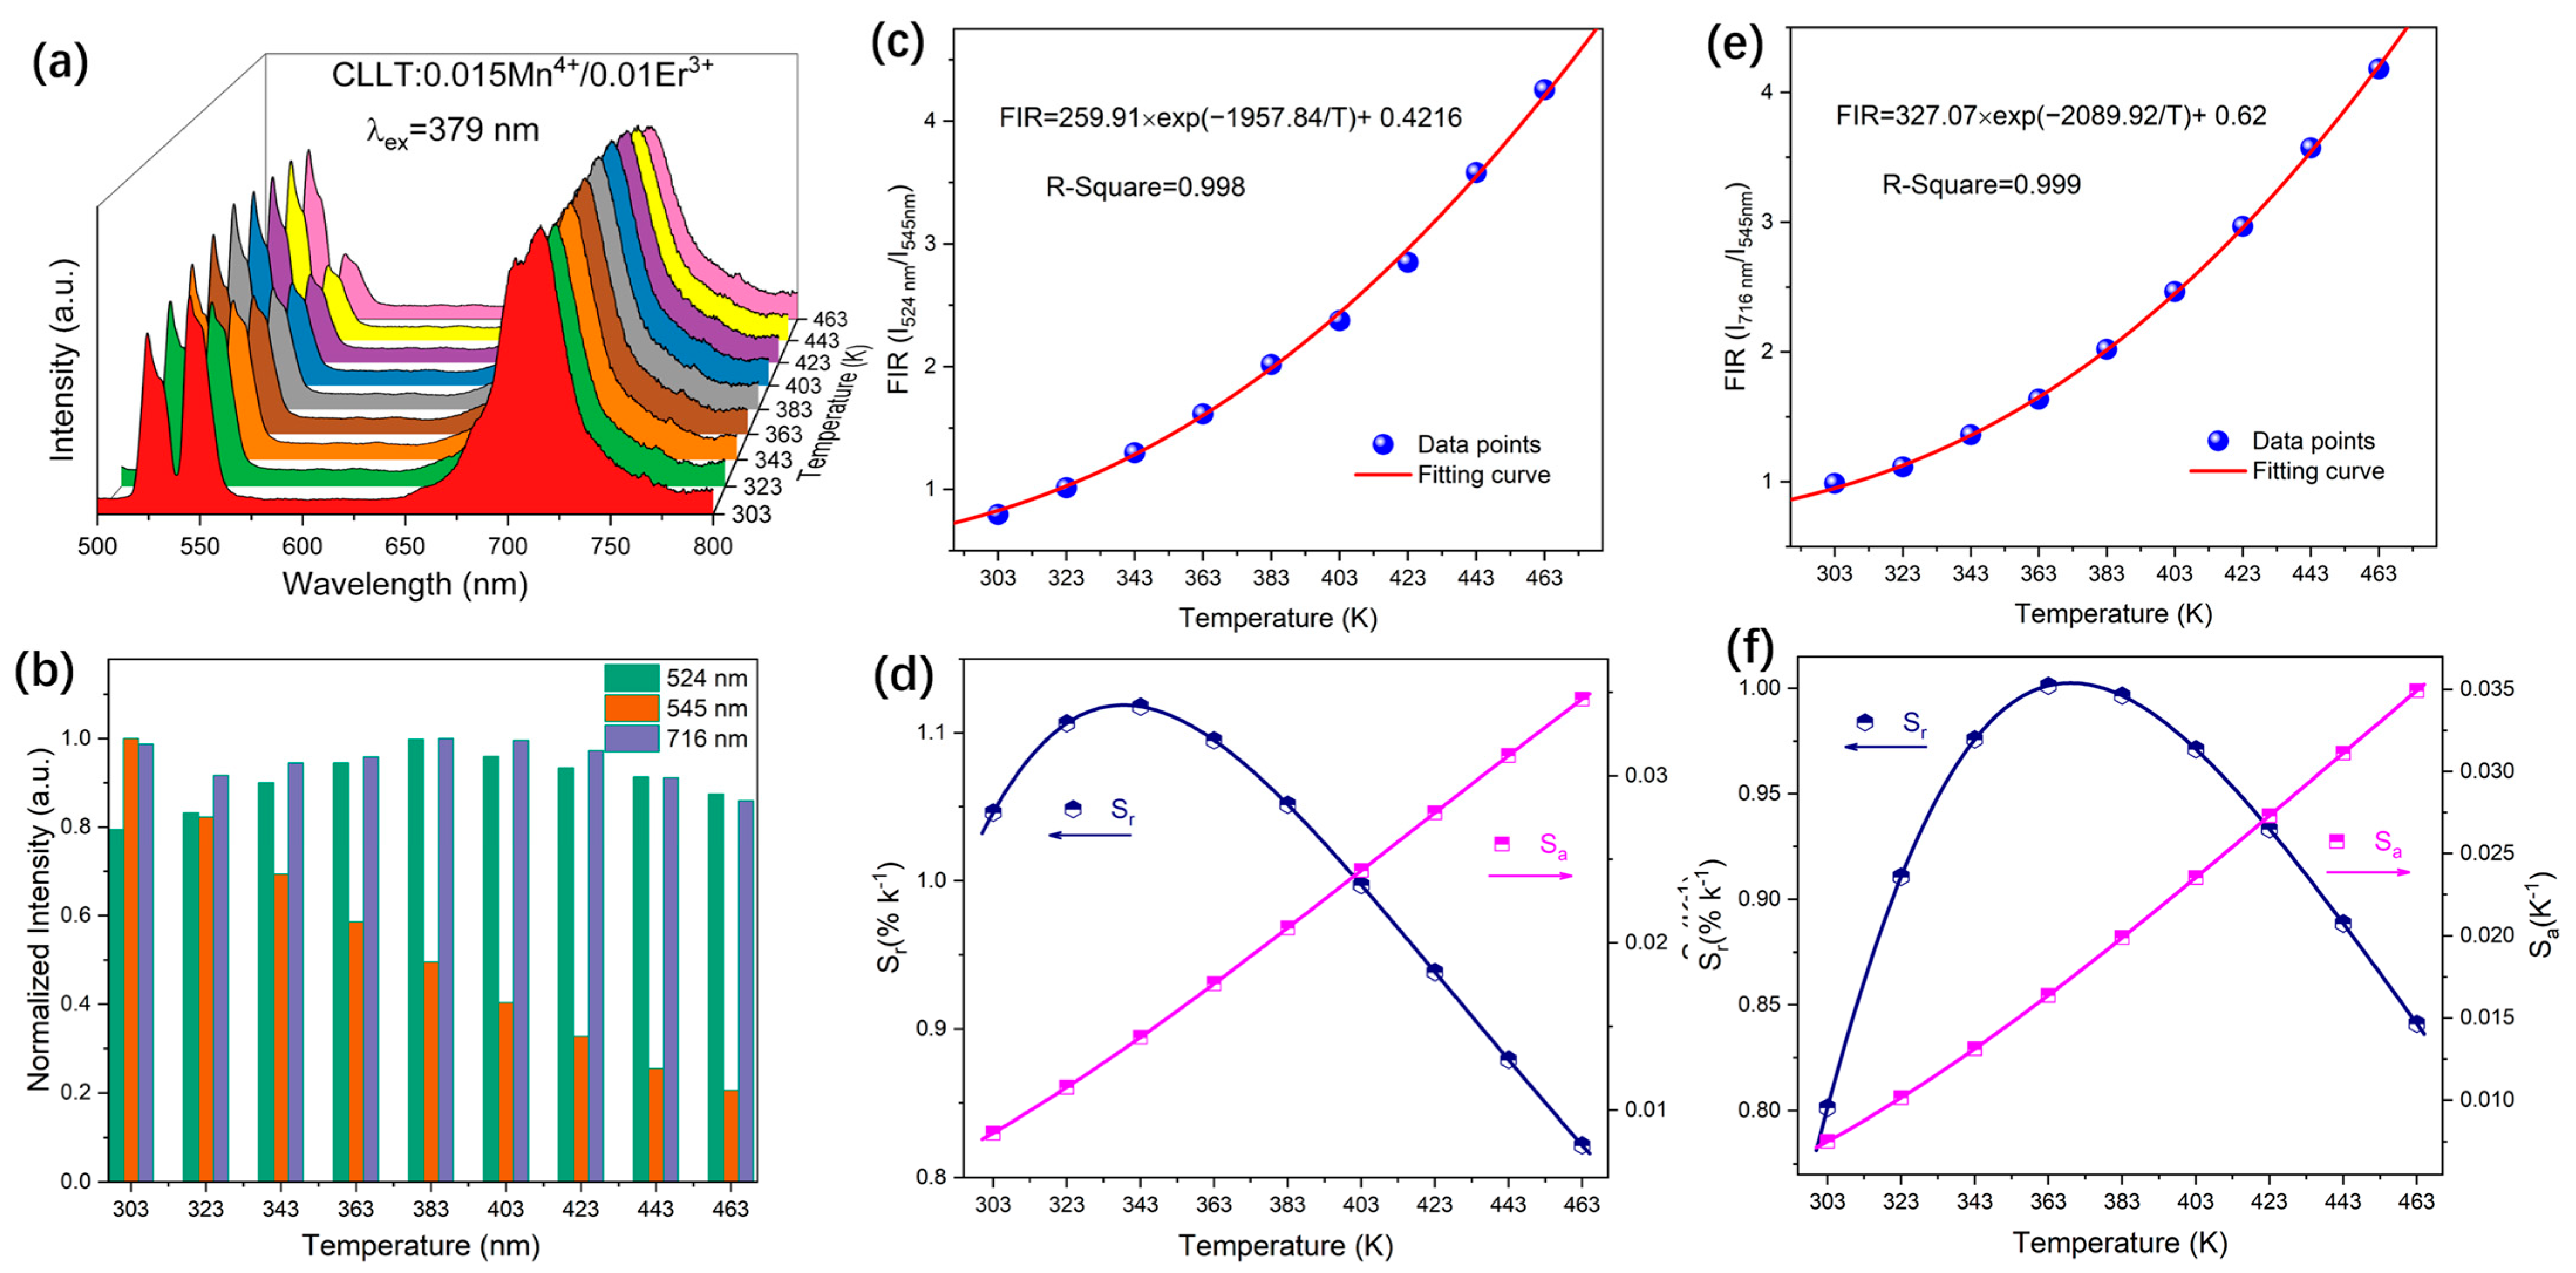
The temperature-sensitive PL spectra of CLLT:0.015Mn4+/0.01Er3+ spanning from 303 to 463 K are shown in Figure 6a. Clearly, the temperature has a substantial effect on the PL intensities of Er3+. As the temperature rises, the PL intensities of Er3+ at 545 nm exhibit a rapid decrease, while those at 524 nm demonstrate a contrasting trend. Conversely, the PL intensity of Mn4+ demonstrates minimal variation with temperature, initially decreasing gradually, then increasing, and ultimately decreasing once more. Notably, no observable peak shifts or significant changes in width occur during the temperature variation. The integral PL intensities as a function of temperature are depicted in Figure 6b.
The 2H11/2 and 4I15/2 excited states of Er3+ represent two thermally coupled energy levels, whereby the electron population is significantly affected by temperature changes. As the temperature increases, species located in the 4S3/2 state may experience transitions to the 2H11/2 state via thermal excitation. Consequently, the relative luminescence intensity of the 2H11/24I15/2 transition compared to the 4S3/24I15/2 transition depends on the complete lateral distribution of these two thermally coupled energy states [31]. The combination of electrons excited by direct means and electrons activated by thermal energy allows for emission transitions to the fundamental state 4I15/2, resulting in an escalation of intensity with increasing thermal conditions.
In addition, Figure S2 in the Supplementary Information presents the temperature-dependent PLE spectra of CLLT:0.015Mn4+/0.01Er3+ spanning from 303 to 463 K. As the temperature increases, the wide excitation bands corresponding to the 4A2g4Tg spin-allowed transition of Mn4+ exhibit a shift towards longer wavelengths, with the peak position moving from approximately 322 nm (303 K) to 328 nm (463 K). Consequently, the changes in the intensity of the band edge (379 nm) with temperature are minimal. Specifically, the intensity of the band edge (379 nm) exhibits a gradual decrease, followed by an increase and eventually a decrease, aligning with the fluctuation observed in the PL intensity of Mn4+ as depicted in Figure 6a,b.
There are two valid approaches to evaluate the FIR responsiveness of the luminescent material CLLT:0.015Mn4+/0.01Er3+ using the PL intensity ratio analysis method: (i) the ratio of green emissions from Er3+ at 524 nm and 545 nm, which arises from thermal interaction between the 2H11/2 and 4S3/2 energy levels, and (ii) the intensity ratio comparing the emissions of Mn4+ at 716 nm and Er3+ at 545 nm, which demonstrate distinct thermal behaviors.
The FIR (I524nm/I545nm) associated with the interaction of thermal energies in Er3+ can be represented by the following Equation (6) [29]:
F I R = A exp ( B T ) + C
In this equation, A, B, and C are constants. Given that FIR (I524nm/I545nm) values can be derived from experimental data across a range of temperatures, Figure 6c illustrates the relationship between FIR (I524nm/I545nm) and temperature (T). The FIR (I524nm/I545nm) values exhibit a satisfactory fit, with an R-squared value of 0.998. The determined values of A, B, and C for FIR (I524nm/I545nm) are 259.91, 1957.84, and 0.4216, respectively. These results demonstrate that temperature significantly influences the variation of the FIR (I524nm/I545nm) value. This indicates that the CLLT:0.015Mn4+/0.01Er3+ material is suitable for temperature measurement based on the dual emission FIR method.
The ratio of intensities at 524 nm and 545 nm (FIR, I524nm/I545nm) exhibits a monotonic increase with temperature. To assess the potential of FIR (I524nm/I545nm) for temperature detection, two crucial parameters, absolute sensitivity Sa and relative sensitivity Sr, were computed, as expressed in Equations (7) and (8) [31]:
S a = | F I R T |
S r = 100 % × | 1 F I R × F I R T |
The corresponding values of Sr and Sa depicted in Figure 6d demonstrate a rising trend for Sa with increasing temperature, with Sa peaking at 0.0348 K−1 at 463 K. However, Sr portrays an initial increase followed by a subsequent decrease as temperature ascends, reaching a maximum value of 1.12% K−1 at 343 K.
Calculations of the intensity ratio at 716 nm and 545 nm (FIR, I716nm/I545nm) were conducted based on the integrated PL intensities of Mn4+ (716 nm) and Er3+ (545 nm). By deriving FIR (I716nm/I545nm) values from experimental results at different temperatures (T), a relationship between FIR (I716nm/I545nm) and temperature (T) is illustrated in Figure 6e, which can be fitted using Equation (6). The fitted parameters A, B, and C are determined to be 327.07, 2089.92, and 0.62, respectively, differing from the parameters in FIR (I524nm/I545nm). To quantify the thermally induced variation of FIR (I716nm/I545nm), the Sa and Sr values of thermometers were computed using Equations (4) and (5) and are presented in Figure 6f. Observations indicate that Sr initially increases, reaching its peak value at 373 K before declining. The maximum values of Sr and Sa were recorded at 1.01% K−1 at 373 K and 0.035 K−1 at 463 K, respectively.

2.4.2. Dual Excitation SBR Method

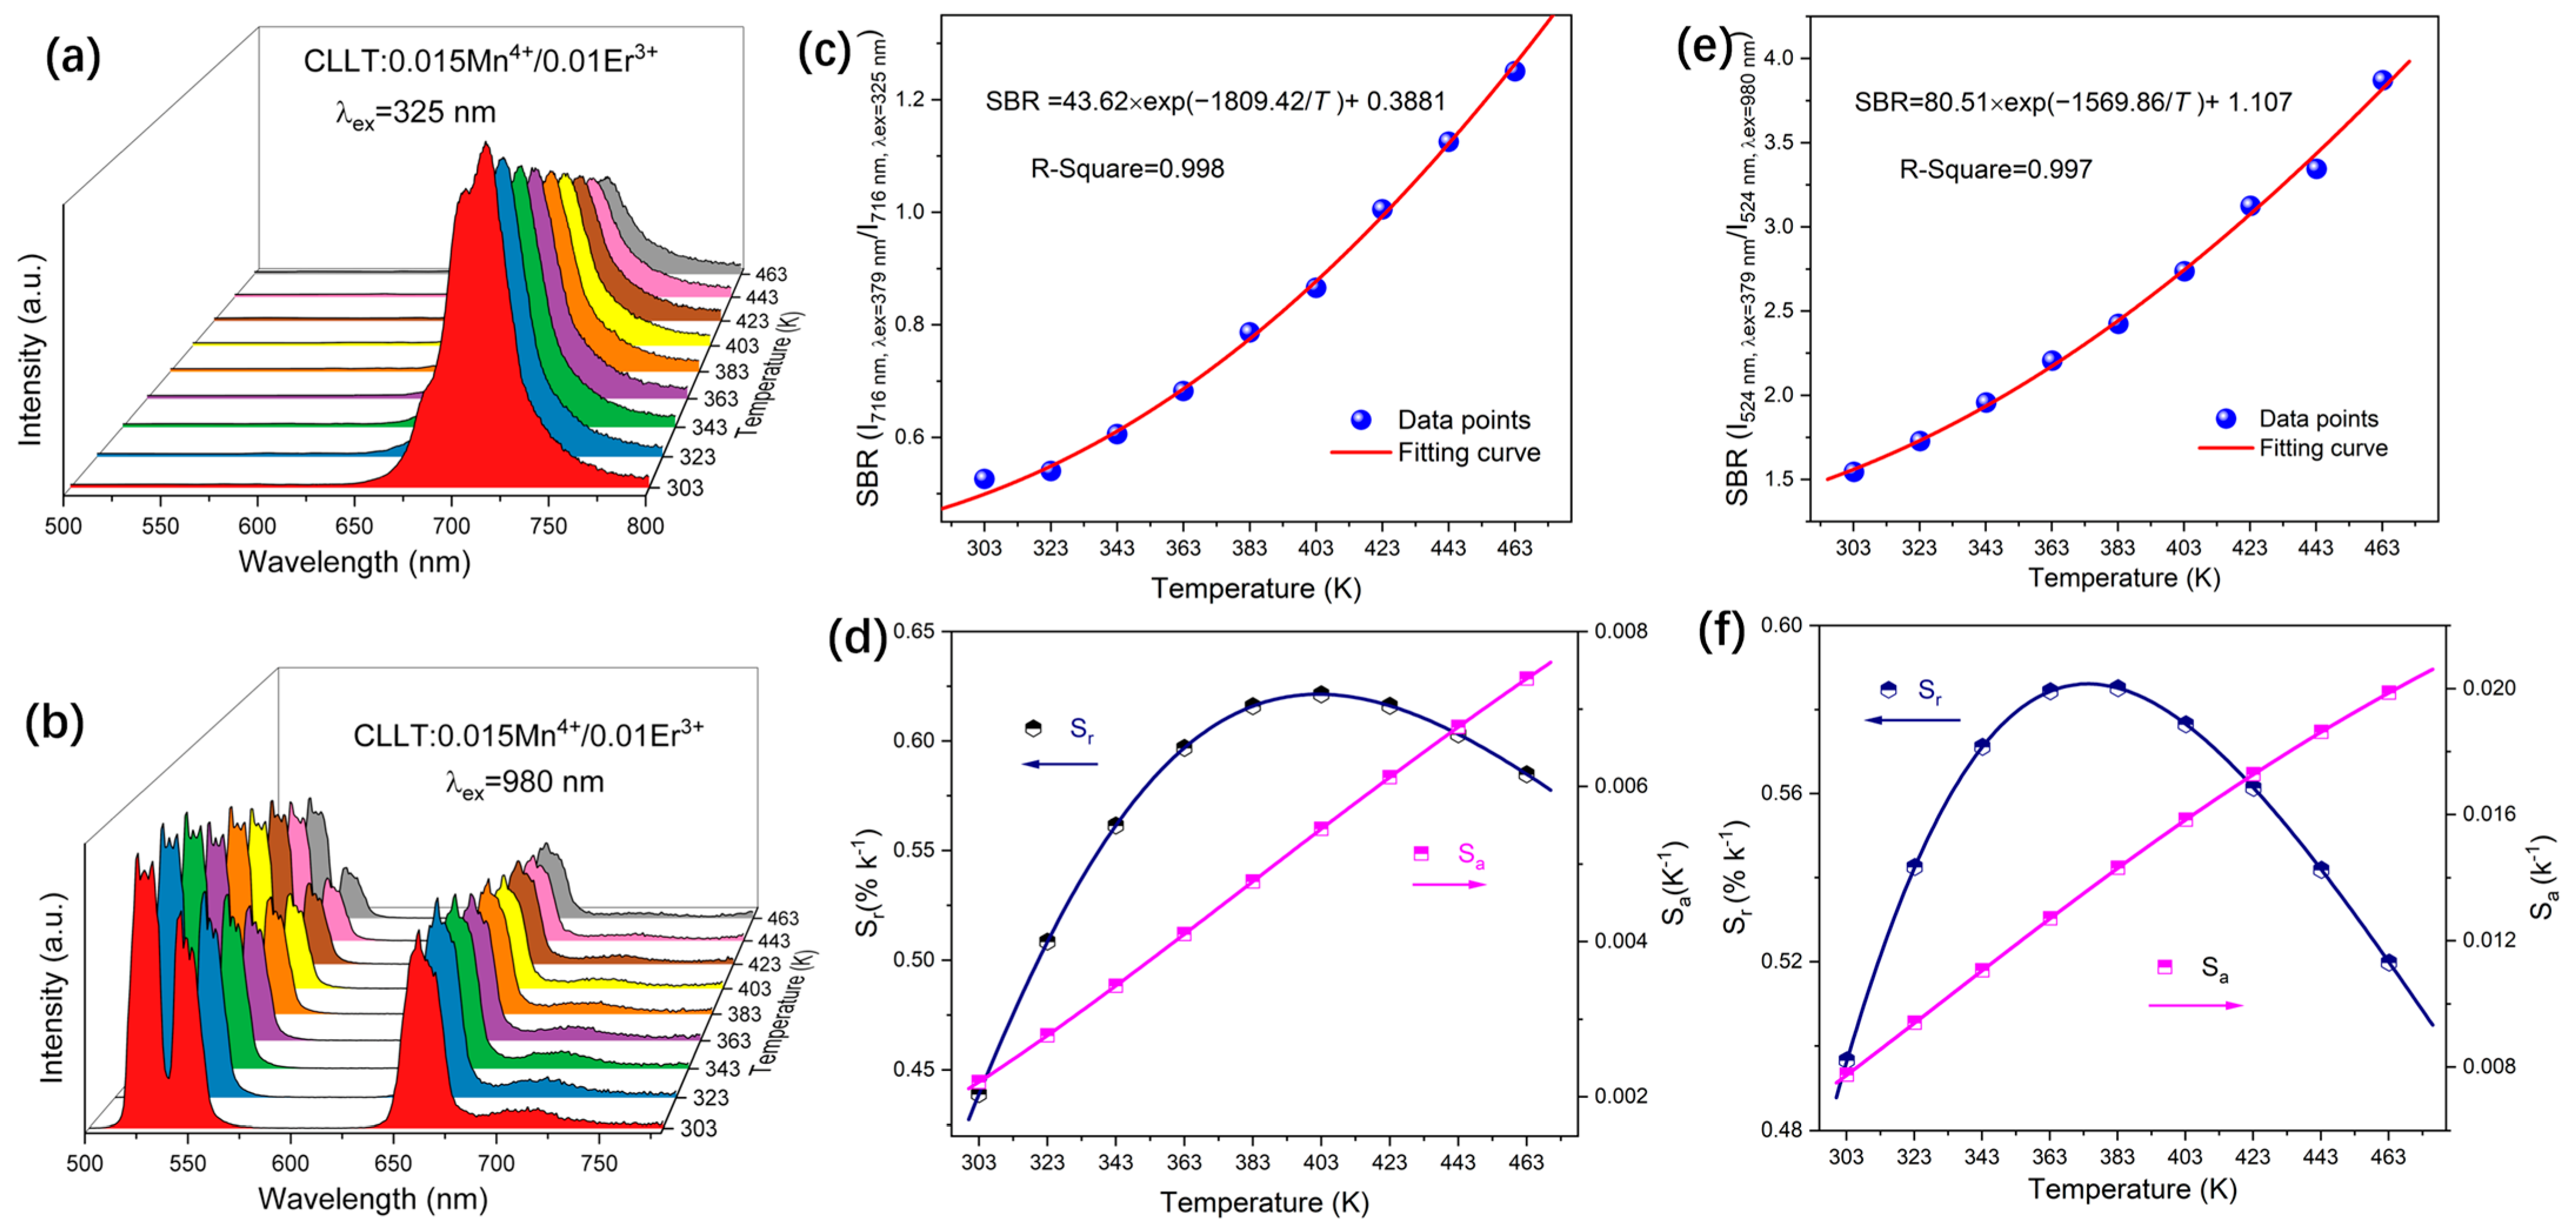
The temperature-sensitive PL of Mn4+ in CLLT:0.015Mn4+/0.01Er3+ under 325 nm irradiation is displayed in Figure 7a. The integrated PL intensity histogram for excitations at 325 nm (band center) and 379 nm (band edge) is illustrated in Figure S3. Under 325 nm excitation, the luminescence intensity exhibits a pronounced decrease with increasing temperature. Arrhenius fitting was performed for the thermal quenching of both the Mn4+ emission and the Er3+ emission. The corresponding plots for the activation energy of Er3+ and Mn4+ are included in Figure S5 of the Supplementary Information. From the linear fits, the activation energies for thermal quenching were determined to be 0.187 eV for Er3+ and 0.244 eV for Mn4+.
This thermal quenching behavior contrasts sharply with the trend observed under 379 nm excitation, highlighting its potential applicability as an SBR-based optical thermometer. The SBR (I716nm,λex=379nm/I716nm,λex=325nm) of Mn4+ can be accurately fitted using equation (6), as demonstrated in Figure 7c, with the parameters A, B, and C found to be 43.62, 1809.42, and 0.3881, respectively. The corresponding absolute sensitivity (Sa) and relative sensitivity (Sr) values, calculated using Equations (4) and (5), are depicted in Figure 7d. A maximum relative sensitivity of 0.62% K−1 was achieved at 403 K. Meanwhile, a maximum absolute sensitivity of 0.0074 K−1 was achieved at a higher temperature of 463 K.
Figure 7b shows the upconversion PL spectra of Er3+ ions in CLLT:0.015Mn4+/0.01Er3+ under 980 nm excitation at various temperatures. The temperature-dependent PL intensity trend exhibits a distinct variation compared to the downconversion emission observed under 379 nm excitation, as shown in Figure 6a, with their integrated PL intensity variations with temperature presented in Figure S4. The SBR (I524nm,λex=379nm/I716nm,λex=980nm) values and the corresponding fitting curve obtained using Equation (3) are illustrated in Figure 7e. The maximum absolute sensitivity Sa and relative sensitivity Sr reach values of 0.02 and 0.59% K−1, respectively, as shown in Figure 7f.
Based on the temperature sensing performance of the CLLT:0.015Mn4+/0.01Er3+ phosphor, the dual emission FIR method demonstrates superior relative sensitivity, achieving a maximum value of 1.12% K−1 at 343 K using the ratio of Er3+ emissions at 524 nm and 545 nm and 1.01% K−1 at 373 K using the ratio of Mn4+ emission at 716 nm to Er3+ emission at 545 nm. In comparison, the dual excitation SBR method, which relies on the intensity ratio of the same emission under different excitation wavelengths, yields maximum relative sensitivities of 0.62% K−1 at 403 K for Mn4+ emission and 0.59% K−1 for Er3+ emission. These results indicate that the FIR strategy offers higher sensitivity, making the developed phosphor highly competitive for dual-mode optical thermometry applications.
The absolute sensitivity Sa and relative sensitivity Sr values of CLLT:0.015Mn4+/0.01Er3+, derived from the dual-mode thermometry, are comparable to many reported materials. A comparative summary of these values is provided in Table 1. For temperature monitoring ranging from 303 K to 463 K, the maximum sensitivity is comparable to the best-reported values in Table 1 for temperature measurement materials doped with Mn4+ or Er3+. The results indicate that CLLT:0.015Mn4+/0.01Er3+ is a promising candidate for optical temperature measurement.

2.5. Application in Optical Anti-Counterfeiting

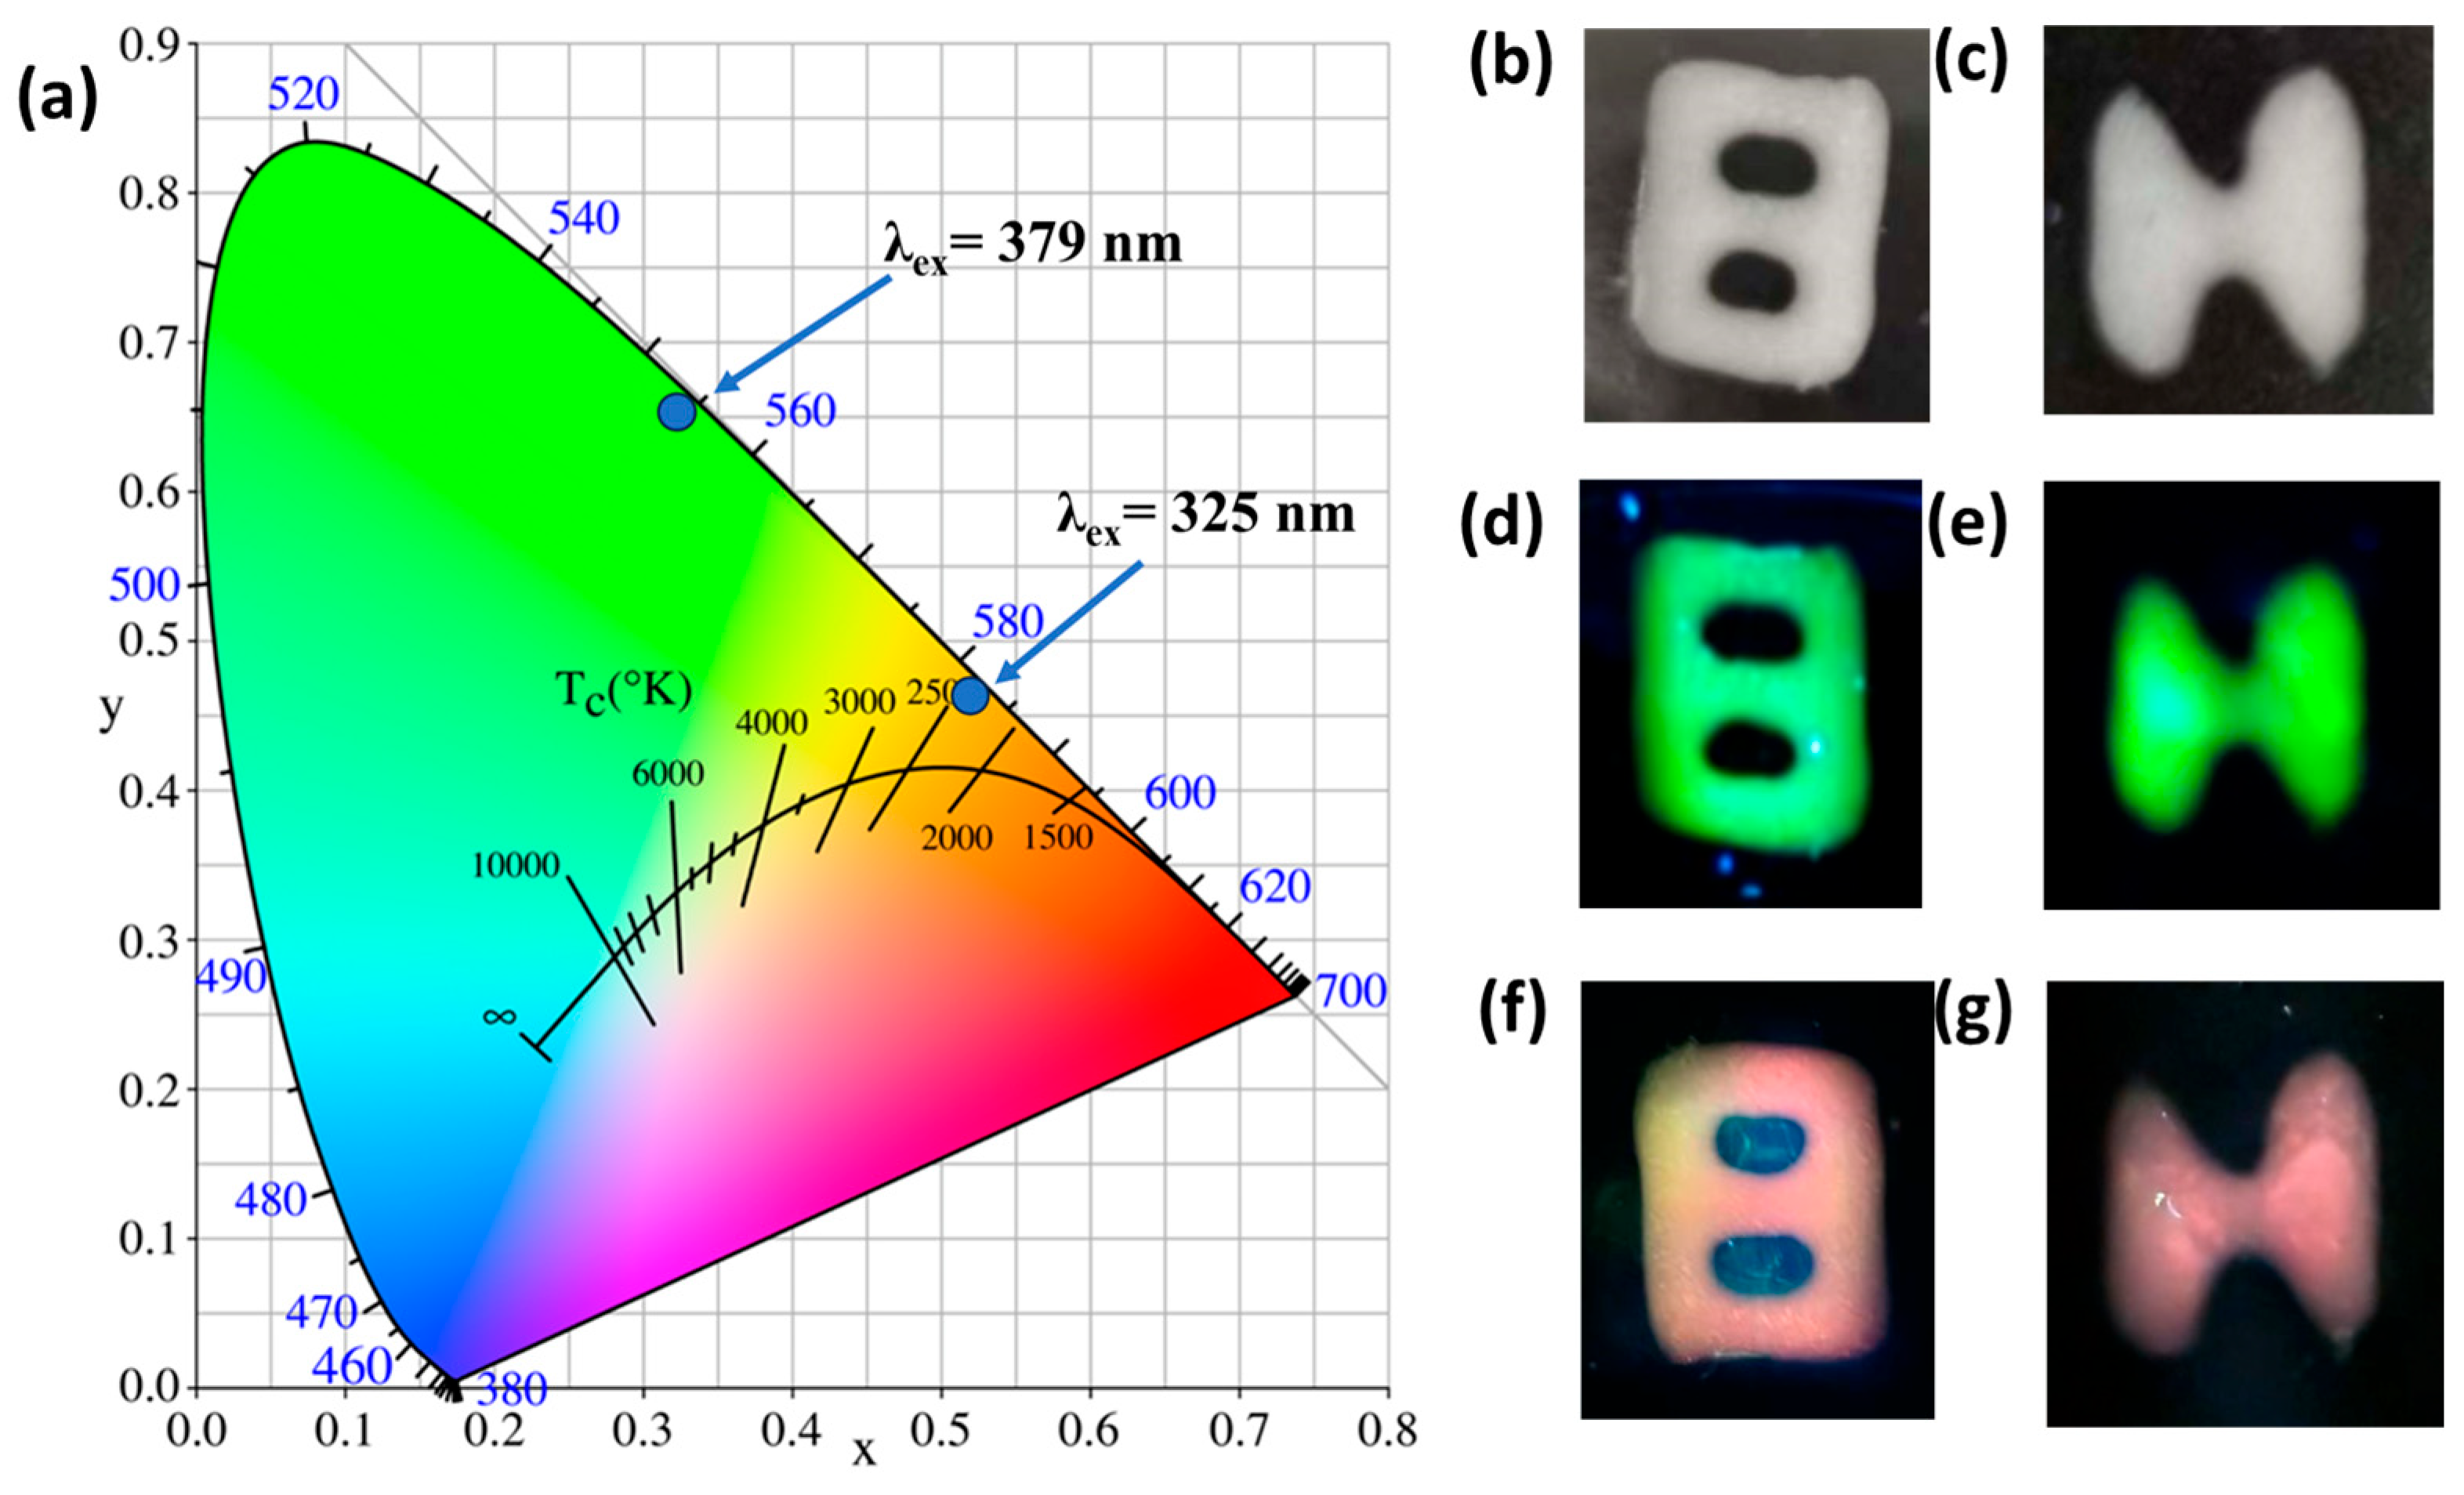
Drawing inspiration from the excitation-sensitive PL properties of CLLT:0.015Mn4+/0.01Er3+ phosphor, we conducted an investigation into its possible application in sophisticated optical anti-counterfeiting. The CIE color coordinates corresponding to the sample CLLT:0.015Mn4+/0.01Er3+ under 325 nm and 379 nm light sources are shown in Figure 8a, demonstrating emission of orange-red and bright yellow-green light. The distinct emission colors of this luminescent material allow for easy differentiation by both human observers and cameras. In Figure 8b–g, luminescence images of the letter “H” and the number “8” patterns under various excitation conditions at room temperature are displayed. Under normal lighting, the anti-counterfeiting patterns appear milky white. However, when excited by 379 nm light, the patterns emit a vibrant yellow-green luminescence. Particularly noteworthy is the shift in emission color to orange-red when excited at 325 nm, primarily attributed to Mn4+ luminescence. This outcome underscores the remarkable ability of CLLT:0.015Mn4+/0.01Er3+ phosphor to dynamically adjust its emitted color through adjustable excitation wavelengths, presenting significant benefits for anti-counterfeiting applications.
The overall merits of the CaLaLiTeO6:Mn4+/Er3+ phosphor lie in the combination of dual-mode self-calibration, multifunctionality, cost-effectiveness, and ease of synthesis. A key advantage is its capability for dual-mode self-calibration through both FIR and SBR thermometric methods within a single material, enhancing measurement reliability. Furthermore, the material exhibits excitation-dependent luminescence, enabling dynamic color switching between orange-red and yellow-green emissions, which makes it highly suitable for advanced anti-counterfeiting applications. This dual functionality serves as both a temperature sensor and a security material. Moreover, the synthesis via a conventional solid-state reaction at a moderate temperature (1050 °C) in air offers notable cost-effectiveness, scalability, and simplicity compared to methods requiring complex processes or controlled atmospheres. Thus, the CaLaLiTeO6:Mn4+/Er3+ phosphor presents a compelling and practical alternative for applications where a balance among performance, stability, ease of fabrication, and cost is essential.

3. Experimental Section

3.1. Synthetic Method

The CLLT:Mn4+/Er3+ materials were synthesized via a high-temperature solid-state reaction. The initial reactants, sourced from Aladdin, included Li2CO3 (99.9%), CaCO3 (99.9%), La2O3 (99.9%), TeO2 (99.9%), MnO2 (99.9%), and Er2O3 (99.9%), which were measured based on their respective stoichiometric proportions. The doping concentrations for Mn or Er (e.g., ‘x’ in CLLT:xEr3+) are expressed in mol%, representing the molar percentage of Er3+ ions intended to substitute for the combined (Ca2+ + La3+) cations on their shared crystallographic site. Subsequently, these substances were finely milled and blended in an agate mortar for 30 min, after which they were transferred to a crucible for preliminary sintering at 600 °C for 6 h in ambient air. Following preliminary sintering, the substances were pulverized once more before undergoing sintering at 1050 °C for 12 h in an air environment. After reaching room temperature, the substances were pulverized for further analyses. For the preparation of anti-counterfeiting materials, a composite of polydimethylsiloxane (PDMS) and CLLT:Mn4+/Er3+ phosphors was utilized. The luminescent material and resin mixture (with a PDMS-to-curing-agent ratio of 10:1) were weighed in a mass ratio of 1:2, mixed, and stirred magnetically for 20 min to achieve a uniform consistency. Anti-counterfeiting patterns resembling the characters “H” and “8” were then painted onto a glass substrate. The substrate was placed in an oven and maintained at 80 °C for 2 h to complete the formation of the anti-counterfeiting label.

3.2. Characterization

X-Ray powder diffraction patterns were acquired utilizing a Rigaku Miniflex600 X-Ray diffractometer (Rigaku, Tokyo, Japan), which was outfitted with Cu Kα radiation (λ = 0.15406 nm). The morphological features and elemental mapping of the materials were examined using a Sigma 300 field emission SEM (Zeiss, Oberkochen, Germany). Diffuse reflectance (DR) spectra were obtained at ambient temperature using a UV–visible spectrophotometer (UV3600 PLUS, Shimadzu, Kyoto, Japan). The excitation and emission spectra were evaluated using a fluorescence spectrophotometer (model F-4600, Hitachi, Tokyo, Japan), which was furnished with a 150 W Xenon lamp as the light source for excitation.

3.3. Density Functional Theory Calculations

All DFT calculations were carried out using the Vienna Ab initio Simulation Package (VASP 5.4.4) [43]. In these calculations, the Perdew–Burke–Ernzerhof (PBE) generalized gradient approximation (GGA) was employed to handle the exchange-correlation functional [44]. The electron–ion interactions were treated with the projector-augmented-wave (PAW) pseudopotentials, with the following valence electron configurations considered: Ca (3s2 3p6 4s2), La (5s2 5p6 5d1 6s2), Li (2s1), Te (5s2 5p4), and O (2s2 2p4). The calculations employed a plane-wave cutoff energy of 520 eV and a Γ-centered Monkhorst–Pack k-point grid of 7 × 6 × 4. The convergence criteria were set to 1 × 10⁻⁶ eV for the electronic energy and 0.02 eV/Å for the Hellmann–Feynman forces during geometry relaxation.

4. Conclusions

In summary, the dual-function material CLLT:Mn4+/Er3+ phosphors, intended for optical temperature measurement and multicolored anti-counterfeiting applications, were effectively produced through a conventional high-temperature solid-state process. XRD and Rietveld analysis confirmed the high quality of the crystal phase, with no detectable impurities. The optimal composition was determined to be CLLT:0.015Mn4+/0.01Er3+, which exhibits bright emissions in the far red, yellow-green, and green regions when excited by 379 nm light. The luminescence intensity of Mn4+ and Er3+ ions demonstrates significantly different trends as temperature increases. For temperature monitoring ranging from 303 K to 463 K, the dual emission FIR method based on the Er3+ emissions (I524ₙₘ/I545ₙₘ) achieved a maximum relative sensitivity (Sᵣ) of 1.12% K−1 at 343 K and a maximum absolute sensitivity (Sₐ) of 0.0348 K−1 at 463 K. In comparison, the dual excitation SBR method yielded a maximum Sᵣ of 0.62% K−1 at 403 K and a maximum Sₐ of 0.0074 K−1 at 463 K. Furthermore, the variation in PL color with excitation wavelength enhances the appropriateness of CLLT:0.015Mn4+/0.01Er3+ for optical anti-counterfeiting applications. This study introduces an approach for developing versatile materials that combine optical detection capabilities and anti-counterfeiting attributes, thereby opening up possibilities for their potential use in biomedical research, intelligent packaging, and industrial applications.

Supplementary Materials

The following supporting information can be downloaded at: https://www.mdpi.com/article/10.3390/inorganics13090308/s1, Table S1: The refined atomic parameters of CLLT:0.015Mn4+/0.01Er3+; Table S2: Elemental composition obtained by EDX analysis; Figure S1: The XPS of CaLaLiTeO6:0.015Mn4+/0.01Er3+ global spectra; (b) O 1s fitting spectrum, O1 stands for oxygen vacancy, and O2 is lattice oxygen; Figure S2: The PLE spectra of CLLT:0.015Mn4+/0.01Er3+ at different temperatures from 303 to 463 K, monitoring emissions at 716 nm; Figure S3: The integrated PL intensity histogram of Mn4+ in CLLT:0.015Mn4+/0.01Er3+ under 325 nm (excitation band center) and 379 nm (excitation band edge) excitations; Figure S4: The integrated PL intensity variations with temperature of Er3+ ions in CLLT:0.015Mn4+/0.01Er3+ under 980 nm and 379 nm excitation; Figure S5: The relationship between ln(I0/I-1) and 1/(kT).

Author Contributions

Synthetic work was performed by Z.-R.X. and R.-Q.L. with input from W.-W.Z. and M.-J.S.; crystalline structure and morphology studies were performed by F.-F.L. and Q.-H.Z.; diffuse reflection spectra and electronic band structure studies were carried out by Y.T. and Z.-Y.P.; initial drafting of this manuscript was conducted by Z.-R.X. with input from W.Z.; this manuscript was finally revised jointly by W.-W.Z. and M.-J.S. All authors have read and agreed to the published version of the manuscript.

Funding

This research was supported by the Project of Anhui Provincial Innovation Team for Experimental Teaching in Physics (2023cxtd101 and 2023zybj047); Natural Science Foundation for Distinguished Young Scholars of Anhui Province (2022AH020087); Weifang Science and Technology Development (2025ZJ1114); Natural Science Foundation of Anhui Province (2108085MB53); Research Program of Huainan Normal University (2025XJZD009 and 2024XJZD015).

Institutional Review Board Statement

Not applicable.

Informed Consent Statement

Not applicable.

Data Availability Statement

The original contributions presented in this study are included in the article/Supplementary Materials. Further inquiries can be directed to the corresponding authors.

Conflicts of Interest

The authors declare no conflicts of interest. The funders had no role in the design of this study; in the collection, analyses, or interpretation of data; in the writing of this manuscript; or in the decision to publish the results.

References

  1. Zhang, S.-L.; Zhao, D.; Zhang, R.-J.; Yao, Q.-X.; Jia, L.; Zong, Q. A New Luminescent Material LaTiSbO6:Mn4+/Er3+ with High Optical Temperature Sensing Sensitivity Based on Fluorescence Intensity Ratio. J. Mater. Chem. C 2025, 13, 7741–7749. [Google Scholar] [CrossRef]
  2. Pu, L.; Li, P.; Zhao, J.; Wang, Y.; Guo, D.; Li, L.; Wang, Z.; Suo, H. Eu3+-Activated Single-Band Ratiometric Nanothermometry by Lattice Negative Thermal Expansion. Laser Photonics Rev. 2023, 17, 2200884. [Google Scholar] [CrossRef]
  3. Xing, J.; Luo, F.; Qin, Y.; Chen, X.; Liang, Y.; Gao, Z.; Shang, F.; Xu, H.; Chen, G. Multi-Ratio Optical Thermometry and Energy Storage Characteristics of Yb3+/Er3+/Tm3+ Doped BaNb2O6 Transparent Glass-Ceramics. J. Mater. Sci. Technol. 2023, 138, 138–148. [Google Scholar] [CrossRef]
  4. Tcelykh, L.; Latipov, E.; Lepnev, L.; Anosov, A.; Kozhevnikova, V.; Kuzmina, N.; Utochnikova, V.V. Highly Sensitive and Highly Emissive Luminescent Thermometers for Elevated Temperatures Based on Lanthanide-Doped Polymers. Inorganics 2023, 11, 189. [Google Scholar] [CrossRef]
  5. Periša, J.; Milićević, B.; Ćirić, A.; Zeković, I.; Đorđević, V.; Antić, Ž.; Dramićanin, M.D. Advancing Luminescence Thermometry: Employing Multiple Fluorescence Intensity Ratios of YAG:Er3+/Mn4+ Nanocrystals for Supersensitive Temperature Sensing. Ceram. Int. 2025, 51, 23224–23232. [Google Scholar] [CrossRef]
  6. Liu, J.; Xin, Y.; Qu, S.; Yang, C.; Song, J.; Li, W.; Guo, N. Design of Dual-Mode Optical Thermometry Based on Thermally Activated Efficient Energy Transfer in LaNbO4/Ln3+ (Eu3+/Sm3+/Pr3+) Phosphors. ACS Appl. Mater. Interfaces 2024, 16, 57421–57427. [Google Scholar] [CrossRef] [PubMed]
  7. Anu; Seema; Kumari, S.; Rohilla, P.; Barik, S.; Ruchi, K.; Kumar, K.; Rao, A.S.; Prasad, A. Comprehensive Luminescence Analysis of YTaO4:Er3+/Yb3+/Tm3+ Co-Doped Phosphor for Optical Thermometry and Color Tunable Device Applications. J. Alloys Compd. 2025, 1023, 180108. [Google Scholar] [CrossRef]
  8. Fu, M.; Fan, Z.; Qiao, P.; Hu, L.; Liu, S.; Deng, D.; Xu, S.; Ma, H. Dual-Mode Optical Thermometers via the Thermochromic Bi3+, Eu3+ Co-Doped La2LiSbO6 Phosphors for Real-Time Chip Temperature Monitoring. Ceram. Int. 2024, 50, 26454–26463. [Google Scholar] [CrossRef]
  9. Huang, W.; Li, Z.; Yang, N.; Ye, Z.; Cao, R.; Shi, J.; Wang, J. A Four-Mode Optical Thermometer Designed in Double Perovskite Ca2GdNbO6:Bi3+,Eu3+. J. Alloys Compd. 2024, 1002, 175220. [Google Scholar] [CrossRef]
  10. Yan, B.; Wei, Y.; Wang, W.; Fu, M.; Li, G. Red-Tunable LuAG Garnet Phosphors via Eu3+ → Mn4+ Energy Transfer for Optical Thermometry Sensor Application. Inorg. Chem. Front. 2021, 8, 746–757. [Google Scholar] [CrossRef]
  11. Fang, Y.; Zhang, Y.; Zhang, Y.; Hu, J. Achieving High Thermal Sensitivity from Ratiometric CaGdAlO4:Mn4+,Tb3+ Thermometers. Dalton Trans. 2021, 50, 13447–13458. [Google Scholar] [CrossRef]
  12. Trejgis, K.; Bednarkiewicz, A.; Marciniak, L. Engineering Excited State Absorption Based Nanothermometry for Temperature Sensing and Imaging. Nanoscale 2020, 12, 4667–4675. [Google Scholar] [CrossRef]
  13. Tian, X.; Yang, L.; Wen, J.; Ji, C.; Huang, Z.; Zhu, L.; Luo, F.; Zhong, H.; Peng, H.; Lin, H.-T. Energy Transfer and a Novel SBR Thermometry of SrY2O4:Sm3+/Eu3+ Phosphor Based on Redshift of Charge Transfer Band Edge. Ceram. Int. 2024, 50, 36849–36863. [Google Scholar] [CrossRef]
  14. Pankratov, V.; Popov, A.I.; Chernov, S.A.; Zharkouskaya, A.; Feldmann, C. Mechanism for Energy Transfer Processes between Ce3+ and Tb3+ in LaPO4:Ce,Tb Nanocrystals by Time-Resolved Luminescence Spectroscopy. Phys. Status Solidi B 2010, 247, 2252–2257. [Google Scholar] [CrossRef]
  15. Piotrowski, W.; Dalipi, L.; Szukiewicz, R.; Fond, B.; Dramicanin, M.; Marciniak, L. The Role of Cr3+ and Cr4+ in Emission Brightness Enhancement and Sensitivity Improvement of NIR-Emitting Nd3+/Er3+ Ratiometric Luminescent Thermometers. J. Mater. Chem. C 2021, 9, 12671–12680. [Google Scholar] [CrossRef]
  16. Su, S.; Hu, C.; Ding, S.; Sun, Y.; Sun, L.; Zou, Y.; Liu, R.; Lei, Z.; Teng, B.; Zhong, D. Achieving Broadband NIR Emission in Fe3+-activated ALaBB′O6 (a = Ba, Sr, ca; B–B′ = Li–Te, Mg–Sb) Phosphors via Multi-site Ionic Co-substitutions. Adv. Opt. Mater. 2024, 12, 2302383. [Google Scholar] [CrossRef]
  17. Su, S.; Sun, Y.; Liu, G.; Gong, K.; Wang, M.; Ding, S.; Dong, H.; Wang, W.; Teng, B.; Hu, C. CaLaLiTeO6:Mn4+, Tm3+ Phosphors with Multiband near-Infrared Emission towards Multifunctional Applications. J. Lumin. 2024, 267, 120394. [Google Scholar] [CrossRef]
  18. Zhu, J.; Yang, T.; Li, H.; Xiang, Y.; Song, R.; Zhang, H.; Wang, B. Improving the up/down-Conversion Luminescence via Cationic Substitution and Dual-Functional Temperature Sensing Properties of Er3+ Doped Double Perovskites. Chem. Eng. J. 2023, 471, 144550. [Google Scholar] [CrossRef]
  19. Zhu, J.; Yang, T.; Li, H.; Xiang, Y.; Song, R.; Zhang, H. Cationic Composition Engineering in Double Perovskite XLaLiTeO6:Eu3+ (X = Ba, Sr, ca, and Mg) toward Efficient and Thermally Stable Red Luminescence for Domestic White-LEDs. J. Mater. Chem. C 2023, 11, 11017–11026. [Google Scholar] [CrossRef]
  20. Dong, H.; Lei, Z.; Su, S.; Yang, W.; Zhang, X.; Teng, W.; Zu, G.; Teng, B.; Zhong, D. Achieving High-Sensitivity Dual-Mode Optical Thermometry via Phonon-Assisted Cross-Relaxation in a Double-Perovskite Structured up-Conversion Phosphor. Inorg. Chem. Front. 2024, 11, 2784–2797. [Google Scholar] [CrossRef]
  21. Su, S.; Ma, J.; Hu, C.; Zhao, J.; Liu, R.; Dong, H.; Sun, L.; Zou, Y.; Lei, Z.; Teng, B.; et al. An Efficient Double-Perovskite CaLaLiTeO6:Mn4+ Far-Red Phosphor towards Indoor Plant Lighting Application. J. Alloys Compd. 2023, 946, 169436. [Google Scholar] [CrossRef]
  22. Li, H.; Haider, A.A.; Xie, Z.; Liu, C.; Zhang, H.; Jiang, H.; Li, J.; Zhu, J. Synergetic Contributions of High Quenching Concentration and Tuned Square Antiprism Geometry Boosting Far-Red Emission of Eu3+ with Near-Unit Efficiency. Adv. Sci. 2025, 12, e2415989. [Google Scholar] [CrossRef] [PubMed]
  23. Brik, M.G.; Srivastava, A.M.; Popov, A.I. A Few Common Misconceptions in the Interpretation of Experimental Spectroscopic Data. Opt. Mater. 2022, 127, 112276. [Google Scholar] [CrossRef]
  24. Borlido, P.; Schmidt, J.; Huran, A.W.; Tran, F.; Marques, M.A.L.; Botti, S. Exchange-Correlation Functionals for Band Gaps of Solids: Benchmark, Reparametrization and Machine Learning. Npj Comput. Mater. 2020, 6, 96. [Google Scholar] [CrossRef]
  25. Liao, J.; Wang, M.; Han, Z.; Huang, J.; Gong, G.; Fu, J.; Wen, H. Luminescence Properties and Energy Transfer Mechanism of La2ZnTiO6:Mn4+/Er3+ Far-Red/Green Dual-Emitting Phosphors for Plant Lighting. J. Solid State Chem. 2021, 303, 122470. [Google Scholar] [CrossRef]
  26. Li, L.; Tong, J.; Sun, F.; Hong, F.; Yu, D.; Chen, Z.; Hao, H.; Lin, H. Controllable Morphology, Excellent Stability and Non-Equivalent Doping-Induced Optical Properties of Mn4+-Activated K2NaScF6 Red Phosphor for High-Quality Warm WLED. J. Lumin. 2024, 275, 120808. [Google Scholar] [CrossRef]
  27. Cao, R.; Hu, X.; Nie, J.; Lan, B.; Wang, J.; Chen, T.; Chen, Y.; Wang, J. LaBaMg(Ti0.5W0.5)O6:Mn4+ for Plant Growth Lighting: Luminescence Properties and Synthesis. J. Mol. Struct. 2024, 1318, 139405. [Google Scholar] [CrossRef]
  28. Xia, Z.-R.; Li, R.-Q.; Zheng, Q.-H.; Liu, F.-F.; Zhou, W.-W.; Yuan, K.-X.; Tong, Y.; Zhao, W. Optical Thermometry and Fingerprint Detection in SrLa1−x Eux LiTeO6 Phosphors with Abnormal Thermal Quenching Effect. AIP Adv. 2025, 15, 035021. [Google Scholar] [CrossRef]
  29. Zhang, Y.; Guo, N.; Shao, B.; Li, J.; Ouyang, R.; Miao, Y. Photoluminescence and Optical Temperature Measurement of Mn4+/Er3+ Co-Activated Double Perovskite Phosphor through Site-Advantageous Occupation. Spectrochim. Acta A Mol. Biomol. Spectrosc. 2021, 259, 119797. [Google Scholar] [CrossRef]
  30. Song, R.; Yan, S.; Duan, S.; Yang, X.; Balfour, E.A.; Fu, H. Enhancing Upconversion Luminescence via Intermediate State in Double Perovskite Phosphor: Three-Mode Optical Thermometry with Python-Assisted Validation. Inorg. Chem. Front. 2025, 12, 4691–4702. [Google Scholar] [CrossRef]
  31. Qi, C.-Y.; Zhao, D.; Zhang, R.-J.; Jia, L.; Zong, Q. Cationic Substitution for Enhancing the Temperature Sensing Sensitivity of Mn4+/Er3+ Co-Doped Double Perovskite. Ceram. Int. 2025, 51, 10316–10324. [Google Scholar] [CrossRef]
  32. Wang, M.; Ding, S.; Zhang, C.; Ren, H.; Zou, Y.; Tang, X.; Zhang, Q. Pure-Green Upconversion Emission and High-Sensitivity Optical Thermometry of Er3+-Doped Stoichiometric NaYb(MoO4)2. Ceram. Int. 2023, 49, 37661–37669. [Google Scholar] [CrossRef]
  33. Liu, H.; Jian, X.; Liu, M.; Wang, K.; Bai, G.; Zhang, Y. Investigation on the Upconversion Luminescence and Ratiometric Thermal Sensing of SrWO4:Yb3+/RE3+ (RE = Ho/Er) Phosphors. RSC Adv. 2021, 11, 36689–36697. [Google Scholar] [CrossRef]
  34. Liu, Z.; Chen, D. Color Tunable Upconversion Luminescence and Optical Thermometry Properties of Mixed Gd2O3:Yb3+/Ho3+/Er3+ Nanoparticles Prepared via Laser Ablation in Liquid. J. Mater. Sci. Mater. Electron. 2020, 31, 9321–9327. [Google Scholar] [CrossRef]
  35. Liu, L.; Liu, H.; Zou, W.; Ding, S. Er3+ Doping YbTaO4 Phosphors: Upconversion Luminescence and Temperature Sensing Characteristics. Ceram. Int. 2023, 49, 28500–28505. [Google Scholar] [CrossRef]
  36. Kshetri, Y.K.; Kamiyama, T.; Torii, S.; Jeong, S.H.; Kim, T.-H.; Choi, H.; Zhou, J.; Feng, Y.P.; Lee, S.W. Electronic Structure, Thermodynamic Stability and High-Temperature Sensing Properties of Er-α-SiAlON Ceramics. Sci. Rep. 2020, 10, 4952. [Google Scholar] [CrossRef] [PubMed]
  37. Xie, T.; Lei, R.; Wang, J.; Huang, F.; Zhao, S.; Li, B.; Xu, S. Multi-Functionalities of Photoluminescence, X-Ray Excited Luminescence and Optical Temperature Sensing in Er3+ and Er3+/Yb3+ Doped Gd2Zr2O7 Phosphors. J. Alloys Compd. 2022, 905, 164226. [Google Scholar] [CrossRef]
  38. Xiao, Q.; Yin, X.; Wu, X.; Fan, Y.; Lv, L.; Dong, X.; Zhou, N.; Liu, K.; Luo, X. High-Sensitive Thermometry and Tunable Dual-Color Luminescence Based on Effective Energy Transfer Pathways of Er, Tm System. J. Lumin. 2022, 250, 119057. [Google Scholar] [CrossRef]
  39. Wu, Z.; Li, L.; Lv, X.; Suo, H.; Cai, C.; Lv, P.; Ma, M.; Shi, X.; Yang, Y.; Marciniak, L.; et al. Persistent Luminescence Ratiometric Thermometry. Chem. Eng. J. 2022, 438, 135573. [Google Scholar] [CrossRef]
  40. Zhou, R.; Zhao, X.; Pun, E.Y.B.; Lin, H. Temperature Sensitivity Based on Er3+ Fluorescence Fluctuation in Gd2Ti2O7:Er3+-Yb3+ Porous Nanofibers. J. Alloys Compd. 2020, 838, 155554. [Google Scholar] [CrossRef]
  41. Zhou, H.; Guo, N.; Zhu, M.; Li, J.; Miao, Y.; Shao, B. Photoluminescence and Ratiometric Optical Thermometry in Mn4+/Eu3+ Dual-Doped Phosphor via Site-Favorable Occupation. J. Lumin. 2020, 224, 117311. [Google Scholar] [CrossRef]
  42. Zheng, T.; Zhou, L.; Qiu, X.; Yang, D.; Runowski, M.; Lis, S.; Du, P.; Luo, L. Er3+, Yb3+ Co-Doped Sr3(PO4)2 Phosphors: A Ratiometric Luminescence Thermometer Based on Stark Levels with Tunable Sensitivity. J. Lumin. 2020, 227, 117517. [Google Scholar] [CrossRef]
  43. Kresse, G.; Hafner, J. Ab Initio Molecular Dynamics for Liquid Metals. Phys. Rev. B 1993, 47, 558–561. [Google Scholar] [CrossRef] [PubMed]
  44. Perdew, J.P.; Burke, K.; Ernzerhof, M. Generalized Gradient Approximation Made Simple. Phys. Rev. Lett. 1996, 77, 3865–3868. [Google Scholar] [CrossRef] [PubMed]
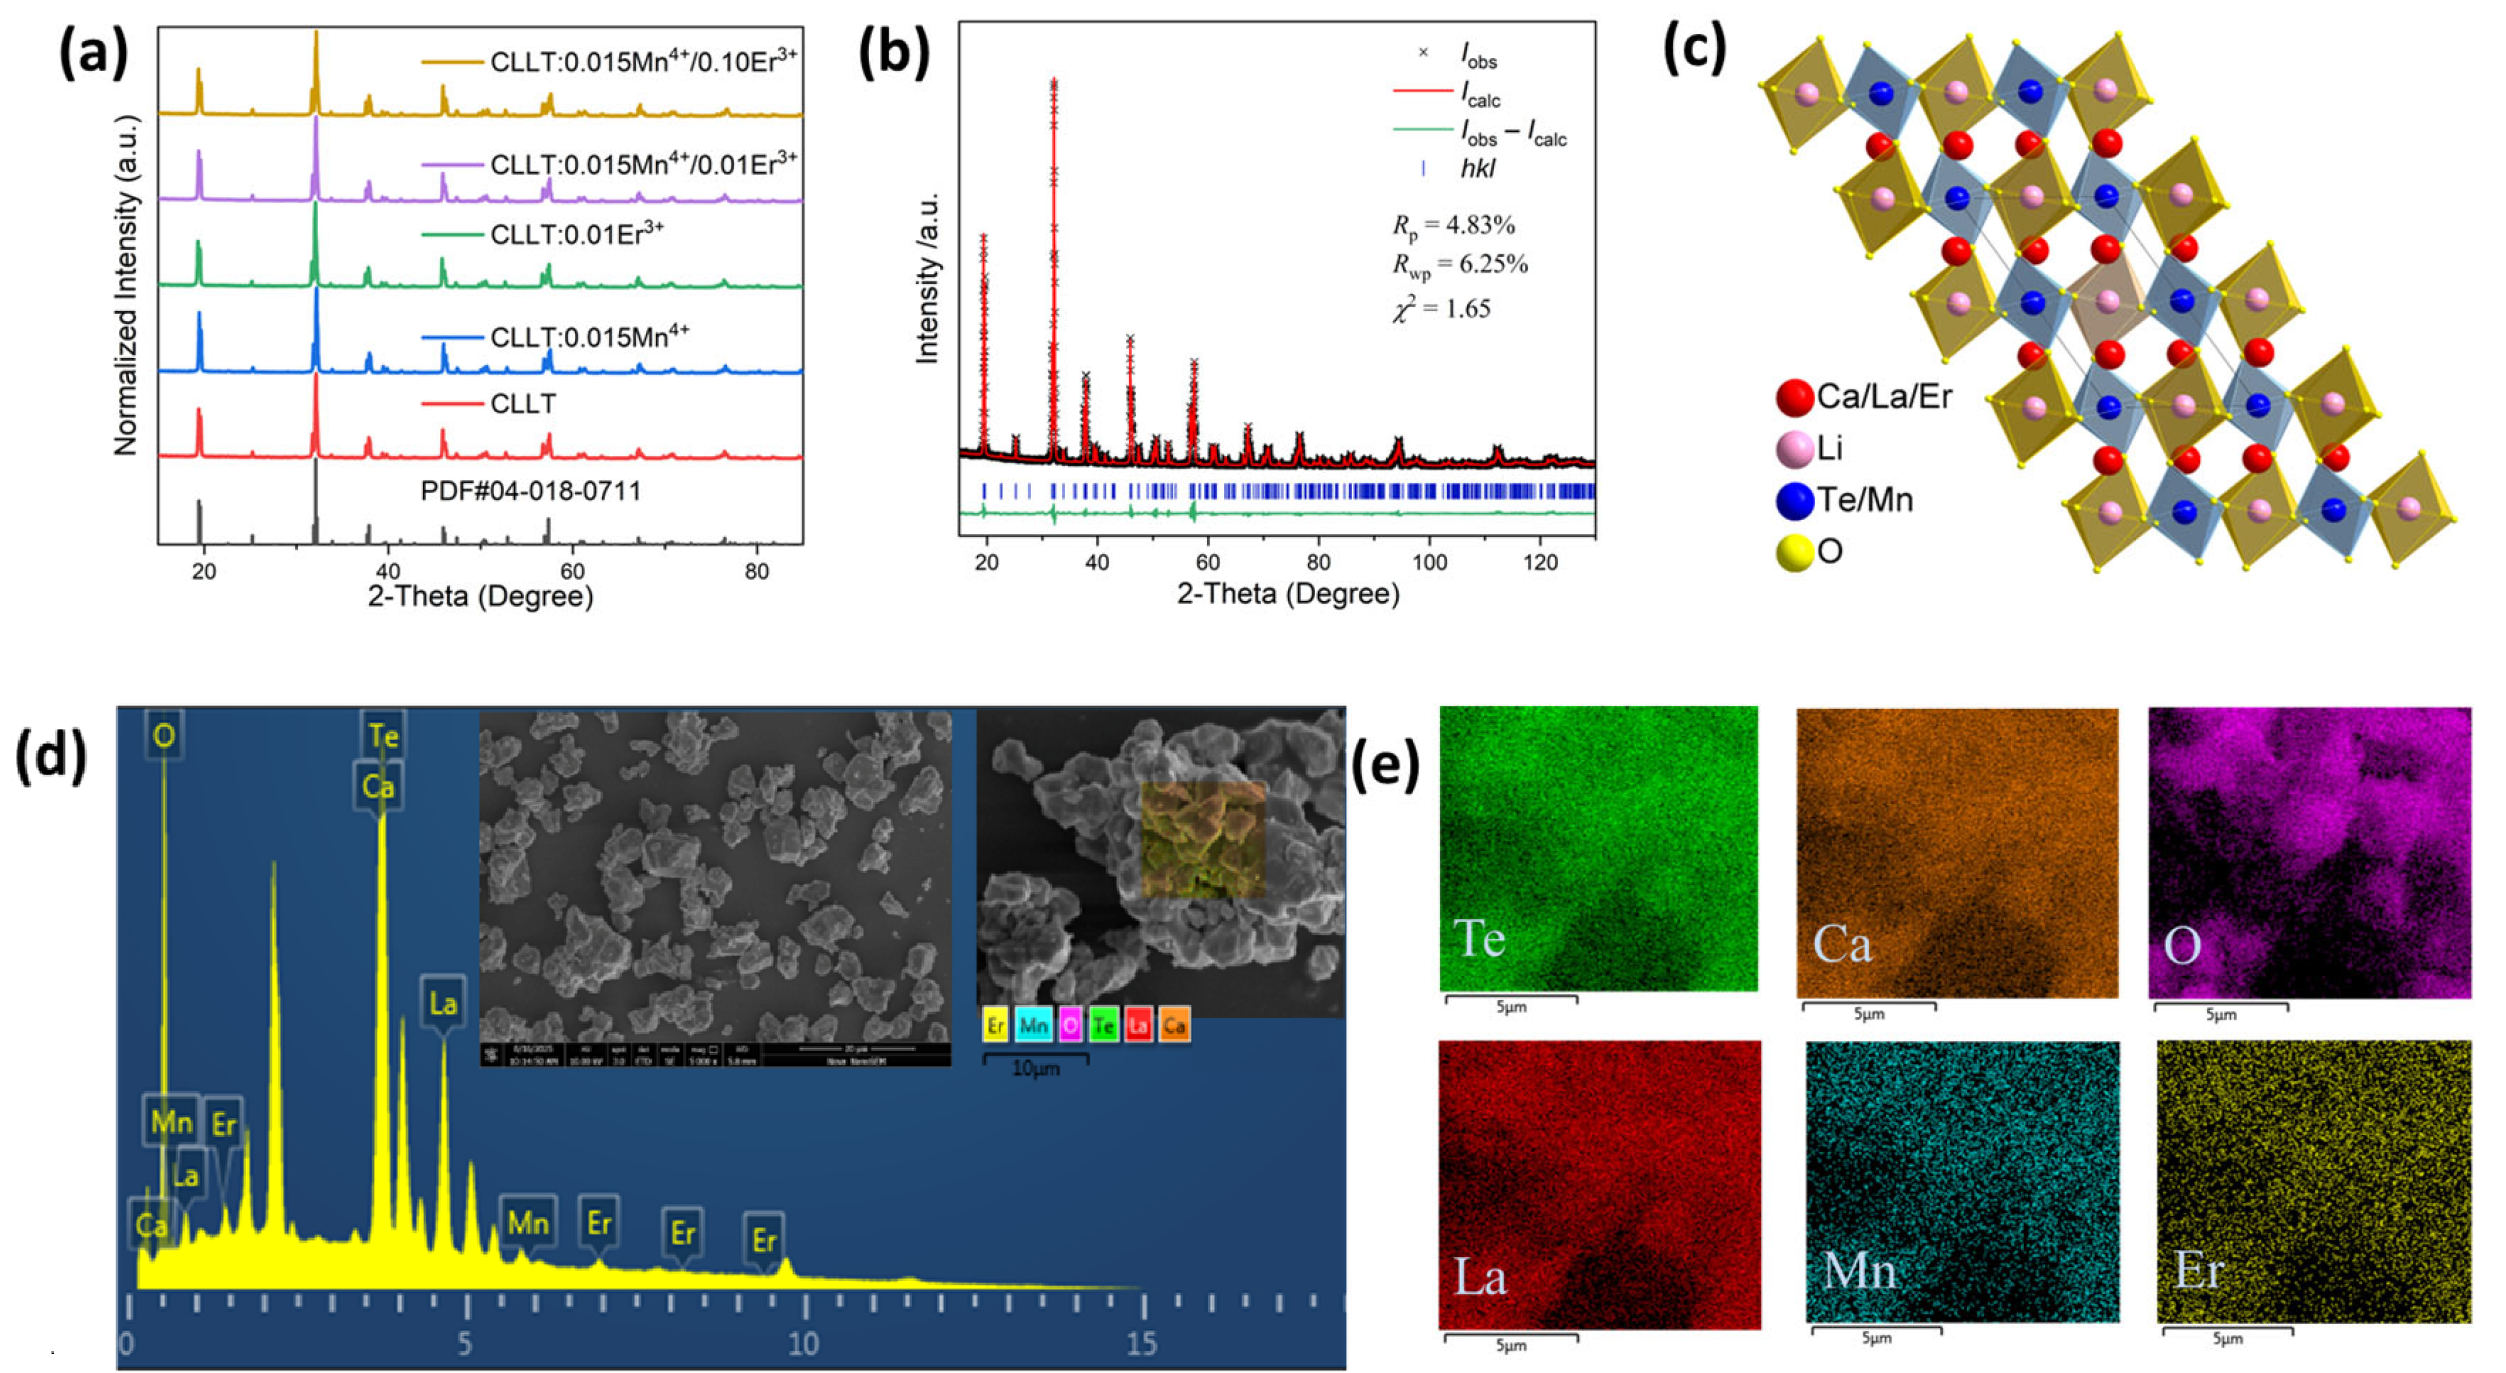
Figure 1. (a) XRD patterns of CLLT, CLLT:0.015Mn4+, CLLT:0.01Er3+, CLLT:0.015Mn4+/0.01Er3+, and CLLT:0.015Mn4+/0.10Er3+ phosphors compared to standard data for CaLaLiTeO6 (PDF # 04-018-0711); (b) Rietveld refinement results for CLLT:0.015Mn4+/0.01Er3+; (c) crystal structure of CLLT:0.015Mn4+/0.01Er3+; (d) EDX spectrum and representative SEM image (inset) of the sample particles. (e) Elemental mappings of CLLT:0.015Mn4+/0.01Er3+ phosphors.
Inorganics 13 00308 g001
Figure 2. (a) The DR spectra of the CLLT host and CLLT:0.015Mn4+/0.01Er3+ phosphors, with the inset illustrating the optical band gaps; (b) calculated electronic band structure of the CLLT host.
Inorganics 13 00308 g002
Figure 3. (a) PLE and PL spectra of CLLT:0.015Mn4+ phosphors; (b) the PL spectra of CLLT:xMn4+ phosphors under 312 nm excitation, with the inset displaying integrated intensity at varying Mn4+ concentrations x; (c) PLE and PL spectra of CLLT:0.01Er3+ phosphors; (d) the PL spectra of CLLT:yEr3+ phosphors under 379 nm excitation, with the inset displaying integrated intensity at varying Er3+ concentrations y.
Inorganics 13 00308 g003
Figure 4. (a) PLE and PL spectra of CLLT:0.015Mn4+/0.01Er3+ phosphors; (b) PL spectra of the CLLT:0.015Mn4+/yEr3+ with different y concentrations (y = 0, 0.005, 0.01, 0.04, 0.07 and 0.10) under excitation of 379 nm; (c) PL spectra of CLLT:0.015Mn4+/0.01Er3+ phosphors under 980 nm excitation wavelength; (d) logarithmic plot versus pumping power.
Inorganics 13 00308 g004
Figure 5. (a) Schematic energy level diagram of Er3+ and Mn4+ ions in the CLLT:0.015Mn4+/0.01Er3+ phosphors; (b) decay curves of 545 nm emission from CLLT:0.01Er3+ and CLLT:0.015Mn4+/0.01Er3+ phosphors under 379 nm excitation.
Inorganics 13 00308 g005
Figure 6. (a) Temperature-dependent PL spectra of CLLT:0.015Mn4+/0.01Er3+ in the range of 303 to 463 K; (b) integrated PL intensity at various temperatures; (c) changes in the FIR (I524nm/I545nm) values with temperature; (d) relative sensitivity (Sr, left) and absolute sensitivity (Sa, right) corresponding to FIR (I524nm/I545nm); (e) variation of the FIR (I716nm/I545nm) values with temperature; (f) relative sensitivity (Sr, left) and absolute sensitivity (Sa, right) corresponding to FIR (I716nm/I545nm).
Inorganics 13 00308 g006
Figure 7. (a) Temperature-dependent PL spectra of CLLT:0.015Mn4+/0.01Er3+ excited at 325 nm (center of the excitation band); (b) temperature-dependent upconversion PL spectra of CLLT:0.015Mn4+/0.01Er3+ (λex = 980 nm); (c) SBR (I716nm,λex=379nm/I716nm,λex=325nm) values along with the fitted curves; (d) relative sensitivity (Sr, left) and absolute sensitivity (Sa, right) corresponding to SBR (I716nm,λex=379nm/I716nm,λex=325nm); (e) SBR (I524nm,λex=379nm/I524nm,λex=980nm) values and the fitted curves; (f) relative sensitivity (Sr, left) and absolute sensitivity (Sa, right) corresponding to SBR (I524nm,λex=379nm/I524nm,λex=980nm).
Inorganics 13 00308 g007
Figure 8. (a) CIE color coordinates of the CLLT:0.015Mn4+/0.01Er3+ sample under excitation at 379 nm and 325 nm light. Corresponding luminescence photographs under sunlight irradiation (b,c); 379 nm lamp (d,e); and 325 nm lamp (f,g).
Inorganics 13 00308 g008
Table 1. Comparative analysis of the Sa and Sr values obtained in the current study with those documented for other temperature-sensing materials utilizing Er3+ or Mn4+ ions.
PhosphorTemperature Range (K)Max Sa (K−1)Max Sr (%K−1)Reference
NaYb(MoO4)2: Er3+300–5700.0130.69[32]
SrWO4: Yb3+/Er3+303–5730.0131.03[33]
Gd2O3: Yb3+/Ho3+/Er3+303–483--0.98[34]
YbTaO4: Er3+300–5700.00381.00[35]
α-SiAlON: Er3+298–12730.00340.59[36]
Gd2Zr2O7: Yb3+/Er3+298–573--1.10[37]
La2Mo2O9: Er3+/Tm3+303–4780.83[38]
MgLaLiTeO6: Er3+298–5730.00371.03[18]
NaYF4: Er3+303–423--1.06[39]
NaLaMgWO6: Mn4+/Er3+303–5230.00171.31[29]
Lu3Al5O12: Eu3+/Mn4+303–3580.070.7[10]
Gd2Ti2O7: Er3+/Yb3+303–6330.00381.12[40]
NaLaMgWO6: Mn4+/Eu3+303–5230.00300.86[41]
Sr3(PO4)2: Er3+/Yb3+303–6230.00700.88[42]
CaLaLiTeO6: Mn4+/Er3+303–4630.03481.12This work
Disclaimer/Publisher’s Note: The statements, opinions and data contained in all publications are solely those of the individual author(s) and contributor(s) and not of MDPI and/or the editor(s). MDPI and/or the editor(s) disclaim responsibility for any injury to people or property resulting from any ideas, methods, instructions or products referred to in the content.