2.1. Model Intramolecular Halogen-Bonded Macrocycle
A macrocycle containing a network of three intramolecular halogen bonds is proposed as a potential host for binding a metal cation. As shown in
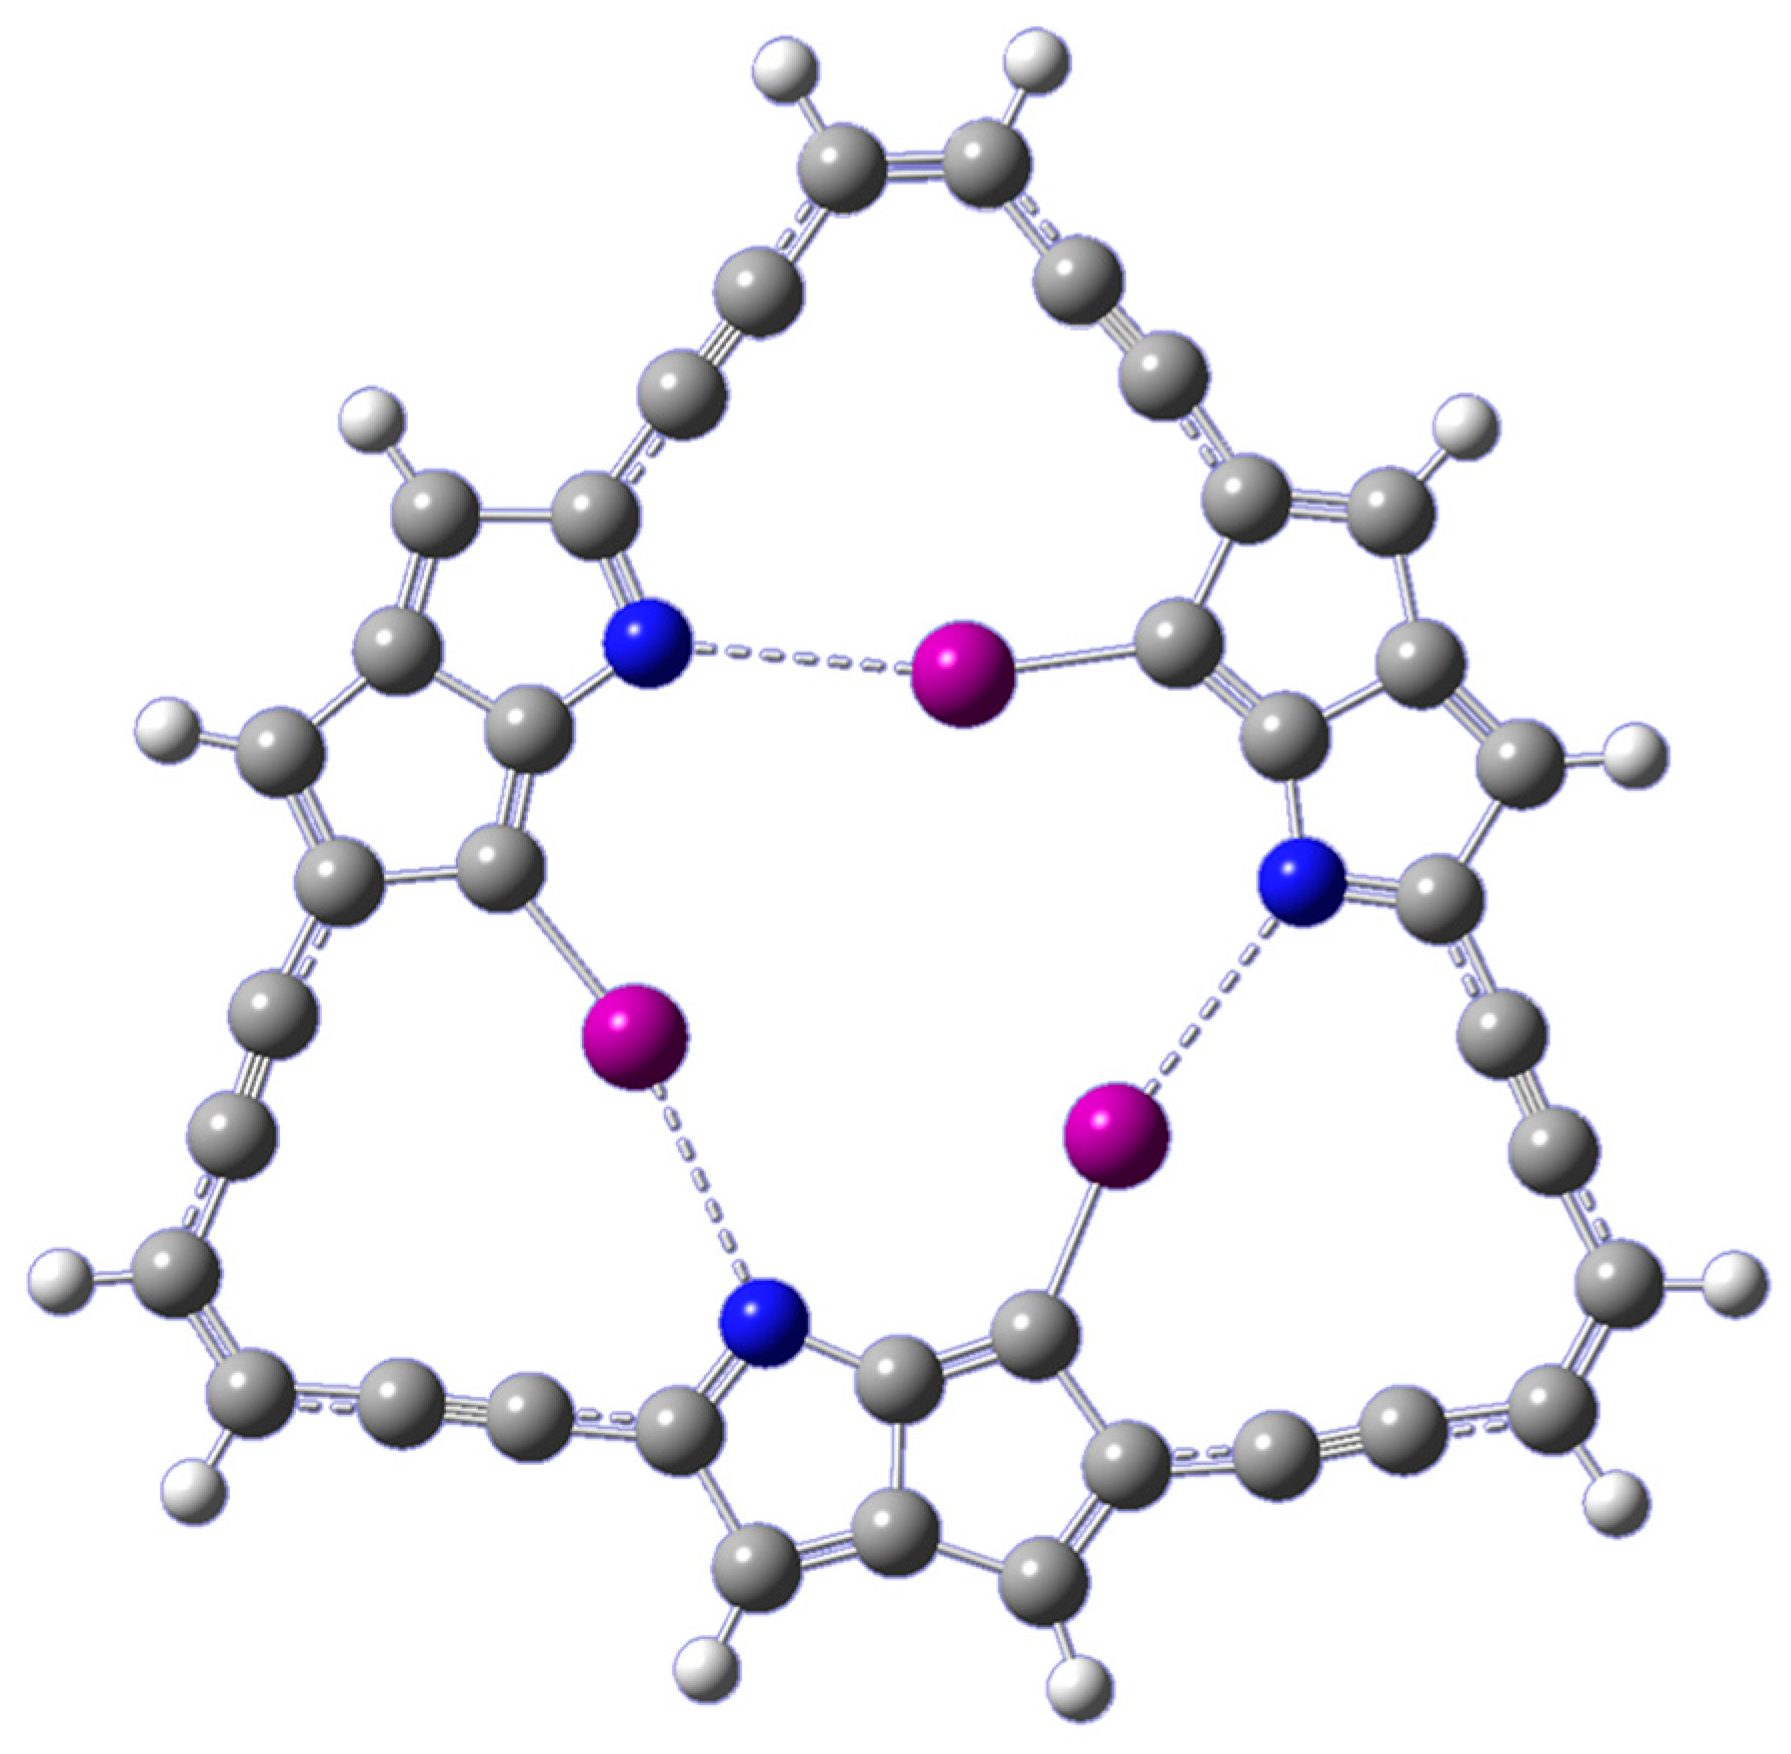
Figure 1, the model system is built by connecting three cyclopenta[b]pyrrole motifs through an alternating sequence of acetylene and ethylene linkages. Replacing one of the C-H bonds in each motif with a C-I bond allows for the formation of an intramolecular network of three C-I···N halogen bonds. The optimization of the macrocyclic ligand results in a planar geometry of symmetry C
3h. It should be noted that no symmetry was imposed for geometry optimization. In fact, starting with twisted geometries, C-I bonds away from the N atoms, optimization always converged to the same final C
3h structure shown in
Figure 1. Frequency calculations on the fully optimized geometry confirm the nature of the macrocycle as an energy minimum with no imaginary frequencies.
The existence of the halogen bond is evinced geometrically by an I···N distance (2.99 Å) that is much smaller than the sum of the van der Waals radii of the I and N atoms (3.53 Å), and a quasilinear C-I···N angle of 166.0°. Additional indicators of halogen bond presence and relative strength include electron densities at bond-critical points from AIM analyses and the amount of electron charge transfer and concomitant second-order stabilization energies from NBO analyses. Accordingly, the existence of the intramolecular C-I···N halogen bonds was further examined using topological analyses, within the framework of the AIM theory, and using delocalization energy analyses, within the framework of the NBO method. Specifically, the second-order NBO delocalization energies E2, associated with the charge transfer from the halogen bond acceptor lone pair into the antibonding orbital of the halogen bond donor (nN → σ*C–I), is calculated to be 5.51 kcal/mol. Moreover, AIM calculations reveal the existence of a critical point along the C-I···N path with an electron density, ρc, of 0.0186 a.u.
Having demonstrated the existence of the halogen bonds in the model macrocycle shown in
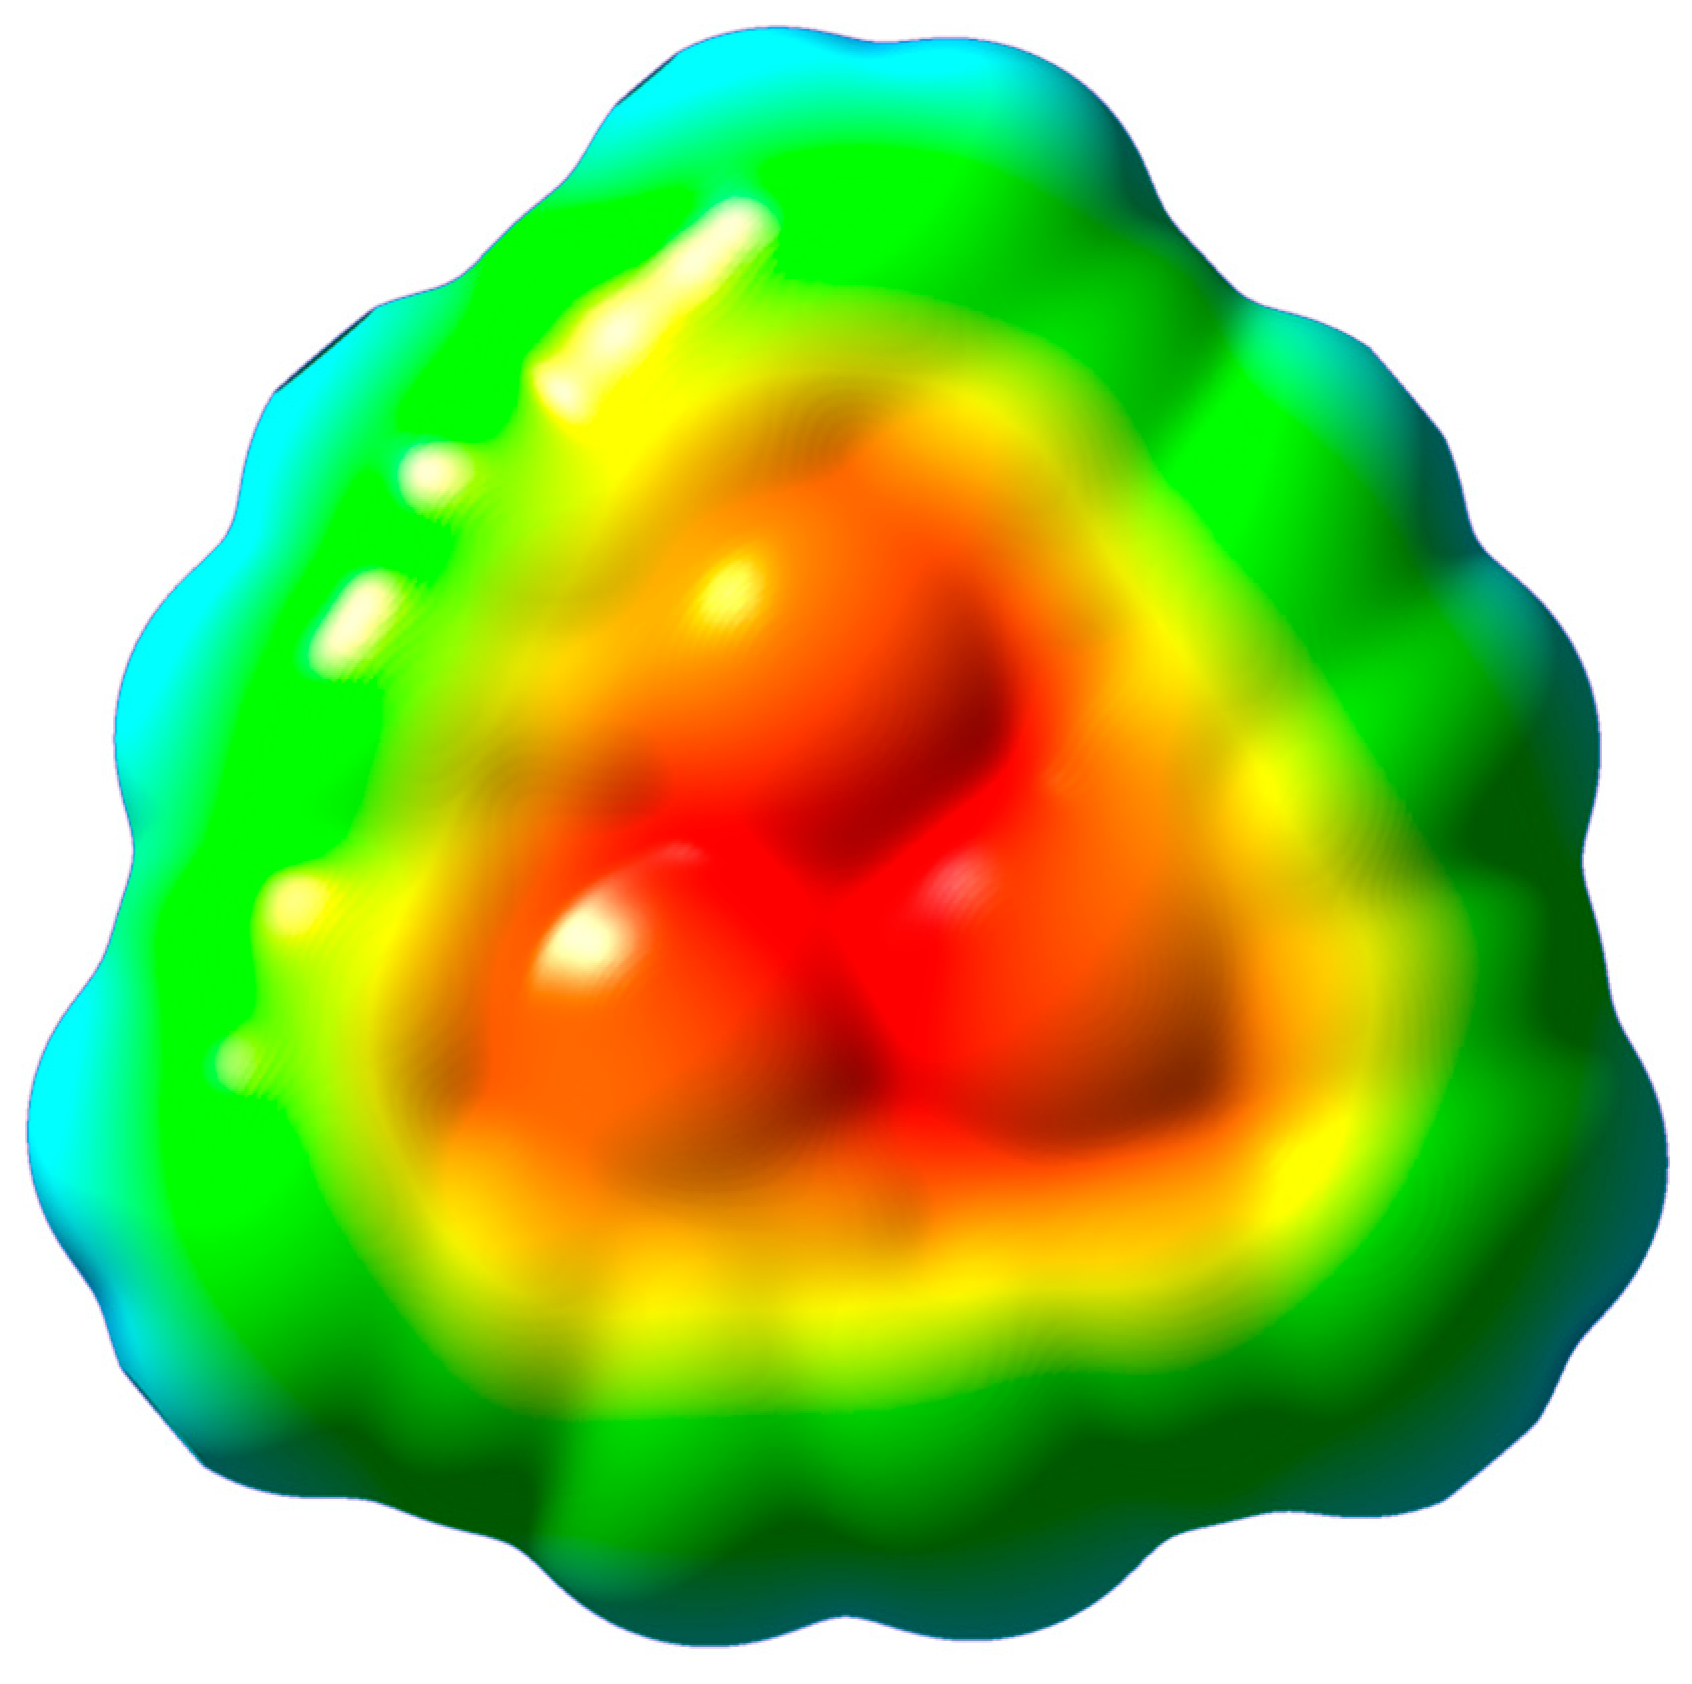
Figure 1, it would be important to investigate their ability to bind a metal cation. For this purpose, the molecular electrostatic potential was calculated first for the optimized macrocycle ligand. The results, displayed in
Figure 2, show the presence of a distinctive negative electrostatic potential region around the central cavity of the macrocycle. Consequently, a metal cation can, in principle, be attracted to this negative potential at the central cavity of the ligand. A sense of the ligand’s cavity can be gleaned from the I···I separations, which are about 4.65 Å. The specific geometries and energetics of the alkali metal ions (Li
+, Na
+, K
+, and Rb
+) are examined in the next section.
2.2. Alkali Metal Cation Binding via I···M+ Interactions
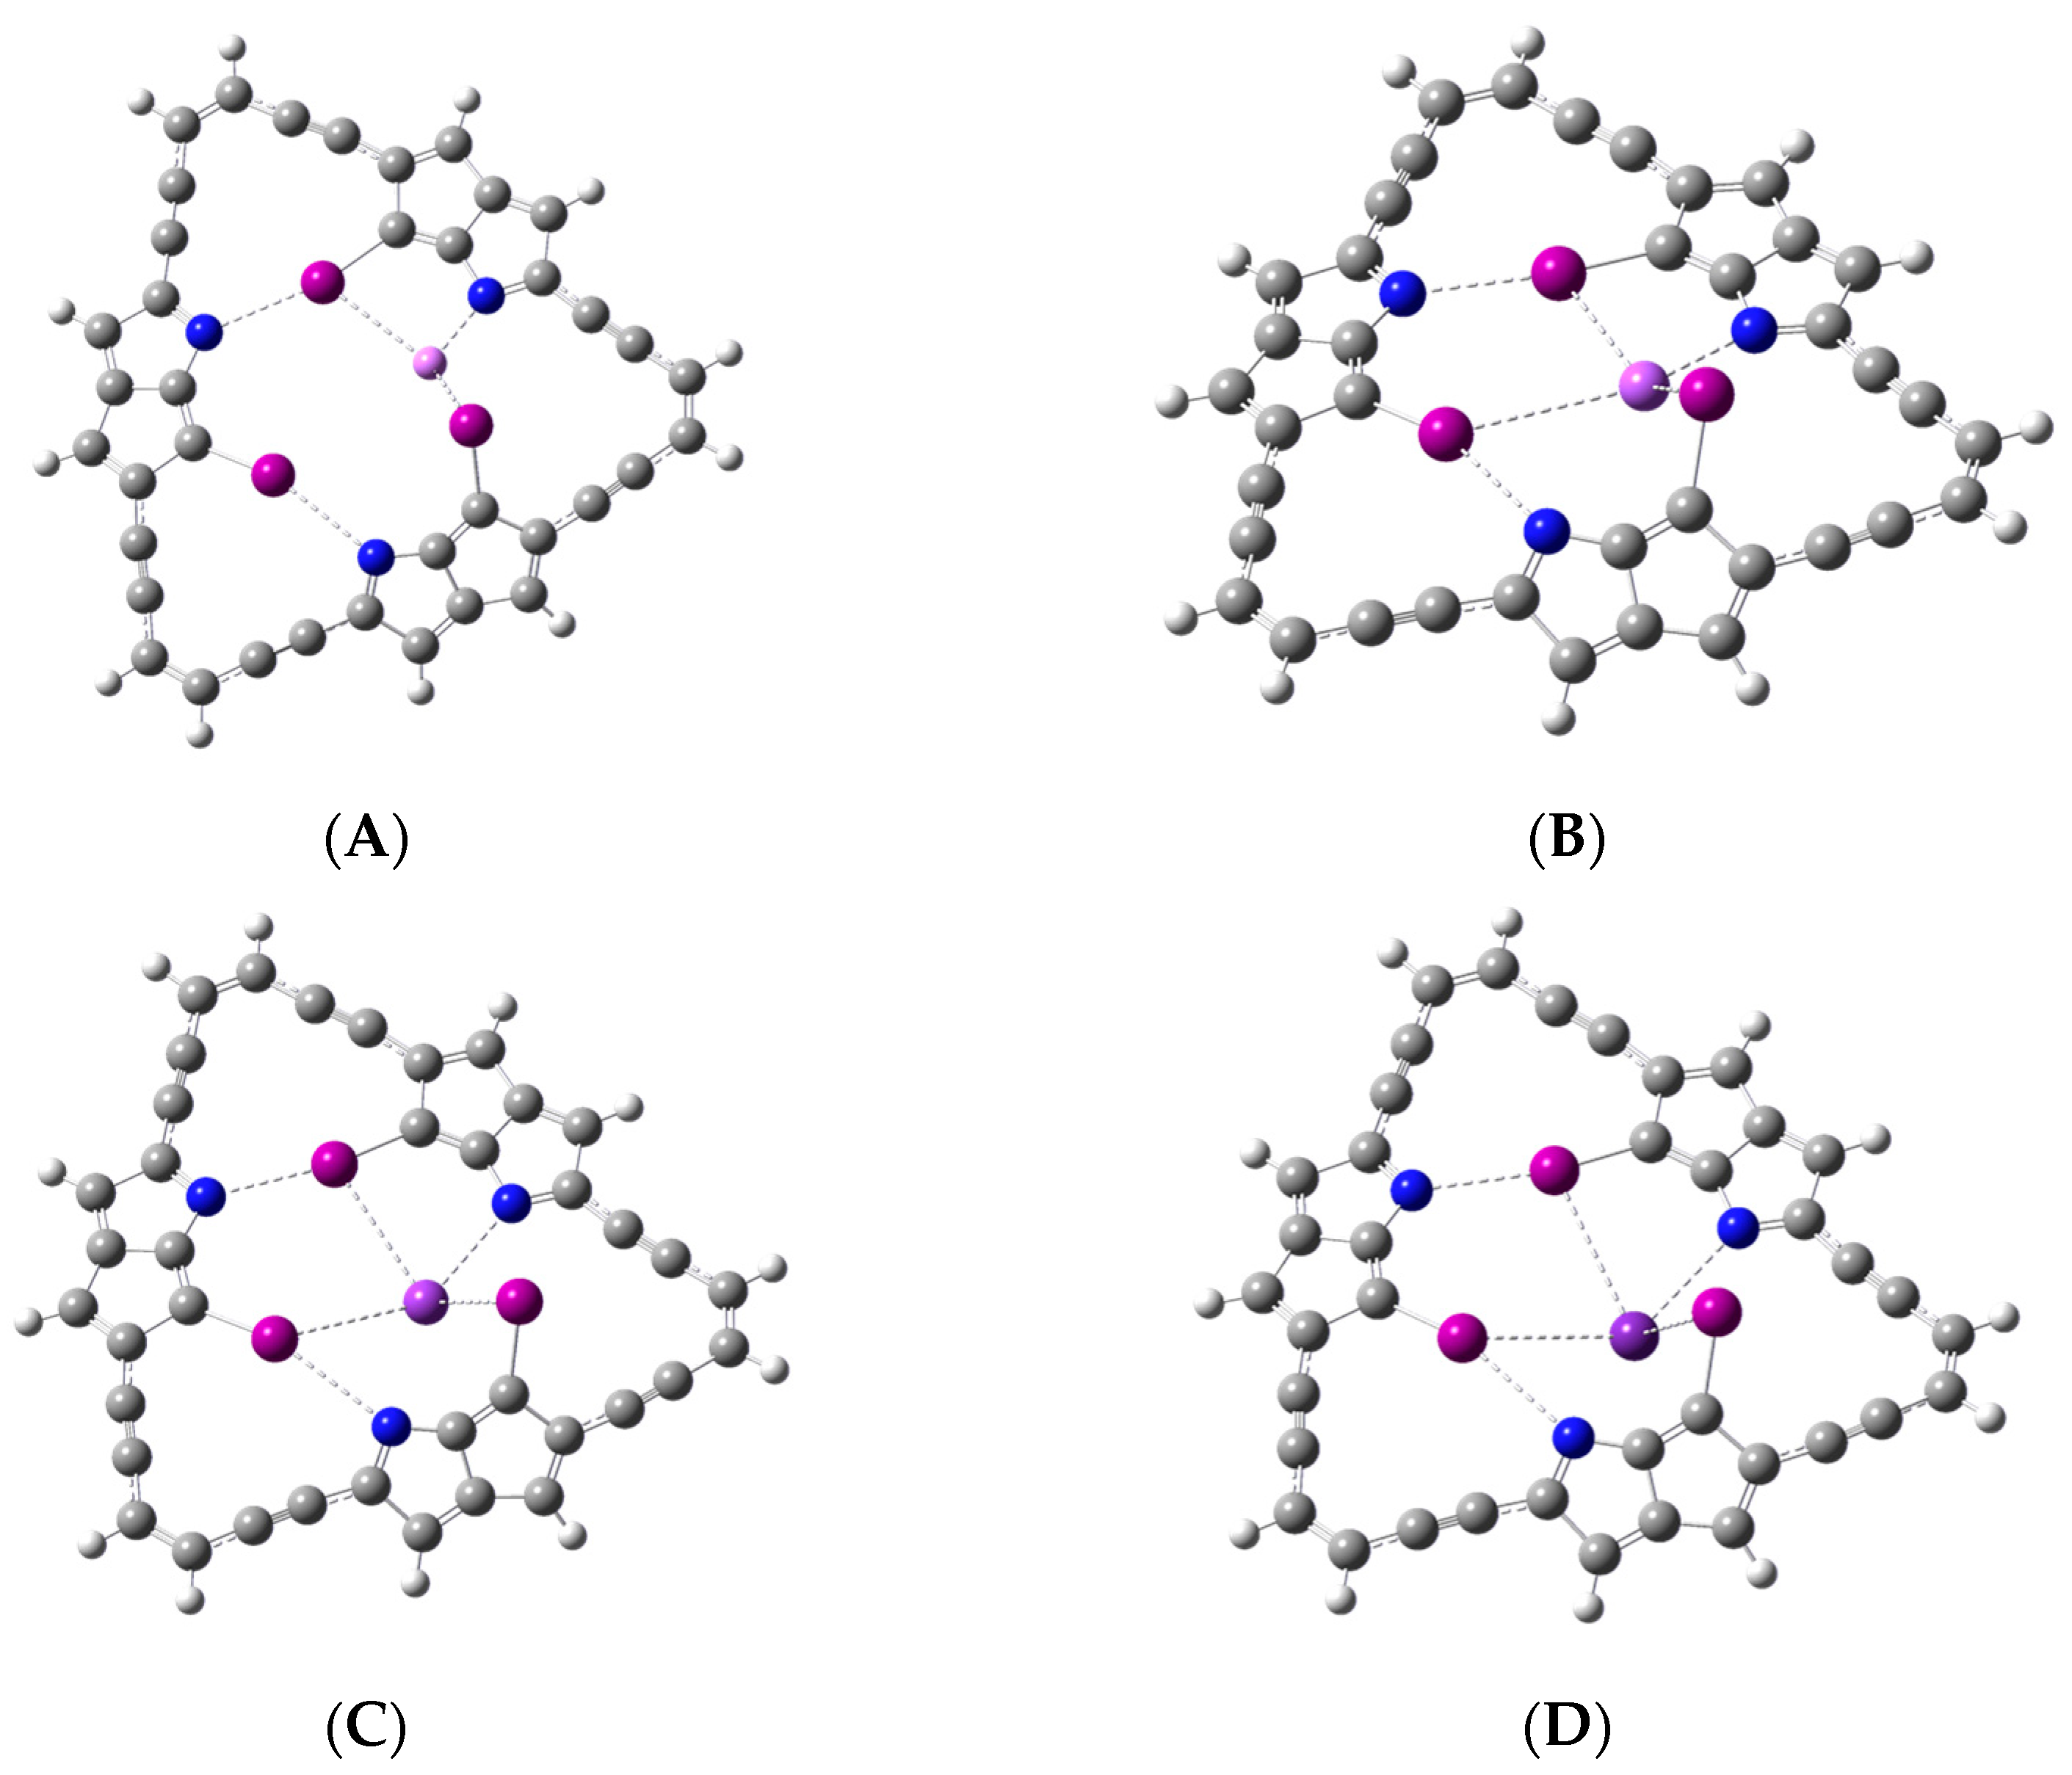
Geometry optimization shows that the model macrocycle binds Li
+ at the center of symmetry of the macrocycle. That is, Li
+ is found in the middle of the central cavity upon complexation, as shown in
Figure 3A,B. For the larger metal cations (Na
+, K
+, and Rb
+), the binding occurs, however, above the center of symmetry or plane of the macrocyclic ligand, as shown in
Figure 3C,D for Rb
+. In all cases, the complexation of the metal occurs primarily through the interaction between the metal ion and the iodine atoms. Frequency calculations confirm that the optimized complexes are indeed minimum energy structures with no imaginary frequencies.
The binding of the metal ion brings about changes in the geometrical parameters of the host. For example, the halogen bond distances, d
C-I…N, and angles, A
C-I…N, are listed in
Table 1. Comparison with the halogen bond distances and angles of the free macrocycle, discussed in the previous section, reveals a shortening of the distances along with a widening of the angles upon metal ion complexation. These geometrical changes indicate that the complexation of the metal ion strengthens rather than weakens each of the halogen bonds in the macrocycle. It is noteworthy that the magnitude of the geometrical changes in the C-I···N halogen bonds decreases as the size of the metal ion increases.
Table 1 also shows that the smallest distance from the metal ion to each of the iodine atoms, d
I···M+, occurs for Li
+. In fact, this distance is small enough to allow the metal ion to sit in the middle of the plane formed by the three halogen atoms. For the larger metal ions, the d
I···M+ values are too large, however, for the metal ions to fit inside the cavity; hence, they sit above the center of the plane. As expected, the larger the metal ion, the larger the distance to the center of the plane, d
c…M+, as shown in
Table 1.
The complementarity between the Lewis acid, the metal ion, the Lewis bases, and the halogen atoms, results in a favorable metal-ion-binding interaction. A straightforward approach to gauge the relative strength of these binding interactions is to calculate the corresponding complexation energies, particularly after accounting for basis set superposition error, BSSE. The BSSE-corrected metal ion complexation energies, CE, are listed in
Table 2. The complexation energies are calculated as the difference between the total energy of the complex and the sum of the energies of both the metal ion and the macrocyclic ligand with the geometry the ligand has in the complex. Because it sits in the middle of the plane formed by the halogen atoms, Li
+ seems to experience more effectively the combined lone pair electron density of all the halogen atoms involved in its binding. The more effective favorable interaction for Li
+ is shown in
Table 2 as the most negative complexation energy of all the metal ions considered. In addition to the complementarity of the binding sites of the ligand to the metal ion, it is important to consider the extent to which the ligand changes its geometry to accommodate the metal ion guest. Energetically, the cost for the geometrical change of the ligand upon complexation can be seen in the deformation energy, ∆E
def, calculated as the difference between the energy of the ligand with the geometry adopted in the complex and the energy of the optimized free ligand.
Table 2 reveals that the deformation energies are small, with values that are within 4% of the complexation energies: 2.7% for Li
+, 3.9% for Na
+ and K
+, and 4.0% for Rb
+. The relatively small deformation energies suggest that the macrocycle is preorganized, requiring little conformation or geometrical change to arrange its binding sites to maximize the favorable interaction with the metal ions while minimizing any unfavorable interactions, such as those among the binding sites themselves.
A steady decline of the magnitude of the complexation energies, |CE|, with the distance between the metal ion and the halogen atom, d
I…M+, is represented graphically in
Figure 4A. Likewise, a constant decline is seen in
Figure 4B of |CE| with the distance of the metal ion to the center of the plane made by the three halogen atoms, d
c…M+. In both cases, the goodness of fit for the linear equations has R
2 values close to 1.0.
Table 3 lists the second-order NBO delocalization energies, E
2, associated with both the intramolecular halogen bonds, C-I···N, and the intermolecular interaction between the halogen atoms of the ligand and the metal ion, C-I···M
+. Comparison with the E
2 value for the halogen bond in the free ligand (5.51 kcal/mol) shows that the corresponding E
2 values are consistently larger upon metal ion complexation. This result is consistent with the notion that metal ion complexation strengthens the intramolecular halogen bonds suggested previously on geometrical grounds. The E
2 values associated with the C-I···M
+ interactions listed in
Table 3 refer to the charge transfer from the halogen atom lone pairs into the anti-lone pair orbital of M
+, n
I → lp*
M+. Interestingly, changes in these delocalization energies with respect to the size of the metal ion follow the same trend as the changes in the pertinent halogen bonds in the macrocyclic ligand. That is, as the size of the metal ion increases, the E
2 value decreases, albeit the changes are much more substantial for the delocalization energies related to the halogen-metal ion interactions.
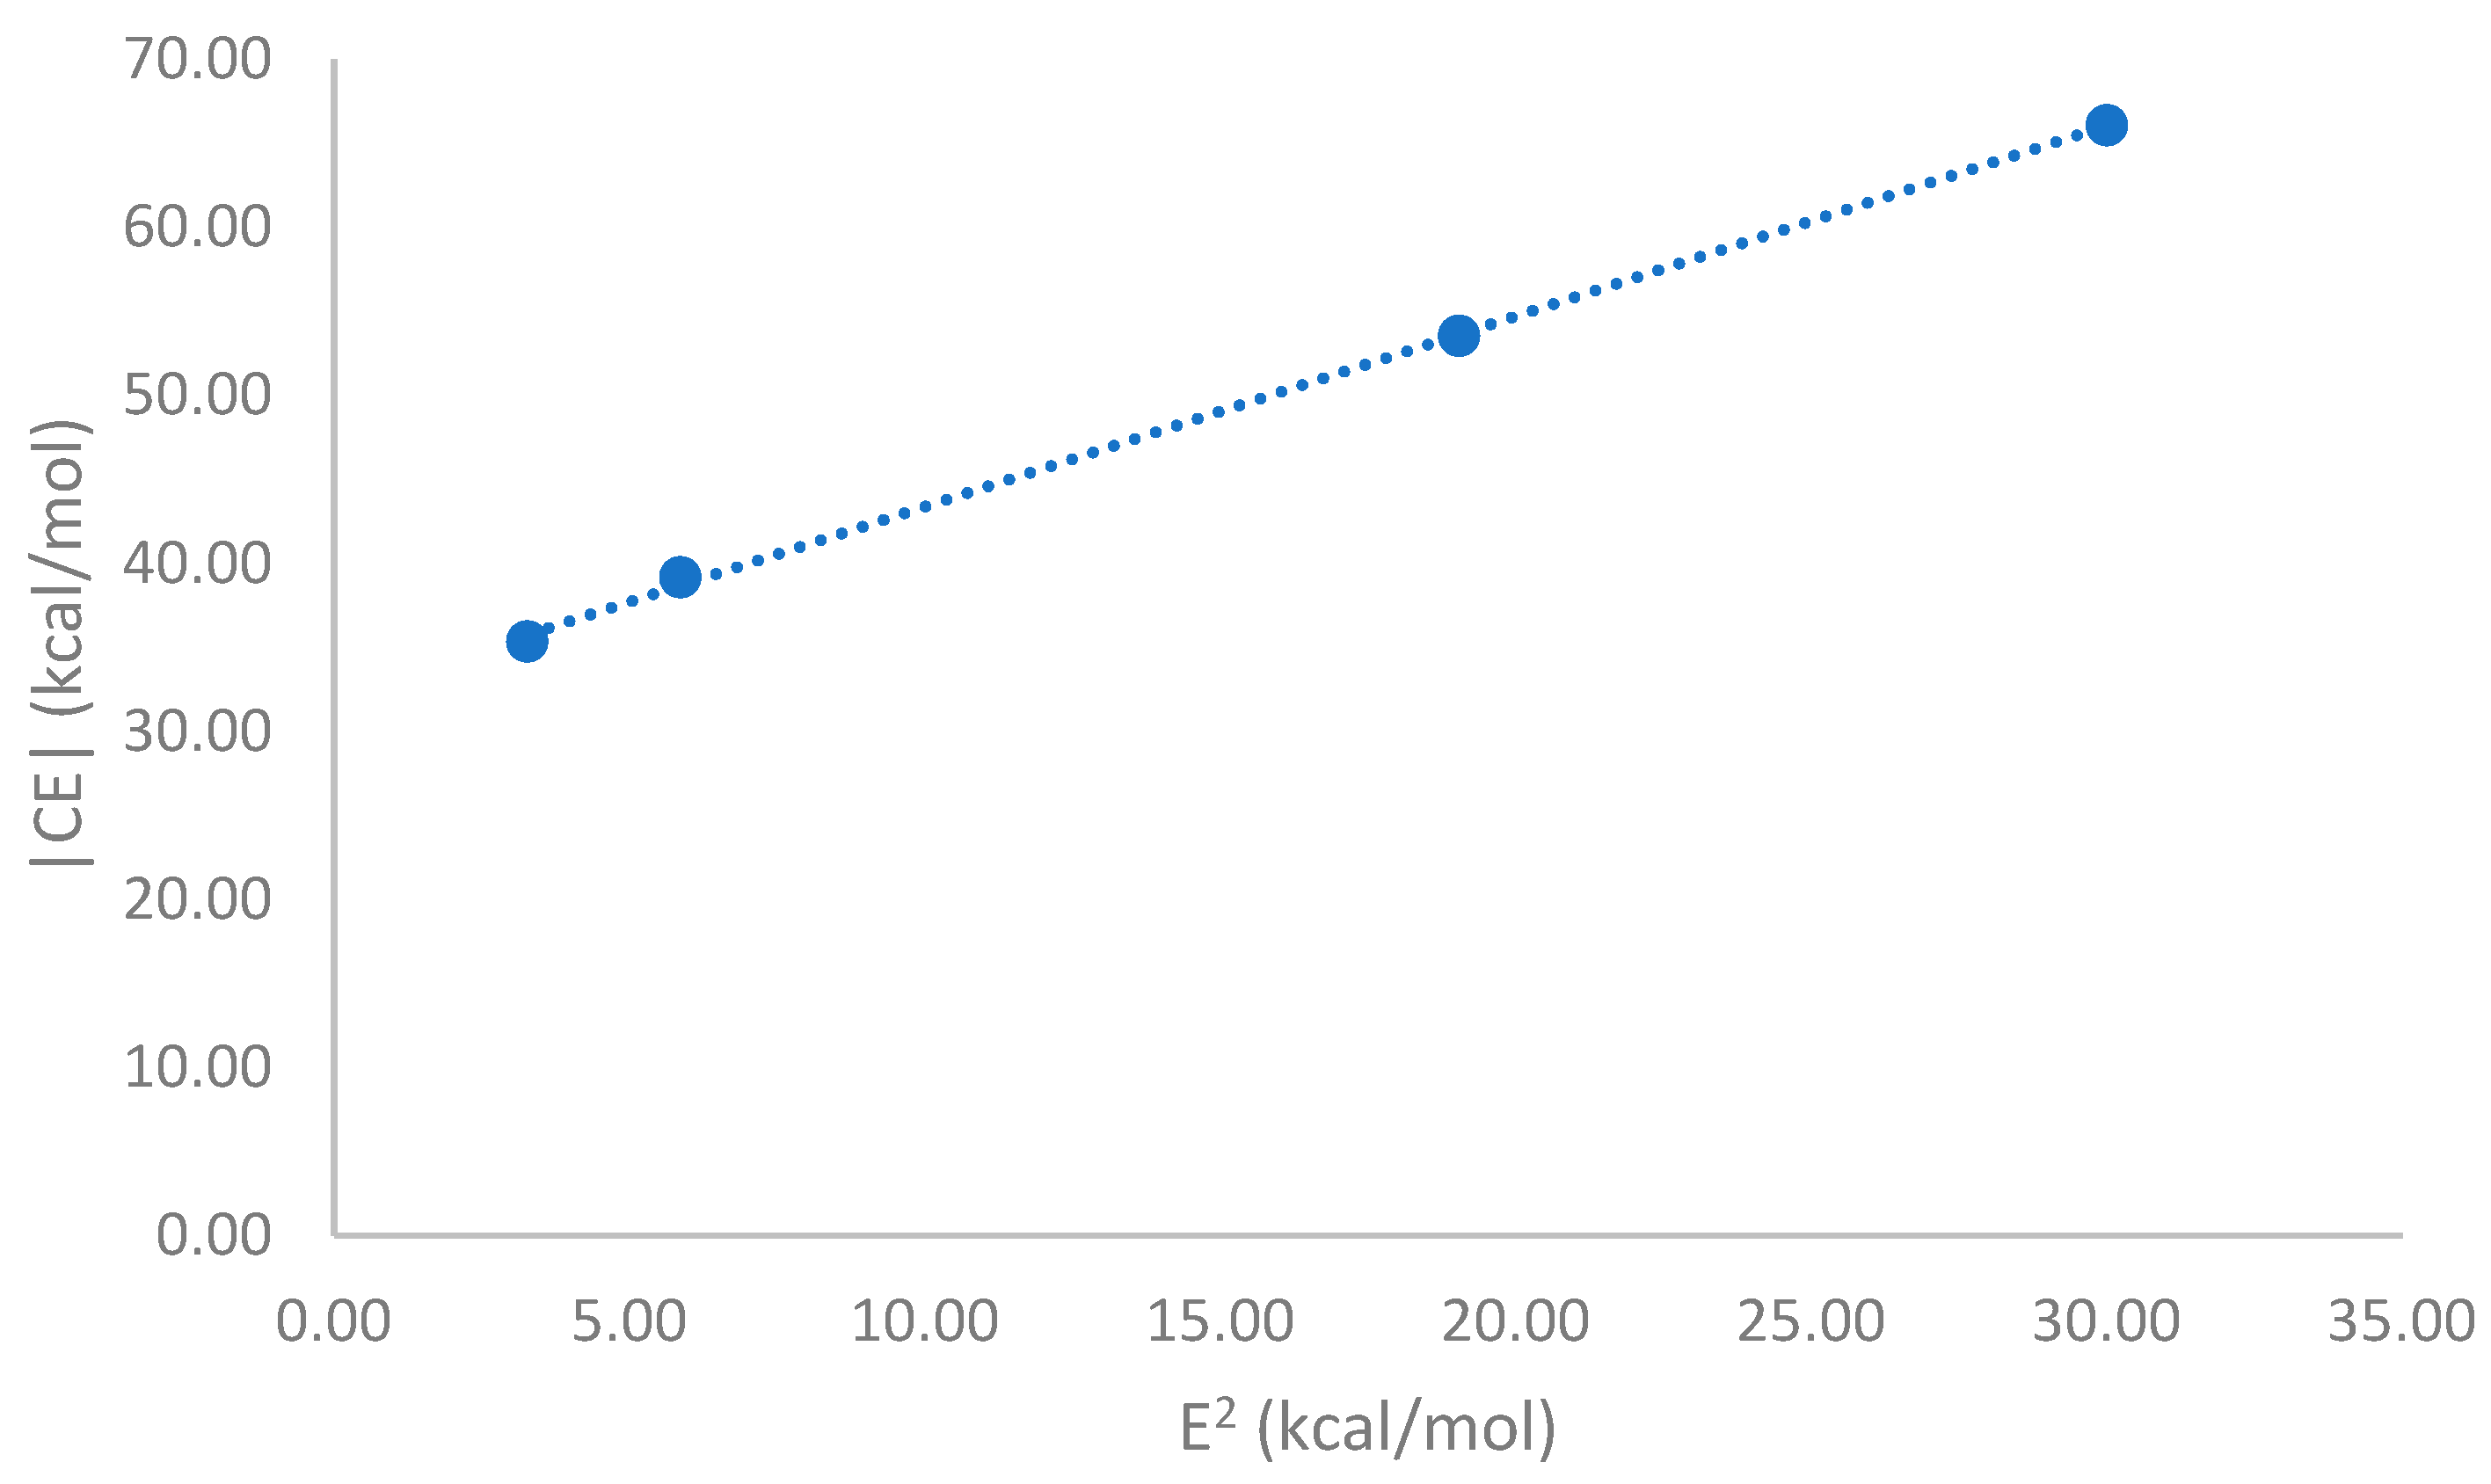
The E
2 values associated with the C-I···M
+ interactions are also found to correlate with the complexation energies. Specifically, the E
2 values for these interactions become increasingly larger with the increasing magnitude of the metal ion complexation energies.
Figure 5 explicitly displays this linear relationship with an R
2 value of 1.00.
The specific interactions between the metal ion and the macrocyclic ligand are made apparent by the existence of a critical point along the path between the metal ion and each of the halogen atoms participating in its complexation. The electron density at each of these bond critical points, ρ
C-I…M+, are listed in
Table 4. Except for Li
+, the ρ
C-I…M+, value decreases steadily with increasing size of the metal ion. This trend in ρ
C-I…M+ correlates with the decline of the magnitude of the related complexation energies as the metal ion becomes larger. The exception shown for Li
+, which shows a ρ
C-I…Li+ smaller than that for Na
+, ρ
C-I…Na+, seems counterintuitive, given that the magnitude of Li
+ complexation energy is over 12 kcal/mol larger than that for Na
+. It should be noted, however, that the use of the electron density at the bond critical point to compare bond interactions involving different nuclei, say I···Li
+ and I···Na
+, provides just an estimate of their relative strength. This estimate becomes more meaningful when the nuclei participating in the bond are the same and within a similar chemical environment [
66]. Thus, it is important to examine the strength of these binding interactions using indicators other than just the electron density. For example, the second-order delocalization energy, E
2, as discussed earlier, is a commonly used indicator of bond strength. Other approaches to examine noncovalent bond strength include interaction energy decomposition analysis, EDA [
67], and interacting quantum fragment analysis, IQF [
68].
In addition to the halogen-metal ion interaction critical point densities,
Table 4 shows the electron density at each of the halogen bond critical points, ρ
C-I…N. The strengthening of these intramolecular halogen bond interactions, C-I···N, upon metal ion complexation is evident in the increase of the electron density value at the halogen bond critical point, ρ
C-I…N, when compared with those in the free ligand (ρ
C-I…N = 0.0186 a.u.). In accord with the geometrical and the NBO results, the strengthening of the C-I···N halogen bonds revealed by the AIM results tends to decrease with the size of the metal ion being complexed by the macrocyclic ligand.
2.3. Alkali Metal Cation Binding via I···M+ and N···M+ Interactions
In the preceding section, the binding of the metal ion was discussed in terms of the I···M
+ interactions that take place without disrupting or weakening any of the three C-I···N halogen bonds in the ligand. An alternative mode of binding the metal ion is considered in this section. Here, the binding of the metal ion includes the participation of the lone pair of one of the nitrogen atoms. This N···M
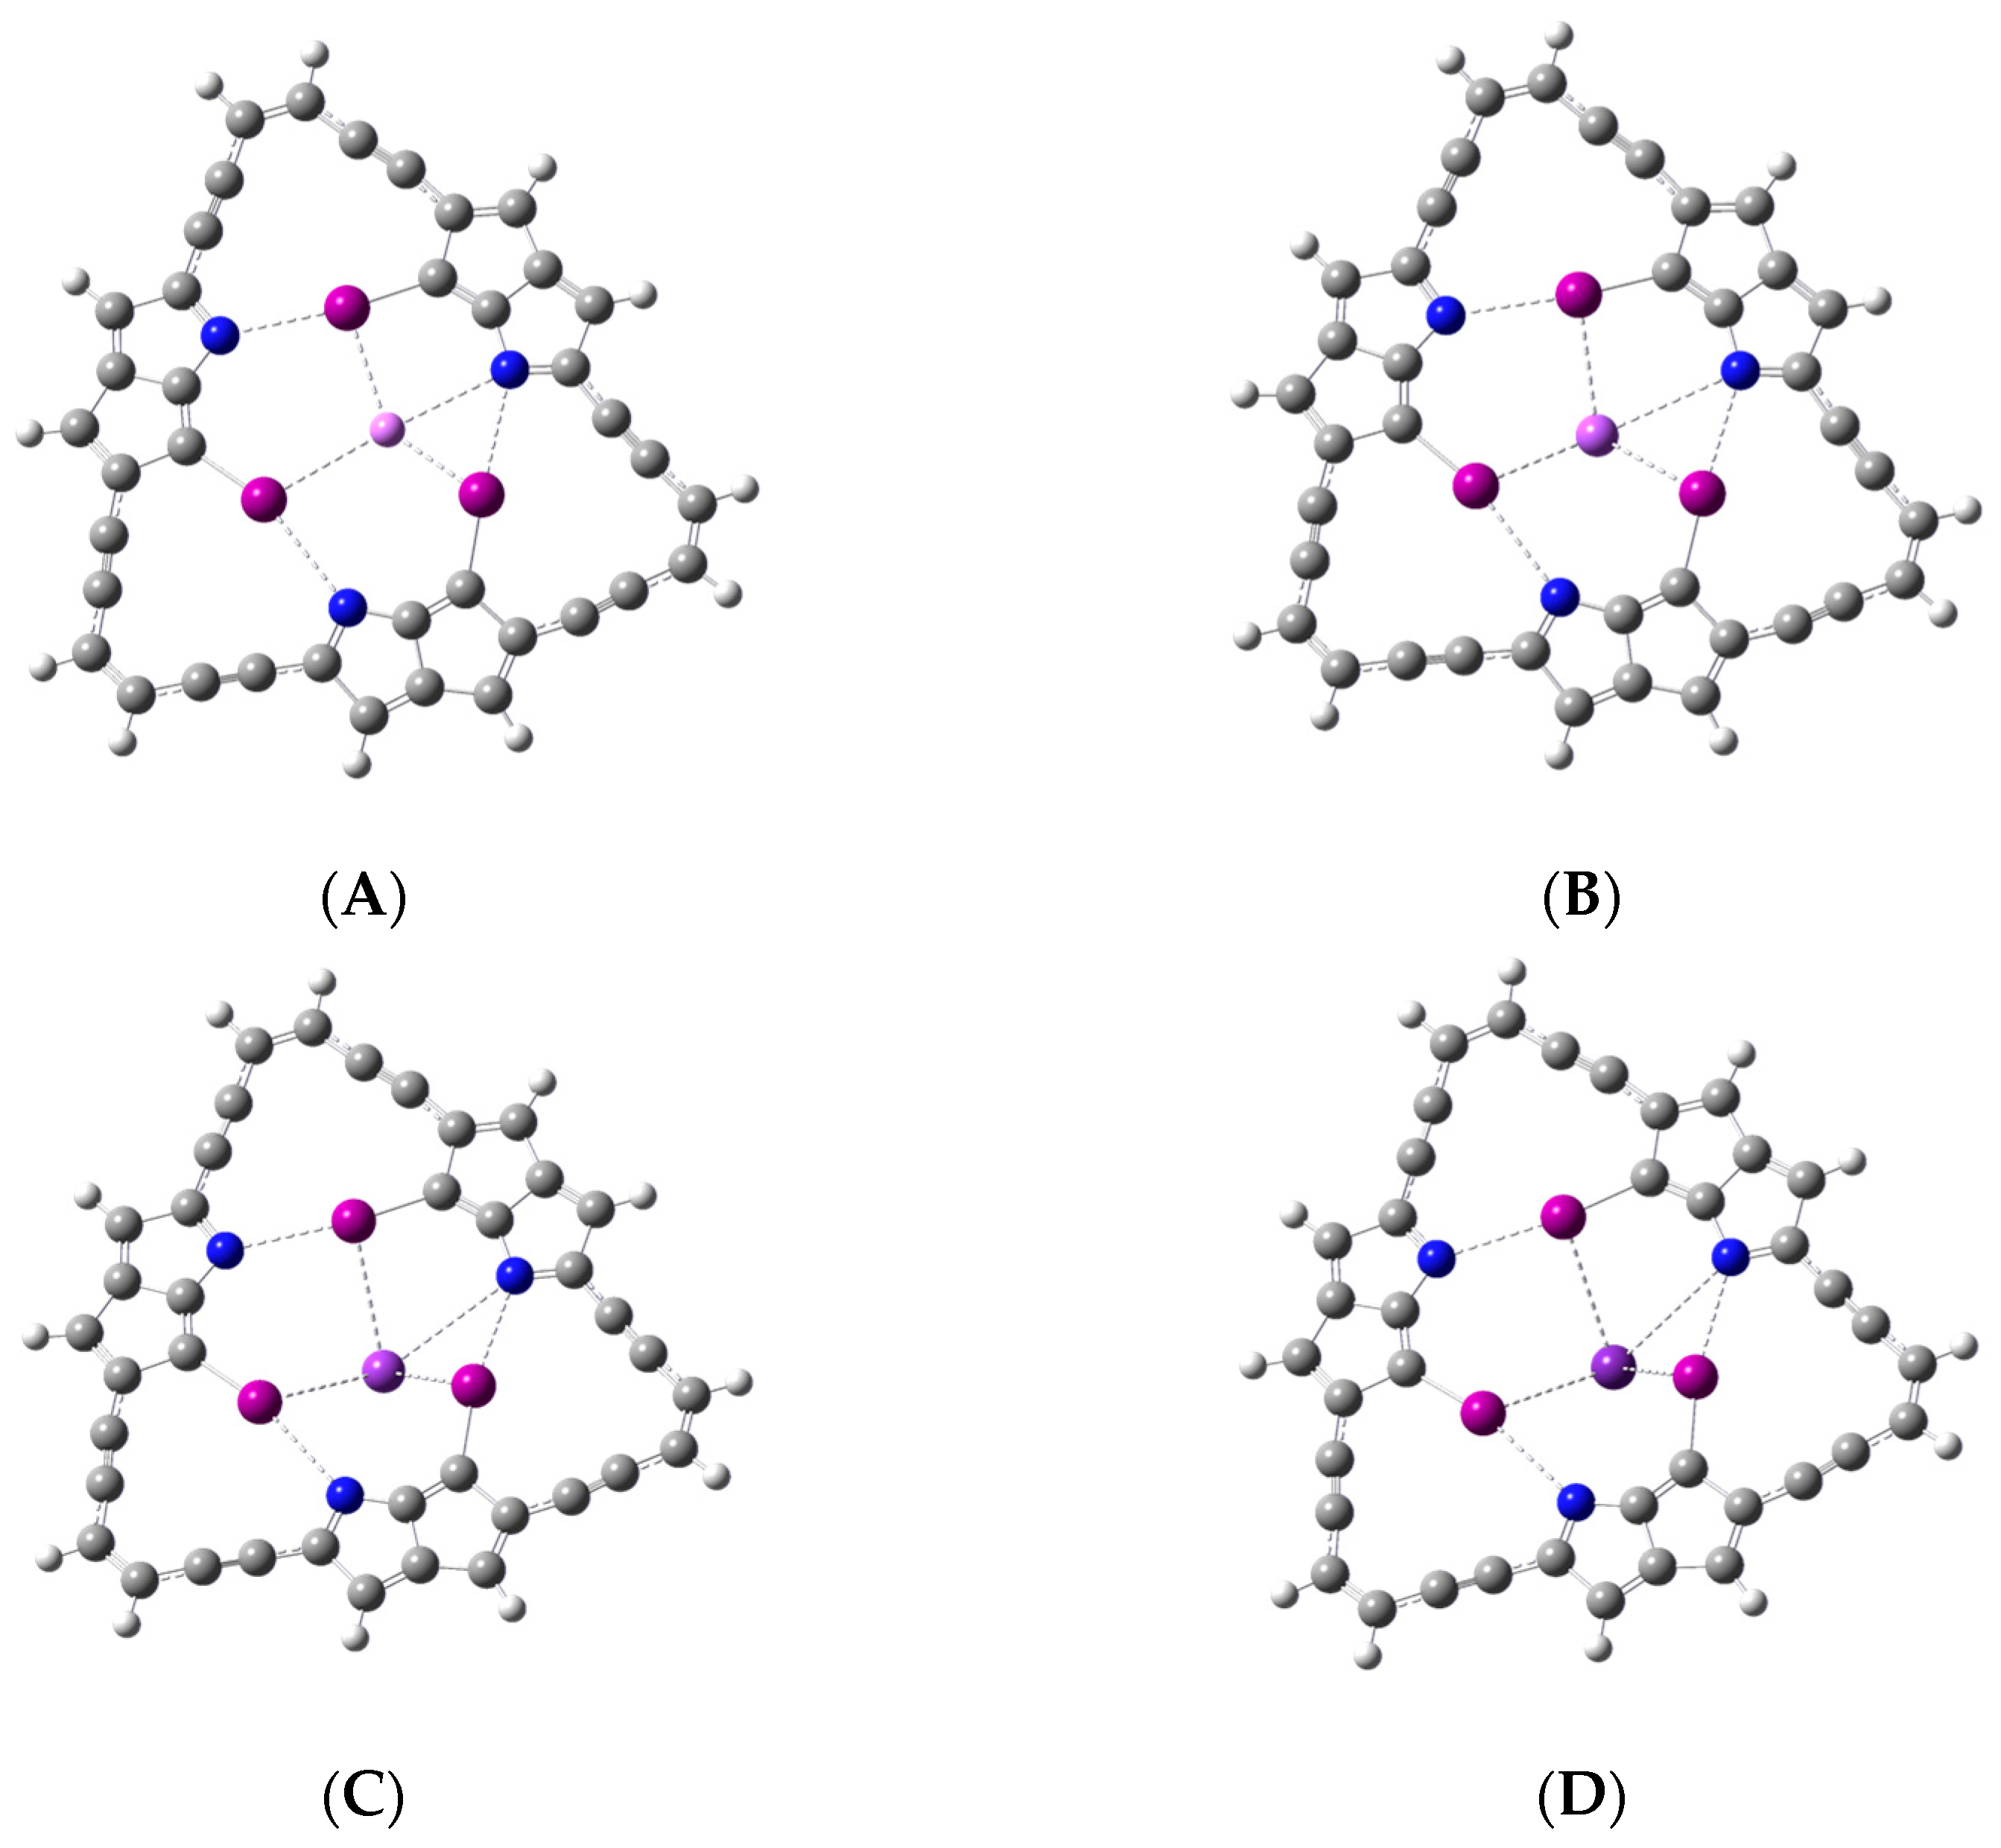
+ interaction occurs by sacrificing one of the C-I···N halogen bonds in the macrocyclic ligand. The optimized geometries for each of the metal ion complexes, including I···M
+ and N···M
+ interactions, are displayed in
Figure 6A–D. In all cases, the complexation of the metal ion includes the interaction between the metal ion and one of the nitrogen atoms. Binding of the metal ion, also including the three halogen atoms, seems to occur only for the larger Na
+, K
+, and Rb
+ ions. For the smallest Li
+ ion, one of the iodine atoms appears too far to contribute significantly to the binding of this metal ion.
Figure 6A–D makes it apparent that one of the C-I···N halogen bonds in the ligand is effectively removed to enable the formation of the N···M
+ interaction. Frequency calculations confirm that all the optimized complexes are indeed minimum energy structures with no imaginary frequencies.
Table 5 displays the halogen bond distances, d
C-I…N, and angles, A
C-I…N, as well as the distances from the metal ion to iodine, d
I…M+, and nitrogen, d
N…M+, respectively. These geometrical parameters are listed in
Figure 6, reading counterclockwise and starting at the uppermost halogen bond. Comparison with the halogen bond distances and angles of the complexes discussed in the previous section reveals the complete disruption of one of the halogen bonds with halogen bond distances that are substantially larger and well beyond the sum of the N and I van der Waals radii. The related C-I···N angles are also significantly reduced. The other two halogen bonds remain with minor perturbations, as reflected in small changes in distances and angles. With respect to the metal-ion-to-nitrogen distance, d
N…M+,
Table 5 shows that only one nitrogen atom is effectively binding the metal ion, while the other two nitrogen atoms appear too far away from the metal ion. Similarly, one of the iodine atoms, the one opposite to the nitrogen binding the metal ion, appears substantially far away from the metal ion, suggesting that its contribution to complex formation is relatively small or even negligible when compared with the other two iodine atoms. Interestingly, the smallest d
I…M+ values involve the iodine for which the halogen bond interaction was severely disrupted.
The BSSE-corrected metal ion complexation energies, CE, are listed in
Table 6. The I···M
+ and N···M
+ interactions result in complexation energies that are between 9.33 and 10.36 kcal/mol more negative than those involving only I···M
+ interactions (see
Table 2). More specifically, the percent change in the CE listed in
Table 6 relative to those listed in
Table 2 tends to increase with the size of the metal ion, as 14% < 17% < 25% < 26%. These percent changes get much smaller, however, when the deformation energies, ΔE
def, are factored in. Indeed, a reduction by a factor of two or more is seen in these percent changes with a similar qualitative trend: 7% < 8% < 10% < 11% for Li
+, Na
+, Rb
+, and K
+, respectively. These values correspond to interaction energies that are 4.88, 4.45, 4.21, and 3.63 kcal/mol more negative than those listed in
Table 2, respectively. Although the complexation energies are more favorable, these results underscore the large geometrical deformation that the macrocyclic ligand needs to undergo to facilitate the participation of a nitrogen atom lone pair in the binding of the metal ion. For comparison, the deformation energies calculated for the complexes formed via only I···M
+ interactions were much smaller (see
Table 2). These smaller deformation energies are consistent with the preorganized geometry of the macrocyclic ligand for the binding of the metal ion via the iodine atoms.
Table 7 lists the second-order NBO delocalization energies, E
2, associated with both the intramolecular halogen bonds, C-I···N, and the intermolecular interaction between the halogen atoms of the ligand and the metal ion, I···M
+; also listed are the NBO delocalization energies associated with the charge transfer from the nitrogen atom lone pair into the anti-lone pair orbital of the metal ion, n
N → lp*
M+. Specifically, regarding the E
2 values of the N···M
+ interactions,
Table 7 reveals the involvement of primarily one of the three nitrogen atoms in the ligand. The participation of the other two nitrogen atoms tends to increase with the size of the metal ion, which brings about a reduction in the corresponding N···M
+ distances. Accordingly, the percent contribution to the total E
2 of the N···M
+ interactions for the most involved nitrogen decreases as 100% < 93% < 76% < 72% for Li
+, Na
+, K
+, and Rb
+, respectively. Upon comparison with the E
2 values for each of the three halogen bonds in
Table 3, it is immediately apparent that one of them has vanished (E
2 values of 0.00 kcal/mol). Of the two C-I···N halogen bonds remaining, one has been strengthened while the other has been weakened significantly. It is worth noting that the weakening of the halogen bond occurs to a larger extent than the strengthening of the other halogen bond. The actual difference depends on the metal ion. Accordingly, the largest difference is seen for Li
+, with an E
2 increase of about 6% in one of the halogen bonds and a decrease of about 47% for the other one. The smallest difference is seen for Na
+, with an increase of about 44% and a decrease of 47% for the pertinent halogen bonds. The results for K
+ and Rb
+ are more similar, with respective increases in E
2 of 28% and 23%. The corresponding decreases in E
2 for K
+ and Rb
+ are 49% and 47%, respectively. Thus, these results indicate that the participation of the nitrogen atom in binding the metal ion produces an overall weakening of the halogen-bonded network, though the effect is different for each of the three C-I···N interactions in the network. Regarding the I···M
+ interactions, the respective E
2 values are smaller than those listed in
Table 3 for Li
+ and Na
+. That is, the participation of the nitrogen atoms in binding the metal ion also tends to weaken these I···M
+ interactions. The extent of the weakening effect, however, varies with the metal ion. For example, for Li
+, the E
2 value involving the iodine atom that no longer participates in halogen bonding is reduced by about 13%, while the E
2 values for the I···M
+ interactions involving the other two iodine atoms are reduced substantially, by 47% and 94%, respectively. In the case of Na
+, the largest reduction of the E
2 values is about 60%, while the smaller reductions are about 17% and 18%, respectively. In contrast, for the larger metal ions, K
+ and Rb
+,
Table 7 shows E
2 values for their I···M
+ interactions that are consistently larger than those listed in
Table 3. The percent increase of these E
2 values for K
+ follows the order of 5% < 12% < 34%. The percent changes are even more pronounced in the largest of the metal ions considered, Rb
+, following the increasing sequence 36% < 47% < 71%.
Table 8 lists the electron density value at each of the bond critical points along the path between the metal ion and each of the halogen and nitrogen atoms participating in its complexation. Based solely on bond critical points,
Table 8 reveals that just one of the three nitrogen atoms is involved in the binding of the metal ion, as no critical points were found connecting either of the other two nitrogen atoms to the metal ion. This contrasts with the NBO analysis that led to some minor contributions to the second-order delocalization energies by the other two nitrogen atoms in the ligand. It is also apparent that the ρ
N…M+ value declines with the size of the metal ion. Relative to Li
+, the magnitude of the decline in ρ
N…M+ increases as 19% < 44% < 46% for Na
+, K
+, and Rb
+, respectively. Regarding the interactions of the metal ion with each of the iodine atoms, the electron densities at each of these bond critical points, ρ
C-I…M+, shown in
Table 8, are generally smaller than those listed in
Table 4 for the complex involving only this type of metal ion binding interactions. That is, the participation of the nitrogen atoms in binding the metal ion weakens the I···M
+ interactions, as already made evident by the NBO analysis. The weakening of the I···M
+ interactions is not uniform, however. For example, the I···M
+ interaction involving the iodine atom displaced by the metal ion and no longer participating in the halogen bond to any significant extent is the least affected. The most affected I···M
+ interaction involves the iodine atom participating in the C-I···N halogen bond that is opposite to the N···M
+ metal binding interaction.
In addition to the bond critical point densities associated with the halogen-metal ion and nitrogen-metal ion interactions,
Table 8 shows the bond critical point densities at each of the three halogen bonds in the macrocycle. A comparison with the ρ
C-I…N values for each of these three halogen bonds in
Table 4 makes it clear that one of them has vanished or severely weakened (with negligible ρ
C-I…N values). Of the two C-I···N halogen bonds remaining, one has been strengthened, while the other has been weakened significantly. These results mirror those found based on the E
2 values for each of the three halogen bonds discussed previously. For example, the weakening of the halogen bond seems larger than the strengthening of the other halogen bond, as also indicated based on the trends in the related changes of E
2 values. Thus, these results support the notion that the participation of the nitrogen atom in binding the metal ion brings about an overall weakening of the halogen-bonded network.
2.4. Transition State Geometries and Barrier Heights
The ability of the macrocyclic ligand to bind an alkali metal ion in at least two different modes makes it relevant to find the transition state structure that links these binding modes. Once the optimized geometries of the transition state structures are found, the corresponding energy barriers that need to be overcome for the metal ion complex to transition from one binding mode to the other can be readily calculated. Accordingly, a geometry optimization was conducted to find the transition state structure linking the two binding modes for each of the alkali metal ions considered. The optimized geometries of the transition state structures are shown in
Figure 7A–D. The presence of a single imaginary frequency in each case confirms their nature as saddle points of the first order. One striking feature in
Figure 7 is the closeness between the metal ion and one of the nitrogen atoms in the macrocycle (seen by the dashed lines). It also appears that the interactions of each iodine atom with the metal ion are still present in the transition structures (shown as dashed lines).
Figure 7 shows how, as expected, the metal ion is gradually further away from the center of the macrocycle cavity as the metal ion size increases.
The energy cost associated with the complex structure transition from one mode of binding to the other is examined by calculating the Gibbs free energies of the three pertinent structures: the more stable complex binding the metal ion via both I···M
+ and N···M
+ interactions, the less stable complex binding the metal ion solely through the I···M
+ interactions, and the transition state structure linking these two stable complexes. The Gibbs free energy barrier, in kcal/mol, was calculated for each metal ion relative to the more stable complex (ΔG
1ǂ), and relative to the less stable complex (ΔG
2ǂ). In terms of the metal ion, the results shown in
Table 9 indicate that the largest ΔG
1ǂ occurs for Li
+ (8.36 kcal/mol), while for the larger metal ions, the ΔG
1ǂ values are closer to one another, between 6.1 and 7.0 kcal/mol. With respect to ΔG
2ǂ, all values are much smaller than their ΔG
1ǂ counterparts, and in the 1.6 to 1.9 kcal/mol range. The difference between ΔG
1ǂ and ΔG
1ǂ provides a convenient way to determine the relative Gibbs free energy between the complexes representing the two different modes of binding the metal ion. The results in
Table 9 show that the Gibbs free difference between these two types of complexes are not too large, in fact standing between 4.46 kcal/mol for the Rb
+ complexes and 6.46 kcal/mol for Li
+ complexes.
Table 10 displays relevant geometrical parameters for all the transition state structures: the halogen bond distances, d
C-I…N, and angles, A
C-I…N, as well as the distances from the metal ion to iodine, d
I…M+, and nitrogen, d
N…M+, respectively. These geometrical parameters are listed in
Figure 7, reading counterclockwise and starting at the uppermost halogen bond. Cross-examination with the parameters listed in
Table 1, for the less stable complexes, shows that the halogen bond distances in the transition state structures become, on average, slightly longer. These halogen bond elongations are in tandem with small reductions in the halogen bond angles. Thus, the weakening of the halogen bonds as the complex transition from the less stable binding mode to the more stable one appears to be emerging, though still far from what is noted in the more stable complex. It is also found that, on average, the d
I…M+ values in the transition state structures remain close to those in the less stable complex. These results are consistent with the transition state structures lying much closer in energy to the less stable complex, implying that their geometries are also not too far from one another. Further evidence that the transition state geometries are closer to those of the less stable complexes rather than to those of the more stable ones can be seen by cross-comparison of the d
N…M+ values with those in
Table 5. Regarding the nitrogen atom most responsible for M
+ binding, the d
N…M+ values in the transition state structures, for example, are still much longer than those in their more stable counterparts. The percent difference in d
N…M+ declines with the size of the metal ion as 46% < 39% < 32% < 30% for Li
+, Na
+, K
+, and Rb
+, respectively.
