Abstract
This work is dedicated to the study of the properties of perovskite ceramics based on lanthanum–strontium ferrite, and to the evaluation of their resistance to long-term thermal aging. As a method for obtaining perovskite ceramics, the method of solid-phase mechanochemical grinding and consequent thermal annealing of the resulting mixtures was chosen. The novelty of the study consists in the assessment of the phase transformation dynamics in lanthanum–strontium ferrite-based ceramics in relation to the annealing temperature, alongside the study of the effect of the phase composition of ceramics on the resistance to high-temperature aging, which is characteristic of the operating modes of these ceramics as materials for solid oxide fuel cells. To study the properties, the methods of scanning electron microscopy, energy dispersive analysis, and scanning electron microscopy were applied. Pursuant to the outcome of elemental analysis, it was established that no impurity inclusions appear in the ceramic structure during the synthesis, and a growth in the annealing temperature results into a decline in the grain size and a growth in their density. During the analysis of the acquired X-ray diffraction patterns, it was found that a growth in the annealing temperature above 500 °C results in phase transformations of the LaFeO3/SrFe2O4 → La0.3Sr0.7FeO3/LaSr2FeO8/La3FeO6 type, followed by structural ordering and a decline in deformation distortions with a growth in the annealing temperature. An analysis of the conductive properties of ceramics has established that the dominance of the La0.3Sr0.7FeO3 phase in the structure results in a growth in conductivity and a decline in resistance. Life tests for degradation resistance have shown that for three-phase ceramics, the rate of degradation and amorphization is significantly lower than for two-phase ceramics.
1. Introduction
One of the promising directions in the transition from traditional energy sources to alternative ones are methods for generating energy from hydrogen using fuel cells based on proton- or oxygen-conducting membranes or solid fuel oxide cells (SOFCs) [1,2,3,4]. Moreover, when it comes to using high-temperature SOFC elements based on oxygen-containing membranes or ceramics, the operating temperature at which acceptable conductivity values are achieved is more than 700 °C, which results in high heat release, alongside a long start-up time [5,6]. Moreover, an essential factor influencing the use of such structures in the fuel cycle is the preservation of their stability and sustainability during operation for a long time (40,000–50,000 h) [7,8,9].
Perovskite ceramics based on lanthanum–strontium ferrite [10,11,12] are among the materials considered for the prospect of using materials for high-temperature SOFCs. Interest in these structures is owing to their thermodynamic stability in redox processes, which makes it possible to use them as SOFC electrode materials. However, despite the great prospects for their application in this direction, there are several shortcomings that limit their application. One of the key disadvantages is the high values of thermal and chemical expansion, which in most cases results in thermomechanical incompatibility of electrodes with solid electrolyte ceramics [13,14,15]. Moreover, an essential factor limiting the use of perovskites as the basis for electrode materials of SOFC cells is the lack of information on the mechanisms of degradation and corrosion of these structures during their operation. This is primarily owing to the fact that most research in this area is aimed at studying the mechanisms of energy production, reducing operating temperatures in order to reduce energy and resource costs, and the effect of various additives in the composition of perovskite to increase conductivity and thermodynamic characteristics. However, the issue of structure resistance to degradation during operation remains open in most cases, but knowledge of corrosion mechanisms is no less significant than all other performance and energy efficiency data. Understanding the degradation mechanisms can help predict the behavior of materials during long-term operation, as well as avoid the risks pertaining to the rapid degradation and amorphization of perovskite properties, which will lead to a decline in conductivity and mechanical degradation [16,17,18]. As is known, the processes of operation of SOFC elements are accompanied by redox reactions occurring at elevated temperatures, which results in an alteration in the oxidation degree of chemical elements and the electron density in the material. Long-term redox processes can lead to additional distortions and deformations of the crystal lattice in the structure and corrosion acceleration and material degradation. As a rule, degradation in consequence of such processes is accompanied by the formation of regions of disorder and amorphous inclusions, the presence of which in the structure results in a sharp deterioration in the properties of materials, up to their complete destruction. Moreover, as is known, in most cases, SOFC elements based on perovskites have a structure of porous ceramics, with many grains and interfaces, the presence of which in the process of degradation can lead to accelerated destruction of the material, owing to the accumulation of defects near the interfaces with consequent formation of microcracks [19,20,21,22]. All this can lead to the destabilization of the performance of electrode materials and their failure ahead of schedule.
The choice of double perovskites based on lanthanum–strontium ferrite as an object of study is owing to their unique mixed oxygen-ion and electronic conductivity, which, together with good mechanical and transport characteristics, make these structures promising for use not only as electrode materials for SOFC elements, but also as materials for oxygen membranes, oxygen accumulators, etc.
As is known, the structure of perovskites based on lanthanum–strontium ferrite (A1-x(BxFe)2O6 has a strong dependence on stoichiometry, particularly on the resulting deficit in the A-sublattice, which can lead not only to morphological features (alterations in grain size, porosity), but also oxygen stoichiometry. Another major factor is the alteration in the deficiency in the A sublattice, which can have both positive and negative effects on the transport, thermodynamic, and structural properties of perovskites [23,24,25,26]. In this regard, the purpose of this work is to study the processes of structural and phase formation of perovskite ceramics in relation to the annealing temperature, followed by studying the effect of structural properties on the conductive properties of ceramics.
2. Results and Discussion
The phase composition of the synthesized perovskite ceramics was studied using the method of X-ray phase analysis, the results of which are shown in Figure 1. The overall picture of the presented X-ray diffraction patterns in relation to the annealing temperature implies processes pertaining to an alteration in the phase composition of ceramics [27,28,29,30], which are expressed in an alteration in the intensity and position of diffraction reflections, as well as the appearance of new reflections with a growth in the annealing temperature. These alterations in the phase composition indicate that the phase transformation processes in the composition of perovskite ceramics have a pronounced dependence on the annealing temperature.
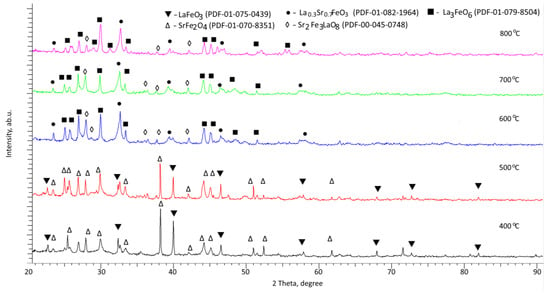
Figure 1.
Results of X-ray diffraction of the studied perovskite ceramics.
Analysis of X-ray diffraction patterns of the studied perovskite ceramics annealed at a temperature of 400 °C revealed the presence of two phases in the sample structure: cubic LaFeO3 (PDF-01-075-0439) and monoclinic SrFe2O4 (PDF-01-070-8351), the ratio of the contributions of which is close to 50:50. The procedure for determining the contribution of each phase was performed using a standard sample by calculating the weight contributions of the diffraction reflections of each phase on the diffraction pattern, followed by an assessment of their contribution in comparison with the rest of the phases.
Moreover, the shape of the diffraction reflections has a clearly broadened asymmetric shape, suggesting the presence of structural distortions and deformations pertaining to the production processes. The presence of two phases, in turn, is owing to the phase formation processes caused by mechanochemical synthesis and consequent thermal annealing. Moreover, the greatest distortion of the structural parameters is observed for the monoclinic SrFe2O4 phase, which may be owing to the presence of disordered impurity inclusions or highly distorted regions.
A growth in the annealing temperature of the samples to 500 °C does not result in the appearance of any new diffraction reflections, suggesting the absence of phase transformations in ceramics at a given annealing temperature. The main alterations observed for these samples are pertaining to an alteration in the shape of diffraction reflections, suggesting structural ordering and an alteration in their intensity, and, consequently, phase contributions, suggesting an alteration in the ratio of established phases. Thermal annealing at 500 °C results in a growth in the contribution of the cubic LaFeO3 phase from 55 to 65% and a decline in the monoclinic SrFe2O4 phase contribution. Moreover, the analysis of the structural parameters for these phases implies their ordering and a decline in structural distortions and deformations.
During annealing of the obtained samples at a temperature of 600 °C, the X-ray diffraction patterns of the studied samples showed the appearance of new reflections characteristic of phases: rhombic La0.3Sr0.7FeO3, and two orthorhombic LaSr2FeO8 and La3FeO6 phases, among which the dominant contribution belongs to the La0.3Sr0.7FeO3 phase (more than 70%). Pursuant to the data obtained, it was found that at an annealing temperature of 600 °C, a phase transformation of the LaFeO3/SrFe2O4 → La0.3Sr0.7FeO3/LaSr2FeO8/La3FeO6 type is observed with the dominance of phases containing all the elements of the components used. Moreover, a growth in the annealing temperature to 700 °C leads, as in the case of a growth in temperature from 400 °C to 500 °C, to the ordering of structural parameters pertaining to their decline, indicating an alteration in the concentration of structural distortions and deformations. A similar picture is also observed for the case of annealing at a temperature of 800 °C, for which the appearance of new reflections was not established, and the main alterations pertained to structural ordering and a growth in the contribution of the rhombic La0.3Sr0.7FeO3 phase.
Thus, the general observed alterations indicate that an alteration in the annealing conditions results in an alteration in the phase composition owing to phase transformations at an annealing temperature above 500 °C, followed by structural ordering and the dominance of the rhombic La0.3Sr0.7FeO3 phase. Moreover, phase transformations are also accompanied by a decline in the spatial syngony from the cubic Pm-3m characteristic of the dominant LaFeO3 phase in the temperature range of 400–500 °C to the diamond-shaped R-3c characteristic of the dominant La0.3Sr0.7FeO3 phase. The formation of this phase occurs due to the decomposition of the SrFe2O4 phase and partial replacement of lanthanum ions by strontium ions in the LaFeO3 structure, accompanied by its rearrangement, alongside the formation of two orthorhombic phases in the form of impurity inclusions, the content of which does not surpass 20–25%.
Figure 2 demonstrates the outcome of X-ray phase analysis in the form of diagrams of the phase content in the composition of ceramics in relation to the annealing temperature. As is evident from the data provided, the main alterations in the phase composition in the form of transformations of the LaFeO3/SrFe2O4 → La0.3Sr0.7FeO3/LaSr2FeO8/La3FeO6 type occur at an annealing temperature of 600 °C. When it comes to a growth in annealing temperatures from 400 °C to 500 °C and from 600 °C to 800 °C, the phase ratio alters, which was described above in more detail.
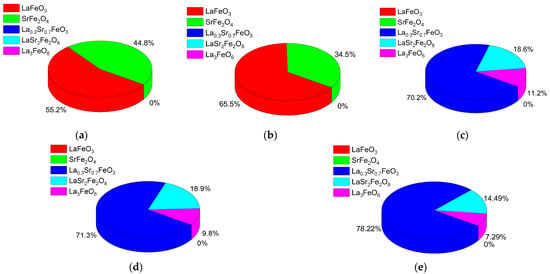
Figure 2.
Outcome of phase analysis of the studied ceramics in relation to the annealing temperature: (a) 400 °C; (b) 500 °C; (c) 600 °C; (d) 700 °C; (e) 800 °C.
At annealing temperatures below 600 °C, the dominance of the LaFeO3/SrFe2O4 phases is observed, pursuant to X-ray phase analysis data, while at an annealing temperature of 600 °C and above, a phase transformation of the LaFeO3/SrFe2O4 → La0.3Sr0.7FeO3/LaSr2FeO8/La3FeO6 type occurs, which, pursuant to energy dispersive analysis data, is accompanied by a decline in the oxygen content by 3–4 at.%. A decline in the oxygen contribution results in a redistribution of the Sr:Fe:La weight contributions, with a slight increase in the iron content.
Pursuant to the obtained data of X-ray phase analysis, the formation of the main phases from the initial components with annealing temperature variation can be written using Chemical Reactions (1)–(5):
2La(NO3)3 + Fe2(SO4)3 → 2LaFeO3 + 6NO2 + 3SO2 + 9O2
2SrCO3 + Fe2(SO4)3 → 2SrFe2O4 + 2CO2 + 3SO2
4SrCO3 + 2La(NO3)3 + Fe2(SO4)3 → 2LaSr2FeO8 + 4CO2 + 6NO2 + 9O2
6La(NO3)3 + Fe2(SO4)3 → 2La3FeO6 + 3SO2 + 18NO2 + 6O2
14SrCO3 + 6La(NO3)3 + 5Fe2(SO4)3 → 10(La0.3Sr0.7)2FeO4 + 14CO2 + 18NO2 + 15SO2 + 13O2
Moreover, Reactions (1) and (2) proceed at annealing temperatures of 400–500 °C, and Reactions (3)–(5) are typical for the annealing temperature range of 600–800 °C. It should also be noted that the main dominant phase at annealing temperatures above 500 °C becomes the La0.3Sr0.7FeO3 phase, the dominance of which is owing to the phase formation processes during thermal heating, as well as the associated processes of partial replacement of strontium ions by lanthanum ions.
The reproducibility of the results in order to refine the technique for obtaining ceramics for SOFC materials was performed by repeating the synthesis procedures 10 times. In all cases, application of chosen conditions of mechanochemical synthesis and consequent thermal annealing lead to the same results of the phase composition and electrophysical parameters. Moreover, the error of the phase composition (the ratio of the contributions of the phases) is no more than 1–2%, which is within the permissible limits in the manufacture of SOFC.
Table 1 presents the data on alterations in the structural parameters of the studied perovskite ceramics in relation to the sintering temperature, calculated on the basis of the acquired X-ray diffraction patterns.

Table 1.
Structural parameter data.
The overall form of alterations in the structural parameters for each established phase implies structural ordering with a growth in the annealing temperature, which is expressed in a decline in the crystal lattice parameters and its volume. A decline in the parameters and volume of the crystal lattice implies a decline in the crystal structure deformation and a compaction of ceramics. Moreover, the alteration in parameters can be owing to the structural ordering (crystallinity degree) processes, which pertain to a decline in the areas of disorder and partial removal of structural distortions and deformations in consequence of phase transformations.
Figure 3 demonstrates the results of alterations in the structural ordering degree (crystallinity degree) and density of ceramics in relation to the annealing temperature. The crystallinity degree was estimated by a comparative analysis of the areas of diffraction reflections and a halo characteristic of amorphous structure disordered. The density of ceramics was determined from the analysis of alterations in the structural parameters of the studied samples.
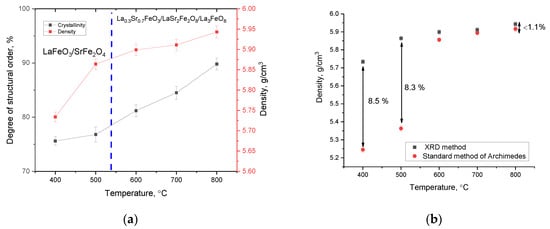
Figure 3.
(a) Outcome of alterations in the structural ordering and density of ceramics in relation to the annealing temperature; (b) outcome of a comparative analysis of the density of ceramics calculated based on X-ray phase analysis data and measured using the standard method of Archimedes.
General trends in the structural ordering degree, as well as in the density of ceramics, implies that a growth in the annealing temperature, which at the first stage (temperature range 400–500 °C) results in a decline in oxygen in the composition of ceramics, is accompanied by a sharp increase in the structural ordering degree, which is characteristic of a decline in deformation distortions within the structure. In fact, as shown by elemental and phase analysis data, an annealing temperature of 400–500 °C is not sufficient to initiate phase transformation processes, which only results in structural ordering and partial displacement of oxygen from the ceramic structure with the formation of oxygen vacancies. Moreover, for this range, the density of ceramics alters insignificantly, since no phase transformations have been established, and the alteration in density for these annealing temperatures is only owing to structural ordering. Comparative analysis of the density of ceramics (see Figure 3b), nominal (the results of density estimation based on the data of alterations in the crystal lattice parameters) and measured using the standard method of Archimedes (sample immersion method), revealed good agreement between the results for samples annealed at temperatures above 600 °C (difference less than 1.1%), and a strong discrepancy in the density data for samples annealed at temperatures below 600 °C (more than 8.5%). Such a difference in density data for samples annealed at a temperature below 600 °C may be owing to the presence of a high oxygen concentration, alongside unformed phases, which results in a decline in the density of ceramics. In the case when a phase transformation of the LaFeO3/SrFe2O4 → La0.3Sr0.7FeO3/LaSr2FeO8/La3FeO6 type occurs, the ceramics are compacted, as well as there being small alterations in the elemental composition, suggesting the stabilization of the structure.
Phase transformations occurring in ceramics at an annealing temperature of 600 °C lead to a significant elevation in density owing to the dominance of the La0.3Sr0.7FeO3 phase in the structure, as well as the structural ordering degree growth. Moreover, a further increase in the annealing temperature above 600 °C results in a smoother alteration in the structural ordering degree, the alteration in which is owing to the redistribution of phases and a growth in the contribution of the La0.3Sr0.7FeO3 phase in the composition of ceramics.
Figure 4 demonstrates the results of a study of the morphological features of the synthesized perovskite ceramics derived using the scanning electron microscopy method.
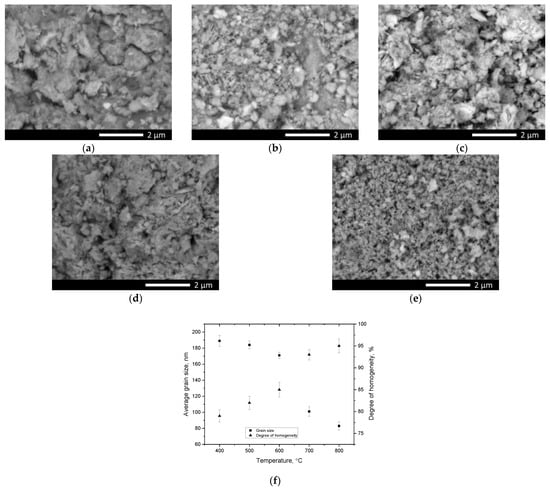
Figure 4.
Results of morphological studies of perovskite ceramics: (a) 400 °C; (b) 500 °C; (c) 600 °C; (d) 700 °C; (e) 800 °C; (f) Results of alterations in the average grain size of perovskite ceramics in relation to the annealing temperature.
As is evident from the displayed SEM image data, a growth in the annealing temperature of the samples results in significant alterations in the morphological features of the synthesized perovskite ceramics, which consist in both an alteration in the shape of the grains and their sizes, followed by the formation of a fine feather structure, a dendrite-like shape at annealing temperatures above 700 °C. Such an alteration in the grain morphology can be owing to the processes of phase transformations and alterations in the elemental composition during thermal annealing. An analysis of the shape and size of the grains of the studied perovskite ceramics in relation to the annealing temperature revealed that a growth in the sintering temperature results in alterations not only in the shape and size of the grains, which can be owing to the effect of phase transformations. Thus, from the data provided in Figure 4f, which were obtained by calculating the average grain size when analyzing the obtained SEM images using direct calculation of grain diameters in the ImageJ program code, it can be seen that with a growth in the annealing temperature above 600 °C, the grain size decreases from 150–170 nm to 80–90 nm. Such an alteration in grain size can be attributed to phase transformations, as well as the effect of grain crushing upon phase alteration. Moreover, smaller grains lead to the formation of a dendrite-like structure, with many grain boundaries, which can also affect the alteration in the resistance of ceramics to external influences, and a developed surface and small sizes lead to a growth in the specific surface area. The analysis of the degree of grain size homogeneity revealed that a decline in size in consequence of thermal annealing and, as a consequence, phase transformations, results in a growth in grain size uniformity.
Figure 5 illustrates the energy-dispersive analysis results of the studied samples of perovskite ceramics, reflecting the alteration in the elemental composition of the samples in relation to the annealing temperature. As is evident in the displayed spectra, only peaks characteristic of the main elements La, Fe, Sr, and O are observed; no other peaks characteristic of impurity elements were found in the entire measured annealing temperature range.
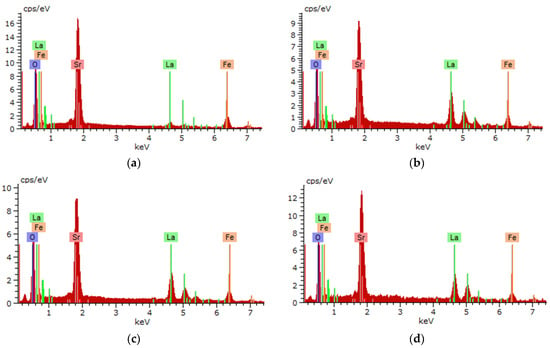
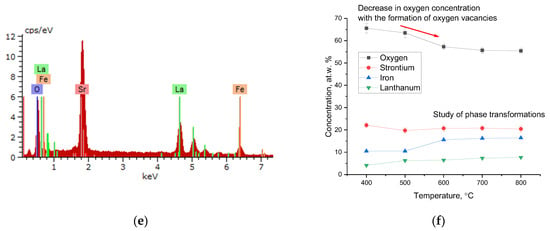
Figure 5.
EDA spectra of the studied samples in relation to the annealing temperature: (a) 400 °C; (b) 500 °C; (c) 600 °C; (d) 700 °C; (e) 800 °C; (f) data on alterations in the elemental composition of ceramics.
Regarding the samples annealed at a temperature of 400 °C, pursuant to the data from the energy-dispersive analysis, a sufficiently high oxygen content was established, which may be due to thermal structure formation processes. A growth in the annealing temperature to 500 °C results in a decline in the oxygen concentration, which may be accompanied by either phase transformations or a growth in the concentration of oxygen vacancies (Vo). An annealing temperature growth above 600 °C does not result in significant alterations in the ratio of elements, suggesting the stabilization of the elemental composition of ceramics. The isotropy of the distribution of all observed elements in the structure is illustrated in Figure 6, made using the mapping method.
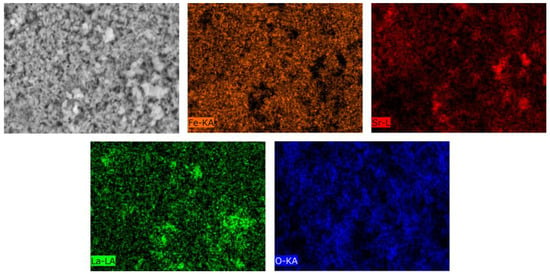
Figure 6.
Outcome of element mapping in a sample annealed at a temperature of 800 °C.
As is evident from the data provided on the elemet distribution in the composition of ceramics, the formation of individual grains containing a grown content of strontium and lanthanum is observed, which may be caused by the formation of double phases or impurity inclusions.
Figure 7 demonstrates the results of cyclic voltammetry, which reflect the conductive properties of the synthesized perovskites in relation to the annealing temperature and phase composition. The general view of the presented cyclic current–voltage characteristics in relation to the annealing temperature of the samples implies a growth in the conductivity of ceramics, the alteration in which pertains to the processes of phase transformations and an alteration in the structural ordering degree. Moreover, the obtained dependencies of the current–voltage characteristics in the form of hysteresis loops indicate the presence of oxygen vacancies in the structure of ceramics annealed at a temperature of 400–600 °C.
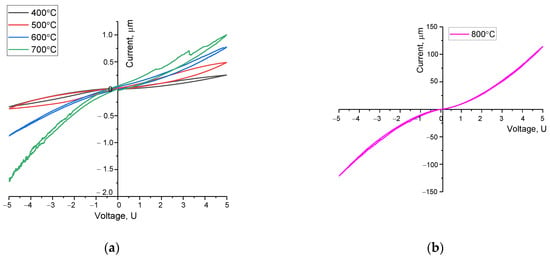
Figure 7.
Graphs of current–voltage characteristics of the studied perovskite ceramics. (The measurements were performed at a sample temperature of 25 °C, in an air atmosphere. A two-contact cell with copper electrodes was used for measurements): (a) samples annealed at a temperature of 400–700 °C; (b) samples annealed at a temperature of 800 °C (this current–voltage characteristic is presented separately since the range of its alteration is two orders of magnitude greater than similar alterations obtained at annealing temperatures of 400–700 °C).
As is evident from the data provided, an alteration in the annealing temperature, causing structural ordering and phase transformations, results in a growth in the slope of the current–voltage characteristics, suggesting a growth in conductivity. Moreover, an alteration in the structural ordering degree at annealing temperatures, in addition to a growth in the concentration of oxygen vacancies for samples annealed at a temperature of 500 °C, results in a growth in the hysteresis loop shape, suggesting the influence of oxygen vacancies on the conductivity of ceramics. In this case, for structures annealed at temperatures of 400–500 °C, pursuant to X-ray diffraction analysis, the structure of defective perovskite with a statistical distribution of oxygen vacancies is characteristic, which results in low conductivity of ceramics. The very nature of current–voltage hysteresis loops is characteristic of the absorption mechanisms of redox reactions with voltage alterations.
In this case, phase transformations of the LaFeO3/SrFe2O4 → La0.3Sr0.7FeO3/LaSr2FeO8/La3FeO6 type, which occur at an annealing temperature above 600 °C, lead to a decline in the shape of the hysteresis loop, as well as a growth in the slope of the curve of the current–voltage characteristic, indicating a semiconductor type of conductivity. When it comes to samples annealed at a temperature of 700 °C, clear anodic peaks are observed, which reflect the mechanisms related to the processes of structural transformations, which results in a growth in conductivity.
The formation of a three-phase structure in ceramics with their consequent ordering and a growth in the crystallinity degree results in a growth in the conductive properties, and in the case of samples annealed at a temperature of 800 °C, there is practically no hysteresis on the current–voltage curve, and an alteration in the current–voltage characteristic curve in the I-U coordinates by two orders of magnitude higher than when it comes to samples annealed at lower temperatures. Such alterations in conductivity can be owing to an alteration in the conductivity mechanisms and the consequent dominance of the oxygen-ion type over the electron one, owing to phase transformations accompanied by a rearrangement of the crystal structure and a decline in the degree of statistical distribution of defects and vacancies in the perovskite structure. Moreover, a growth in conductivity for samples annealed at a temperature above 600 °C is owing to a decline in the oxygen concentration in the composition of ceramics (pursuant to the data of energy-dispersive analysis), resulting in a decline in oxygen vacancies and structural ordering (see data in Figure 6a). The conductivity is also affected by an alteration in the symmetry of the structure during phase transformations caused by thermal annealing.
Frequency dependencies of permittivity and tangent loss of synthesized samples were measured at room temperature by the impedance spectroscopy method in the frequency range 2–220,000 Hz. Before the calculation of permittivity, silver paste electrodes were applied to the surface of the samples. The results are shown in Figure 8. The permittivity spectra revealed that the permittivity value of samples in the measured frequency range with low annealing temperature (400, 500 °C) vary to a lesser extent than when it comes to samples with temperatures of 600–800 °C. The proposed frequency dispersion at low frequencies (2–1000 Hz) is connected with interface polarization between relatively conductive phase La0.3Sr0.7FeO3 [31,32] and dielectric phases LaSr2FeO8 and La3FeO6. In addition, the mechanism as interface polarization between conductive grains and grain boundaries or polarons jumping [33] can contribute to permittivity frequency dispersion. With decreasing resistivity, both low frequency and high frequency permittivity increase, which is connected with phase composition alteration and crystallinity degree. The observed loss tangent spectra show pronounced dispersion and for samples with an annealing temperature of 400 °C, frequency dispersion characterized by relaxation peak. The tan δ value for samples with 600–800 °C annealing temperature differs insignificantly that confirms the stability of ceramics at annealing temperatures above 600 °C.
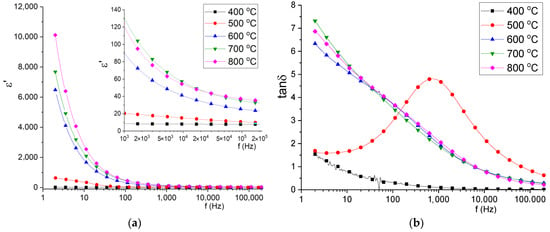
Figure 8.
The frequency dependencies of permittivity (a) and tangent loss (b) of obtained samples.
The Nyquist plots Z’’(Z’) of obtained samples at room temperature are shown on the Figure 9. By plotting Z’’(Z’) dependencies, it is possible to evaluate dielectric response from AC sinusoidal perturbation of materials with complex structure. The shape of curves is represented by an undone semicircle with “tails” from the low frequency region. In the inset of Figure 10, the Z’’(Z’) curve of the 400 °C sample is outlined because of high impedance value. The analysis of impedance Nyquist curves revealed that with the decrease of specific resistivity, real and imaginary parts of complex impedance also decrease. Moreover, in the samples with annealing temperature 600–800 °C, the low frequency “tail” disappears, which can indicate that AC current flows mostly through phases with low resistance (i.e., La0.3Sr0.7FeO3). When ceramic material consists of insulators and relatively conductive phases, undone semicircles appear on the Nyquist plots because of existing conduction mechanisms with different relaxation times. When the semiconducting phase becomes dominant in the ceramic composition, the Z’’(Z’) arc turns into more like a complete semicircle which can be seen from obtained Nyquist plots.
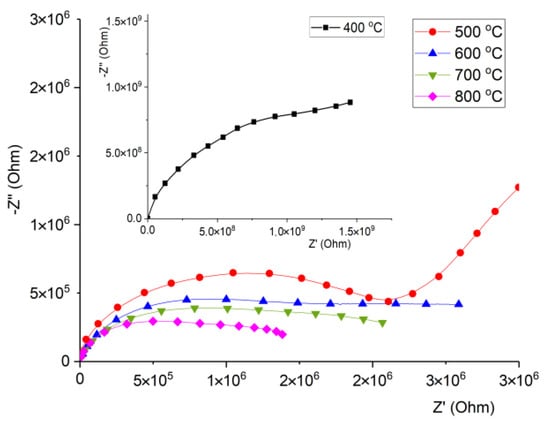
Figure 9.
Nyquist plots Z’’(Z’) measured at room temperature.
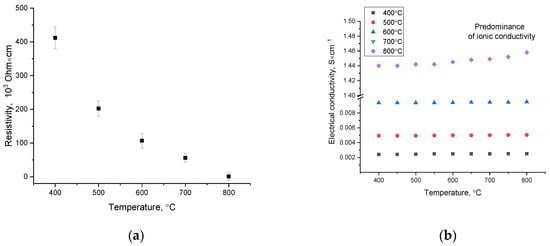
Figure 10.
(a) Outcome of alterations in the resistivity value for the investigated perovskite ceramics; (b) outcome of alterations in the specific conductivity value for the studied ceramics.
Figure 10a demonstrates the outcome of alterations in the resistivity value measured at room temperature for all the studied ceramic samples. The general trend in the alteration in resistivity implies a significant effect of alterations in the phase composition of ceramics on the conductive properties. Moreover, the formation of La0.3Sr0.7FeO3/LaSr2FeO8/La3FeO6 phases in the structure of ceramics with their consequent ordering at an annealing temperature of 800 °C results in a decline in the resistivity to 0.69 × 10³ Ohm × cm, which is three times less than the resistivity for LaSrFeO4 (ρ = 2.4 × 10³ Ohm × cm [34]). This behavior of the alteration in the resistance value is caused not only by the phase composition alteration owing to the dominance of the La0.3Sr0.7FeO3 phase in the structure of ceramics, which provides a growth in conductivity, but also by structural ordering, causing an alteration in the charge transfer mechanisms.
In this case, an alteration in the phase composition, as well as a growth in the density of ceramics, results in a growth in the electron mobility owing to their weak localization and a weakening of antiferromagnetic interactions pertaining to a growth in the concentration of lanthanum in the structure.
Figure 10b demonstrates the outcome of alterations in the specific conductivity of the studied ceramics in relation to the measurement temperature. The general form of the dependences derived for samples annealed at temperatures of 400–700 °C implies the stability of conductivity values in almost the entire measured temperature range, the choice of which is determined by the operating temperatures of solid oxide elements. A small increase in conductivity values at measurement temperatures above 600 °C may be owing to the emergence of ionic conduction mechanisms, with the dominating mechanism of conduction being hole-type electron conduction. When it comes to a sample annealed at a temperature of 800 °C, a sharp increase in conductivity is observed (almost by two orders of magnitude), while with a growth in the measurement temperature of conductivity, a growth in the slope of the curve describing the alterations in values is observed, suggesting a growth in the contribution of the ionic conductivity mechanism. An analysis of the ionic transfer numbers for the studied samples revealed that all the studied samples have mixed oxygen-ion and hole conductivity; the contribution of ionic conductivity for samples annealed at a temperature of 400–700 °C is 15–20%, while samples annealed at a temperature 800 °C with a characteristic dominance in the composition of the La0.3Sr0.7FeO3 phase result in a growth in the contribution of ionic conductivity to 30–35%. Such an alteration may be owing to the displacement of impurity phases, alongside an alteration in the structural ordering degree, which results in a decline in structural disorder and a decline in the concentration of defects.
One of the significant characteristics of solid oxide elements in evaluating their application is the preservation of the stability and resistance of the ceramic material against long-term thermal effects, which can lead to the initialization of corrosion and amorphization processes. To determine resistance to high temperature degradation, the synthesized ceramics were thermally annealed at 700 °C temperature for 500 h. The choice of thermal annealing conditions is closest to the operating conditions of ceramics as solid fuel oxide elements. Annealing was performed in a muffle furnace with an air atmosphere; after every 100 h of annealing, some of the samples were removed for measurement by X-ray diffraction to determine the crystallinity degree alteration and identify the appearance of impurity phases and to measure the current–voltage characteristics to determine alterations in the conductive properties of ceramics.
Pursuant to the analysis of the obtained X-ray diffraction patterns, the main structural alterations in the samples subjected to thermal annealing pertain to partial amorphization and structural disorder, which may be due to the effects of thermal expansion of the crystal lattice and its consequent deformation. Moreover, the appearance of any new diffraction reflections was not established, suggesting a high stability of the synthesized ceramics to the processes of phase degradation pertained to the phase composition alteration.
Figure 11a demonstrates the outcome of variation in the structural ordering degree (crystallinity degree) of the samples in relation to the time of thermal annealing. Assessment of the alteration in the crystallinity degree after prolonged thermal annealing, which is characteristic of the processes of high-temperature aging and degradation, was performed by measuring the X-ray diffraction patterns of the studied samples and then determining the variation in the crystallinity degree. The decline in the crystallinity degree during aging is due to deformation processes and the formation of regions of amorphous inclusions in the volume of ceramics, the presence of which has a negative effect on both the structural stability of ceramics and their conductive properties.
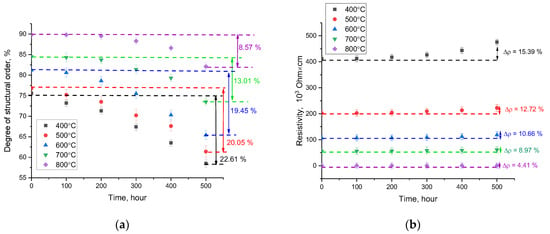
Figure 11.
Outcome of the degradation of ceramic properties as a function of the annealing time: (a) alteration in the crystallinity degree; (b) alteration in the resistivity value.
As is evident from the data provided, the main alterations in the degree of ordering for the studied ceramics begin after 100 h of testing; however, the nature of degradation and amorphization has a strongly pronounced dependence on the phase composition of the ceramics. For two-phase ceramics, the structural disorder degree after 500 h of annealing was more than 20%, while for three-phase ceramics with a highly ordered structure, the degradation degree was no more than 15%, and when it comes to samples annealed at a temperature of 800 °C, the degradation degree was less than 8%.
Figure 11b demonstrates the outcome of alterations in the resistivity of ceramics, reflecting the high-temperature degradation of the conductive properties of ceramics. An analysis of the dependencies derived revealed that three-phase ceramics with a high structural ordering degree are the most resistant to thermal degradation. Moreover, the maximum alteration in resistivity after 500 h of annealing for three-phase ceramics is more than three times less than for two-phase ceramics derived at an annealing temperature of 400–500 °C.
The obtained results of high-temperature aging for the studied ceramics revealed that the transition from two-phase to three-phase ceramics, accompanied by an alteration in the degree of structural ordering and perfection of the crystal structure, results in a growth in the resistance of ceramics to amorphization and structural degradation. Moreover, the difference in stability values is more than twice, suggesting a growth in the resistance to degradation during high-temperature aging. Similar conclusions can be drawn for these alterations in the ceramic resistance values during high-temperature aging. A growth in the time of high-temperature aging results in a growth in the resistivity, suggesting that impurity inclusions (usually amorphous) are formed in the structure, the presence of which reduces the conductivity of ceramics. Moreover, in the case of three-phase ceramics, the observed increase in resistance to structural degradation results in a growth in resistance to a decline in conductive characteristics.
The obtained results on the resistance of ceramics to high-temperature aging and degradation will make it possible to predict their behavior during operation under similar conditions when used as anode materials for SOFCs. As a rule, such ceramics are used in the manufacture of SOFC elements operating at elevated temperatures (500–800 °C) [35,36,37,38]. In this regard, the obtained data on the behavior of alterations in the conductive characteristics and the crystallinity degree are significant characteristics that make it possible to determine the efficiency of using ceramics for SOFCs [39,40].
3. Experimental Part
Obtaining samples for further research was performed using the method of mechanochemical synthesis. For the synthesis of perovskite ceramics, the chemical reagents La(NO3)3, FeSO4 × 7H2O, SrCO3, manufactured by Sigma Aldrich (St. Louis, Missouri, USA), were used. The chemical purity of the components used for the synthesis was 99.95%. The stoichiometric ratio of the initial components was chosen as follows: La(NO3)3:FeSO4 × 7H2O:SrCO3 → 1 mol:1 mol:1 mol.
Samples were weighed in an equal stoichiometric ratio of all components used. After weighing, the resulting mixtures were placed in a tungsten carbide beaker used for mechanochemical synthesis in a PULVERISETTE 6 classic line planetary mill (Fritsch, Idar-Oberstein, Germany). Grinding was performed at a grinding speed of 250 rpm for 30 min. After that, the obtained samples were annealed in a SNOL muffle furnace (SNOL-TERM, St. Petersburg, Russia) in the temperature range of 400–800 °C with increments of 100 °C for 5 h, and then cooling together with the furnace for 24 h. The choice of the temperature range for annealing is owing to the possibility of obtaining structures of a complex multiphase composition, the presence of which can provide strengthening effects and affect the resistance properties of perovskite ceramics to various extrinsic effects. Moreover, as is known, single-phase ceramics of this type are obtained at temperatures in the range of 900–1500 °C [27,28,29,30].
The obtained samples were studied by scanning electron microscopy and energy dispersive analysis to establish the morphological features of the synthesized perovskite ceramics and to determine the isotropy of the distribution of the elemental composition in the volume. These techniques were implemented on a Hitachi TM3030 scanning electron microscope (Hitachi, Tokyo, Japan) equipped with an Oxford Instruments (Bruker, Berlin, Germany) energy dispersive analysis attachment.
Phase composition and structural parameters were determined through the acquired X-ray diffraction patterns of the studied samples and their consequent comparative analysis with card values from the PDF-2(2016) database. The diffraction patterns were acquired on a D8 Advance ECO X-ray diffractometer (Bruker, Berlin, Germany). Structural parameters were specified through the DiffracEVA v.4.2 software, making it possible to determine not only the phase composition of the studied ceramics, but also to refine the crystal lattice parameters by comparing the observed reflection positions with reference values for each phase. The weight contributions of each phase were determined considering the use of a standard corundum sample when it was added to the test sample with a content of no more than 10% for taking X-ray diffraction patterns. After that, the calculation was performed considering the weight contribution of corundum diffraction reflections on the obtained diffraction patterns, followed by determination of the contributions of each phase.
The conductive properties were measured using a PalmSens v.4. potentiostat in the cyclic voltammogram measurement mode. The measurement was performed using two-contact copper electrodes equal to the area at room temperature 25 °C. Measurement of the cyclic voltammograms of the samples was performed by placing pressed ceramic samples 10 mm in diameter and 1 mm thick between two copper plates polished to a mirror finish to avoid the formation of an oxide film on the electrode surface. Before each measurement, the electrodes were polished. The measurement was performed in the voltage variation mode from −5 to 5 V, with a step of 0.05 V, and the stabilization time before the start of measurements was 30 sec. Ceramics samples for measurements of current–voltage characteristics were pressed in the form of tablets, using a mold that allows obtaining samples of equal thickness and a certain diameter. Before all measurements, the samples pressed into tablets were polished to remove surface roughness. For measurements, silver paste was applied to the surface of the samples to create a contact surface.
The obtained cyclic voltammograms were analyzed in a special program code PSTrace 5.9.
The resistance value was determined by impedance spectroscopy using an RLC E7-22 impedance meter at a frequency of 1 kHz.
Measurement of electrical conductivity was determined using a two-contact method in the temperature range of 400–800 °C for all samples under study. The choice of temperatures is owing to the operating modes of solid oxide elements. For measurements, a HIOKI IM 3570 Impedance Analyzer (HIOKI, Tokyo, Japan) instrument was used in the frequency range 100–100,000 Hz.
The stability of structural parameters and phase composition due to long-term high-temperature aging was determined during experiments on long-term annealing at a temperature of 700 °C for 500 h. After every 100 h, X-ray diffraction patterns of the studied samples were taken. The structural parameters were determined based on them. The alteration of structural parameters implies the thermal expansion of the crystal lattice and the structural degradation degree.
4. Conclusions
Results of the study of properties of perovskite ceramics based on lanthanum–strontium ferrite and their long-term thermal aging resistance were studied in this paper.
X-ray phase analysis revealed that the annealing temperature growth above 500 °C results in the phase transformations of the LaFeO3/SrFe2O4 → La0.3Sr0.7FeO3/LaSr2FeO8/La3FeO6 type, followed by the three-phase ceramic formation with the dominating orthorhombic phase La0.3Sr0.7FeO3. Moreover, a further increase in the annealing temperature does not cause new phase transformations, but is accompanied by processes of structural ordering and a decline in deformation distortions with the annealing temperature growth above 600 °C.
During the tests of perovskite ceramics for resistance to long-term thermal heating, comparable to operating conditions, it was found that the most stable samples are three-phase ceramics, in which the rhombic La0.3Sr0.7FeO3 phase dominates. Moreover, amorphization and disordering of the structure of ceramics caused by long-term thermal annealing are due to thermal broadening of the crystal structure, resulting in its deformation, and with prolonged exposure to the development of disordered regions, as evidenced by a decline in the intensity of diffraction reflections characteristic of long-range structural ordering. The increase in resistance caused by long-term thermal tests for three-phase ceramics is within acceptable values (no more than 10%), suggesting their resistance to the degradation of conductive properties.
Author Contributions
Conceptualization, D.I.S., D.B.B. and A.L.K.; methodology, M.V.Z. and A.L.K.; formal analysis, M.V.Z., D.I.S. and A.L.K.; investigation, M.V.Z., D.I.S. and A.L.K.; resources, A.L.K.; writing—original draft preparation, review, and editing, D.B.B., D.I.S. and A.L.K.; visualization, A.L.K.; supervision, A.L.K. All authors have read and agreed to the published version of the manuscript.
Funding
This research was funded by the Science Committee of the Ministry of Education and Science of the Republic of Kazakhstan (No. AP13068071).
Institutional Review Board Statement
The article was written by the stated authors who are ALL aware of its content and approve its submission. The article has not been published previously. We must note that this manuscript is original and is not being and has not been submitted for publication to other journals. No conflict of interest exists, or if such conflict exists, the exact nature must be declared. The authors declare that they have no known competing financial interests or personal relationships that could have appeared to influence the work reported in this paper. If accepted, the article will not be published elsewhere in the same form, in any language, without the written consent of the publisher.
Data Availability Statement
Not applicable.
Conflicts of Interest
The authors declare that they have no conflict of interest.
References
- Garai, M.; Singh, S.P.; Karmakar, B. Mica (KMg3AlSi3O10F2) based glass-ceramic composite sealant with thermal stability for SOFC application. Int. J. Hydrogen Energy 2020, 46, 23480–23488. [Google Scholar] [CrossRef]
- Krainova, D.A.; Saetova, N.S.; Farlenkov, A.S.; Khodimchuk, A.V.; Polyakova, I.G.; Kuzmin, A.V. Long-term stability of SOFC glass sealant under oxidizing and reducing atmospheres. Ceram. Int. 2021, 47, 8973–8979. [Google Scholar] [CrossRef]
- Nguyen, B.N.; Karri, N.K.; Mason, C.T.; Fitzpatrick, J.F.; Koeppel, B.J. A mechanistic damage model for solid oxide fuel cell ceramic materials—Part I: Constitutive modeling. Int. J. Hydrogen Energy 2022, 47, 7388–7402. [Google Scholar] [CrossRef]
- Jin, Y.; Sheng, J.; Hao, G.; Guo, M.; Hao, W.; Yang, Z.; Peng, S. Highly dense (Mn, Co)3O4 spinel protective coating derived from Mn–Co metal precursors for SOFC interconnect applications. Int. J. Hydrogen Energy 2022, 47, 13960–13968. [Google Scholar] [CrossRef]
- Setiawan, I. Progress in Glass-Ceramic Seal for Solid Oxide Fuel Cell Technology. J. Adv. Res. Fluid Mech. Therm. Sci. 2021, 82, 39–50. [Google Scholar]
- Tan, C.; Han, M.; Li, H.; Song, W.; Xia, Y. Investigation of the Glass-Ceramic Sealants in SOFC Stacks. ECS Trans. 2021, 103, 1847–1858. [Google Scholar] [CrossRef]
- Berges, C.; Wain, A.; Andújar, R.; Naranjo, J.; Gallego, A.; Nieto, E.; Herranz, G.; Campana, R. Fused filament fabrication for anode supported SOFC development: Towards advanced, scalable and cost-competitive energetic systems. Int. J. Hydrogen Energy 2021, 46, 26174–26184. [Google Scholar] [CrossRef]
- Qu, P.; Xiong, D.; Zhu, Z.; Gong, Z.; Li, Y.; Li, Y.; Fan, L.; Liu, Z.; Wang, P.; Liu, C.; et al. Inkjet printing additively manufactured multilayer SOFCs using high quality ceramic inks for performance enhancement. Addit. Manuf. 2021, 48, 102394. [Google Scholar] [CrossRef]
- Tkachenko, S.; Brodnikovskyi, D.; Cizek, J.; Komarov, P.; Brodnikovskyi, Y.; Tymoshenko, Y.; Chráska, T. Novel Ti–Si–C composites for SOFC interconnect materials: Production optimization. Ceram. Int. 2022, 48, 27785–27798. [Google Scholar] [CrossRef]
- Khanafer, K.; Al-Masri, A.; Vafai, K.; Preethichandra, P. Heat up impact on thermal stresses in SOFC for mobile APU applications: Thermo-structural analysis. Sustain. Energy Technol. Assess. 2022, 52, 102159. [Google Scholar] [CrossRef]
- Li, R.; Tao, M.; Wang, P.; Yang, J.; Ma, B.; Chi, B.; Pu, J. Effect of interconnect pre-oxidation on high-temperature wettability and mechanical properties of glass seals in SOFC. J. Am. Ceram. Soc. 2021, 104, 6172–6182. [Google Scholar] [CrossRef]
- Matveev, D.; Fedotov, Y.; Ivanov, A.; Agarkova, E.; Kharton, V.; Bredikhin, S.I. Optimization of Contact Cathode Composition Based on La0.8Sr0.2MnO3 ± δ for SOFC Stacks. ECS Trans. 2021, 103, 1453. [Google Scholar] [CrossRef]
- Zhang, N.; Kening, S.; Dechang, J.; Derui, Z. Electrochemical properties of La0.8Sr0.2FeO3-δ based composite cathode for intermediate temperature SOFC. Rare Met. 2006, 25, 390–392. [Google Scholar] [CrossRef]
- Santaya, M.; Toscani, L.; Baque, L.; Troiani, H.E.; Mogni, L. Study of phase stability of SrTi0.3Fe0.7O3-δ perovskite in reducing atmosphere: Effect of microstructure. Solid State Ion. 2019, 342, 115064. [Google Scholar] [CrossRef]
- Rodríguez-López, S.; Pascual, M.J. Sintering/Crystallization and Viscosity of Sealing Glass-Ceramics. Crystals 2021, 11, 737. [Google Scholar] [CrossRef]
- Gupta, S.; Verma, M.K.; Sharma, N.D.; Singh, D. Synthesis and characterization of mixed valent Fe containing K2NiF4-type phases. Polyhedron 2017, 122, 79–85. [Google Scholar] [CrossRef]
- Kalaswad, M.; Zhang, B.; Wang, H.; Wang, X.; Huang, J.; Wang, H. Tailorable Fe nanostructures and magnetic anisotropy in (La0.5Sr0.5FeO3) 1-x: Fex thin films integrated on SrTiO3 and silicon substrates. Mater. Today Adv. 2020, 8, 100112. [Google Scholar] [CrossRef]
- Fu, L.; Zhou, J.; Yang, J.; Lian, Z.; Wang, J.; Cheng, Y.; Wu, K. Exsolution of Cu nanoparticles in (LaSr) 0.9 Fe0.9Cu0.1O4 Ruddlesden-Popper oxide as symmetrical electrode for solid oxide cells. Appl. Surf. Sci. 2020, 511, 145525. [Google Scholar] [CrossRef]
- Haag, J.M.; Bierschenk, D.M.; Barnett, S.A.; Poeppelmeier, K.R. Structural, chemical, and electrochemical characteristics of LaSr2Fe2CrO9-δ-based solid oxide fuel cell anodes. Solid State Ion. 2012, 212, 1–5. [Google Scholar] [CrossRef]
- Huang, L.; Li, Q.; Zhang, G.; Zhou, X.; Shao, Z.; Zhou, W.; Cao, J. The preparation of LaSr3Fe3O10− δ and its electrochemical performance. J. Solid State Electrochem. 2017, 21, 1343–1348. [Google Scholar] [CrossRef]
- Yang, Y.; Li, Y.; Jiang, Y.; Zheng, M.; Hong, T.; Wu, X.; Xia, C. The electrochemical performance and CO2 reduction mechanism on strontium doped lanthanum ferrite fuel electrode in solid oxide electrolysis cell. Electrochim. Acta 2018, 284, 159–167. [Google Scholar] [CrossRef]
- Zdorovets, M.V.; Borgekov, D.B.; Zhumatayeva, I.Z.; Kenzhina, I.E.; Kozlovskiy, A.L. Synthesis, Properties and Photocatalytic Activity of CaTiO3-Based Ceramics Doped with Lanthanum. Nanomaterials 2022, 12, 2241. [Google Scholar] [CrossRef] [PubMed]
- Qureshi, N.; Ulbrich, H.; Sidis, Y.; Cousson, A.; Braden, M. Magnetic structure and magnon dispersion in LaSrFeO4. Phys. Rev. B 2013, 87, 054433. [Google Scholar] [CrossRef]
- Borgekov, D.B.; Kozlovskiy, A.L.; Shakirzyanov, R.I.; Zhumazhanova, A.T.; Zdorovets, M.V.; Shlimas, D.I. Properties of Perovskite-like Lanthanum Strontium Ferrite Ceramics with Variation in Lanthanum Concentration. Crystals 2022, 12, 1792. [Google Scholar] [CrossRef]
- Singh, S.; Singh, D. LaSrFeO4 nanopowders synthesized by different combustion methods: Effect of fuel/particle size. Ceram. Int. 2016, 42, 15725–15731. [Google Scholar] [CrossRef]
- Zhou, J.; Chen, Y.; Chen, G.; Wu, K.; Cheng, Y. Evaluation of LaxSr2− xFeO4 layered perovskite as potential electrode materials for symmetrical solid oxide fuel cells. J. Alloy. Compd. 2015, 647, 778–783. [Google Scholar] [CrossRef]
- Striker, T.; Ruud, J.A.; Gao, Y.; Heward, W.J.; Steinbruchel, C. A-site deficiency, phase purity and crystal structure in lanthanum strontium ferrite powders. Solid State Ion. 2007, 178, 1326–1336. [Google Scholar] [CrossRef]
- Thalinger, R.; Gocyla, M.; Heggen, M.; Klötzer, B.; Penner, S. Exsolution of Fe and SrO nanorods and nanoparticles from lanthanum strontium ferrite La0.6Sr0.4FeO3− δ materials by hydrogen reduction. J. Phys. Chem. C 2015, 119, 22050–22056. [Google Scholar] [CrossRef]
- Cao, Z.; Zhang, Y.; Miao, J.; Wang, Z.; Lü, Z.; Sui, Y.; Huang, X.; Jiang, W. Titanium-substituted lanthanum strontium ferrite as a novel electrode material for symmetrical solid oxide fuel cell. Int. J. Hydrogen Energy 2015, 40, 16572–16577. [Google Scholar] [CrossRef]
- Deka, D.J.; Gunduz, S.; Fitzgerald, T.; Miller, J.; Ozkan, A. Production of syngas with controllable H2/CO ratio by high temperature co-electrolysis of CO2 and H2O over Ni and Co-doped lanthanum strontium ferrite perovskite cathodes. Appl. Catal. B Environ. 2019, 248, 487–503. [Google Scholar] [CrossRef]
- Fujihara, S.; Nakata, T.; Kozuka, H.; Yoko, T. The Effects of Substitution of Alkaline Earths or Y for La on Structure and Electrical Properties of LaSrFeO4. J. Solid State Chem. 1995, 115, 456–463. [Google Scholar] [CrossRef]
- Gupta, S.; Verma, M.K.; Singh, D. Effect of A cation size on structural, magnetic and electrical properties of K2NiF4-type oxide LaSrFeO4. Ceram. Int. 2016, 42, 18418–18424. [Google Scholar] [CrossRef]
- Bhowmik, R.N.; Aswathi, M.C. Modified dielectric and ferroelectric properties in the composite of ferrimagnetic Co1.75Fe1.25O4 ferrite and ferroelectric BaTiO3 perovskite in comparison to Co1.75Fe1.25O4 ferrite. Compos. Part B Eng. 2019, 160, 457–470. [Google Scholar] [CrossRef]
- Singh, D.; Singh, S.; Mahajan, A.; Choudhary, N. Effect of substitution of magnetic rare earth Nd at non-magnetic La site on structure and properties of LaSrFeO4. Ceram. Int. 2014, 40, 1183–1188. [Google Scholar] [CrossRef]
- Zhou, Q.; Yuan, C.; Han, D.; Luo, T.; Li, J.; Zhan, Z. Evaluation of LaSr2Fe2CrO9-δ as a potential electrode for symmetrical solid oxide fuel cells. Electrochim. Acta 2014, 133, 453–458. [Google Scholar] [CrossRef]
- Udomsilp, D.; Roehrens, D.; Menzler, N.H.; Opitz, A.K.; Guillon, O.; Bram, M. Novel processing of La0.58Sr0.4Co0.2Fe0.8O3− δ cathodes for metal-supported fuel cells. Mater. Lett. 2017, 192, 173–176. [Google Scholar] [CrossRef]
- Li, J.; Wei, B.; Cao, Z.; Yue, X.; Zhang, Y.; Lü, Z. Niobium Doped Lanthanum Strontium Ferrite as A Redox-Stable and Sulfur-Tolerant Anode for Solid Oxide Fuel Cells. ChemSusChem 2018, 11, 254–263. [Google Scholar] [CrossRef]
- Cai, H.; Zhang, L.; Xu, J.; Huang, J.; Wei, X.; Wang, L.; Long, W. Cobalt–free La0.5Sr0.5Fe0.9Mo0.1O3–δ electrode for symmetrical SOFC running on H2 and CO fuels. Electrochim. Acta 2019, 320, 134642. [Google Scholar] [CrossRef]
- Ju, Y.W.; Lee, S.; Kang, B.S.; Kim, H.H.; Ishihara, T. Phase transition of doped LaFeO3 anode in reducing atmosphere and their power generation property in intermediate temperature solid oxide fuel cell. Int. J. Hydrogen Energy 2019, 44, 29641–29647. [Google Scholar] [CrossRef]
- Wang, J.; Fu, L.; Yang, J.; Wu, K.; Zhou, J.; Wu, K. Cerium and ruthenium co-doped La0.7Sr0.3FeO3–δ as a high-efficiency electrode for symmetrical solid oxide fuel cell. J. Rare Earths 2021, 39, 1095–1099. [Google Scholar] [CrossRef]
Disclaimer/Publisher’s Note: The statements, opinions and data contained in all publications are solely those of the individual author(s) and contributor(s) and not of MDPI and/or the editor(s). MDPI and/or the editor(s) disclaim responsibility for any injury to people or property resulting from any ideas, methods, instructions or products referred to in the content. |
© 2023 by the authors. Licensee MDPI, Basel, Switzerland. This article is an open access article distributed under the terms and conditions of the Creative Commons Attribution (CC BY) license (https://creativecommons.org/licenses/by/4.0/).